A review of the environmental fate and effects of hazardous ...
A review of the environmental fate and effects of hazardous ...
A review of the environmental fate and effects of hazardous ...

Create successful ePaper yourself
Turn your PDF publications into a flip-book with our unique Google optimized e-Paper software.
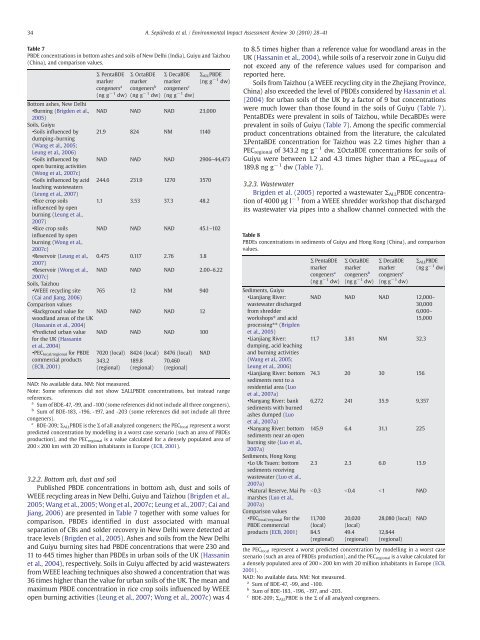
34 A. Sepúlveda et al. / Environmental Impact Assessment Review 30 (2010) 28–41Table 7PBDE concentrations in bottom ashes <strong>and</strong> soils <strong>of</strong> New Delhi (India), Guiyu <strong>and</strong> Taizhou(China), <strong>and</strong> comparison values.Bottom ashes, New Delhi•Burning (Brigden et al.,2005)Soils, Guiyu•Soils influenced bydumping–burning(Wang et al., 2005;Leung et al., 2006)•Soils influenced byopen burning activities(Wong et al., 2007c)•Soils influenced by acidleaching wastewaters(Leung et al., 2007)•Rice crop soilsinfluenced by openburning (Leung et al.,2007)•Rice crop soilsinfluenced by openburning (Wong et al.,2007c)•Reservoir (Leung et al.,2007)•Reservoir (Wong et al.,2007c)Soils, Taizhou•WEEE recycling site(Cai <strong>and</strong> Jiang, 2006)Comparison values•Background value forwoodl<strong>and</strong> areas <strong>of</strong> <strong>the</strong> UK(Hassanin et al., 2004)•Predicted urban valuefor <strong>the</strong> UK (Hassaninet al., 2004)•PEC local/regional for PBDEcommercial products(ECB, 2001)Σ PentaBDEmarkercongeners a(ng g − 1 dw)Σ OctaBDEmarkercongeners b(ng g − 1 dw)Σ DecaBDEmarkercongeners c(ng g − 1 dw)Σ ALL PBDE(ng g − 1 dw)NAD NAD NAD 23,00021.9 824 NM 1140NAD NAD NAD 2906–44,473244.6 231.9 1270 35701.1 3.53 37.3 48.2NAD NAD NAD 45.1–1020.475 0.117 2.76 3.8NAD NAD NAD 2.00–6.22765 12 NM 940NAD NAD NAD 12NAD NAD NAD 1007020 (local) 8424 (local) 8476 (local) NAD343.2(regional)189.8(regional)70,460(regional)NAD: No available data. NM: Not measured.Note: Some references did not show ΣALLPBDE concentrations, but instead rangereferences.a Sum <strong>of</strong> BDE-47, -99, <strong>and</strong> -100 (some references did not include all three congeners).b Sum <strong>of</strong> BDE-183, -196, -197, <strong>and</strong> -203 (some references did not include all threecongeners).c BDE-209; Σ ALL PBDE is <strong>the</strong> Σ <strong>of</strong> all analyzed congeners; <strong>the</strong> PEC local represent a worstpredicted concentration by modelling in a worst case scenario (such an area <strong>of</strong> PBDEsproduction), <strong>and</strong> <strong>the</strong> PEC regional is a value calculated for a densely populated area <strong>of</strong>200×200 km with 20 million inhabitants in Europe (ECB, 2001).3.2.2. Bottom ash, dust <strong>and</strong> soilPublished PBDE concentrations in bottom ash, dust <strong>and</strong> soils <strong>of</strong>WEEE recycling areas in New Delhi, Guiyu <strong>and</strong> Taizhou (Brigden et al.,2005; Wang et al., 2005; Wong et al., 2007c; Leung et al., 2007; Cai <strong>and</strong>Jiang, 2006) are presented in Table 7 toge<strong>the</strong>r with some values forcomparison. PBDEs identified in dust associated with manualseparation <strong>of</strong> CBs <strong>and</strong> solder recovery in New Delhi were detected attrace levels (Brigden et al., 2005). Ashes <strong>and</strong> soils from <strong>the</strong> New Delhi<strong>and</strong> Guiyu burning sites had PBDE concentrations that were 230 <strong>and</strong>11 to 445 times higher than PBDEs in urban soils <strong>of</strong> <strong>the</strong> UK (Hassaninet al., 2004), respectively. Soils in Guiyu affected by acid wastewatersfrom WEEE leaching techniques also showed a concentration that was36 times higher than <strong>the</strong> value for urban soils <strong>of</strong> <strong>the</strong> UK. The mean <strong>and</strong>maximum PBDE concentration in rice crop soils influenced by WEEEopen burning activities (Leung et al., 2007; Wong et al., 2007c) was 4to 8.5 times higher than a reference value for woodl<strong>and</strong> areas in <strong>the</strong>UK (Hassanin et al., 2004), while soils <strong>of</strong> a reservoir zone in Guiyu didnot exceed any <strong>of</strong> <strong>the</strong> reference values used for comparison <strong>and</strong>reported here.Soils from Taizhou (a WEEE recycling city in <strong>the</strong> Zhejiang Province,China) also exceeded <strong>the</strong> level <strong>of</strong> PBDEs considered by Hassanin et al.(2004) for urban soils <strong>of</strong> <strong>the</strong> UK by a factor <strong>of</strong> 9 but concentrationswere much lower than those found in <strong>the</strong> soils <strong>of</strong> Guiyu (Table 7).PentaBDEs were prevalent in soils <strong>of</strong> Taizhou, while DecaBDEs wereprevalent in soils <strong>of</strong> Guiyu (Table 7). Among <strong>the</strong> specific commercialproduct concentrations obtained from <strong>the</strong> literature, <strong>the</strong> calculatedΣPentaBDE concentration for Taizhou was 2.2 times higher than aPEC regional <strong>of</strong> 343.2 ng g − 1 dw. ΣOctaBDE concentrations for soils <strong>of</strong>Guiyu were between 1.2 <strong>and</strong> 4.3 times higher than a PEC regional <strong>of</strong>189.8 ng g − 1 dw (Table 7).3.2.3. WastewaterBrigden et al. (2005) reported a wastewater Σ ALL PBDE concentration<strong>of</strong> 4000 μg l − 1 from a WEEE shredder workshop that dischargedits wastewater via pipes into a shallow channel connected with <strong>the</strong>Table 8PBDEs concentrations in sediments <strong>of</strong> Guiyu <strong>and</strong> Hong Kong (China), <strong>and</strong> comparisonvalues.Sediments, Guiyu•Lianjiang River:wastewater dischargedfrom shredderworkshops⁎ <strong>and</strong> acidprocessing⁎⁎ (Brigdenet al., 2005)•Lianjiang River:dumping, acid leaching<strong>and</strong> burning activities(Wang et al., 2005;Leung et al., 2006)•Lianjiang River: bottomsediments next to aresidential area (Luoet al., 2007a)•Nanyang River: banksediments with burnedashes dumped (Luoet al., 2007a)•Nanyang River: bottomsediments near an openburning site (Luo et al.,2007a)Sediments, Hong Kong•Lo Uk Tsuen: bottomsediments receivingwastewater (Luo et al.,2007a)•Natural Reserve, Mai Pomarshes (Luo et al.,2007a)Comparison values•PEC local/regional for <strong>the</strong>PBDE commercialproducts (ECB, 2001)Σ PentaBDEmarkercongeners a(ng g −1 dw)Σ OctaBDEmarkercongeners b(ng g −1 dw)Σ DecaBDEmarkercongeners c(ng g −1 dw)Σ ALL PBDE(ng g −1 dw)NAD NAD NAD 12,000–30,0006,000–15,00011.7 3.81 NM 32.374.3 20 30 1566,272 241 35.9 9,357145.9 6.4 31.1 2252.3 2.3 6.0 13.9b0.3 b0.4 b1 NAD11,700(local)84.5(regional)20,020(local)49.4(regional)28,080 (local) NAD12,844(regional)<strong>the</strong> PEC local represent a worst predicted concentration by modelling in a worst casescenario (such an area <strong>of</strong> PBDEs production), <strong>and</strong> <strong>the</strong> PEC regional is a value calculated fora densely populated area <strong>of</strong> 200×200 km with 20 million inhabitants in Europe (ECB,2001).NAD: No available data. NM: Not measured.a Sum <strong>of</strong> BDE-47, -99, <strong>and</strong> -100.b Sum <strong>of</strong> BDE-183, -196, -197, <strong>and</strong> -203.c BDE-209; Σ ALL PBDE is <strong>the</strong> Σ <strong>of</strong> all analyzed congeners.