QR financial report 2008/09 - Queensland Rail
QR financial report 2008/09 - Queensland Rail
QR financial report 2008/09 - Queensland Rail

Create successful ePaper yourself
Turn your PDF publications into a flip-book with our unique Google optimized e-Paper software.
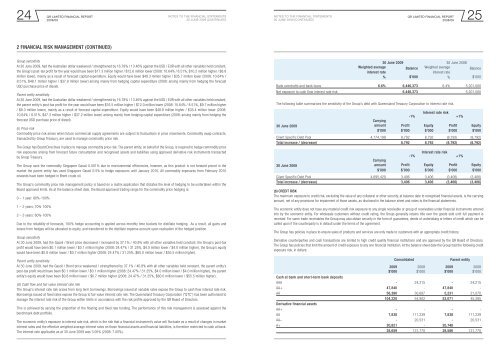
<strong>QR</strong> LIMITED Financial REPORTNotes to the <strong>financial</strong> statementsNotes to the <strong>financial</strong> statements<strong>QR</strong> LIMITED Financial REPORT24 25<strong>2008</strong>/<strong>09</strong>30 June 20<strong>09</strong> (continued)30 June 20<strong>09</strong> (continued)<strong>2008</strong>/<strong>09</strong>2 Financial risk management (Continued)Group sensitivityAt 30 June 20<strong>09</strong>, had the Australian dollar weakened / strengthened by 16.78% / 13.46% against the USD / EUR with all other variables held constant,the Group’s post-tax profit for the year would have been $17.3 million higher / $12.6 million lower (<strong>2008</strong>: 10.64% / 8.51%, $10.2 million higher / $8.8million lower), mainly as a result of forecast capital expenditure. Equity would have been $49.3 million higher / $35.7 million lower (<strong>2008</strong>: 10.64% /8.51%, $48.1 million higher / $37.9 million lower) arising mainly from hedging capital expenditure (<strong>2008</strong>: arising mainly from hedging the forecastUSD purchase price of diesel).Parent entity sensitivityAt 30 June 20<strong>09</strong>, had the Australian dollar weakened / strengthened by 16.78% / 13.46% against the USD / EUR with all other variables held constant,the parent entity’s post-tax profit for the year would have been $16.5 million higher / $12.0 million lower (<strong>2008</strong>: 10.64% / 8.51%, $9.7 million higher/ $8.3 million lower), mainly as a result of forecast capital expenditure. Equity would have been $48.8 million higher / $35.4 million lower (<strong>2008</strong>:10.64% / 8.51%, $47.3 million higher / $37.2 million lower) arising mainly from hedging capital expenditure (<strong>2008</strong>: arising mainly from hedging theforecast USD purchase price of diesel).(ii) Price riskCommodity price risk arises when future commercial supply agreements are subject to fluctuations in price movements. Commodity swap contracts,transacted by Group Treasury, are used to manage commodity price risk.The Group has Board Directives in place to manage commodity price risk. The parent entity, on behalf of the Group, is required to hedge commodity pricerisk exposures arising from forecast future consumption and recognised assets and liabilities using approved derivative risk instruments transactedby Group Treasury.The Group uses the commodity Singapore Gasoil 0.001% due to environmental efficiencies, however, as this product is not forward priced in themarket the parent entity has used Singapore Gasoil 0.5% to hedge exposures until January 2010. All commodity exposures from February 2010onwards have been hedged in Brent crude oil.The Group’s commodity price risk management policy is based on a matrix application that dictates the level of hedging to be undertaken within theBoard approved limits. As at the balance sheet date, the Board approved trading range for the commodity price hedging is:0 – 1 year: 80%-100%1 – 2 years: 70%-100%2 – 3 years: 60%-100%Due to the reliability of forecasts, 100% hedge accounting is applied across monthly time buckets for distillate hedging. As a result, all gains andlosses from hedges will be allocated to equity, and transferred to the distillate expense account upon realisation of the hedged position.Group sensitivityAt 30 June 20<strong>09</strong>, had the Gasoil / Brent price decreased / increased by 37.1% / 40.8% with all other variables held constant, the Group’s post-taxprofit would have been $0.1 million lower / $0.1 million higher (<strong>2008</strong>: 24.47% / 31.25%, $4.0 million lower / $4.0 million higher), the Group’s equitywould have been $0.8 million lower / $0.7 million higher (<strong>2008</strong>: 24.47% / 31.25%, $60.0 million lower / $55.5 million higher).Parent entity sensitivityAt 30 June 20<strong>09</strong>, had the Gasoil / Brent price weakened / strengthened by 37.1% / 40.8% with all other variables held constant, the parent entity’spost-tax profit would have been $0.1 million lower / $0.1 million higher (<strong>2008</strong>: 24.47% / 31.25%, $4.0 million lower / $4.0 million higher), the parententity’s equity would have been $0.8 million lower / $0.7 million higher (<strong>2008</strong>: 24.47% / 31.25%, $60.0 million lower / $55.5 million higher).(iii) Cash flow and fair value interest rate riskThe Group’s interest rate risk arises from long term borrowings. Borrowings issued at variable rates expose the Group to cash flow interest rate risk.Borrowings issued at fixed rates expose the Group to fair value interest rate risk. The <strong>Queensland</strong> Treasury Corporation (“QTC”) has been authorised tomanage the interest rate risk of the Group within limits in accordance with the risk profile approved by the <strong>QR</strong> Board of Directors.This is achieved by varying the proportion of the floating and fixed rate funding. The performance of this risk management is assessed against thebenchmark debt portfolio.The economic entity’s exposure to interest rate risk, which is the risk that a <strong>financial</strong> instrument’s value will fluctuate as a result of changes in marketinterest rates and the effective weighted average interest rates on those <strong>financial</strong> assets and <strong>financial</strong> liabilities, is therefore restricted to cash at bank.The interest rate applicable as at 30 June 20<strong>09</strong> was 3.00% (<strong>2008</strong>: 7.00%).30 June 20<strong>09</strong>Interest rate risk-1% +1%Carryingamount Profit Equity Profit Equity$’000 $’000 $’000 $’000 $’000Client Specific Debt Pool 4,774,199 8,792 8,792 (8,792) (8,792)Total increase / (decrease) 8,792 8,792 (8,792) (8,792)30 June <strong>2008</strong>30 June 20<strong>09</strong> 30 June <strong>2008</strong>Weighted averageBalance Weighted averageBalanceinterest rate%$’000interest rate%$’000Bank overdrafts and bank loans 6.6% 6,446,373 6.4% 5,201,000Net exposure to cash flow interest rate risk 6,446,373 5,201,000The following table summarises the sensitivity of the Group’s debt with <strong>Queensland</strong> Treasury Corporation to interest rate risk.Interest rate risk-1% +1%Carryingamount Profit Equity Profit Equity$’000 $’000 $’000 $’000 $’000Client Specific Debt Pool 4,695,420 3,406 3,406 (3,406) (3,406)Total increase / (decrease) 3,406 3,406 (3,406) (3,406)(b) Credit riskThe maximum exposure to credit risk, excluding the value of any collateral or other security, at balance date to recognised <strong>financial</strong> assets, is the carryingamount, net of any provisions for impairment of those assets, as disclosed in the balance sheet and notes to the <strong>financial</strong> statements.The economic entity does not have any material credit risk exposure to any single receivable or group of receivables under <strong>financial</strong> instruments enteredinto by the economic entity. For wholesale customers without credit rating, the Group generally retains title over the goods sold until full payment isreceived. For some trade receivables the Group may also obtain security in the form of guarantees, deeds of undertaking or letters of credit which can becalled upon if the counterparty is in default under the terms of the agreement.The Group has policies in place to ensure sales of products and services are only made to customers with an appropriate credit history.Derivative counterparties and cash transactions are limited to high credit quality <strong>financial</strong> institutions and are approved by the <strong>QR</strong> Board of Directors.The Group has policies that limit the amount of credit exposure to any one <strong>financial</strong> institution. At the balance sheet date the Group had the following creditexposure risk, in dollars:20<strong>09</strong>$’000Consolidated<strong>2008</strong>$’00020<strong>09</strong>$’000Parent entityCash at bank and short-term bank depositsAAA - 24,215 - 24,215AA+ 47,840 - 47,840 -AA 56,380 30,687 5,231 21,070104,220 54,902 53,071 45,285Derivative <strong>financial</strong> assetsAA+ - - - -AA 7,838 111,239 7,838 111,239AA– - 20,531 - 20,531A+ 20,821 - 20,748 -28,659 131,770 28,586 131,770<strong>2008</strong>$’000