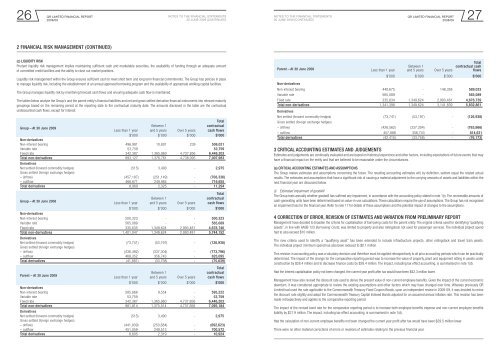
<strong>QR</strong> LIMITED Financial REPORTNotes to the <strong>financial</strong> statementsNotes to the <strong>financial</strong> statements<strong>QR</strong> LIMITED Financial REPORT24 25<strong>2008</strong>/<strong>09</strong>30 June 20<strong>09</strong> (continued)30 June 20<strong>09</strong> (continued)<strong>2008</strong>/<strong>09</strong>2 Financial risk management (Continued)Group sensitivityAt 30 June 20<strong>09</strong>, had the Australian dollar weakened / strengthened by 16.78% / 13.46% against the USD / EUR with all other variables held constant,the Group’s post-tax profit for the year would have been $17.3 million higher / $12.6 million lower (<strong>2008</strong>: 10.64% / 8.51%, $10.2 million higher / $8.8million lower), mainly as a result of forecast capital expenditure. Equity would have been $49.3 million higher / $35.7 million lower (<strong>2008</strong>: 10.64% /8.51%, $48.1 million higher / $37.9 million lower) arising mainly from hedging capital expenditure (<strong>2008</strong>: arising mainly from hedging the forecastUSD purchase price of diesel).Parent entity sensitivityAt 30 June 20<strong>09</strong>, had the Australian dollar weakened / strengthened by 16.78% / 13.46% against the USD / EUR with all other variables held constant,the parent entity’s post-tax profit for the year would have been $16.5 million higher / $12.0 million lower (<strong>2008</strong>: 10.64% / 8.51%, $9.7 million higher/ $8.3 million lower), mainly as a result of forecast capital expenditure. Equity would have been $48.8 million higher / $35.4 million lower (<strong>2008</strong>:10.64% / 8.51%, $47.3 million higher / $37.2 million lower) arising mainly from hedging capital expenditure (<strong>2008</strong>: arising mainly from hedging theforecast USD purchase price of diesel).(ii) Price riskCommodity price risk arises when future commercial supply agreements are subject to fluctuations in price movements. Commodity swap contracts,transacted by Group Treasury, are used to manage commodity price risk.The Group has Board Directives in place to manage commodity price risk. The parent entity, on behalf of the Group, is required to hedge commodity pricerisk exposures arising from forecast future consumption and recognised assets and liabilities using approved derivative risk instruments transactedby Group Treasury.The Group uses the commodity Singapore Gasoil 0.001% due to environmental efficiencies, however, as this product is not forward priced in themarket the parent entity has used Singapore Gasoil 0.5% to hedge exposures until January 2010. All commodity exposures from February 2010onwards have been hedged in Brent crude oil.The Group’s commodity price risk management policy is based on a matrix application that dictates the level of hedging to be undertaken within theBoard approved limits. As at the balance sheet date, the Board approved trading range for the commodity price hedging is:0 – 1 year: 80%-100%1 – 2 years: 70%-100%2 – 3 years: 60%-100%Due to the reliability of forecasts, 100% hedge accounting is applied across monthly time buckets for distillate hedging. As a result, all gains andlosses from hedges will be allocated to equity, and transferred to the distillate expense account upon realisation of the hedged position.Group sensitivityAt 30 June 20<strong>09</strong>, had the Gasoil / Brent price decreased / increased by 37.1% / 40.8% with all other variables held constant, the Group’s post-taxprofit would have been $0.1 million lower / $0.1 million higher (<strong>2008</strong>: 24.47% / 31.25%, $4.0 million lower / $4.0 million higher), the Group’s equitywould have been $0.8 million lower / $0.7 million higher (<strong>2008</strong>: 24.47% / 31.25%, $60.0 million lower / $55.5 million higher).Parent entity sensitivityAt 30 June 20<strong>09</strong>, had the Gasoil / Brent price weakened / strengthened by 37.1% / 40.8% with all other variables held constant, the parent entity’spost-tax profit would have been $0.1 million lower / $0.1 million higher (<strong>2008</strong>: 24.47% / 31.25%, $4.0 million lower / $4.0 million higher), the parententity’s equity would have been $0.8 million lower / $0.7 million higher (<strong>2008</strong>: 24.47% / 31.25%, $60.0 million lower / $55.5 million higher).(iii) Cash flow and fair value interest rate riskThe Group’s interest rate risk arises from long term borrowings. Borrowings issued at variable rates expose the Group to cash flow interest rate risk.Borrowings issued at fixed rates expose the Group to fair value interest rate risk. The <strong>Queensland</strong> Treasury Corporation (“QTC”) has been authorised tomanage the interest rate risk of the Group within limits in accordance with the risk profile approved by the <strong>QR</strong> Board of Directors.This is achieved by varying the proportion of the floating and fixed rate funding. The performance of this risk management is assessed against thebenchmark debt portfolio.The economic entity’s exposure to interest rate risk, which is the risk that a <strong>financial</strong> instrument’s value will fluctuate as a result of changes in marketinterest rates and the effective weighted average interest rates on those <strong>financial</strong> assets and <strong>financial</strong> liabilities, is therefore restricted to cash at bank.The interest rate applicable as at 30 June 20<strong>09</strong> was 3.00% (<strong>2008</strong>: 7.00%).30 June 20<strong>09</strong>Interest rate risk-1% +1%Carryingamount Profit Equity Profit Equity$’000 $’000 $’000 $’000 $’000Client Specific Debt Pool 4,774,199 8,792 8,792 (8,792) (8,792)Total increase / (decrease) 8,792 8,792 (8,792) (8,792)30 June <strong>2008</strong>30 June 20<strong>09</strong> 30 June <strong>2008</strong>Weighted averageBalance Weighted averageBalanceinterest rate%$’000interest rate%$’000Bank overdrafts and bank loans 6.6% 6,446,373 6.4% 5,201,000Net exposure to cash flow interest rate risk 6,446,373 5,201,000The following table summarises the sensitivity of the Group’s debt with <strong>Queensland</strong> Treasury Corporation to interest rate risk.Interest rate risk-1% +1%Carryingamount Profit Equity Profit Equity$’000 $’000 $’000 $’000 $’000Client Specific Debt Pool 4,695,420 3,406 3,406 (3,406) (3,406)Total increase / (decrease) 3,406 3,406 (3,406) (3,406)(b) Credit riskThe maximum exposure to credit risk, excluding the value of any collateral or other security, at balance date to recognised <strong>financial</strong> assets, is the carryingamount, net of any provisions for impairment of those assets, as disclosed in the balance sheet and notes to the <strong>financial</strong> statements.The economic entity does not have any material credit risk exposure to any single receivable or group of receivables under <strong>financial</strong> instruments enteredinto by the economic entity. For wholesale customers without credit rating, the Group generally retains title over the goods sold until full payment isreceived. For some trade receivables the Group may also obtain security in the form of guarantees, deeds of undertaking or letters of credit which can becalled upon if the counterparty is in default under the terms of the agreement.The Group has policies in place to ensure sales of products and services are only made to customers with an appropriate credit history.Derivative counterparties and cash transactions are limited to high credit quality <strong>financial</strong> institutions and are approved by the <strong>QR</strong> Board of Directors.The Group has policies that limit the amount of credit exposure to any one <strong>financial</strong> institution. At the balance sheet date the Group had the following creditexposure risk, in dollars:20<strong>09</strong>$’000Consolidated<strong>2008</strong>$’00020<strong>09</strong>$’000Parent entityCash at bank and short-term bank depositsAAA - 24,215 - 24,215AA+ 47,840 - 47,840 -AA 56,380 30,687 5,231 21,070104,220 54,902 53,071 45,285Derivative <strong>financial</strong> assetsAA+ - - - -AA 7,838 111,239 7,838 111,239AA– - 20,531 - 20,531A+ 20,821 - 20,748 -28,659 131,770 28,586 131,770<strong>2008</strong>$’000
<strong>QR</strong> LIMITED Financial REPORTNotes to the <strong>financial</strong> statementsNotes to the <strong>financial</strong> statements<strong>QR</strong> LIMITED Financial REPORT26 27<strong>2008</strong>/<strong>09</strong>30 June 20<strong>09</strong> (continued)30 June 20<strong>09</strong> (continued)<strong>2008</strong>/<strong>09</strong>2 Financial risk management (Continued)(c) Liquidity riskPrudent liquidity risk management implies maintaining sufficient cash and marketable securities, the availability of funding through an adequate amountof committed credit facilities and the ability to close out market positions.Liquidity risk management within the Group ensures sufficient cash to meet short term and long term <strong>financial</strong> commitments. The Group has policies in placeto manage liquidity risk, including the establishment of an annual approved borrowing program and the availability of appropriate working capital facilities.The Group manages liquidity risk by monitoring forecast cash flows and ensuring adequate cash flow is maintained.The tables below analyse the Group’s and the parent entity’s <strong>financial</strong> liabilities and net and gross settled derivative <strong>financial</strong> instruments into relevant maturitygroupings based on the remaining period at the <strong>report</strong>ing date to the contractual maturity date. The amounts disclosed in the table are the contractualundiscounted cash flows, except for interest.TotalGroup – At 30 June 20<strong>09</strong>Between 1contractualLess than 1 year and 5 years Over 5 years cash flows$’000 $’000 $’000 $’000Non-derivativesNon-interest bearing 496,981 10,801 239 508,021Variable rate 53,759 - - 53,759Fixed rate 342,387 1,365,960 4,737,856 6,446,203Total non-derivatives 893,127 1,376,761 4,738,<strong>09</strong>5 7,007,983DerivativesNet settled (forward commodity hedges) (515) 3,490 - 2,975Gross settled (foreign exchange hedges)– (inflow) (457,187) (251,149) - (708,336)– outflow 466,671 249,984 - 716,655Total derivatives 8,969 2,325 - 11,294Group – At 30 June <strong>2008</strong>Less than 1 yearBetween 1and 5 yearsOver 5 yearsTotalcontractualcash flows$’000 $’000 $’000 $’000Non-derivativesNon-interest bearing 500,323 - - 500,323Variable rate 565,089 - - 565,089Fixed rate 335,635 1,349,624 2,993,481 4,678,740Total non-derivatives 1,401,047 1,349,624 2,993,481 5,744,152DerivativesNet settled (forward commodity hedges) (73,741) (53,197) - (126,938)Gross settled (foreign exchange hedges)– (inflow) (436,492) (337,304) - (773,796)– outflow 468,352 356,743 - 825,<strong>09</strong>5Total derivatives (41,881) (33,758) - (75,639)Parent – At 30 June 20<strong>09</strong>Less than 1 yearBetween 1and 5 yearsOver 5 yearsTotalcontractualcash flows$’000 $’000 $’000 $’000Non-derivativesNon-interest bearing 585,668 9,554 - 595,222Variable rate 53,759 - - 53,759Fixed rate 342,387 1,365,960 4,737,856 6,446,203Total non-derivatives 981,814 1,375,514 4,737,856 7,<strong>09</strong>5,184DerivativesNet settled (forward commodity hedges) (515) 3,490 - 2,975Gross settled (foreign exchange hedges)– (inflow) (441,939) (250,684) - (692,623)– outflow 451,059 249,513 - 700,572Total derivatives 8,605 2,319 - 10,924Parent – At 30 June <strong>2008</strong>Non-derivativesLess than 1 yearBetween 1and 5 yearsOver 5 yearsTotalcontractual cashflows$’000 $’000 $’000 $’000Non-interest bearing 440,675 - 148,358 589,033Variable rate 565,089 - - 565,089Fixed rate 335,634 1,349,624 2,993,481 4,678,739Total non-derivatives 1,341,398 1,349,624 3,141,839 5,832,861DerivativesNet settled (forward commodity hedges) (73,741) (53,197) - (126,938)Gross settled (foreign exchange hedges)– (inflow) (426,562) (337,304) - (763,866)– outflow 457,888 356,743 - 814,631Total derivatives (42,415) (33,758) - (76,173)3 Critical accounting estimates and judgementsEstimates and judgements are continually evaluated and are based on historical experience and other factors, including expectations of future events that mayhave a <strong>financial</strong> impact on the entity and that are believed to be reasonable under the circumstances.(a) Critical accounting estimates and assumptionsThe Group makes estimates and assumptions concerning the future. The resulting accounting estimates will, by definition, seldom equal the related actualresults. The estimates and assumptions that have a significant risk of causing a material adjustment to the carrying amounts of assets and liabilities within thenext <strong>financial</strong> year are discussed below.(i) Estimated impairment of goodwillThe Group tests annually whether goodwill has suffered any impairment, in accordance with the accounting policy stated in note 1(r). The recoverable amounts ofcash-generating units have been determined based on value-in-use calculations. These calculations require the use of assumptions. The Group has not recognisedan impairment loss for the <strong>financial</strong> year. Refer to note 17 for details of these assumptions and the potential impact of changes to the assumptions.4 Correction of error, revision of estimates and variation from preliminary <strong>report</strong>Management have decided to broaden the criteria for capitalisation of borrowing costs for the parent entity. The original criteria used for identifying “qualifyingassets”, in line with AASB 123 Borrowing Costs, was limited to property and also rollingstock not used for passenger services. The individual project spendhad to also exceed $10 million.The new criteria used to identify a “qualifying asset” has been extended to include infrastructure projects, other rollingstock and travel train assets.The individual project minimum spend has also been reduced to $0.1 million.This revision in accounting policy was a voluntary decision and therefore must be applied retrospectively to all prior accounting periods which can be practicallydetermined. The impact of the change for the comparative <strong>report</strong>ing period was to increase the value of property, plant and equipment sitting in assets underconstruction by $28.4 million and to decrease finance costs by $28.4 million. The impact, including tax effect accounting, is summarised in note 1(d).Had the interest capitalisation policy not been changed, the current year profit after tax would have been $42.3 million lower.Management have also revised the discount rate used to derive the present value of non-current employee benefits. Given the impact of the current economicdownturn, it was considered appropriate to review the existing assumptions and other factors which may have changed over time. Whereas previously <strong>QR</strong>Limited had used the rate applicable to the Commonwealth Treasury Fixed Coupon Bonds, upon an independent review in <strong>2008</strong>-<strong>09</strong>, it was decided to revisethe discount rate slightly and adopt the Commonwealth Treasury Capital Indexed Bonds adjusted for an assumed annual inflation rate. This revision has beenmade retrospectively and applies to the comparative <strong>report</strong>ing period.The impact of the revised bond rate for the comparative <strong>report</strong>ing period is to increase both employee benefits expense and non-current employee benefitsliability by $21.9 million. The impact, including tax effect accounting, is summarised in note 1(d).Had the calculation of non-current employee benefits not been changed the current year profit after tax would have been $29.5 million lower.There were no other material corrections of errors or revisions of estimates relating to the previous <strong>financial</strong> year.