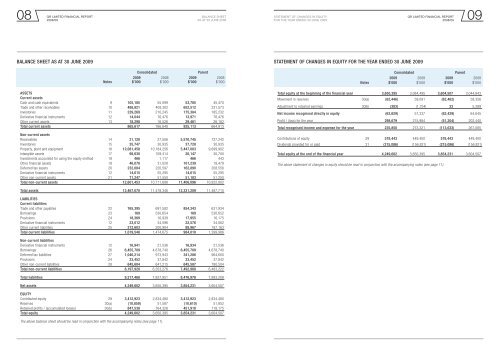
<strong>QR</strong> LIMITED Financial REPORTBalance SheetStatement of Changes in Equity<strong>QR</strong> LIMITED Financial REPORT08 <strong>09</strong><strong>2008</strong>/<strong>09</strong>As at 30 June 20<strong>09</strong>For the year ended 30 June 20<strong>09</strong><strong>2008</strong>/<strong>09</strong>Balance Sheet As at 30 June 20<strong>09</strong>Statement of Changes in Equity For the year ended 30 June 20<strong>09</strong>ConsolidatedParent20<strong>09</strong> <strong>2008</strong> 20<strong>09</strong> <strong>2008</strong>Notes $’000 $’000 $’000 $’000ASSETSCurrent assetsCash and cash equivalents 9 105,185 55,<strong>09</strong>9 53,785 45,470Trade and other receivables 10 488,821 408,302 652,512 331,573Inventories 11 239,269 210,245 175,384 185,232Derivative <strong>financial</strong> instruments 12 14,044 76,476 13,971 76,476Other current assets 13 18,298 16,526 29,461 26,162Total current assets 865,617 766,648 925,113 664,913Non-current assetsReceivables 14 21,128 27,506 5,570,745 727,242Inventories 15 35,747 30,935 37,728 30,935Property, plant and equipment 16 12,081,458 10,184,256 5,447,083 9,699,902Intangible assets 17 98,630 1<strong>09</strong>,414 20,147 30,700Investments accounted for using the equity method 18 466 1,117 466 443Other <strong>financial</strong> assets 19 46,078 31,028 101,239 18,479Deferred tax assets 20 232,084 220,597 162,890 208,556Derivative <strong>financial</strong> instruments 12 14,615 55,295 14,615 55,295Other non-current assets 21 71,247 51,550 51,183 51,250Total non-current assets 12,601,453 10,711,698 11,406,<strong>09</strong>6 10,822,802ConsolidatedParent20<strong>09</strong> <strong>2008</strong> 20<strong>09</strong> <strong>2008</strong>Notes $’000 $’000 $’000 $’000Total equity at the beginning of the <strong>financial</strong> year 3,650,395 3,084,495 3,604,507 3,044,843Movement in reserves 30(a) (62,446) 59,<strong>09</strong>1 (62,462) 59,356Adjustment to retained earnings 30(b) (383) (1,754) 33 5,289Net income recognised directly in equity (62,829) 57,337 (62,429) 64,645Profit / (loss) for the year 298,679 215,984 (51,204) 202,440Total recognised income and expense for the year 235,850 273,321 (113,633) 267,085Contributions of equity 29 578,443 449,400 578,443 449,400Dividends provided for or paid 31 (215,086) (156,821) (215,086) (156,821)Total equity at the end of the <strong>financial</strong> year 4,249,602 3,650,395 3,854,231 3,604,507The above statement of changes in equity should be read in conjunction with the accompanying notes (see page 11).Total assets 13,467,070 11,478,346 12,331,2<strong>09</strong> 11,487,715LIABILITIESCurrent liabilitiesTrade and other payables 22 765,395 691,582 854,343 631,934Borrowings 23 169 530,654 169 530,652Provisions 24 18,369 16,939 17,955 16,175Derivative <strong>financial</strong> instruments 12 23,012 34,596 22,576 34,062Other current liabilities 25 212,603 200,904 88,967 187,163Total current liabilities 1,019,548 1,474,675 984,010 1,399,986Non-current liabilitiesDerivative <strong>financial</strong> instruments 12 16,941 21,536 16,934 21,536Borrowings 26 6,455,7<strong>09</strong> 4,678,740 6,455,7<strong>09</strong> 4,678,740Deferred tax liabilities 27 1,046,214 973,943 341,286 964,600Provisions 24 33,452 37,842 33,452 37,842Other non-current liabilities 28 645,604 641,215 645,587 780,504Total non-current liabilities 8,197,920 6,353,276 7,492,968 6,483,222Total liabilities 9,217,468 7,827,951 8,476,978 7,883,208Net assets 4,249,602 3,650,395 3,854,231 3,604,507EQUITYContributed equity 29 3,412,923 2,834,480 3,412,923 2,834,480Reserves 30(a) (10,859) 51,587 (10,610) 51,852Retained profits / (accumulated losses) 30(b) 847,538 764,328 451,918 718,175Total equity 4,249,602 3,650,395 3,854,231 3,604,507The above balance sheet should be read in conjunction with the accompanying notes (see page 11).
<strong>QR</strong> LIMITED Financial REPORTCash Flow StatementNotes to the <strong>financial</strong> statements<strong>QR</strong> LIMITED Financial REPORT10 11<strong>2008</strong>/<strong>09</strong>For the year ended 30 June 20<strong>09</strong>30 June 20<strong>09</strong><strong>2008</strong>/<strong>09</strong>Cash Flow Statement For the year ended 30 June 20<strong>09</strong>ConsolidatedParent20<strong>09</strong> <strong>2008</strong> 20<strong>09</strong> <strong>2008</strong>Notes $’000 $’000 $’000 $’000Cash flows from operating activitiesReceipts from customers(inclusive of goods and services tax i.e. “GST”) 2,876,407 2,427,414 1,645,192 1,872,227Receipts from Government (inclusive of GST) 1,362,582 1,263,923 281,859 1,263,922Interest received 4,574 874 3,044 573Payments to suppliers and employees (inclusive of GST) (3,051,905) (2,522,469) (1,580,654) (2,003,313)Interest and other cost of finance paid (435,768) (326,272) (406,676) (325,557)Net GST received / (paid) (28,333) (65,440) 27,272 (70,299)Income taxes paid (2,853) (10,529) (2,835) (10,529)Net cash (outflow) / inflow from operating activities 42 724,704 767,501 (32,798) 727,024Cash flows from investing activitiesInvestment to acquire businesses (16,708) (39,936) - -Proceeds from the disposal of assets 86,451 75,500 30,892 77,772Payments made to acquire assets (2,410,362) (1,738,843) (1,560,077) (1,686,438)Investment in subsidiaries - - (82,760) -Loans to related parties - - (12,917) (41,493)Repayment of loans by related parties - - - 680Net cash (outflow) / inflow from investing activities (2,340,619) (1,703,279) (1,624,862) (1,649,479)Cash flows from financing activitiesGeneral borrowings 4,382,154 1,418,869 4,310,492 1,418,869Proceeds from issue of shares 578,443 449,400 578,443 449,400Repayment of borrowings (3,136,781) (775,007) (3,065,119) (775,002)Dividends paid 31 (156,785) (151,493) (156,785) (151,493)Net cash inflow / (outflow) from financing activities 1,667,031 941,769 1,667,031 941,774Net increase / (decrease) in cash and cash equivalents 51,116 5,991 9,371 19,319Cash and cash equivalents at the beginningof the <strong>financial</strong> year 54,040 48,049 44,411 25,<strong>09</strong>2Cash and cash equivalents at end of year 9(a) 105,156 54,040 53,782 44,411The above cash flow statement should be read in conjunction with the accompanying notes (see page 11).1 Summary of significant accounting policiesThe principal accounting policies adopted in the preparation of the <strong>financial</strong> <strong>report</strong> are set out below. These policies have been consistently appliedto all the years presented, unless otherwise stated. The <strong>financial</strong> <strong>report</strong> includes separate <strong>financial</strong> statements for <strong>QR</strong> Limited as an individual entityand the consolidated entity consisting of <strong>QR</strong> Limited and its subsidiaries.<strong>QR</strong> Limited is a corporation owned by the <strong>Queensland</strong> State Government.<strong>QR</strong> Limited is a company limited by shares, incorporated and domiciled in Australia. This <strong>financial</strong> <strong>report</strong> is denominated in Australian dollars.(a) Basis of preparationThis general purpose <strong>financial</strong> <strong>report</strong> has been prepared in accordance with Australian Accounting Standards, other authoritative pronouncements of theAustralian Accounting Standards Board, and the Corporations Act 2001.Compliance with IFRSAustralian Accounting Standards include Australian equivalents to International Financial Reporting Standards (AIFRS). The parent and consolidated<strong>financial</strong> statements and notes of the <strong>QR</strong> Group comply with International Financial Reporting Standards (IFRS).Early adoption of standards<strong>QR</strong> Limited has elected to apply the following pronouncements to the annual <strong>report</strong>ing period beginning 1 July <strong>2008</strong>:• AASB 8 Operating Segments• AASB 2007-3 Amendments to Australian Accounting Standards arising from AASB 8 [AASB 5, AASB 6, AASB 102, AASB 107, AASB 119, AASB 127,AASB 134, AASB 136, AASB 1023 & AASB 1038]• AASB 123 Borrowing costs• AASB 2007-6 Amendments to Australian Accounting Standards arising from AASB 123 [AASB 1, AASB 101, AASB 107, AASB 111, AASB 116 & AASB138 and Interpretations 1 & 12]The implications for <strong>QR</strong> Limited on adopting the above standards are:• The segment Information note has been removed from this <strong>financial</strong> <strong>report</strong>.• The requirement for segment information to be disclosed in other notes in this <strong>financial</strong> <strong>report</strong> has been removed.• <strong>QR</strong> Limited has been capitalising interest on construction of qualifying assets. The early adoption of AASB 123 does not further impact this <strong>financial</strong> <strong>report</strong>.Historical cost conventionThese <strong>financial</strong> statements have been prepared under the historical cost convention, except for certain assets which, as stated, are at fair value.Critical accounting estimatesThe preparation of <strong>financial</strong> statements in conformity with AIFRS requires the use of certain critical accounting estimates. It also requires managementto exercise its judgement in the process of applying the accounting policies. The areas involving a higher degree of judgement or complexity, or areaswhere assumptions and estimates are significant to the <strong>financial</strong> statements, are disclosed in Note 3.(b) Principles of consolidationThe consolidated <strong>financial</strong> statements incorporate the assets and liabilities of all subsidiaries of <strong>QR</strong> Limited (“company’’ or “parent entity’’) as at 30 June 20<strong>09</strong>and the results of all subsidiaries for the year then ended. <strong>QR</strong> Limited and its subsidiaries together are referred to in this <strong>financial</strong> <strong>report</strong> as the (“Group”).Subsidiaries are all those entities (including special purpose entities) over which the Group has the power to govern the <strong>financial</strong> and operatingpolicies so as to obtain benefits from their activities, generally accompanying a shareholding of more than one-half of the voting rights.Subsidiaries are fully consolidated from the date on which control is transferred to the Group.Inter-company transactions, balances and unrealised gains on transactions between Group companies are eliminated. Unrealised losses are alsoeliminated unless the transaction provides evidence of the impairment of the asset transferred. Accounting policies of subsidiaries have beenchanged where necessary to ensure consistency with the policies adopted by the Group.Investments in subsidiaries are accounted for at cost in the individual <strong>financial</strong> statements of the Group.