isoform-like proteins in marine euryhaline milkfish (Chanos
isoform-like proteins in marine euryhaline milkfish (Chanos
isoform-like proteins in marine euryhaline milkfish (Chanos

You also want an ePaper? Increase the reach of your titles
YUMPU automatically turns print PDFs into web optimized ePapers that Google loves.
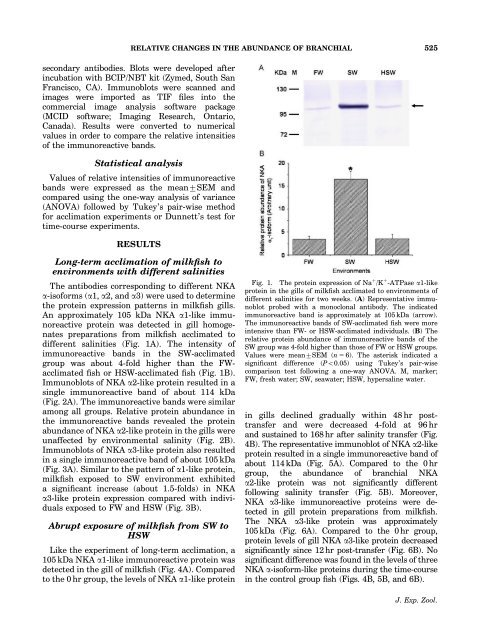
RELATIVE CHANGES IN THE ABUNDANCE OF BRANCHIAL 525secondary antibodies. Blots were developed after<strong>in</strong>cubation with BCIP/NBT kit (Zymed, South SanFrancisco, CA). Immunoblots were scanned andimages were imported as TIF files <strong>in</strong>to thecommercial image analysis software package(MCID software; Imag<strong>in</strong>g Research, Ontario,Canada). Results were converted to numericalvalues <strong>in</strong> order to compare the relative <strong>in</strong>tensitiesof the immunoreactive bands.Statistical analysisValues of relative <strong>in</strong>tensities of immunoreactivebands were expressed as the mean7SEM andcompared us<strong>in</strong>g the one-way analysis of variance(ANOVA) followed by Tukey’s pair-wise methodfor acclimation experiments or Dunnett’s test fortime-course experiments.RESULTSLong-term acclimation of <strong>milkfish</strong> toenvironments with different sal<strong>in</strong>itiesThe antibodies correspond<strong>in</strong>g to different NKAa-<strong>isoform</strong>s (a1, a2, and a3) were used to determ<strong>in</strong>ethe prote<strong>in</strong> expression patterns <strong>in</strong> <strong>milkfish</strong> gills.An approximately 105 kDa NKA a1-<strong>like</strong> immunoreactiveprote<strong>in</strong> was detected <strong>in</strong> gill homogenatespreparations from <strong>milkfish</strong> acclimated todifferent sal<strong>in</strong>ities (Fig. 1A). The <strong>in</strong>tensity ofimmunoreactive bands <strong>in</strong> the SW-acclimatedgroup was about 4-fold higher than the FWacclimatedfish or HSW-acclimated fish (Fig. 1B).Immunoblots of NKA a2-<strong>like</strong> prote<strong>in</strong> resulted <strong>in</strong> as<strong>in</strong>gle immunoreactive band of about 114 kDa(Fig. 2A). The immunoreactive bands were similaramong all groups. Relative prote<strong>in</strong> abundance <strong>in</strong>the immunoreactive bands revealed the prote<strong>in</strong>abundance of NKA a2-<strong>like</strong> prote<strong>in</strong> <strong>in</strong> the gills wereunaffected by environmental sal<strong>in</strong>ity (Fig. 2B).Immunoblots of NKA a3-<strong>like</strong> prote<strong>in</strong> also resulted<strong>in</strong> a s<strong>in</strong>gle immunoreactive band of about 105 kDa(Fig. 3A). Similar to the pattern of a1-<strong>like</strong> prote<strong>in</strong>,<strong>milkfish</strong> exposed to SW environment exhibiteda significant <strong>in</strong>crease (about 1.5-folds) <strong>in</strong> NKAa3-<strong>like</strong> prote<strong>in</strong> expression compared with <strong>in</strong>dividualsexposed to FW and HSW (Fig. 3B).Abrupt exposure of <strong>milkfish</strong> from SW toHSWLike the experiment of long-term acclimation, a105 kDa NKA a1-<strong>like</strong> immunoreactive prote<strong>in</strong> wasdetected <strong>in</strong> the gill of <strong>milkfish</strong> (Fig. 4A). Comparedto the 0 hr group, the levels of NKA a1-<strong>like</strong> prote<strong>in</strong>Fig. 1. The prote<strong>in</strong> expression of Na 1 /K 1 -ATPase a1-<strong>like</strong>prote<strong>in</strong> <strong>in</strong> the gills of <strong>milkfish</strong> acclimated to environments ofdifferent sal<strong>in</strong>ities for two weeks. (A) Representative immunoblotprobed with a monoclonal antibody. The <strong>in</strong>dicatedimmunoreactive band is approximately at 105 kDa (arrow).The immunoreactive bands of SW-acclimated fish were more<strong>in</strong>tensive than FW- or HSW-acclimated <strong>in</strong>dividuals. (B) Therelative prote<strong>in</strong> abundance of immunoreactive bands of theSW group was 4-fold higher than those of FW or HSW groups.Values were mean7SEM (n 5 6). The asterisk <strong>in</strong>dicated asignificant difference (Po0.05) us<strong>in</strong>g Tukey’s pair-wisecomparison test follow<strong>in</strong>g a one-way ANOVA. M, marker;FW, fresh water; SW, seawater; HSW, hypersal<strong>in</strong>e water.<strong>in</strong> gills decl<strong>in</strong>ed gradually with<strong>in</strong> 48 hr posttransferand were decreased 4-fold at 96 hrand susta<strong>in</strong>ed to 168 hr after sal<strong>in</strong>ity transfer (Fig.4B). The representative immunoblot of NKA a2-<strong>like</strong>prote<strong>in</strong> resulted <strong>in</strong> a s<strong>in</strong>gle immunoreactive band ofabout 114 kDa (Fig. 5A). Compared to the 0 hrgroup, the abundance of branchial NKAa2-<strong>like</strong> prote<strong>in</strong> was not significantly differentfollow<strong>in</strong>g sal<strong>in</strong>ity transfer (Fig. 5B). Moreover,NKA a3-<strong>like</strong> immunoreactive <strong>prote<strong>in</strong>s</strong> were detected<strong>in</strong> gill prote<strong>in</strong> preparations from <strong>milkfish</strong>.The NKA a3-<strong>like</strong> prote<strong>in</strong> was approximately105kDa (Fig. 6A). Compared to the 0hr group,prote<strong>in</strong> levels of gill NKA a3-<strong>like</strong> prote<strong>in</strong> decreasedsignificantly s<strong>in</strong>ce 12 hr post-transfer (Fig. 6B). Nosignificant difference was found <strong>in</strong> the levels of threeNKA a-<strong>isoform</strong>-<strong>like</strong> <strong>prote<strong>in</strong>s</strong> dur<strong>in</strong>g the time-course<strong>in</strong> the control group fish (Figs. 4B, 5B, and 6B).J. Exp. Zool.