Photosynthesis: Physiological and Ecological Considerations
Photosynthesis: Physiological and Ecological Considerations
Photosynthesis: Physiological and Ecological Considerations
- No tags were found...

Create successful ePaper yourself
Turn your PDF publications into a flip-book with our unique Google optimized e-Paper software.
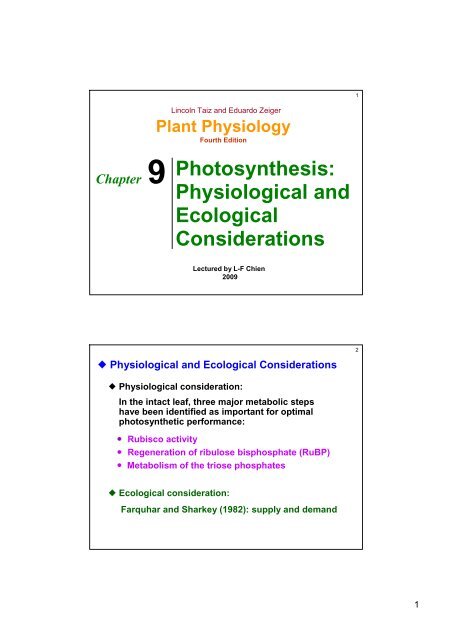
1Lincoln Taiz <strong>and</strong> Eduardo ZeigerPlant PhysiologyFourth EditionChapter 9<strong>Photosynthesis</strong>:<strong>Physiological</strong> <strong>and</strong><strong>Ecological</strong><strong>Considerations</strong>Lectured by L-F Chien2009 <strong>Physiological</strong> <strong>and</strong> <strong>Ecological</strong> <strong>Considerations</strong>2 <strong>Physiological</strong> consideration:In the intact leaf, three major metabolic stepshave been identified as important for optimalphotosynthetic performance:• Rubisco activity• Regeneration of ribulose bisphosphate (RuBP)•Metabolism of the triose phosphates <strong>Ecological</strong> consideration:Farquhar <strong>and</strong> Sharkey (1982): supply <strong>and</strong> dem<strong>and</strong>1
9.1 Light, Leaves, <strong>and</strong> <strong>Photosynthesis</strong>3• Three light parameters in the measurement of light:(1) spectral quality(2) amount(3) directionFIGURE 7.1 Light is a transverse electromagnetic wave,consisting of oscillating electric <strong>and</strong> magnetic field.9.2 Units in the Measurement of Light4With collimated lightFlatWith 45lightSphericalFIGURE 9.2 Flat <strong>and</strong> spherical light sensors.2
56•Light can be measured as energy, <strong>and</strong> the amount of energythat falls on a flat sensor of known area per unit time isquantified as irradiance.•Unit: watts per square meter (W m 2 ) (1 W = 1 Joule s 1 )•PAR: photosynthetically active radiation3
7•Light can be measured as the number of incident quanta(singular quantum).•Unit:(a) moles per square meter per second (mol m 2 s 1 )(b) microEinstein (Einstein, one mole of photons) per squaremeter per second (E m 2 s 1 )•PPFD: photosynthetic photon flux density8• Light can be measured omnidirectionally (from all directions) asfluence rate.• Unit:(a) W m 2(b) mol m 2 s 14
9.2.1 Light anatomy maximizes light absorption9Sun: 1.3 kW m 2FIGURE 9.3 Conversion of solar energy intocarbohydrates by a leaf.•The sun leaf is much thicker than the shade leaf.10FIGURE 9.1 Leaf anatomy from a legume (Thermopsis montana) grown indifferent light environments5
11FIGURE 9.4 Optical properties of a bean leaf.9.2.2 Plants compete for sunlight12FIGURE 9.5 The spectral distribution of sunlight at the top of a canopy <strong>and</strong> underthe canopy.6
9.2.3 Leaf angle <strong>and</strong> leaf movement can control lightabsorption13FIGURE 9.6 Leaf movement in sun-tracking plants.9.2.4 Plants acclimate <strong>and</strong> adapt to sun <strong>and</strong> shade14• Acclimation:a process whereby the newly produced leaf has a setof biochemical <strong>and</strong> morphological characteristics• Adaptation:a process by which an organism becomes fitted to itsenvironment•Sun <strong>and</strong> shade leaves:(a) Shade leaves have more total chlorophyll perreaction center, have a higher ratio of chlorophyll b tochlorophyll a, <strong>and</strong> are usually thinner than sun leaves.(b) Sun leaves have more rubisco <strong>and</strong> a larger pool ofxanthophyll cycle components than shade.(c) shade leaves PSII: PSI = 3:1sun leaves PSII: PSI = 2:17
9.3 Photosynthetic Responses to Light bythe Intact Leaf9.3.1 Light-response curves reveal photosynthetic properties15FIGURE 9.7 Response of photosynthesis to light in a C 3 plants.16Fluorescence•Photosynthetic activity:(a) Photosynthetic O 2 evolution(b) Photosynthetic CO 2 assimilation(c) Chlorophyll fluorescence8
17(triangle orache)(wild ginger)Dashed line has beenextrapolated from themeasured part of thecurve.FIGURE 9.8 Light-response curves of photosynthetic carbon fixation in sun<strong>and</strong> shade plants.18Barbara J. Collins, Ph.D.California Lutheran UniversityThous<strong>and</strong> Oaks, California, 91360Copyright © 2000-2003 by Barbara J.Collins <strong>and</strong> Lorence G. Collins.Scientific Name: Atriplex triangularisCOMMON NAME: Spearscale(triangle orache)Scientific Name: Asarum caudatumCOMMON NAME: Wild-ginger9
19(California sunflower)(Redscale)FIGURE 9.9 The quantum yield of photosynthetic carbon fixation in a C 3 plant<strong>and</strong> in a C 4 plants as a function of leaf temperature.20Scientific Name: Atriplex roseaCOMMON NAME: RedscaleScientific Name: Encelia californicaCOMMON NAME: California sunflower10
21(triangle orache)FIGURE 9.10 Light-response of photosynthesis of a sun plant grown undersun or shade conditions.22Picea sitchensis (Sitka spruce)FIGURE 9.11 Changes in photosynthesis (expressed on a per-square-meter basis)in individual needles, complex shoot, <strong>and</strong> a forest canopy of Sitka spruce (Piceasitchensis) <strong>and</strong> a function of irradiance.11
23鍚 特 卡 雲 杉The Sitka Spruce (Picea sitchensis) is a large coniferous evergreen tree growingto 50-70 m tall, exceptionally to 90 m tall, <strong>and</strong> with a trunk diameter of up to 5 m.It acquires its name from the community of Sitka, Alaska.(http://en.wikipedia.org/wiki/Picea_sitchensis)9.3.2 Leaves must dissipate excess light energy24FIGURE 9.12 Excess light energy in relation to a light response curve ofphotosynthetic evolution.12
THE XANTHOPHYLL CYCLE25An epoxide isa cyclic etherwith only threering atoms.FIGURE 7.35 Chemical structure of violazanthin, antheraxanthin, <strong>and</strong> zeaxanthin.•energy dissipation: As the amount of light incident to a leafincrease, a greater proportion of violaxanthin is converted toantheraxanthin <strong>and</strong> zeaxanthin.26FIGURE 9.13 Diurnal changes in xanthophyll content as a function ofirradiance in sunflower (Helianthus annuus).13
CHLOROPLASR MOVEMENTS & LEAF MOVEMENTS27FIGURE 9.14 Chloroplast distribution in photosynthesizing cells of the duckweed Lemna.9.3.3 Absorption of too much light can lead tophotoinhibition28FIGURE 7.3414
•Two types of photoinhibition29FIGURE 9.15 Changes in the light-response curves of photosynthesis caused byphotoinhibition.9.4 Photosynthetic Responses to Temperature9.4.1 Leaves must dissipate vast quantities of heat30FIGURE 9.16 The absorption <strong>and</strong> dissipation energy from sunlight by the leaf.15
Leaves must dissipate vast quantities of heat:•Radiative heat loss•Sensible heat loss•Latent heat loss31Sensible heat loss Bowen ratio Evaporative net loss•This concept was developed by Ira S. Bowen (1898–1978), anAmerican astrophysicist.•When the evaporation rate is low, because water supply is limited,the Bowen ratio tends to be high. Thus, the Bowen ratio is about(a)10 for deserts,(b) 2-6 for semi-arid regions,(c) 0.4 to 0.8 for temperate forests <strong>and</strong> grassl<strong>and</strong>s,(d) 0.2 for tropical rain forests <strong>and</strong>(e) 0.1 for tropical oceans.9.4.1 <strong>Photosynthesis</strong> is temperature sensitive32(Honeysweet)FIGURE 9.17 Changes in photosynthesis as a function of temperature.(After Berry <strong>and</strong> Björkman 1980)16
33Scientific Name: Tidestromia oblongifoliaCOMMON NAME: HoneysweetScientific Name: Larrea tridentata(or Larrea divaricata)COMMON NAME: Creosote Bush(http://www.laspilitas.com/plants/374.htm)34FIGURE 9.18 The relative rates of photosynthetic carbon gain17
9.5 Photosynthetic Responses to Caron Dioxide 359.5.1 Atmospheric CO 2 concentration keeps risingFIGURE 9.19 Concentration of atmospheric CO 2 from 420,000 years ago to the present.Web Topic 9.5Prehistoric Changes in Atmospheric CO 2The history of atmospheric CO 2on Earth has been one of slow but constant changes,far slower than the rate of today’s atmospheric CO 2changes. The last million year’sworth of history of atmospheric carbon dioxide is trapped in the ice core bubbles.36•These ice core data show thatatmospheric CO 2levels changedbetween 180 ppm (glacial periods)<strong>and</strong> 280 ppm (interglacial periods)as Earth moved in <strong>and</strong> out of iceages.•As of January 2007, the CO 2concentration in Earth’s atmospherewas about 0.0383% by volume, or383 ppmv.Web Figure 9.5.A Air bubbles trappedinside frozen ice. Courtesy ofNewScientist.com:http://www.newscientist.com/data/images/ns/cms/dn8369/dn8369-1_500.jpg•ppm, part per million(a) by mass: 1 mg/kg(b) by volume: 1 mL/10 3 L (cm 3 /m 3 )18
THE GREENHOUSE EFFECT37FIGURE 9.19 Concentration of atmospheric CO 2 from 420,000 years ago to the present.9.5.2 CO 2 diffusion to the chloroplast is essential tophotosynthesis38FIGURE 9.20 Points of resistance tothe diffusion of CO 2 from outside theleaf to the chloroplasts.19
9.5.3 Patterns of light absorption generate gradientsof CO 2 fixation39FIGURE 9.21Distribution ofabsorbed light inspinach sun leaves.40Tidestromia oblonfifolia (Honeysweet)Larrea divaricata (Creosote bush)10 15FIGURE 9.22 Changes in photosynthesis as a function of intercellular CO 2concentrations.20
411 Pa = 1 Newton per meter 2 (N m 2 )= 1 kg m s 2 m 2 42C 3 plants versus C 4 plants1. (a) In C 4 plants, photosynthetic rates saturate at c ivalues of about 15 Pa, reflecting the effective CO 2 -concentrating mechanisms operating in these plants.(b) In C 3 plants, increasing c i levels continue tostimulate photosynthesis over a much broader CO 2 .2. (a) In C 4 plants, the CO 2 compensation is zero ornearly zero, reflecting their very low levels ofphotorespiration.(b) In C 3 plants, the CO 2 compensation point is about10 Pa, reflecting CO 2 production because ofphotorespiration.21
Ehleringer et al. 199743FIGURE 9.23 The combination of atmospheric CO 2 levels<strong>and</strong> daytime growing season temperatures.9.6 Crassulacean Acid Metabolism44Cactus(Nabors 2004)22
45CO 2 assimilationH 2 O evaporationStomatalconductanceFIGURE 9.24Photosyntheticcarbon assimilation,evaporation, <strong>and</strong>stomatalconductance9.6.1 Carbon isotope ratio variations reveal differentphotosynthetic pathways9.6.2 How do we measure the carbon isotopes of plants?4613CO13 2C / 12 C ratio (R) of plant : R 12CO2Carbon isotope ratio ( 13 C) of plant :13 C%oR Rsamplest<strong>and</strong>ard1 1000where the st<strong>and</strong>ard represents thecarbon isotopes contained in afossil belemnite from the Pee Deelimestone formation of SouthCarolina.(http://en.wikipedia.org/wiki/)23
472814[singular: taxon]FIGURE 9.25 Frequency histograms for observed carbon isotope ratios in C 3 <strong>and</strong> C 4 taxa. 13 C of C 3 plant = 28 ‰ 13 C of C 4 plant = 14 ‰There is less 13 C in atmosphericCO 2 than is found in the carbonatedof the belemnite st<strong>and</strong>ard.48•C 3 plants: wheat, rice, potatoes, sugar beet,beans, <strong>and</strong> etc.•C 4 plants: corn, sugarcane, sorghum, <strong>and</strong> etc.•CAM plants: cactus, pineapple, <strong>and</strong> etc.24