CWS: A User's Guide
CWS: A User's Guide
CWS: A User's Guide

You also want an ePaper? Increase the reach of your titles
YUMPU automatically turns print PDFs into web optimized ePapers that Google loves.
<strong>CWS</strong>: A User’s <strong>Guide</strong>David J. WeissJames ShanteauWhat is the <strong>CWS</strong> approach?<strong>CWS</strong> is the Cochran-Weiss-Shanteau approach to assessing expertise purely fromdata. The approach is based on the idea that expert judgment involves discrimination –seeing fine gradations among the stimuli – and consistency – evaluating similar stimulisimilarly. The approach was inspired by an idea for comparing response instrumentssuggested by the late statistician William Cochran (1943), and adapted to the domain ofexpertise by David J. Weiss and James Shanteau.What do you mean by “an expert?Applying the term “expert” to a person is a shorthand description of a set of results ratherthan a characterization of the person. Talent and training may combine to yield a personwe label as expert, but it must be kept in mind that the label is a generalization. It is thebehavior that is or is not expert. With <strong>CWS</strong>, we measure expertise in a specific setting,with specific stimuli and a specific task. Someone who excels in one context may notexcel in others that seem similar.What is the <strong>CWS</strong> index?The <strong>CWS</strong> index is a numerical value that captures the degree of expertisedemonstrated in a set of responses. It consists of the ratio of discrimination toinconsistency. Discrimination refers to the candidate’s differential evaluation of thevarious stimuli within a set. Consistency refers to the candidate’s evaluation of the samestimuli similarly over time; inconsistency is its complement. The ratio will be large whena candidate discriminates effectively, and will be reduced if the candidate is inconsistent.
Discrimina tion<strong>CWS</strong> =Inconsiste ncyThe rationale for incorporating discrimination and consistency into an index of expertiseis that a good measuring instrument, such as a ruler or a thermometer, has theseproperties. Discrimination and consistency are the building blocks of measurement.Similarly, expertise at its core requires the ability to evaluate the stimuli in one’s domain.Note that accuracy is not involved in <strong>CWS</strong>, as we do not assume any knowledge ofcorrect responses.
How are Discrimination and Inconsistency measured?For data obtained using interval or ordinal scales, we usually measure bothquantities as variances. Discrimination is the variance among averaged responses todifferent stimuli, while inconsistency is the variance among responses to the samestimulus, averaged across stimuli. The variance, because it entails squaring deviations,has the property that large differences are accentuated. The ratio of the variances followsthe F-distribution, and is computed as if it were an F-ratio, but its interpretation issomewhat different. (It is also plausible to measure discrimination and inconsistencywith other dispersion measures, such as standard deviation or mean absolute deviation.)Because different stimuli are generally expected to elicit different responses, themeasures of discrimination and inconsistency are strictly tied to the set of stimuli actuallypresented. It is not meaningful to compare measures obtained using different stimulussets. In this sense, <strong>CWS</strong> ratios are unlike F-ratios, in that they have no meaning inisolation. The <strong>CWS</strong> index is scale independent; a linear transformation of the responsescale does not alter the ratio.For data obtained using nominal (categorical) scales, in which responses eitheragree or disagree with no hint of the extent of disagreement, we have developed measuresbased on the possible and obtained numbers of (non-)matches across stimuli andreplications. These measures are illustrated below in the following example:
Illustration of <strong>CWS</strong> Index for Nominal Data (four response alternatives)Stimulus 1 Stimulus 2 Stimulus 3 Stimulus 4 Stimulus 5Replicate 1 A D B C CReplicate 2 A B B B BReplicate 3 A B A B AMatches 3 1 1 1 0For both numerator and denominator, we utilize the proportion of obtainedpairwise non-matches to possible matches. In measuring discrimination, a match isevidence of failure to discriminate, so the greater the proportion of observed nonmatches,the greater the discrimination. In measuring inconsistency, a match means theresponse was consistent, so the greater the proportion of observed non-matches, thegreater the inconsistency. Expert performance is marked by few matches across columns(stimuli), and many matches within columns (replications). If there are no matcheswithin columns – no consistency at all - the <strong>CWS</strong> ratio is undefined, but that outcomeunambiguously connotes a lack of expertise.<strong>CWS</strong> Numerator (Discrimination) =∑MatrixNon −matchesacross columnsPossible matches across columnsThe number of possible matches across columns is most easily calculated bysubtracting the number of possible within-column matches from the total number ofpossible matches. Each response may be matched to any other, so the total number ofpossible matches is 15 C 2 (= 105). There are 3 C 2 (= 3) possible matches within each
column, so the number of possible within-column matches is 5 x 3 C 2 (= 15). Therefore,there are 90 possible matches across columns, and 15 possible matches within columns.In the example above, there were 7 pairs of “A” responses in different columns. “B”was matched 18 times, “C” once, and “D” was not matched at all.90 − 26Numerator = = . 71190<strong>CWS</strong> Denominator (Inconsistency) =15−6Denominator = = . 6015∑ColumnsNon −matcheswithin columnsPossible matches within columns<strong>CWS</strong>Numerator .711<strong>CWS</strong> Index = = = 1. 185<strong>CWS</strong>Deno min ator .60Why is the <strong>CWS</strong> index set up as a ratio?The ratio formulation reflects the idea that a candidate can trade off the twoquantities as dictated by the situation. By widening the range of responses used, one canincrease discrimination, but only at the cost of decreasing consistency.Everyone strikes a balance between discrimination and consistency. Performingwell in one respect or the other is relatively easy. Someone who can do both at once isbehaving expertly.
What is the unit of analysis – who is “the candidate”?In general, an individual person, a candidate expert, generates a single <strong>CWS</strong> scorefor a particular experimental condition. That <strong>CWS</strong> score may be compared to the scoreproduced by other candidates under identical conditions, or to the <strong>CWS</strong> score producedby the same candidate under a different experimental condition.It is also possible for a team to produce a single <strong>CWS</strong> score, when it is the team’sresponses to the various stimuli that constitute a data set. In this usage, components ofthe response from individual team members would not be analyzed separately. The <strong>CWS</strong>score from one team may be compared to that from another team, or to the <strong>CWS</strong> scoreproduced by an individual operating alone with the same stimuli.Designs in which an individual’s data constitute the unit of analysis are known assingle-subject designs.
What kind of research design is needed?In order to be able to distinguish among candidate experts, it is a good idea topresent a wide range of stimuli. The researcher may not know how to identify stimulithat span the range; subject matter experts (SMEs) may be useful in selection of stimuli(although, in general, we do not wish to assume expertise, we acknowledge that SMEs doexist and can be helpful). The wider the range of stimuli, the more discrimination it ispossible to exhibit. In some cases, expertise may show itself only when rare problemscome along.It is crucial that at least some stimuli be presented more than once. This repetitionis necessary to provide an estimate of consistency. If it is not practical to present theentire set repeatedly, it is a good idea to select values from across the stimulus range to bepresented repeatedly. There is a danger that amount of inconsistency depends uponstimulus magnitude (a la Weber’s law),If it is feasible, we recommend complete replication (presenting the entire set ofstimuli more than once); the more replications, the more reliable is the estimate. Whetherresponses in the research setting can be sufficiently isolated to approximate independenceis a standard concern for researchers.It is imperative that the same set of stimuli be presented to all candidates.Varying the order of presentation of those stimuli, perhaps by employing independentrandomization, across candidates may be acceptable, if order doesn’t have an impact ofits own.
What are the constraints on the stimuli to be evaluated?Stimuli need to be presented identically to all candidates. For ephemeral stimuli,that may present a practical problem. Video recording is a valuable tool, although someinformation may be lost relative to live presentation. For stimuli that are consumedduring the task, sufficient quantities need to be on hand and they must not decay overtime.Stimuli also need to be presented more than once to an individual. If the stimuliare memorable, the candidate may try to recall rather than render an independentresponse. The researcher may need to space trials over time or re-label them so as toinhibit recollection.What sorts of responses are usable?Because our approach to evaluating expertise is quantitative, we require discreteresponses. These can be expressed on any of the response scales that experts use. Withnumerical ratings, the responses are approximately on an interval scale and can be used toconstruct variance ratios. Ordinal responses, such as rankings or letter grades, can beused similarly when converted to numbers. Sufficiently dense ordinal data yieldsconsiderable power (Weiss, 1986). Even “Yes-No” responses can yield resultsessentially equivalent to those obtained with continuous scales (Lunney, 1970). Nominalresponses generally provide less power; nevertheless, measures of discrimination andinconsistency have been defined.
What statistical procedures are applicable?When <strong>CWS</strong> estimates of discrimination and inconsistency are variances, there is astatistical comparison that provides significance statements. Schumann and Bradley(1959) developed a procedure for comparing sets of data from two similar experimentsthat can determine whether one F-ratio is significantly larger than the other. Similarmeans that each F-ratio is constructed from responses to the same stimuli and therefore,has the same degrees of freedom. The ratio of the F-ratios constitutes a test statistic, w.w is compared to w 0 , a critical value found in the table presented by Schumann andBradley. The test can be employed either directionally or nondirectionally. The onetailed(directional) test determines whether the candidate is significantly less capable thana designated expert. The two-tailed (nondirectional) test asks whether there is asignificant difference between two judges. Each judge is considered as a separate“experiment”. A computer program (Weiss, 1985) incorporating the Schumann andBradley procedure and table of critical values is available.The obtained w’s represent the final steps in the <strong>CWS</strong> analysis. They allowcomparison of the expertise exhibited by the various candidates as they judge a particularset of stimulus objects. Pairwise comparisons express how each candidate does withrespect to the others. Alternatively, one may compare the candidate’s expertise to anestablished standard.
How do you average <strong>CWS</strong> scores?Because <strong>CWS</strong> is built upon the squared differences between the impact of onestimulus and another, you must first get to a distance metric by taking the square root,then compute the mean of those roots and square the result.<strong>CWS</strong>=⎛∑ ⎜⎝cws.52⎞i ⎟⎠For the four doctors in the example below, <strong>CWS</strong> 18 = 580.20. <strong>CWS</strong> 8 = 1.21; <strong>CWS</strong> 16 =1.81; <strong>CWS</strong> 23 = .76Mean <strong>CWS</strong> = 46.96 (the arithmetic mean is 145.99).But please be careful; it is meaningful to average only when the stimuli were thesame for all of the people whose individual <strong>CWS</strong>s are being integrated. A typicalappropriate set of results to average would be the <strong>CWS</strong>s for a group of subjects at anearly stage of training and then again at a later stage of training. Also be wary thatbecause <strong>CWS</strong> values depend on the stimulus set, it would not be meaningful to comparethe two means unless the stimuli were the same at both stages.
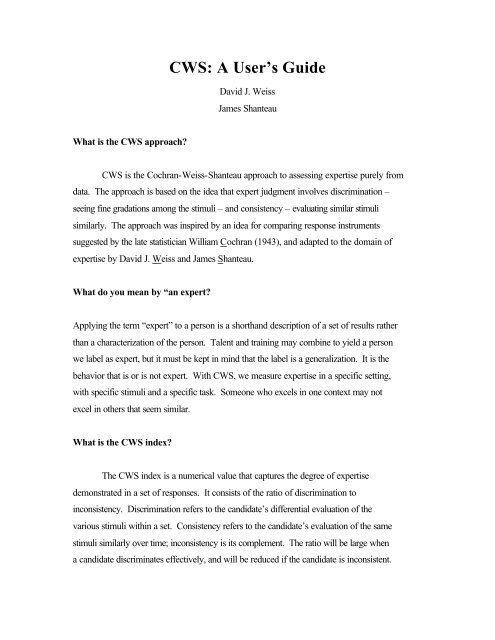
An exampleA recent study by Skånér, Strender, & Bring (1998) illustrates how expertise canbe evaluated based on a set of judgments. Twenty-seven Swedish General Practitioners(GPs) judged the probability of heart failure for 45 cases based on real patients; five ofthe cases were repeated, although the GPs were not informed of that. The case vignettesstated that each patient came to the clinic because of fatigue. There were no additionalpathological findings based on further examination. Normal values were provided forhemoglobin, electrolytes, s-creatinine, and TSH. Case-specific information was providedfor ten cues: age, gender, history of myocardial infarction, dyspnea, edema, lung sounds,cardiac rhythm, heart rate at rest, heart X-ray, and lung X-ray.“For each vignette, the doctors were asked to assess the probability that thepatient suffered from any degree of heart failure” (Skånér et al., 1998, p. 96). Theassessments were made on a graphic scale with “totally unlikely” at one end and“certain” at the other; these were converted into 0-to-100 values. The doctors wereinstructed “to judge the probability, not the severity, of heart failure” (p. 96).Selected results for four of the GP’s (identified by number) are shown below.The five repeated cases are represented by letters at the horizontal axis. The circles arethe judgments for the first presentation and the squares are the judgments for the secondpresentation. Thus, the first judgment of Case A by Doctor #18 is near 100; the secondjudgment is similar.
Probability Judgments of Heart Failure250200Probability Judgments15010050Doctor #18Doctor #8 #18Doctor #8Doctor #16Doctor #230A B C D E A B C D EPatient CasesAs can be seen, there is considerable variation between and within the four GP’s.Still, each GP shows a distinctive pattern in terms of discrimination and reliability.Doctor #18 is highly discriminating (sizable differences between patients) and consistent(little difference between first and second presentations). Doctor #8 shows somediscrimination, but lacks consistency (especially for patient B). Doctor #16 is consistent,but treats all patients rather similarly – all are seen as having moderately high chances ofheart failure. Doctor #23 shows no uniform pattern of discrimination or consistency.
Based on their data alone, we can gain considerable insight into the judgmentstrategies and abilities of the GPs. Doctors #18 and #23 are consistent, but onediscriminates and the other does not. Doctors #8 and #23 are inconsistent and vary intheir discriminations. We believe that without knowing anything further, most clientswould prefer someone like Doctor #18, who can make clear distinctions in a consistentway. The numbers shown in the graph were processed to yield the <strong>CWS</strong> values below.These <strong>CWS</strong> values are F-ratios.Dr. #18 Dr. #8 Dr. # 16 Dr. #23<strong>CWS</strong> = 3365.15/5.80= 580.20<strong>CWS</strong> = 490.75/404.60= 1.21<strong>CWS</strong> = 65.40/36.10= 1.81<strong>CWS</strong> = 330.40/434.00= .76
ReferencesCochran, W. G. (1943). The comparison of different scales of measurement forexperimental results. Annals of Mathematical Statistics, 14, 205-216.Lunney, G. H. (1970). Using analysis of variance with a dichotomous dependent variable:An empirical study. Journal of Educational Measurement, 7, 263-269.Schumann, D. E. W., & Bradley, R. A. (1959). The comparison of the sensitivities ofsimilar experiments: Model II of the analysis of variance. Biometrics, 15, 405-416.Skånér, Y., Strender, L., & Bring, J. (1998). How do GPs use clinical information in thejudgements of heart failure? Scandinavian Journal of Primary Health Care, 16,95-100.Weiss, D. J. (1985). SCHUBRAD: The comparison of the sensitivities of similarexperiments. Behavior Research Methods, Instrumentation, and Computers, 17,572.Weiss, D. J. (1986). The discriminating power of ordinal data. Journal of SocialBehavior and Personality, 1, 381-389.