Assessment of Service Quality in Tourist Hotels of ... - Wbiaus.org
Assessment of Service Quality in Tourist Hotels of ... - Wbiaus.org
Assessment of Service Quality in Tourist Hotels of ... - Wbiaus.org

You also want an ePaper? Increase the reach of your titles
YUMPU automatically turns print PDFs into web optimized ePapers that Google loves.
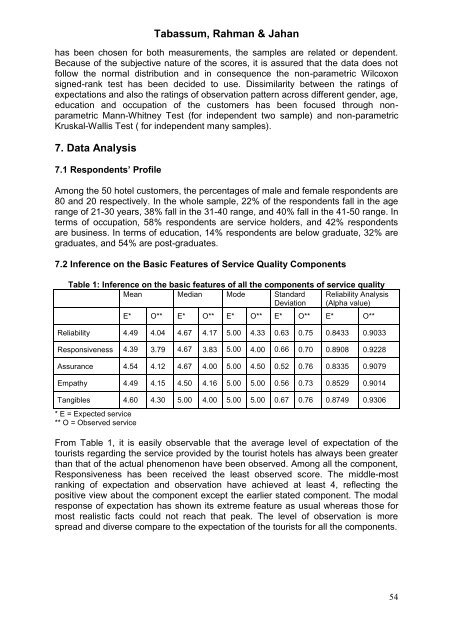
Tabassum, Rahman & Jahanhas been chosen for both measurements, the samples are related or dependent.Because <strong>of</strong> the subjective nature <strong>of</strong> the scores, it is assured that the data does notfollow the normal distribution and <strong>in</strong> consequence the non-parametric Wilcoxonsigned-rank test has been decided to use. Dissimilarity between the rat<strong>in</strong>gs <strong>of</strong>expectations and also the rat<strong>in</strong>gs <strong>of</strong> observation pattern across different gender, age,education and occupation <strong>of</strong> the customers has been focused through nonparametricMann-Whitney Test (for <strong>in</strong>dependent two sample) and non-parametricKruskal-Wallis Test ( for <strong>in</strong>dependent many samples).7. Data Analysis7.1 Respondents’ Pr<strong>of</strong>ileAmong the 50 hotel customers, the percentages <strong>of</strong> male and female respondents are80 and 20 respectively. In the whole sample, 22% <strong>of</strong> the respondents fall <strong>in</strong> the agerange <strong>of</strong> 21-30 years, 38% fall <strong>in</strong> the 31-40 range, and 40% fall <strong>in</strong> the 41-50 range. Interms <strong>of</strong> occupation, 58% respondents are service holders, and 42% respondentsare bus<strong>in</strong>ess. In terms <strong>of</strong> education, 14% respondents are below graduate, 32% aregraduates, and 54% are post-graduates.7.2 Inference on the Basic Features <strong>of</strong> <strong>Service</strong> <strong>Quality</strong> ComponentsTable 1: Inference on the basic features <strong>of</strong> all the components <strong>of</strong> service qualityMean Median Mode StandardDeviationReliability Analysis(Alpha value)E* O** E* O** E* O** E* O** E* O**Reliability 4.49 4.04 4.67 4.17 5.00 4.33 0.63 0.75 0.8433 0.9033Responsiveness 4.39 3.79 4.67 3.83 5.00 4.00 0.66 0.70 0.8908 0.9228Assurance 4.54 4.12 4.67 4.00 5.00 4.50 0.52 0.76 0.8335 0.9079Empathy 4.49 4.15 4.50 4.16 5.00 5.00 0.56 0.73 0.8529 0.9014Tangibles 4.60 4.30 5.00 4.00 5.00 5.00 0.67 0.76 0.8749 0.9306* E = Expected service** O = Observed serviceFrom Table 1, it is easily observable that the average level <strong>of</strong> expectation <strong>of</strong> thetourists regard<strong>in</strong>g the service provided by the tourist hotels has always been greaterthan that <strong>of</strong> the actual phenomenon have been observed. Among all the component,Responsiveness has been received the least observed score. The middle-mostrank<strong>in</strong>g <strong>of</strong> expectation and observation have achieved at least 4, reflect<strong>in</strong>g thepositive view about the component except the earlier stated component. The modalresponse <strong>of</strong> expectation has shown its extreme feature as usual whereas those formost realistic facts could not reach that peak. The level <strong>of</strong> observation is morespread and diverse compare to the expectation <strong>of</strong> the tourists for all the components.54