Assessment of Service Quality in Tourist Hotels of ... - Wbiaus.org
Assessment of Service Quality in Tourist Hotels of ... - Wbiaus.org
Assessment of Service Quality in Tourist Hotels of ... - Wbiaus.org

You also want an ePaper? Increase the reach of your titles
YUMPU automatically turns print PDFs into web optimized ePapers that Google loves.
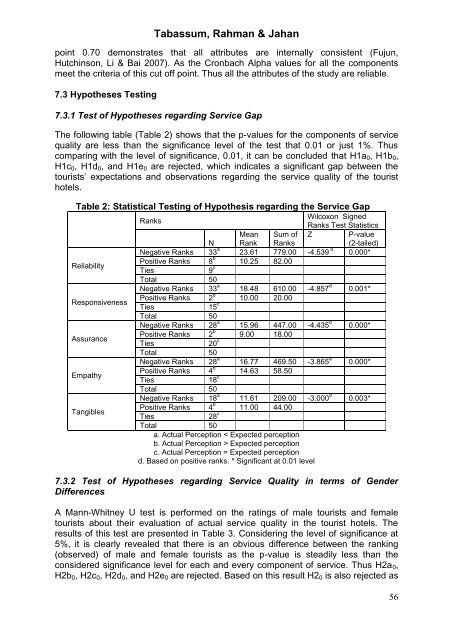
Tabassum, Rahman & Jahanpo<strong>in</strong>t 0.70 demonstrates that all attributes are <strong>in</strong>ternally consistent (Fujun,Hutch<strong>in</strong>son, Li & Bai 2007). As the Cronbach Alpha values for all the componentsmeet the criteria <strong>of</strong> this cut <strong>of</strong>f po<strong>in</strong>t. Thus all the attributes <strong>of</strong> the study are reliable.7.3 Hypotheses Test<strong>in</strong>g7.3.1 Test <strong>of</strong> Hypotheses regard<strong>in</strong>g <strong>Service</strong> GapThe follow<strong>in</strong>g table (Table 2) shows that the p-values for the components <strong>of</strong> servicequality are less than the significance level <strong>of</strong> the test that 0.01 or just 1%. Thuscompar<strong>in</strong>g with the level <strong>of</strong> significance, 0.01, it can be concluded that H1a 0 , H1b 0 ,H1c 0 , H1d 0 , and H1e 0 are rejected, which <strong>in</strong>dicates a significant gap between thetourists’ expectations and observations regard<strong>in</strong>g the service quality <strong>of</strong> the touristhotels.Table 2: Statistical Test<strong>in</strong>g <strong>of</strong> Hypothesis regard<strong>in</strong>g the <strong>Service</strong> GapReliabilityResponsivenessAssuranceEmpathyTangiblesRanksWilcoxon SignedRanks Test StatisticsMean Sum <strong>of</strong> Z P-valueN Rank Ranks(2-tailed)Negative Ranks 33 a 23.61 779.00 -4.539 d 0.000*Positive Ranks 8 b 10.25 82.00Ties9 cTotal 50Negative Ranks 33 a 18.48 610.00 -4.857 d 0.001*Positive Ranks 2 b 10.00 20.00Ties15 cTotal 50Negative Ranks 28 a 15.96 447.00 -4.435 d 0.000*Positive Ranks 2 b 9.00 18.00Ties20 cTotal 50Negative Ranks 28 a 16.77 469.50 -3.865 a 0.000*Positive Ranks 4 b 14.63 58.50Ties18 cTotal 50Negative Ranks 18 a 11.61 209.00 -3.000 d 0.003*Positive Ranks 4 b 11.00 44.00Ties28 cTotal 50a. Actual Perception < Expected perceptionb. Actual Perception > Expected perceptionc. Actual Perception = Expected perceptiond. Based on positive ranks. * Significant at 0.01 level7.3.2 Test <strong>of</strong> Hypotheses regard<strong>in</strong>g <strong>Service</strong> <strong>Quality</strong> <strong>in</strong> terms <strong>of</strong> GenderDifferencesA Mann-Whitney U test is performed on the rat<strong>in</strong>gs <strong>of</strong> male tourists and femaletourists about their evaluation <strong>of</strong> actual service quality <strong>in</strong> the tourist hotels. Theresults <strong>of</strong> this test are presented <strong>in</strong> Table 3. Consider<strong>in</strong>g the level <strong>of</strong> significance at5%, it is clearly revealed that there is an obvious difference between the rank<strong>in</strong>g(observed) <strong>of</strong> male and female tourists as the p-value is steadily less than theconsidered significance level for each and every component <strong>of</strong> service. Thus H2a 0 ,H2b 0 , H2c 0 , H2d 0 , and H2e 0 are rejected. Based on this result H2 0 is also rejected as56