- Page 1:
Statistical RethinkingA BAYESIAN CO
- Page 4 and 5:
4 CONTENTS5.5. Ordinary least squar
- Page 7 and 8:
PrefaceMasons, when they start upon
- Page 9 and 10:
HOW TO USE THIS BOOK 9least a minor
- Page 11 and 12:
HOW TO USE THIS BOOK 11than initial
- Page 13 and 14:
1 e Golem of PragueIn the 16th cent
- Page 16:
16 1. THE GOLEM OF PRAGUEconverses
- Page 19 and 20:
1.2. WRECKING PRAGUE 19model P 1B ,
- Page 21 and 22:
1.2. WRECKING PRAGUE 21e dominant r
- Page 23 and 24:
1.3. THREE TOOLS FOR GOLEM ENGINEER
- Page 25 and 26:
1.3. THREE TOOLS FOR GOLEM ENGINEER
- Page 27 and 28:
1.3. THREE TOOLS FOR GOLEM ENGINEER
- Page 29 and 30:
2 Small Worlds and Large WorldsWhen
- Page 31 and 32:
2.1. PROBABILITY IS JUST COUNTING 3
- Page 33 and 34:
2.1. PROBABILITY IS JUST COUNTING 3
- Page 35 and 36:
2.1. PROBABILITY IS JUST COUNTING 3
- Page 37 and 38:
2.2. COLOMBO’S FIRST BAYESIAN MOD
- Page 39 and 40:
W L W W W L W L W2.2. COLOMBO’S F
- Page 41 and 42:
2.3. COMPONENTS OF THE MODEL 41not
- Page 43 and 44:
2.3. COMPONENTS OF THE MODEL 43You
- Page 45 and 46:
2.3. COMPONENTS OF THE MODEL 45e ma
- Page 47 and 48:
2.4. MAKING THE MODEL GO 47other pr
- Page 49 and 50:
2.4. MAKING THE MODEL GO 495 points
- Page 51 and 52:
2.4. MAKING THE MODEL GO 51just the
- Page 53 and 54:
2.4. MAKING THE MODEL GO 53between
- Page 55 and 56:
2.6. PRACTICE 55Medium.2.6.5. m1. R
- Page 57 and 58:
2.6. PRACTICE 57implied by the equa
- Page 59 and 60:
3 Sampling the ImaginaryLots of boo
- Page 61 and 62:
3. SAMPLING THE IMAGINARY 61a probl
- Page 63 and 64:
3.2. SAMPLING TO SUMMARIZE 63plot(
- Page 65 and 66:
3.2. SAMPLING TO SUMMARIZE 65Densit
- Page 67 and 68:
3.2. SAMPLING TO SUMMARIZE 67In con
- Page 69 and 70:
3.2. SAMPLING TO SUMMARIZE 69Densit
- Page 71 and 72:
3.3. SAMPLING TO SIMULATE PREDICTIO
- Page 73 and 74:
3.3. SAMPLING TO SIMULATE PREDICTIO
- Page 75 and 76:
3.3. SAMPLING TO SIMULATE PREDICTIO
- Page 77 and 78:
3.3. SAMPLING TO SIMULATE PREDICTIO
- Page 79 and 80:
3.5. PRACTICE 793.5. PracticeEasy.
- Page 81:
3.5. PRACTICE 813.5.17. Predict sec
- Page 84 and 85:
84 4. LINEAR MODELSFIGURE 4.1. e Pt
- Page 86 and 87:
86 4. LINEAR MODELSexperiment with
- Page 88 and 89:
88 4. LINEAR MODELS4.1.4.2. Epistem
- Page 90 and 91:
90 4. LINEAR MODELSe approach above
- Page 92 and 93:
92 4. LINEAR MODELS'data.frame': 54
- Page 94 and 95:
94 4. LINEAR MODELSe point isn’t
- Page 96 and 97:
96 4. LINEAR MODELShave the samples
- Page 98 and 99:
98 4. LINEAR MODELSere’s no troub
- Page 100 and 101:
100 4. LINEAR MODELS)Note the comma
- Page 102 and 103:
102 4. LINEAR MODELSpreviously obse
- Page 104 and 105:
104 4. LINEAR MODELS4.4. Adding a p
- Page 106 and 107:
106 4. LINEAR MODELS(1) What is the
- Page 108 and 109:
108 4. LINEAR MODELSdata(Howell1)d
- Page 110 and 111:
110 4. LINEAR MODELSRethinking: Wha
- Page 112 and 113:
112 4. LINEAR MODELSheight140 150 1
- Page 114 and 115:
114 4. LINEAR MODELSheight140 150 1
- Page 116 and 117:
116 4. LINEAR MODELSYou end up with
- Page 118 and 119:
118 4. LINEAR MODELS(1) Use link to
- Page 120 and 121:
120 4. LINEAR MODELSheight140 150 1
- Page 122 and 123:
122 4. LINEAR MODELSRethinking: Lin
- Page 124 and 125:
124 4. LINEAR MODELSheight60 80 100
- Page 126 and 127:
126 4. LINEAR MODELS4.7.1. e1. In t
- Page 129 and 130:
5 Multivariate Linear ModelsOne of
- Page 131 and 132:
5.1. SPURIOUS ASSOCIATION 131Divorc
- Page 133 and 134:
5.1. SPURIOUS ASSOCIATION 133But me
- Page 135 and 136:
5.1. SPURIOUS ASSOCIATION 135abmbas
- Page 137 and 138:
5.1. SPURIOUS ASSOCIATION 137this i
- Page 139 and 140:
5.1. SPURIOUS ASSOCIATION 139slower
- Page 141 and 142:
5.1. SPURIOUS ASSOCIATION 141Median
- Page 143 and 144:
5.1. SPURIOUS ASSOCIATION 143(a)(b)
- Page 145 and 146:
5.2. MASKED RELATIONSHIP 145N
- Page 147 and 148:
5.2. MASKED RELATIONSHIP 147a ~ dno
- Page 149 and 150:
5.2. MASKED RELATIONSHIP 149dcc$log
- Page 151 and 152:
5.3. WHEN ADDING VARIABLES HURTS 15
- Page 153 and 154:
5.3. WHEN ADDING VARIABLES HURTS 15
- Page 155 and 156:
5.3. WHEN ADDING VARIABLES HURTS 15
- Page 157 and 158:
5.3. WHEN ADDING VARIABLES HURTS 15
- Page 159 and 160:
5.3. WHEN ADDING VARIABLES HURTS 15
- Page 161 and 162:
5.4. CATEGORICAL VARIABLES 161$ wei
- Page 163 and 164:
5.4. CATEGORICAL VARIABLES 1635.4.2
- Page 165:
5.4. CATEGORICAL VARIABLES 165# sam
- Page 168 and 169:
168 5. MULTIVARIATE LINEAR MODELS5.
- Page 170 and 171:
170 5. MULTIVARIATE LINEAR MODELS5.
- Page 173 and 174:
6 Model Selection, Comparison, and
- Page 175 and 176:
6.1. THE PROBLEM WITH PARAMETERS 17
- Page 177 and 178:
6.1. THE PROBLEM WITH PARAMETERS 17
- Page 179 and 180:
6.1. THE PROBLEM WITH PARAMETERS 17
- Page 181 and 182:
6.1. THE PROBLEM WITH PARAMETERS 18
- Page 183 and 184:
6.2. INFORMATION THEORY AND MODEL P
- Page 185 and 186:
6.2. INFORMATION THEORY AND MODEL P
- Page 187 and 188:
6.2. INFORMATION THEORY AND MODEL P
- Page 189 and 190:
6.3. AKAIKE INFORMATION CRITERION 1
- Page 191 and 192:
6.3. AKAIKE INFORMATION CRITERION 1
- Page 193 and 194:
6.3. AKAIKE INFORMATION CRITERION 1
- Page 195 and 196:
6.3. AKAIKE INFORMATION CRITERION 1
- Page 197 and 198:
6.4. DEVIANCE INFORMATION CRITERION
- Page 199 and 200:
6.4. DEVIANCE INFORMATION CRITERION
- Page 201 and 202:
6.4. DEVIANCE INFORMATION CRITERION
- Page 203 and 204:
6.5. USING AIC 203helps guard again
- Page 205 and 206:
6.5. USING AIC 205compare( m6.11 ,
- Page 207 and 208:
6.5. USING AIC 207e attitude this b
- Page 209 and 210:
6.5. USING AIC 209kcal.per.g0.5 0.7
- Page 211 and 212:
6.7. PRACTICE 211Consider by analog
- Page 213:
6.7. PRACTICE 2136.7.3. e deviance
- Page 216 and 217:
216 7. INTERACTIONSFIGURE 7.1. TOP:
- Page 218 and 219:
218 7. INTERACTIONSlog(rgdppc_2000)
- Page 220 and 221:
220 7. INTERACTIONSird, we may want
- Page 222 and 223:
222 7. INTERACTIONSlog GDP year 200
- Page 224 and 225:
224 7. INTERACTIONSlog GDP year 200
- Page 226 and 227:
226 7. INTERACTIONSInteraction mode
- Page 228 and 229:
228 7. INTERACTIONSthis model and t
- Page 230 and 231:
230 7. INTERACTIONSlog GDP year 200
- Page 232 and 233:
232 7. INTERACTIONSe main effect li
- Page 234 and 235:
234 7. INTERACTIONSbs -38.91 34.94s
- Page 236 and 237:
236 7. INTERACTIONSe primary reason
- Page 238 and 239:
238 7. INTERACTIONSNow for the plot
- Page 240 and 241:
240 7. INTERACTIONS7.4. Higher-orde
- Page 243 and 244:
8 Markov Chain Monte Carlo Estimati
- Page 245 and 246:
8.1. GOOD KING MARKOV AND HIS ISLAN
- Page 247 and 248:
8.2. MARKOV CHAIN MONTE CARLO 247fo
- Page 249 and 250:
8.2. MARKOV CHAIN MONTE CARLO 249No
- Page 251 and 252:
8.3. EASY HMC: MAP2STAN 251We’re
- Page 253 and 254:
8.3. EASY HMC: MAP2STAN 253$ cont_a
- Page 255 and 256:
8.3. EASY HMC: MAP2STAN 255mcmcpair
- Page 257 and 258:
8.3. EASY HMC: MAP2STAN 257FIGURE 8
- Page 259 and 260:
8.4. CARE AND FEEDING OF YOUR MARKO
- Page 261 and 262:
8.4. CARE AND FEEDING OF YOUR MARKO
- Page 263 and 264:
8.4. CARE AND FEEDING OF YOUR MARKO
- Page 265:
8.6. PRACTICE 265And since the chai
- Page 268 and 269:
268 9. BIG ENTROPY AND THE GENERALI
- Page 270 and 271:
270 9. BIG ENTROPY AND THE GENERALI
- Page 273 and 274:
10 Distance and DurationA curious t
- Page 275:
10.2. GAMMA 275can be quite complic
- Page 278 and 279:
278 11. COUNTING AND CLASSIFICATION
- Page 280 and 281:
280 11. COUNTING AND CLASSIFICATION
- Page 282 and 283:
282 11. COUNTING AND CLASSIFICATION
- Page 284 and 285:
284 11. COUNTING AND CLASSIFICATION
- Page 286 and 287:
286 11. COUNTING AND CLASSIFICATION
- Page 288 and 289:
288 11. COUNTING AND CLASSIFICATION
- Page 290 and 291:
290 11. COUNTING AND CLASSIFICATION
- Page 292 and 293:
292 11. COUNTING AND CLASSIFICATION
- Page 294 and 295:
294 11. COUNTING AND CLASSIFICATION
- Page 296 and 297:
296 11. COUNTING AND CLASSIFICATION
- Page 298 and 299:
298 11. COUNTING AND CLASSIFICATION
- Page 300 and 301:
300 11. COUNTING AND CLASSIFICATION
- Page 302 and 303:
302 11. COUNTING AND CLASSIFICATION
- Page 304 and 305:
304 12. MONSTERS AND MIXTUREShere?
- Page 306 and 307: 306 12. MONSTERS AND MIXTURESdensit
- Page 308 and 309: 308 12. MONSTERS AND MIXTURESfootbr
- Page 310 and 311: 310 12. MONSTERS AND MIXTURESWhy di
- Page 312 and 313: 312 12. MONSTERS AND MIXTURESm11.3
- Page 314 and 315: 314 12. MONSTERS AND MIXTURESResult
- Page 316 and 317: 316 12. MONSTERS AND MIXTURESanswer
- Page 318 and 319: 318 12. MONSTERS AND MIXTURESDensit
- Page 320 and 321: 320 12. MONSTERS AND MIXTURESBut we
- Page 322 and 323: 322 12. MONSTERS AND MIXTURESdisper
- Page 324 and 325: 324 12. MONSTERS AND MIXTURESe resu
- Page 326 and 327: 326 12. MONSTERS AND MIXTURESDensit
- Page 328 and 329: 328 12. MONSTERS AND MIXTURESR code
- Page 330 and 331: 330 12. MONSTERS AND MIXTURESPoisso
- Page 332 and 333: 332 12. MONSTERS AND MIXTURESthe ga
- Page 334 and 335: 334 12. MONSTERS AND MIXTURESdata=d
- Page 336 and 337: 336 12. MONSTERS AND MIXTURESma2 ~
- Page 338 and 339: 338 13. MULTILEVEL MODELSrepeat obs
- Page 340 and 341: 340 13. MULTILEVEL MODELSSo how do
- Page 342 and 343: 342 13. MULTILEVEL MODELSprobabilit
- Page 344 and 345: 344 13. MULTILEVEL MODELSa conseque
- Page 346 and 347: 346 13. MULTILEVEL MODELSCompute th
- Page 348 and 349: 348 13. MULTILEVEL MODELSabsolute e
- Page 350 and 351: 350 13. MULTILEVEL MODELS)sigma_act
- Page 353 and 354: 14 Multilevel Models II: Slopes14.1
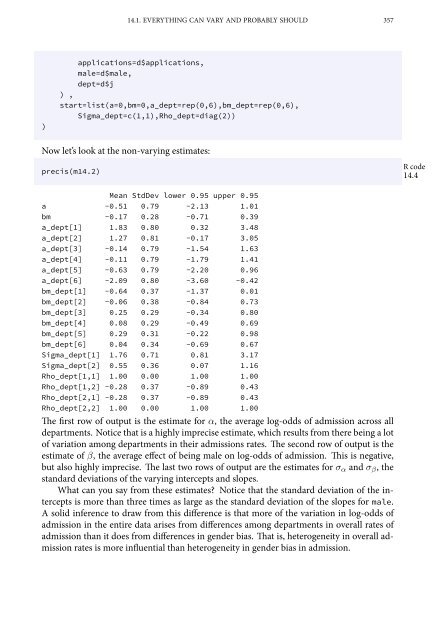
- Page 355: 14.1. EVERYTHING CAN VARY AND PROBA
- Page 360 and 361: 360 15. MISSING DATA AND OTHER OPPO
- Page 362 and 363: 362 15. MISSING DATA AND OTHER OPPO
- Page 364 and 365: 364 15. MISSING DATA AND OTHER OPPO
- Page 366 and 367: 366 15. MISSING DATA AND OTHER OPPO
- Page 368 and 369: 368 15. MISSING DATA AND OTHER OPPO
- Page 370 and 371: 370 15. MISSING DATA AND OTHER OPPO
- Page 372 and 373: 372 15. MISSING DATA AND OTHER OPPO
- Page 374 and 375: 374 15. MISSING DATA AND OTHER OPPO
- Page 376 and 377: 376 15. MISSING DATA AND OTHER OPPO
- Page 379: 16 Writing Statistics379
- Page 382 and 383: 382 ENDNOTES12. For an autopsy of t
- Page 384 and 385: 384 ENDNOTES45. Fisher (1925), in C
- Page 386 and 387: 386 ENDNOTES77. See two famous edit
- Page 388 and 389: 388 ENDNOTES113. Hurlbert (1984) is
- Page 390 and 391: 390 BibliographyFrank, S. A. (2011)
- Page 392 and 393: 392 BibliographyProulx, S. R. and A
- Page 395 and 396: IndexAkaike (1973), 380, 383Akaike
- Page 397: INDEX 397non-identifiability, 153Oc