Privatisation of Health Care in India - Indian Institute of Public ...
Privatisation of Health Care in India - Indian Institute of Public ...
Privatisation of Health Care in India - Indian Institute of Public ...
- No tags were found...

You also want an ePaper? Increase the reach of your titles
YUMPU automatically turns print PDFs into web optimized ePapers that Google loves.
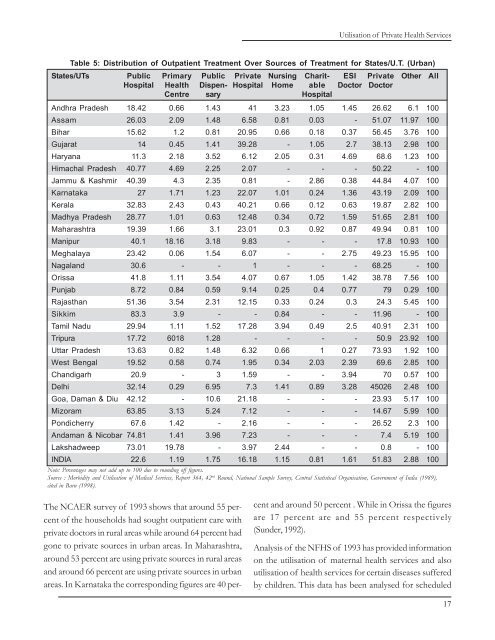
Utilisation <strong>of</strong> Private <strong>Health</strong> ServicesTable 5: Distribution <strong>of</strong> Outpatient Treatment Over Sources <strong>of</strong> Treatment for States/U.T. (Urban)States/UTs <strong>Public</strong> Primary <strong>Public</strong> Private Nurs<strong>in</strong>g Charit- ESI Private Other AllHospital <strong>Health</strong> Dispen- Hospital Home able Doctor DoctorCentre sary HospitalAndhra Pradesh 18.42 0.66 1.43 41 3.23 1.05 1.45 26.62 6.1 100Assam 26.03 2.09 1.48 6.58 0.81 0.03 - 51.07 11.97 100Bihar 15.62 1.2 0.81 20.95 0.66 0.18 0.37 56.45 3.76 100Gujarat 14 0.45 1.41 39.28 - 1.05 2.7 38.13 2.98 100Haryana 11.3 2.18 3.52 6.12 2.05 0.31 4.69 68.6 1.23 100Himachal Pradesh 40.77 4.69 2.25 2.07 - - - 50.22 - 100Jammu & Kashmir 40.39 4.3 2.35 0.81 - 2.86 0.38 44.84 4.07 100Karnataka 27 1.71 1.23 22.07 1.01 0.24 1.36 43.19 2.09 100Kerala 32.83 2.43 0.43 40.21 0.66 0.12 0.63 19.87 2.82 100Madhya Pradesh 28.77 1.01 0.63 12.48 0.34 0.72 1.59 51.65 2.81 100Maharashtra 19.39 1.66 3.1 23.01 0.3 0.92 0.87 49.94 0.81 100Manipur 40.1 18.16 3.18 9.83 - - - 17.8 10.93 100Meghalaya 23.42 0.06 1.54 6.07 - - 2.75 49.23 15.95 100Nagaland 30.6 - - 1 - - - 68.25 - 100Orissa 41.8 1.11 3.54 4.07 0.67 1.05 1.42 38.78 7.56 100Punjab 8.72 0.84 0.59 9.14 0.25 0.4 0.77 79 0.29 100Rajasthan 51.36 3.54 2.31 12.15 0.33 0.24 0.3 24.3 5.45 100Sikkim 83.3 3.9 - - 0.84 - - 11.96 - 100Tamil Nadu 29.94 1.11 1.52 17.28 3.94 0.49 2.5 40.91 2.31 100Tripura 17.72 6018 1.28 - - - - 50.9 23.92 100Uttar Pradesh 13.63 0.82 1.48 6.32 0.66 1 0.27 73.93 1.92 100West Bengal 19.52 0.58 0.74 1.95 0.34 2.03 2.39 69.6 2.85 100Chandigarh 20.9 - 3 1.59 - - 3.94 70 0.57 100Delhi 32.14 0.29 6.95 7.3 1.41 0.89 3.28 45026 2.48 100Goa, Daman & Diu 42.12 - 10.6 21.18 - - - 23.93 5.17 100Mizoram 63.85 3.13 5.24 7.12 - - - 14.67 5.99 100Pondicherry 67.6 1.42 - 2.16 - - - 26.52 2.3 100Andaman & Nicobar 74.81 1.41 3.96 7.23 - - - 7.4 5.19 100Lakshadweep 73.01 19.78 - 3.97 2.44 - - 0.8 - 100INDIA 22.6 1.19 1.75 16.18 1.15 0.81 1.61 51.83 2.88 100Note: Percentages may not add up to 100 due to round<strong>in</strong>g <strong>of</strong>f figures.Source : Morbidity and Utilisation <strong>of</strong> Medical Services, Report 364, 42 nd Round, National Sample Survey, Central Statistical Organisation, Government <strong>of</strong> <strong>India</strong> (1989),cited <strong>in</strong> Baru (1998).The NCAER survey <strong>of</strong> 1993 shows that around 55 percent<strong>of</strong> the households had sought outpatient care withprivate doctors <strong>in</strong> rural areas while around 64 percent hadgone to private sources <strong>in</strong> urban areas. In Maharashtra,around 53 percent are us<strong>in</strong>g private sources <strong>in</strong> rural areasand around 66 percent are us<strong>in</strong>g private sources <strong>in</strong> urbanareas. In Karnataka the correspond<strong>in</strong>g figures are 40 percentand around 50 percent . While <strong>in</strong> Orissa the figuresare 17 percent are and 55 percent respectively(Sunder, 1992).Analysis <strong>of</strong> the NFHS <strong>of</strong> 1993 has provided <strong>in</strong>formationon the utilisation <strong>of</strong> maternal health services and alsoutilisation <strong>of</strong> health services for certa<strong>in</strong> diseases sufferedby children. This data has been analysed for scheduled17