<strong>Privatisation</strong> <strong>of</strong> <strong>Health</strong> <strong>Care</strong> <strong>in</strong> <strong>India</strong>5.2. Utilisation <strong>of</strong> Inpatient ServicesWhen it comes to <strong>in</strong>patient services the picture is somewhatdifferent. An analysis <strong>of</strong> the 42 nd round <strong>of</strong> the NSSdata at the all <strong>India</strong> level reveals that only around 36 percent<strong>of</strong> the hospitalisations were <strong>in</strong> private hospitals <strong>in</strong> urbanareas and around 35 percent <strong>in</strong> rural areas. InMaharashtra, around 48 percent <strong>of</strong> the households hadused a private hospital <strong>in</strong> urban areas while <strong>in</strong> rural areasthe figure was around 54 percent. In Karnataka, around50 percent <strong>in</strong> urban areas and around 38 percent <strong>in</strong> ruralareas had used private sources for treatment. In Orissa,around 15 percent <strong>in</strong> urban and seven percent <strong>in</strong> rural areashad been treated <strong>in</strong> a private hospital (Tables 9 and 10).The 52 nd round <strong>of</strong> the NSS data shows that at the all <strong>India</strong>level 54.7 percent <strong>of</strong> households <strong>in</strong> rural areas and 56.9percent <strong>in</strong> urban areas had utilised private hospitals forhospitalisation. There has def<strong>in</strong>itely been an <strong>in</strong>crease <strong>in</strong> theproportion <strong>of</strong> persons utilis<strong>in</strong>g the private sector betweenthe 42 nd and 52 nd rounds <strong>of</strong> the NSS, which is roughlyover a decade.In Maharashtra, 68.8 percent <strong>in</strong> rural areas and 68.2 <strong>in</strong> urbanareas had utilised private sources. In Karnataka, 54.2percent <strong>in</strong> rural areas and 70.2 <strong>in</strong> urban areas had utilisedprivate sources. In Orissa, 9.4 percent <strong>in</strong> rural areas and 19percent <strong>in</strong> urban areas had utilised private sources. Apartfrom the <strong>in</strong>ter-state differences <strong>in</strong> the utilisation <strong>of</strong> the privatesector there is also a difference between the poorestand richest qu<strong>in</strong>tiles. An analysis <strong>of</strong> the 52 nd round <strong>of</strong> theNSS shows an <strong>in</strong>terest<strong>in</strong>g picture that at the all <strong>India</strong> level39 percent <strong>of</strong> the poorest qu<strong>in</strong>tile were us<strong>in</strong>g the privatesector for hospitalisation while 77 percent <strong>of</strong> the richestqu<strong>in</strong>tile were utilis<strong>in</strong>g the private sector. Among the threestates, the poorest <strong>in</strong> Orissa relied more on the public sectorthan either Karnataka or Maharashtra. In many states,the middle and lower middle <strong>in</strong>come groups have startedus<strong>in</strong>g the private sector while the poor still cont<strong>in</strong>ue to relyon public hospitals. Therefore, there is a clear <strong>in</strong>dicationthat the utilisation <strong>of</strong> the private sector <strong>in</strong>creases as the<strong>in</strong>come gradient <strong>in</strong>creases. As far as the vulnerable sectionsviz. SCs and STs are concerned, utilisation by STs is verylow <strong>in</strong> both the public and private sectors while <strong>in</strong> the case<strong>of</strong> SCs it is marg<strong>in</strong>ally higher and the dependence is greateron the public than the private sector.The NCAER survey on the utilisation <strong>of</strong> <strong>in</strong>patient careshows that 38 percent <strong>of</strong> people <strong>in</strong> rural areas and 40 percent<strong>in</strong> urban areas opt for private sources at the all <strong>India</strong>level. In Maharashtra, 69.5 percent <strong>of</strong> people <strong>in</strong> rural areasand 41.2 percent <strong>in</strong> urban areas opted for private sources.In Karnataka, 38.9 percent and 42.2 percent opted for privatesources <strong>in</strong> rural and urban areas respectively. In Orissa,a mere 1.9 percent <strong>of</strong> people <strong>in</strong> rural areas and 31.3 <strong>in</strong>urban areas opted for private sources (Sunder, 1992).While there is some variation between the f<strong>in</strong>d<strong>in</strong>gs <strong>of</strong> NSSand NCAER surveys across the three states, it also broadlyreflects the structures <strong>of</strong> provision<strong>in</strong>g <strong>in</strong> terms <strong>of</strong> privateand public sectors <strong>in</strong> these three states. Maharashtra has ahigher proportion <strong>of</strong> private beds, followed by Karnatakaand lastly Orissa, which is clearly reflected <strong>in</strong> the utilisationpatterns as well. The important issue to be underscored isthat <strong>in</strong> all three states there is dependence on the publicsector, especially for <strong>in</strong>patient care, but the degree <strong>of</strong> dependencevaries across these states.The NFHS also provides data on the proportion <strong>of</strong> deliveriestak<strong>in</strong>g place <strong>in</strong> <strong>in</strong>stitutions. Invariably, they are quitelow among the vulnerable sections. At the all <strong>India</strong> level,10.9 percent <strong>of</strong> the SCs used public hospitals while a mere5.1 percent used a private hospital. Among the STs, 6.7percent used public hospitals and 2.4 percent private hospitals.Among the category <strong>of</strong> ‘others’ 16.3 percent usedthe public sector while 12.9 percent used the private sector.Non-<strong>in</strong>stitutional or home deliveries formed a highproportion with 82.7 percent, 89.6 percent and 69.9 percent<strong>of</strong> SCs, STs and ‘others’ respectively (Table 11). InKarnataka, the proportion <strong>of</strong> SCs access<strong>in</strong>g private facilitieswas only 4.4 percent while for STs it was 4.5 percent. In Orissa,a mere 0.7 percent <strong>of</strong> SCs and 1.3 percent <strong>of</strong> STs were us<strong>in</strong>gprivate facilities. However <strong>in</strong> Maharashtra, 16.6 percent <strong>of</strong> SCsand 6.1 percent <strong>of</strong> STs were us<strong>in</strong>g private facilities for deliveries.The proportion <strong>of</strong> home deliveries is high <strong>in</strong> Orissa with86.1 percent for SCs, 92.4 percent for STs and 80.6 percentfor others. In Karnataka, 77.8 percent <strong>of</strong> SCs, 73.2 percent <strong>of</strong>STs and 58.2 percent <strong>of</strong> others had deliveries at home. InMaharashtra, 55.2 percent <strong>of</strong> SCs, 82.2 percent and 51.7 percent<strong>of</strong> others had home deliveries (Table 11).20
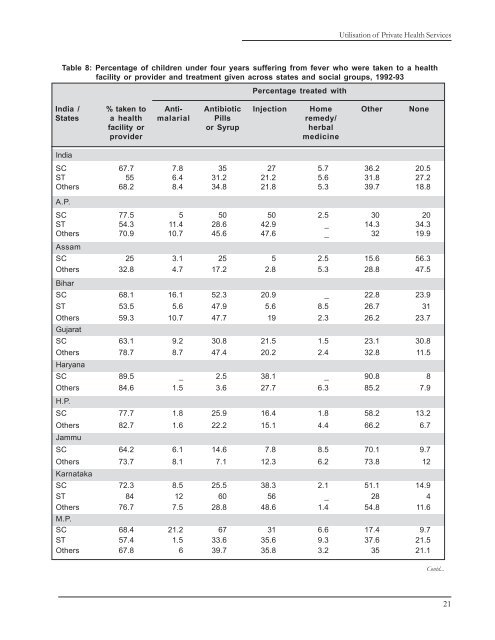
Utilisation <strong>of</strong> Private <strong>Health</strong> ServicesTable 8: Percentage <strong>of</strong> children under four years suffer<strong>in</strong>g from fever who were taken to a healthfacility or provider and treatment given across states and social groups, 1992-93Percentage treated with<strong>India</strong> / % taken to Anti- Antibiotic Injection Home Other NoneStates a health malarial Pills remedy/facility or or Syrup herbalprovidermedic<strong>in</strong>e<strong>India</strong>SC 67.7 7.8 35 27 5.7 36.2 20.5ST 55 6.4 31.2 21.2 5.6 31.8 27.2Others 68.2 8.4 34.8 21.8 5.3 39.7 18.8A.P.SC 77.5 5 50 50 2.5 30 20ST 54.3 11.4 28.6 42.9 _ 14.3 34.3Others 70.9 10.7 45.6 47.6 _ 32 19.9AssamSC 25 3.1 25 5 2.5 15.6 56.3Others 32.8 4.7 17.2 2.8 5.3 28.8 47.5BiharSC 68.1 16.1 52.3 20.9 _ 22.8 23.9ST 53.5 5.6 47.9 5.6 8.5 26.7 31Others 59.3 10.7 47.7 19 2.3 26.2 23.7GujaratSC 63.1 9.2 30.8 21.5 1.5 23.1 30.8Others 78.7 8.7 47.4 20.2 2.4 32.8 11.5HaryanaSC 89.5 _ 2.5 38.1 _ 90.8 8Others 84.6 1.5 3.6 27.7 6.3 85.2 7.9H.P.SC 77.7 1.8 25.9 16.4 1.8 58.2 13.2Others 82.7 1.6 22.2 15.1 4.4 66.2 6.7JammuSC 64.2 6.1 14.6 7.8 8.5 70.1 9.7Others 73.7 8.1 7.1 12.3 6.2 73.8 12KarnatakaSC 72.3 8.5 25.5 38.3 2.1 51.1 14.9ST 84 12 60 56 _ 28 4Others 76.7 7.5 28.8 48.6 1.4 54.8 11.6M.P.SC 68.4 21.2 67 31 6.6 17.4 9.7ST 57.4 1.5 33.6 35.6 9.3 37.6 21.5Others 67.8 6 39.7 35.8 3.2 35 21.1Contd...21