Privatisation of Health Care in India - Indian Institute of Public ...
Privatisation of Health Care in India - Indian Institute of Public ...
Privatisation of Health Care in India - Indian Institute of Public ...
- No tags were found...

You also want an ePaper? Increase the reach of your titles
YUMPU automatically turns print PDFs into web optimized ePapers that Google loves.
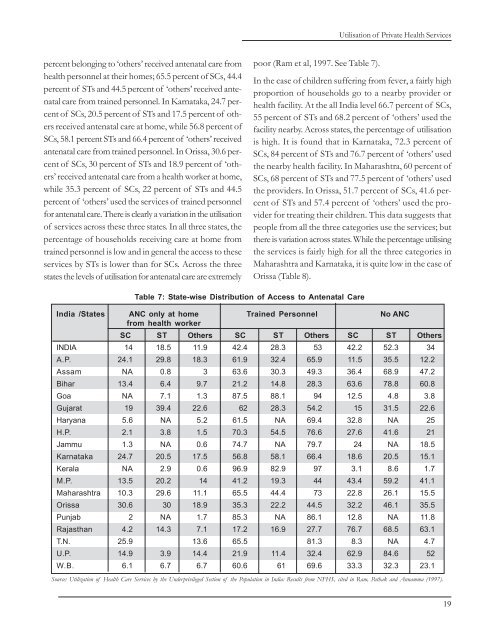
Utilisation <strong>of</strong> Private <strong>Health</strong> Servicespercent belong<strong>in</strong>g to ‘others’ received antenatal care fromhealth personnel at their homes; 65.5 percent <strong>of</strong> SCs, 44.4percent <strong>of</strong> STs and 44.5 percent <strong>of</strong> ‘others’ received antenatalcare from tra<strong>in</strong>ed personnel. In Karnataka, 24.7 percent<strong>of</strong> SCs, 20.5 percent <strong>of</strong> STs and 17.5 percent <strong>of</strong> othersreceived antenatal care at home, while 56.8 percent <strong>of</strong>SCs, 58.1 percent STs and 66.4 percent <strong>of</strong> ‘others’ receivedantenatal care from tra<strong>in</strong>ed personnel. In Orissa, 30.6 percent<strong>of</strong> SCs, 30 percent <strong>of</strong> STs and 18.9 percent <strong>of</strong> ‘others’received antenatal care from a health worker at home,while 35.3 percent <strong>of</strong> SCs, 22 percent <strong>of</strong> STs and 44.5percent <strong>of</strong> ‘others’ used the services <strong>of</strong> tra<strong>in</strong>ed personnelfor antenatal care. There is clearly a variation <strong>in</strong> the utilisation<strong>of</strong> services across these three states. In all three states, thepercentage <strong>of</strong> households receiv<strong>in</strong>g care at home fromtra<strong>in</strong>ed personnel is low and <strong>in</strong> general the access to theseservices by STs is lower than for SCs. Across the threestates the levels <strong>of</strong> utilisation for antenatal care are extremelypoor (Ram et al, 1997. See Table 7).In the case <strong>of</strong> children suffer<strong>in</strong>g from fever, a fairly highproportion <strong>of</strong> households go to a nearby provider orhealth facility. At the all <strong>India</strong> level 66.7 percent <strong>of</strong> SCs,55 percent <strong>of</strong> STs and 68.2 percent <strong>of</strong> ‘others’ used thefacility nearby. Across states, the percentage <strong>of</strong> utilisationis high. It is found that <strong>in</strong> Karnataka, 72.3 percent <strong>of</strong>SCs, 84 percent <strong>of</strong> STs and 76.7 percent <strong>of</strong> ‘others’ usedthe nearby health facility. In Maharashtra, 60 percent <strong>of</strong>SCs, 68 percent <strong>of</strong> STs and 77.5 percent <strong>of</strong> ‘others’ usedthe providers. In Orissa, 51.7 percent <strong>of</strong> SCs, 41.6 percent<strong>of</strong> STs and 57.4 percent <strong>of</strong> ‘others’ used the providerfor treat<strong>in</strong>g their children. This data suggests thatpeople from all the three categories use the services; butthere is variation across states. While the percentage utilis<strong>in</strong>gthe services is fairly high for all the three categories <strong>in</strong>Maharashtra and Karnataka, it is quite low <strong>in</strong> the case <strong>of</strong>Orissa (Table 8).Table 7: State-wise Distribution <strong>of</strong> Access to Antenatal <strong>Care</strong><strong>India</strong> /States ANC only at home Tra<strong>in</strong>ed Personnel No ANCfrom health workerSC ST Others SC ST Others SC ST OthersINDIA 14 18.5 11.9 42.4 28.3 53 42.2 52.3 34A.P. 24.1 29.8 18.3 61.9 32.4 65.9 11.5 35.5 12.2Assam NA 0.8 3 63.6 30.3 49.3 36.4 68.9 47.2Bihar 13.4 6.4 9.7 21.2 14.8 28.3 63.6 78.8 60.8Goa NA 7.1 1.3 87.5 88.1 94 12.5 4.8 3.8Gujarat 19 39.4 22.6 62 28.3 54.2 15 31.5 22.6Haryana 5.6 NA 5.2 61.5 NA 69.4 32.8 NA 25H.P. 2.1 3.8 1.5 70.3 54.5 76.6 27.6 41.6 21Jammu 1.3 NA 0.6 74.7 NA 79.7 24 NA 18.5Karnataka 24.7 20.5 17.5 56.8 58.1 66.4 18.6 20.5 15.1Kerala NA 2.9 0.6 96.9 82.9 97 3.1 8.6 1.7M.P. 13.5 20.2 14 41.2 19.3 44 43.4 59.2 41.1Maharashtra 10.3 29.6 11.1 65.5 44.4 73 22.8 26.1 15.5Orissa 30.6 30 18.9 35.3 22.2 44.5 32.2 46.1 35.5Punjab 2 NA 1.7 85.3 NA 86.1 12.8 NA 11.8Rajasthan 4.2 14.3 7.1 17.2 16.9 27.7 76.7 68.5 63.1T.N. 25.9 13.6 65.5 81.3 8.3 NA 4.7U.P. 14.9 3.9 14.4 21.9 11.4 32.4 62.9 84.6 52W.B. 6.1 6.7 6.7 60.6 61 69.6 33.3 32.3 23.1Source: Utilization <strong>of</strong> <strong>Health</strong> <strong>Care</strong> Services by the Underprivileged Section <strong>of</strong> the Population <strong>in</strong> <strong>India</strong>: Results from NFHS, cited <strong>in</strong> Ram, Pathak and Annamma (1997).19