Decision curve analysis
Decision curve analysis
Decision curve analysis
- No tags were found...
Create successful ePaper yourself
Turn your PDF publications into a flip-book with our unique Google optimized e-Paper software.
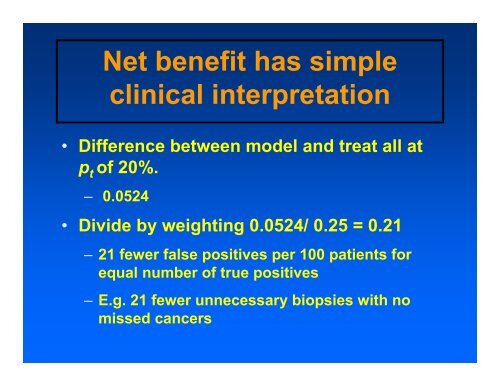
Net benefit has simpleclinical interpretation• Difference between model and treat all atp t of 20%.– 0.0524• Divide by weighting 0.0524/ 0.25 = 0.21– 21 fewer false positives per 100 patients forequal number of true positives– E.g. 21 fewer unnecessary biopsies with nomissed cancers


