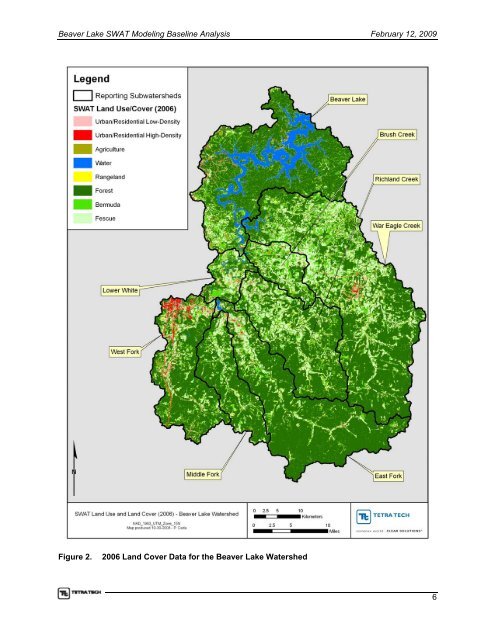
Beaver Lake <strong>SWAT</strong> <strong>Model</strong>ing Baseline Analysis February 12, 2009Figure 2.2006 Land Cover Data for the Beaver Lake Watershed6
Beaver Lake <strong>SWAT</strong> <strong>Model</strong>ing Baseline Analysis February 12, 20091.3 POINT SOURCE ASSUMPTIONS FOR EXISTING CONDITIONSThree major point sources exist in the Beaver Lake watershed. These include the City of Fayetteville’sNoland Wastewater Treatment Plant (WWTP) (Outfall 1), the City of Huntsville’s WWTP, and the Cityof West Fork’s WWTP ( Table 3).Table 3.Point Source Discharges Included in the Beaver Lake <strong>SWAT</strong> <strong>Model</strong>Facility NameNPDESPermitNumberReceiving WatersDesignFlow(MGD)1995-2006AverageFlow(MGD)NPDESClassCountyCity of HuntsvilleAR0022004Town Branch ofHolman Cr.,tributary to WarEagle Creek2.0 1.18 Major MadisonCity of Fayetteville AR0020010 White River 12.0 6.9 Major WashingtonCity of West ForkAR0022373West Fork of theWhite River0.1 0.14 Minor WashingtonPoint source data for the model period January 1995 to December 2006 were <strong>com</strong>piled as monthlyaverages from either the existing point source model files or USEPA’s Permit Compliance System (PCS)database (including the PCS data in the “Beaver pointsources.xls” source file provided by the Universityof Arkansas). Much of the data in the existing model input files, which extended through November2004, did not contain measured values for many of the required model input parameters (i.e., flow, TSS,organic nitrogen, ammonia nitrogen (NH 3 ), nitrate (NO 3 ), nitrite (NO 2 ), organic phosphorus, and solublephosphorus). These missing values were patched using the following methodology:• For parameters with a significant number of observed values, monthly averages were calculatedand used to fill missing dates.• For point sources with no observed data, average concentrations from the City ofHuntsville’s WWTP were used to calculate monthly loads (particularly for NO 2 and NO 3 ).• Organic fractions of phosphorus and nitrogen were calculated from typical ratios to totalphosphorus and total nitrogen found in the literature (USEPA, 1997).To extend the existing point source files through December 2006, data was downloaded from PCS whenavailable, or patched with monthly averages as described above.Two sets of files were generated to represent WWTP discharges under existing conditions. For the modelcalibration, measured or estimated flows and loads were used to estimate loads as they were dischargedfrom 1995 through 2006. To simulate average existing conditions for <strong>com</strong>parison to the future scenario,an average value (of each parameter at each WWTP) was estimated for each month and repeated for eachof the 12 simulation years. For example, the flow discharged from the Noland WWTP in January of eachsimulation year equals the average of the flows discharged in January of 1995, 1996, 1997, etc.The point source data for existing conditions utilized observed data over a period of 12 years thatwitnessed population growth in each municipality which likely influenced total loading. However, mostof the observed data dating back to 1995 exhibited no visible trend as a function of population increase.Therefore, Tetra Tech calculated monthly average loads for each WWTP from the entire set of updatedvalues described above, which was then repeated each year for the 1995-2006 modeling period. Anobvious change in effluent loads did occur in 2001 for Huntsville’s NO 3 and Fayetteville’s NH 3 and total7