SWAT Model Recalibration - Tetratech-ffx.com
SWAT Model Recalibration - Tetratech-ffx.com
SWAT Model Recalibration - Tetratech-ffx.com
- No tags were found...

Create successful ePaper yourself
Turn your PDF publications into a flip-book with our unique Google optimized e-Paper software.
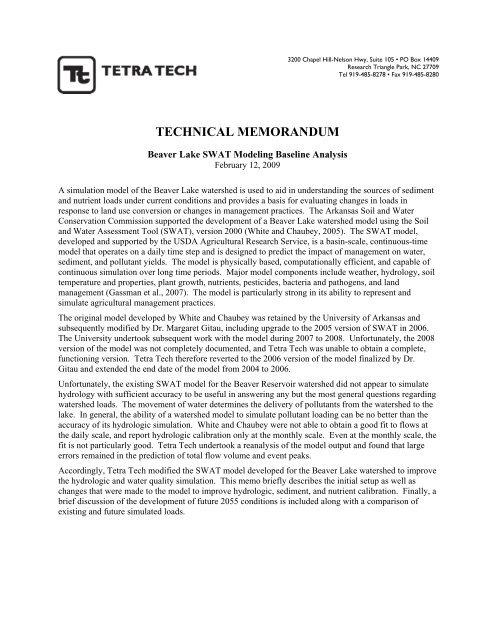
3200 Chapel Hill-Nelson Hwy, Suite 105 • PO Box 14409Research Triangle Park, NC 27709Tel 919-485-8278 • Fax 919-485-8280TECHNICAL MEMORANDUMBeaver Lake <strong>SWAT</strong> <strong>Model</strong>ing Baseline AnalysisFebruary 12, 2009A simulation model of the Beaver Lake watershed is used to aid in understanding the sources of sedimentand nutrient loads under current conditions and provides a basis for evaluating changes in loads inresponse to land use conversion or changes in management practices. The Arkansas Soil and WaterConservation Commission supported the development of a Beaver Lake watershed model using the Soiland Water Assessment Tool (<strong>SWAT</strong>), version 2000 (White and Chaubey, 2005). The <strong>SWAT</strong> model,developed and supported by the USDA Agricultural Research Service, is a basin-scale, continuous-timemodel that operates on a daily time step and is designed to predict the impact of management on water,sediment, and pollutant yields. The model is physically based, <strong>com</strong>putationally efficient, and capable ofcontinuous simulation over long time periods. Major model <strong>com</strong>ponents include weather, hydrology, soiltemperature and properties, plant growth, nutrients, pesticides, bacteria and pathogens, and landmanagement (Gassman et al., 2007). The model is particularly strong in its ability to represent andsimulate agricultural management practices.The original model developed by White and Chaubey was retained by the University of Arkansas andsubsequently modified by Dr. Margaret Gitau, including upgrade to the 2005 version of <strong>SWAT</strong> in 2006.The University undertook subsequent work with the model during 2007 to 2008. Unfortunately, the 2008version of the model was not <strong>com</strong>pletely documented, and Tetra Tech was unable to obtain a <strong>com</strong>plete,functioning version. Tetra Tech therefore reverted to the 2006 version of the model finalized by Dr.Gitau and extended the end date of the model from 2004 to 2006.Unfortunately, the existing <strong>SWAT</strong> model for the Beaver Reservoir watershed did not appear to simulatehydrology with sufficient accuracy to be useful in answering any but the most general questions regardingwatershed loads. The movement of water determines the delivery of pollutants from the watershed to thelake. In general, the ability of a watershed model to simulate pollutant loading can be no better than theaccuracy of its hydrologic simulation. White and Chaubey were not able to obtain a good fit to flows atthe daily scale, and report hydrologic calibration only at the monthly scale. Even at the monthly scale, thefit is not particularly good. Tetra Tech undertook a reanalysis of the model output and found that largeerrors remained in the prediction of total flow volume and event peaks.Accordingly, Tetra Tech modified the <strong>SWAT</strong> model developed for the Beaver Lake watershed to improvethe hydrologic and water quality simulation. This memo briefly describes the initial setup as well aschanges that were made to the model to improve hydrologic, sediment, and nutrient calibration. Finally, abrief discussion of the development of future 2055 conditions is included along with a <strong>com</strong>parison ofexisting and future simulated loads.
Beaver Lake <strong>SWAT</strong> <strong>Model</strong>ing Baseline Analysis February 12, 20091 Existing ConditionsTetra Tech received GIS files of modeling subwatersheds, 2006 land cover, and SSURGO soils data forthe Beaver Lake watershed from the University of Arkansas. The ArcView <strong>SWAT</strong> 2005 GIS interfacewas previously used to intersect the three coverages (subwatersheds, land cover, and soils) to generatehydrologic response units (HRUs). The interface also generates the input files needed to run the <strong>SWAT</strong>model.1.1 REPORTING WATERSHEDSThe <strong>SWAT</strong> modeling input and output data are discussed in this memo for eight reporting watersheds inthe Beaver Lake watershed. Figure 1 shows the areas <strong>com</strong>prising each reporting watershed. Note that theBeaver Lake reporting watershed is <strong>com</strong>prised of the area draining directly to the lake or one of itssmaller tributaries.2
Beaver Lake <strong>SWAT</strong> <strong>Model</strong>ing Baseline Analysis February 12, 2009Figure 1.Reporting Watersheds for the Beaver Lake Baseline Analysis3
Beaver Lake <strong>SWAT</strong> <strong>Model</strong>ing Baseline Analysis February 12, 20091.2 2006 LAND COVERTetra Tech received a coverage of the 2006 land cover for the Beaver Lake watershed from the Universityof Arkansas. Table 1 and Table 2 list the acreages and percentages, respectively, of the eight land usecategories. The majority of the land in the watershed (64.3 percent) is currently forested. Cool and warmseason pasture (fescue and Bermuda grass) make up 21.6 percent of the watershed area. Urban lowdensityand high-density development currently <strong>com</strong>prise 2.4 percent of the land use. The remaining 11.7percent of the watershed is in row crop agriculture, rangeland/ brush (primarily transitional cutover forestor abandoned pasture), or water. This information is displayed spatially in Figure 2.Table 1.Existing Land Use Acreages by Reporting WatershedReportingWatershedUrbanResidentialLowDensityUrbanResidentialHighDensityWaterAgricultureRangeland/BrushForestPasture,BermudaGrassPastureFescueTotalBrush Creek 354 107 939 85 2,178 11,567 4,605 8,639 28,474East Fork 1,111 237 945 433 5,243 103,144 5,644 9,462 126,218Beaver Lake 3,003 935 2,706 25,047 9,352 94,201 11,919 5,919 153,083Lower White 1,015 261 664 543 1,624 8,729 3,344 4,607 20,787Middle Fork 257 27 681 66 3,116 35,408 3,522 6,085 49,162Richland Creek 764 63 1,342 55 6,673 59,030 6,972 17,463 92,362War Eagle Creek 1,436 485 4,668 1,200 14,360 128,485 20,277 42,739 213,651West Fork 5,368 3,279 1,124 164 5,337 50,303 6,581 7,211 79,367Total 13,309 5,393 13,070 27,593 47,883 490,867 62,864 102,125 763,1034
Beaver Lake <strong>SWAT</strong> <strong>Model</strong>ing Baseline Analysis February 12, 2009Table 2.Existing Land Use Percentages by Reporting WatershedReportingWatershedUrbanResidentialLowDensity(%)UrbanResidentialHighDensity(%)Agriculture(%)Water(%)Rangeland/Brush(%)Forest(%)PastureBermudaGrass(%)PastureFescue(%)Percentof TotalArea (%)Brush Creek 1.2 0.4 3.3 0.3 7.6 40.6 16.2 30.3 3.7East Fork 0.9 0.2 0.7 0.3 4.2 81.7 4.5 7.5 16.5Beaver Lake 2.0 0.6 1.8 16.4 6.1 61.5 7.8 3.9 20.1Lower White 4.9 1.3 3.2 2.6 7.8 42.0 16.1 22.2 2.7Middle Fork 0.5 0.1 1.4 0.1 6.3 72.0 7.2 12.4 6.4Richland Creek 0.8 0.1 1.5 0.1 7.2 63.9 7.5 18.9 12.1War Eagle Creek 0.7 0.2 2.2 0.6 6.7 60.1 9.5 20.0 28.0West Fork 6.8 4.1 1.4 0.2 6.7 63.4 8.3 9.1 10.4Percent of TotalArea1.7 0.7 1.7 3.6 6.3 64.3 8.2 13.4 1005
Beaver Lake <strong>SWAT</strong> <strong>Model</strong>ing Baseline Analysis February 12, 2009Figure 2.2006 Land Cover Data for the Beaver Lake Watershed6
Beaver Lake <strong>SWAT</strong> <strong>Model</strong>ing Baseline Analysis February 12, 20091.3 POINT SOURCE ASSUMPTIONS FOR EXISTING CONDITIONSThree major point sources exist in the Beaver Lake watershed. These include the City of Fayetteville’sNoland Wastewater Treatment Plant (WWTP) (Outfall 1), the City of Huntsville’s WWTP, and the Cityof West Fork’s WWTP ( Table 3).Table 3.Point Source Discharges Included in the Beaver Lake <strong>SWAT</strong> <strong>Model</strong>Facility NameNPDESPermitNumberReceiving WatersDesignFlow(MGD)1995-2006AverageFlow(MGD)NPDESClassCountyCity of HuntsvilleAR0022004Town Branch ofHolman Cr.,tributary to WarEagle Creek2.0 1.18 Major MadisonCity of Fayetteville AR0020010 White River 12.0 6.9 Major WashingtonCity of West ForkAR0022373West Fork of theWhite River0.1 0.14 Minor WashingtonPoint source data for the model period January 1995 to December 2006 were <strong>com</strong>piled as monthlyaverages from either the existing point source model files or USEPA’s Permit Compliance System (PCS)database (including the PCS data in the “Beaver pointsources.xls” source file provided by the Universityof Arkansas). Much of the data in the existing model input files, which extended through November2004, did not contain measured values for many of the required model input parameters (i.e., flow, TSS,organic nitrogen, ammonia nitrogen (NH 3 ), nitrate (NO 3 ), nitrite (NO 2 ), organic phosphorus, and solublephosphorus). These missing values were patched using the following methodology:• For parameters with a significant number of observed values, monthly averages were calculatedand used to fill missing dates.• For point sources with no observed data, average concentrations from the City ofHuntsville’s WWTP were used to calculate monthly loads (particularly for NO 2 and NO 3 ).• Organic fractions of phosphorus and nitrogen were calculated from typical ratios to totalphosphorus and total nitrogen found in the literature (USEPA, 1997).To extend the existing point source files through December 2006, data was downloaded from PCS whenavailable, or patched with monthly averages as described above.Two sets of files were generated to represent WWTP discharges under existing conditions. For the modelcalibration, measured or estimated flows and loads were used to estimate loads as they were dischargedfrom 1995 through 2006. To simulate average existing conditions for <strong>com</strong>parison to the future scenario,an average value (of each parameter at each WWTP) was estimated for each month and repeated for eachof the 12 simulation years. For example, the flow discharged from the Noland WWTP in January of eachsimulation year equals the average of the flows discharged in January of 1995, 1996, 1997, etc.The point source data for existing conditions utilized observed data over a period of 12 years thatwitnessed population growth in each municipality which likely influenced total loading. However, mostof the observed data dating back to 1995 exhibited no visible trend as a function of population increase.Therefore, Tetra Tech calculated monthly average loads for each WWTP from the entire set of updatedvalues described above, which was then repeated each year for the 1995-2006 modeling period. Anobvious change in effluent loads did occur in 2001 for Huntsville’s NO 3 and Fayetteville’s NH 3 and total7
Beaver Lake <strong>SWAT</strong> <strong>Model</strong>ing Baseline Analysis February 12, 2009phosphorus, so those monthly averages were only calculated for 2001 and later. This second set ofaveraging allowed for a representative analysis of point source pollutant loading for the 2006 land useover the model period.1.4 PRECIPITATION AND TEMPERATURE DATAThe previous version of the <strong>SWAT</strong> model contained precipitation and temperature data for four weatherstations from January 1995 through November 2004. Tetra Tech extended these data files throughDecember 2006. The NCDC First Order Summary of the Day observations were used to obtain dailyrecords of precipitation as well as minimum and maximum temperatures at each station. Tetra Tech alsoused the NCDC data to patch data that was missing in 2003 and 2004 in the original weather files. Table4 summarizes the weather stations used for the Beaver Lake <strong>SWAT</strong> model, and Figure 3 shows thelocations of these stations relative to the watershed.Table 4.Characteristics of Weather Stations Used to Drive the Beaver Lake <strong>SWAT</strong> <strong>Model</strong>Station Name Station ID Elevation (m) Latitude LongitudeEureka Springs, 3 WNW 032356 433 36°25’N 93°48’WFayetteville Exp Station 032444 387 36°06’N 94°10’WHuntsville 1 SSW 033544 442 36°04’N 93°45’WMountainburg 2 NE 035018 242 35°39’N 94°09’W8
Beaver Lake <strong>SWAT</strong> <strong>Model</strong>ing Baseline Analysis February 12, 2009Figure 3.Location of the Four Weather Stations Used to Develop the <strong>SWAT</strong> <strong>Model</strong> for the BeaverLake Watershed9
Beaver Lake <strong>SWAT</strong> <strong>Model</strong>ing Baseline Analysis February 12, 2009The precipitation data were surveyed for <strong>com</strong>pleteness and errors. Small periods of data were patched byusing data from the next closest station, or the second closest station if necessary. The Fayetteville serieshad many data gaps; the worst gap was from October 2003 to February 2006. Data from Eureka Springsand Huntsville were used to replace missing data in the Fayetteville series. The monthly precipitationdata from the additional period (2004 through 2006) are shown in Figure 4.12.0010.00Inches/Month8.006.004.002.000.00Jan-04 Jul-04 Jan-05 Jul-05 Jan-06 Jul-06DateEureka Springs Fayetteville Huntsville MountainburgFigure 4. Monthly Precipitation for 2004 through 2006Figure 5 shows the annual rainfall at each station for each model year (1995 through 2006). The 30-yearhistorical averages (1971-2000) for each station are displayed as lines. Mountainburg regularly getsapproximately five more inches of rain per year than the other three stations. From this graph, it appearsthat all stations were significantly lower than their historical averages in 2005.10
Beaver Lake <strong>SWAT</strong> <strong>Model</strong>ing Baseline Analysis February 12, 200960Annual Cumulative Rain (inches)55504540353025EurekaFayettevilleHuntsvilleMountainburgEureka AverageFayetteville AverageHuntsville AverageMountainburg201994 1999 2004YearFigure 5.Annual Rainfall and Historical Average Annual Rainfall at Four Weather StationsThe average of the annual rainfall recorded at each station and the average historical annual rainfall areshown in Figure 6. In 2005, the average total rainfall at the four stations was 32.1 inches, 15.5 inchesbelow the historical annual average (47.5 inches); 2003 was also a dry year, 7.2 inches below average.Conditions in 1996 represent a wet year when the rainfall was 5.7 inches more than the historic average.60Average Annual Rainfall (inches)55504540353025201994 1996 1998 2000 2002 2004 2006YearHistoric Average RainfallAverage of 4 StationsFigure 6.Average Annual Rainfall and Historical Average Annual Rainfall for All Stations11
Beaver Lake <strong>SWAT</strong> <strong>Model</strong>ing Baseline Analysis February 12, 2009Temperature data from 2003 through 2006 were refined in a manner similar to the precipitation data.There were several week- and month-long gaps in the Eureka and Fayetteville series that could not bepatched in a timely manner. For model development purposes, the Huntsville data were used to representthe Eureka Springs station and the Mountainburg data were used to represent the Fayetteville station.Figure 7 shows the monthly average minimum and maximum temperatures at the Huntsville andMountainburg stations for 2003 through 2006.50.040.0Temperature (C)30.020.010.00.0-10.02003 2003 2004 2004 2005 2005 2006 2006Year033544 M inimum Average M onthly Temperature 033544 M aximum Average M onthly Temperature035018 M inimum Average M onthly Temperature 035018 Maximum Average M onthly TemperatureFigure 7.Minimum and Maximum Temperatures Recorded at the Huntsville (033544) andMountainburg (035018) Weather Stations from 2003 to 20061.5 CALIBRATION DATACalibration and validation of the model for hydrology and water quality were conducted at three USGSgage locations on White River, Richland Creek, and War Eagle Creek ( Figure 8). These stations providelong runs of both flow gaging and water quality monitoring. Coincident flow and water quality data areessential for the evaluation of loads.12
Beaver Lake <strong>SWAT</strong> <strong>Model</strong>ing Baseline Analysis February 12, 2009LegendUSGS GagesCounty BoundariesWater<strong>SWAT</strong> <strong>Model</strong> SubbasinsBentonCountyCarrollCounty070490000704860007048800WashingtonCountyCrawfordCountyFranklinCountyMadisonCountyJohnsonCountyPertinent USGS Stream Gages - Beaver Lake WatershedNAD_1983_UTM_Zone_15NMap produced 10-30-2008 - P. Cada0 2.5 5 10Kilometers0 2.5 5 10MilesFigure 8.Location of <strong>Model</strong> Calibration Gages in the Beaver Lake Watershed13
Beaver Lake <strong>SWAT</strong> <strong>Model</strong>ing Baseline Analysis February 12, 20092 Changes to Improve Hydrologic CalibrationThe version of the <strong>SWAT</strong> model received by Tetra Tech had been partially calibrated only to monthlyflows and generally underestimated total flow volumes and storm peaks. On review, some fundamentalflaws in the model setup, which affect both flow and water quality simulation, were detected and repaired.These include the following:• The first issue noted was the slope length, which describes the maximum distance water travelsbefore reaching a conveyance and forming concentrated flow. It is generally accepted that slopelengths should not exceed about 300 ft. Values of slope length are typically specified bymodeling subwatershed and are automatically generated by the <strong>SWAT</strong> GIS interface, although<strong>SWAT</strong> allows the user to specify these by land use as well. In the modeling input files that TetraTech received, slope lengths were varied primarily by land use and ranged from 0.1 ft to 3,162 ft.Many of the slope lengths specified were outside of normal range; further, the slope length shouldbe determined primarily by topography, not land use. Tetra Tech therefore reverted the model tothe slope lengths determined by the <strong>SWAT</strong> GIS interface.• Management files for agricultural land were malformed so that no fertilization took place,resulting in minimal crop growth and elevated erosion. The autofertilization option was thencorrectly formulated and tested to ensure that normal crop growth occured.• Management files for pervious developed land (lawns) had been set up to simulate continuoussummer growth (no mowing) followed by a harvest operation that removed all residue. Inessence, lawns were simulated as if they were hayed. This resulted in a situation in which therewas no erosion cover throughout the winter and early spring. These management files werereformulated to represent weekly mowing (with most residue left in place) followed by dormancy(rather than harvest) at the end of the growing season.• Management files for pasture land are set up for both fescue and Bermuda grass, the formerrepresenting cool season pasture and the latter warm season pasture. Both had been specifiedwith the same scheduling, resulting in fescue being grazed in the hot, rather than cool season.Bermuda grass grazing was also not consistent with the growth period. Further, harvest wasspecified immediately after grazing, resulting in minimal cover during the winter and spring.These management files were <strong>com</strong>pletely restructured. Fescue is simulated with two (spring andfall) growth periods, while Bermuda grass is now simulated as a warm season crop. Both includeone haying operation with some subsequent regrowth, rather than a single harvest and kill at theend of the growing season.To more accurately predict pollutant loading to the lake, Tetra Tech made additional improvements to thehydrologic simulation which resulted in a better estimate of daily flows. The following modificationswere made:• Decreased the groundwater delay from 31 days to 21 days to match the steeper recession of thebaseflow hydrographs observed at the three USGS stations. This change also resulted in lowerflows simulated in the 50 percent lowest flows category.• Decreased the surface runoff lag time from 12 to 3 days.• Increased the curve numbers for each land use to SCS values so that simulated storm volumes andtotal volumes more closely match those observed at the three USGS gages.• Changed the soil and plant evaporation/transpiration coefficients (ESCO and EPCO) to improvethe simulated seasonal averages and portion of flow allocated to shallow groundwater flow.14
Beaver Lake <strong>SWAT</strong> <strong>Model</strong>ing Baseline Analysis February 12, 2009• Decreased the fraction of losses to the deep groundwater zone from 0.05 to 0.01. Leaving flowsat 0.05 did not significantly lower the 50 percent lowest flows or summer flows and decreased thetotal and 10 percent highest flows, resulting in a less conservative model with regard to loaddelivery.The model output was processed in a hydrologic calibration spreadsheet developed by Tetra Tech that<strong>com</strong>pares daily simulated flow to average daily observed flow ( Table 5). This table <strong>com</strong>pares daily flowsby season, flow regime (low versus high), total flows, and storm flows and presents the <strong>com</strong>parison as anegative error (simulated flows are less than observed) or a positive error (simulated flows are greaterthan observed). The closer the error is to zero, the better the model fits to observed flows in that category.The last row in the error statistics table is the Nash-Sutcliffe coefficient of model fit efficiency for dailyflows: as these values approach 1.0, model fit improves. The table also contains tolerance ranges formodel fit that are often applied to watershed models. Values outside the range of re<strong>com</strong>mended criteriaare highlighted orange.Table 5. Hydrologic <strong>Model</strong> Fit Statistics, 1998-2006Parameter War Eagle Richland White River Re<strong>com</strong>mended CriteriaError in total volume: -5.92 1.57 -0.91 10Error in 50% lowest flows: 23.36 95.95 53.57 10Error in 10% highest flows: -5.04 -1.54 -12.32 15Seasonal volume error - Summer: 74.10 73.33 130.30 30Seasonal volume error - Fall: 7.40 42.24 14.39 30Seasonal volume error - Winter: -14.74 -1.20 -19.49 30Seasonal volume error - Spring: -18.21 -24.16 -15.02 30Error in storm volumes: 0.96 18.82 2.04 20Nash-Sutcliffe Coefficient of Efficiency, E:0.476 0.420 0.533<strong>Model</strong> accuracy increasesas E or E' approaches 1.0The revised model achieves the re<strong>com</strong>mended criteria for total volume, 10 percent highest flows, andstorm volumes. Because the intended use of this <strong>SWAT</strong> model is to <strong>com</strong>pare sediment and nutrientloading under existing and future scenarios, and the majority of loading to the lake occurs as a result ofrunoff events, Tetra Tech focused the hydrologic calibration efforts on the total and high flow volumes.The 50 percent lowest flows are still overestimated by the model, although these should not significantlyimpact loading to the lake. The discrepancy may be due to losses from the stream to karst. With theexception of the summer, most of the seasonal errors are within re<strong>com</strong>mended criteria. Given the limitedresources available to calibrate the model, Tetra Tech proceeded with the water quality calibration ratherthan trying to improve upon summer flow volumes and 50 percent lowest flows.Simulated flows on War Eagle Creek, Richland Creek, and the White River are <strong>com</strong>pared to flowsobserved at USGS gages 07049000, 07048800, and 07048600, respectively. A <strong>com</strong>parison of mean dailyflow is shown for each of the three gages in Figure 9 through Figure 11. Figure 12 through Figure 14show the correlation of observed and predicted annual flow volumes, with R 2 values ranging from 0.88 to0.93. Flow exceedance curves for each gage are also shown in Figure 15 through Figure 17.15
Beaver Lake <strong>SWAT</strong> <strong>Model</strong>ing Baseline Analysis February 12, 2009Avg Observed Flow (10/1/1998 to 12/31/2006 ) Avg <strong>Model</strong>ed Flow (Same Period)100000100001000100Flow (cfs)10110/1/984/1/9910/1/994/1/0010/1/004/1/0110/1/014/1/0210/1/024/1/0310/1/034/1/0410/1/044/1/0510/1/054/1/0610/1/06DateFigure 9. Mean Daily Observed and Simulated Flow on War Eagle CreekAvg Observed Flow (10/1/1998 to 12/31/2006 ) Avg <strong>Model</strong>ed Flow (Same Period)10000010000100010010Flow (cfs)10.110/1/984/1/9910/1/994/1/0010/1/004/1/0110/1/014/1/0210/1/024/1/0310/1/034/1/0410/1/044/1/0510/1/054/1/0610/1/06DateFigure 10. Mean Daily Observed and Simulated Flow on Richland Creek16
Beaver Lake <strong>SWAT</strong> <strong>Model</strong>ing Baseline Analysis February 12, 2009Avg Observed Flow (10/1/1998 to 12/31/2006 )Avg <strong>Model</strong>ed Flow (Same Period)10000010000Flow (cfs)10001001010.110/1/984/1/9910/1/994/1/0010/1/004/1/0110/1/014/1/0210/1/02Date4/1/0310/1/034/1/0410/1/044/1/0510/1/054/1/0610/1/06Figure 11. Mean Daily Observed and Simulated Flow on White River nr Fayetteville17
Beaver Lake <strong>SWAT</strong> <strong>Model</strong>ing Baseline Analysis February 12, 2009Avg Flow (10/1/1998 to 12/31/2006)Line of Equal ValueBest-Fit LineAverage <strong>Model</strong>ed Flow (cfs)8006004002000y = 0.5905x + 94.357R 2 = 0.9430 200 400 600 800Average Observed Flow (cfs)Figure 12. Annual Regression for War Eagle Creek, 1998-2006Avg Flow (10/1/1998 to 12/31/2006)Line of Equal ValueBest-Fit LineAverage <strong>Model</strong>ed Flow (cfs)5004003002001000y = 0.513x + 71.129R 2 = 0.86250 100 200 300 400 500Average Observed Flow (cfs)Figure 13. Annual Regression for Richland Creek, 1998-200618
Beaver Lake <strong>SWAT</strong> <strong>Model</strong>ing Baseline Analysis February 12, 2009Avg Flow (10/1/1998 to 12/31/2006)Line of Equal ValueBest-Fit LineAverage <strong>Model</strong>ed Flow (cfs)150010005000y = 0.5022x + 240.34R 2 = 0.92690 500 1000 1500Average Observed Flow (cfs)Figure 14. Annual Regression for White River nr Fayetteville, 1998-2006100000Observed Flow Duration (10/1/1998 to 12/31/2006 )<strong>Model</strong>ed Flow Duration (10/1/1998 to 12/31/2006 )Daily Average Flow (cfs)1000010001001010% 10% 20% 30% 40% 50% 60% 70% 80% 90% 100%Percent of Time that Flow is Equaled or ExceededFigure 15. Flow Exceedance Curves for Simulated and Observed Flows on War Eagle Creek19
Beaver Lake <strong>SWAT</strong> <strong>Model</strong>ing Baseline Analysis February 12, 2009100000Observed Flow Duration (10/1/1998 to 12/31/2006 )<strong>Model</strong>ed Flow Duration (10/1/1998 to 12/31/2006 )Daily Average Flow (cfs)1000010001001010.10% 10% 20% 30% 40% 50% 60% 70% 80% 90% 100%Percent of Time that Flow is Equaled or ExceededFigure 16. Flow Exceedance Curves for Simulated and Observed Flows on Richland Creek100000Observed Flow Duration (10/1/1998 to 12/31/2006 )<strong>Model</strong>ed Flow Duration (10/1/1998 to 12/31/2006 )Daily Average Flow (cfs)1000010001001010.10% 10% 20% 30% 40% 50% 60% 70% 80% 90% 100%Percent of Time that Flow is Equaled or ExceededFigure 17. Flow Exceedance Curves for Simulated and Observed Flows on White River nrFayetteville20
Beaver Lake <strong>SWAT</strong> <strong>Model</strong>ing Baseline Analysis February 12, 20093 Water Quality CalibrationOnce the hydrologic calibration of the <strong>SWAT</strong> model was acceptable, Tetra Tech modified the waterquality-related inputs with the goal of matching the pattern of observed loads versus flows as well as theaverage observed load at each USGS gage. For the lake model, the focus is on providing a reasonablerepresentation of loads.The most significant changes affecting the water quality calibration arise from the corrections to themodel setup flaws described in Section 2, including revision of the slope lengths and corrections to themanagement files. Modifications to improve hydrologic calibration also affect the water qualitycalibration.The following additional changes were made to further refine water quality simulation:• Set the groundwater nitrate and phosphorus concentrations to the average of values measuredduring baseflow conditions for each of the three USGS stations. These were previously set tozero.• Added an auto-fertilization function for nitrate on managed lands to prevent soil stores fromdecreasing to zero when manure/fertilizer is applied at phosphorus agronomic rates.• Turned on the subbasin and reach water quality simulations to account for kinetic and settlingprocesses.• Set the biological mixing coefficient to 0.8 to retain more nutrients in the organic form.• Set the peak rate adjustment factor for sediment routing in the tributaries and main channel to 2.0from 1.0.• Set the linear and exponential parameters for calculating the maximum amount of sediment thatcan be re-entrained during channel sediment routing to default values.• Set the channel erodibility factor to 0.05 and the channel cover coefficient to 1.0 for each reach.• Set the nitrogen and phosphorus percolation coefficients to the default values suggested by the<strong>SWAT</strong> manual.• Set the phosphorus uptake distribution parameter to the default value and the nitrogen uptakedistribution parameter to 10.• Set the phosphorus soil partitioning coefficient to default value.• Set the denitrification exponential rate coefficient to 3.0 and the denitrification threshold watercontent to 1.1.• Set the phosphorus sorption coefficient to 0.4.• Set the organic nitrogen enrichment ratios for subwatersheds draining to the Richland, West Fork,and War Eagle gages to 0.30, 0.50, and 0.05, respectively. All watersheds downstream of thegages have a value of 0.30.• Set the organic phosphorus enrichment ratios for subwatersheds draining to the Richland, WestFork, and War Eagle gages to 0.05, 0.35, and 0.35, respectively. All watersheds downstream ofthe gages have a value of 0.35.• Set the organic phosphorus settling rate in subwatersheds draining to the Richland, West Fork,and War Eagle gages to 1.5, 0.2, and 0.9 respectively. All watersheds downstream of the gageshave a value of 0.9.21
Beaver Lake <strong>SWAT</strong> <strong>Model</strong>ing Baseline Analysis February 12, 2009• Set the organic nitrogen settling rate to 0.001/d in drainages above the West Fork gage, to 0.002/din drainages above the Richland gage, to 1.0 in drainages above War Eagle gage, and to 0.002/din subwatersheds downstream of these three gages.• Set the rate constant for biological oxidation of ammonia to nitrate to 1.3/d in all subwatershedsexcept those upstream of the Richland gage where this value was set to 2.0/d.• All other values were set to default values suggested by the <strong>SWAT</strong> manual.The results of the water quality calibration for War Eagle Creek are shown in Table 6 and Figure 18through Figure 20. Results for West Fork are shown in Table 7 and Figure 21 through Figure 23. Table 8and Figure 24 through Figure 26 show the results for Richland Creek. For each station and parameter,simulated loads match observed values reasonably well.Table 6.Paired Simulated and Observed Average and Median Loads of Suspended Sediment,Total Phosphorus, and Total Nitrogen, War Eagle CreekSuspended Sediment(tons per day)Total Phosphorus(tons per day)Total Nitrogen(tons per day)Statistic Average Median Average Median Average MedianSimulated 90.0 4.4 0.08 0.005 2.50 0.22Observed 102.2 5.3 0.10 0.011 1.85 0.32War Eagle Creek, 1995 - 200610000010000SimulatedObservedSS Load, tons/day10001001010.10.010.01 0.1 1 10 100 1000Flow, cmsFigure 18. Simulated and Observed Suspended Sediment Loads, War Eagle Creek22
Beaver Lake <strong>SWAT</strong> <strong>Model</strong>ing Baseline Analysis February 12, 2009War Eagle Creek, 1995 - 200610010SimulatedObservedTP Load, tons/day10.10.010.001c0.00010.000010.01 0.1 1 10 100 1000Flow, cmsFigure 19. Simulated and Observed Phosphorus Loads, War Eagle CreekWar Eagle Creek, 1995 - 2006100SimulatedObserved10TN Load, tons/day10.10.010.0010.01 0.1 1 10 100 1000Flow, cms23
Beaver Lake <strong>SWAT</strong> <strong>Model</strong>ing Baseline Analysis February 12, 2009Figure 20. Simulated and Observed Nitrogen Loads, War Eagle CreekTable 7.Paired Simulated and Observed Average and Median Loads of Suspended Sediment,Total Phosphorus, and Total Nitrogen, White River near FayettevilleSuspended Sediment(tons per day)Total Phosphorus(tons per day)Total Nitrogen(tons per day)Statistic Average Median Average Median Average MedianSimulated 828 50 0.47 0.025 6.29 1.62Observed 733 10 0.56 0.015 5.20 0.67100000White River nr Fayetteville, 1995-2006100001000SimulatedObservedSS Load, tons/day1001010.10.010.0010.00010.01 0.1 1 10 100 1000Flow, cmsFigure 21. Simulated and Observed Suspended Sediment Loads, White River nr Fayetteville24
Beaver Lake <strong>SWAT</strong> <strong>Model</strong>ing Baseline Analysis February 12, 2009White River nr Fayetteville, 1995-200610010SimulatedObservedTP Load, tons/day10.10.010.0010.00010.000010.01 0.1 1 10 100 1000Flow, cmsFigure 22. Simulated and Observed Phosphorus Loads, White River nr FayettevilleWhite River nr Fayetteville, 1995-2006100001000TN Load, tons/day1001010.10.010.0010.01 0.1 1 10 100 1000Flow, cfsSimulated Observed Pow er (Simulated) Pow er (Observed)Figure 23. Simulated and Observed Nitrogen Loads, White River nr Fayetteville25
Beaver Lake <strong>SWAT</strong> <strong>Model</strong>ing Baseline Analysis February 12, 2009Table 8.Paired Simulated and Observed Average and Median Loads of Suspended Sediment,Total Phosphorus, and Total Nitrogen, Richland CreekSuspended Sediment(tons per day)Total Phosphorus(tons per day)Total Nitrogen(tons per day)Statistic Average Median Average Median Average MedianSimulated 61.9 1.45 0.064 0.0017 1.39 0.134Observed 85.8 1.70 0.054 0.0010 1.38 0.125Richland Creek, 1995 - 2006100001000100SimulatedObservedSS Load, tons/day1010.10.010.0010.00010.000010.0000010.00000010.0001 0.001 0.01 0.1 1 10 100 1000Flow, cmsFigure 24. Simulated and Observed Suspended Sediment Loads, Richland Creek26
Beaver Lake <strong>SWAT</strong> <strong>Model</strong>ing Baseline Analysis February 12, 2009Richland Creek, 1995 - 2006101SimulatedObservedTP Load, tons/day0.10.010.0010.00010.000010.0000010.00000010.001 0.01 0.1 1 10 100 1000Flow, cmsFigure 25. Simulated and Observed Phosphorus Loads, Richland CreekRichland Creek, 1995 - 20061000100SimulatedObservedTN Load, tons/day1010.10.010.0010.00010.000010.001 0.01 0.1 1 10 100 1000Flow, cmsFigure 26. Simulated and Observed Nitrogen Loads, Richland Creek27
Beaver Lake <strong>SWAT</strong> <strong>Model</strong>ing Baseline Analysis February 12, 20094 Development of the 2055 ScenarioFollowing the hydrologic and water quality calibration of the existing model, a future scenario wasdeveloped to represent expected conditions for the year 2055. This section describes the processes usedto generate a future land use coverage as well as future point source (WWTP) loadings.4.1 DEVELOPMENT OF THE 2055 LAND USE COVERAGEThe initial future land use coverage was based on multiple spatial coverages obtained from the BeaverWater District containing planning maps from the municipalities in the watershed. The following stepswere taken to process these planning maps into a single spatial coverage for HRU development underfuture conditions (intersection of subwatershed, future land use, and soil type). The resulting 2055 landuse coverage is shown in Figure 27.• All individual planning maps from the municipalities and counties were merged into one spatialcoverage that retained the original attributes (e.g., land use descriptions and the imperviousnessdata developed by Beaver Water District).• Gaps in the merged coverage due to roads outside the jurisdiction of the municipalities were filledappropriately (e.g., state maintained or private roads).• Based on the input parameters of the two developed land use classes used in the existing scenariomodel (urban low density URLD and urban high density URHD), a threshold was chosen toclassify future land use areas into either URLD or URHD. The threshold is the average of thepercent imperviousness of URLD (12 percent) and URHD (60 percent), or 36 percent.• All land uses classified by Beaver Water District as having imperviousness greater than 35percent were assigned to the URHD category.• All land uses classified with imperviousness greater than 0 percent and less than or equal to 35percent were assigned to the URLD category.• Areas not classified in the merged coverage were assigned the same land use as that assumed forthe existing model (no development).• All areas classified as URHD or water under the existing scenario retained that classification.28
Beaver Lake <strong>SWAT</strong> <strong>Model</strong>ing Baseline Analysis February 12, 2009LegendReporting Subwatersheds<strong>SWAT</strong> Land Use/Cover (2055)Beaver LakeUrban/Resid. Low-DensityUrban/Resid. High-DensityBrush CreekAgricultureWaterRangelandForestRichland CreekBermuda GrassFescue GrassWar Eagle CreekLower WhiteWest ForkMiddle ForkEast Fork<strong>SWAT</strong> Land Use and Land Cover (2055) - Beaver Lake WatershedNAD_1983_UTM_Zone_15NMap produced 10-30-2008 - P. Cada0 2.5 5 10Kilometers0 2.5 5 10MilesFigure 27. 2055 Land Cover Data for the Beaver Lake Watershed Based on Planning Maps29
Beaver Lake <strong>SWAT</strong> <strong>Model</strong>ing Baseline Analysis February 12, 2009Table 9 and Table 10 list the acreages and percentages, respectively of land uses in each reportingwatershed based on the planning maps for 2055. [The total area listed in Table 9 is less than that shownin the existing land use acreage table ( Table 1) because the edges of the planning maps do not extend<strong>com</strong>pletely to the boundary of the watershed area. This issue was addressed during post processing asexplained below.] The percent of forest and grassland under this initial estimate of future land use dropsto 21.4 percent and 2.2 percent, respectively. Low density urban development is assumed to <strong>com</strong>prisenearly 70 percent of the watershed area.Table 9.Initial Estimates of Future (2055) Land Use Acreages for Beaver Lake WatershedReportingWatershedUrbanResidentialLowDensityUrbanResidentialHighDensityWaterAgricultureRangeland/BrushForestPastureBermudaGrassPastureFescueTotalBrush Creek 25,853 107 89 85 234 1,362 351 393 28,474East Fork 55,863 675 198 433 1,743 64,251 1,481 1,469 126,112Beaver Lake 86,216 3,158 859 25,047 3,739 30,613 2,803 312 152,746Lower White 16,782 592 126 543 324 1,349 405 610 20,731Middle Fork 30,789 54 94 66 803 15,515 806 990 49,117Richland Creek 77,891 89 77 55 717 12,003 716 813 92,362War Eagle Creek 181,608 749 307 1,200 1,665 24,242 1,985 1,674 213,430West Fork 55,656 7,181 88 164 768 13,403 705 1,047 79,013Total 530,657 12,605 1,837 27,593 9,993 162,738 9,252 7,308 761,98530
Beaver Lake <strong>SWAT</strong> <strong>Model</strong>ing Baseline Analysis February 12, 2009Table 10.Initial Estimates of Future (2055) Land Use Percentages for Beaver Lake WatershedReportingWatershedUrbanResidentialLowDensity(%)UrbanResidentialHighDensity(%)Agriculture(%)Water(%)Rangeland/Brush(%)Forest(%)PastureBermudaGrass(%)PastureFescue(%)Brush Creek 90.8 0.4 0.3 0.3 0.8 4.8 1.2 1.4East Fork 44.3 0.5 0.2 0.3 1.4 50.9 1.2 1.2Beaver Lake 56.4 2.1 0.6 16.4 2.4 20.0 1.8 0.2Lower White 81.0 2.9 0.6 2.6 1.6 6.5 2.0 2.9Middle Fork 62.7 0.1 0.2 0.1 1.6 31.6 1.6 2.0Richland Creek 84.3 0.1 0.1 0.1 0.8 13.0 0.8 0.9War Eagle Creek 85.1 0.4 0.1 0.6 0.8 11.4 0.9 0.8West Fork 70.4 9.1 0.1 0.2 1.0 17.0 0.9 1.3Total 69.6 1.7 0.2 3.6 1.3 21.4 1.2 1.0Though the planning maps show that 70 percent of the watershed will be developed as low density urbandevelopment, according to discussions that occurred during the November TAG meeting, these areaswould not be developed to the extent that the <strong>SWAT</strong> model simulates low density development. Duringinitial setup, the urban low density category was defined as having an impervious percentage of 12percent. The Beaver Lake Water District provided Tetra Tech with a coverage of the expected percentimperviousness for the watershed in 2055 ( Figure 28). Much of the area defined in the planning maps aslow density urban development (URLD) (the pink area shown in Figure 27) is expected to be developedas large lots with a portion of the area remaining in the existing land use; in other words, some pastureand forest is expected to remain in the area shown as low density urban development.Tetra Tech post-processed the information from the planning maps to reassign area back to the existingland uses, rather than assume that 70 percent of the watershed would be developed as URLD. In essence,the estimates of future impervious area were used to determine the equivalent areas that would bedeveloped, assuming each lot, on average, contained 0.36 acres of imperviousness and 0.64 acres of lawn,with remaining area in the background land uses. Both URLD and URHD parcels are assumed to containpervious cover, represented as Bermuda grass with regular mowing, chemical fertilization instead ofmanure application, and no haying or grazing operations.The existing land uses underlying the URLD area shown on the planning map were tabulated by reportingwatershed to determine what proportion of the reverted land should be assigned to each existing land use.In addition, it was assumed that pasture land would be developed at twice the rate as forested areas sinceit is easier to develop previously cleared lands.Additionally, the planning maps had small gaps around the outer edges of the watershed boundary.[These gaps are not visible at the scale shown in Figure 27.] For these small areas that did not have aprojected future land use, the land use from the existing land use coverage was assumed for estimating the31
Beaver Lake <strong>SWAT</strong> <strong>Model</strong>ing Baseline Analysis February 12, 2009distribution of land use in 2055. Adding back in these missing areas results in a small increase in area forthe reporting watersheds and total watershed in Table 11 relative to Table 9 and results in the same areasas the existing modeling scenario.The results of the redistributed future land use acreages and percentages are shown in Table 11 and Table12, respectively. Following redistribution, over 55 percent of the watershed remains forested and 14.9percent remains as pasture (fescue or Bermuda grass). The percentage of land simulated as URLD for the2055 scenario is 17.6 percent.32
Beaver Lake <strong>SWAT</strong> <strong>Model</strong>ing Baseline Analysis February 12, 2009Figure 28. Projected Future (2055) Percent Imperviousness for the Beaver Lake Watershed33
Beaver Lake <strong>SWAT</strong> <strong>Model</strong>ing Baseline Analysis February 12, 2009Table 11.Revised Future (2055) Land Use Acreages for the Beaver Lake WatershedReportingWatershedUrbanResidentialLowDensityUrbanResidentialHighDensityWaterAgricultureRangeland/BrushForestPastureBermudaGrassPastureFescueTotalBrush Creek 4,403 107 850 85 1,971 10,485 3,696 6,876 28,474East Fork 8,820 690 855 433 4,821 98,503 4,612 7,484 126,218Beaver Lake 41,307 3,206 1,924 25,047 7,074 68,496 4,605 1,424 153,083Lower White 8,419 600 472 543 1,181 6,219 1,392 1,961 20,787Middle Fork 5,265 60 608 66 2,811 32,800 2,808 4,744 49,162Richland Creek 8,365 89 1,246 55 6,218 55,451 6,013 14,924 92,362War Eagle Creek 33,224 780 4,098 1,200 12,677 114,517 15,408 31,746 213,651West Fork 24,485 7,232 733 164 3,612 37,502 2,566 3,072 79,367Total 134,288 12,765 10,787 27,593 40,365 423,973 41,101 72,231 763,103Table 12.Revised Future (2055) Land Use Percentages for the Beaver Lake WatershedReportingWatershedUrbanResidentialLowDensityUrbanResidentialHighDensityWaterAgricultureRangeland/BrushForestPastureBermudaGrassPastureFescueBrush Creek 15.5 0.4 3.0 0.3 6.9 36.8 13.0 24.1East Fork 7.0 0.5 0.7 0.3 3.8 78.0 3.7 5.9Beaver Lake 27.0 2.1 1.3 16.4 4.6 44.7 3.0 0.9Lower White 40.5 2.9 2.3 2.6 5.7 29.9 6.7 9.4Middle Fork 10.7 0.1 1.2 0.1 5.7 66.7 5.7 9.6Richland Creek 9.1 0.1 1.3 0.1 6.7 60.0 6.5 16.2War Eagle Creek 15.6 0.4 1.9 0.6 5.9 53.6 7.2 14.9West Fork 30.9 9.1 0.9 0.2 4.6 47.3 3.2 3.9Total 17.6 1.7 1.4 3.6 5.3 55.6 5.4 9.534
Beaver Lake <strong>SWAT</strong> <strong>Model</strong>ing Baseline Analysis February 12, 20094.2 WWTP ASSUMPTIONS FOR FUTURE CONDITIONSTo account for population growth in the watershed as well as planned changes to the centralizedwastewater treatment plant facilities and infrastructure, point source input files were created for theFayetteville, Huntsville, and West Fork WWTPs to reflect conditions for the year 2055. The sewersystems for West Fork and Huntsville are assumed to expand to the future planning boundaries, andexcept for TP, effluent concentrations are not likely to decrease from the most recent observedconcentrations (personal <strong>com</strong>munication, Robert Morgan, Beaver Water District, November 6, 2008).For both West Fork and Huntsville, future plant upgrades are expected to limit TP effluent concentrationsto 1.0 mg/L. Fayetteville’s new WWTP that discharges to the Illinois River watershed is now online andwill handle all future flows from population growth. The current permitted flow rate will be decreased to11.2 MGD (current limit is 12.6 MGD) and remain at this level through the future modeling period.Every value for the existing conditions point source file was scaled from the 2006 average monthly flowto the 11.2 MGD maximum. To estimate the 2055 flows at West Fork and Huntsville (higher densitydevelopment buffer used as planning boundary), the future planning boundaries were intersected with theUS Census tracts and area-weighted for the projected 2055 population. Similar to Fayetteville’s futureflows, the forecasted flows for West Fork and Huntsville were set constant across all months and theaverage monthly TSS and TN loads from 2006 were increased proportionally to match the new flow rates.Since TP concentrations will likely be limited in the future to 1.0 mg/L at West Fork and HuntsvilleWWTPs, TP loads were also set constant in the future throughout the year with no seasonal variation.Table 13 summarizes the flows, concentrations, and loads assumed for each WWTP.Table 13.WWTP Discharges Under Existing and 2055 ScenariosHuntsville Fayetteville West ForkParameter Minimum Average Maximum Minimum Average Maximum Minimum Average MaximumExisting ScenarioFlow(MGD)1.06 1.18 1.33 3.89 6.93 9.20 0.11 0.14 0.175TN (kg/d) 19.1 31.2 46.8 114.7 205.3 274.3 5.4 6.0 6.6TN (mg/L) 4.5 7.0 9.3 7.6 7.8 8.5 10.2 11.5 12.8TP (kg/d) 10.9 19.7 28.1 5.2 8.9 11.5 2.2 2.7 3.3TP (mg/L) 2.6 4.5 7.0 0.2 0.3 0.5 5.1 5.1 5.12055 ScenarioFlow(MGD)2.0 2.0 2.0 11.2 11.2 11.2 1.2 1.2 1.2TN (kg/d) 30.4 49.5 74.4 320.9 331.3 361.4 46.1 52.0 58.0TN (mg/L) 4.5 7.0 9.3 7.6 7.8 8.5 10.2 11.5 12.8TP (kg/d) 7.6 7.6 7.6 10.4 14.6 21.3 4.5 4.5 4.5TP (mg/L) 1.0 1.0 1.0 0.2 0.3 0.5 1.0 1.0 1.035
Beaver Lake <strong>SWAT</strong> <strong>Model</strong>ing Baseline Analysis February 12, 20095 Comparison of Existing and 2055 ScenariosTetra Tech’s version of the <strong>SWAT</strong> model for the Beaver Lake watershed was used to <strong>com</strong>pare sedimentand nutrient loading under existing and future conditions. Loads generated in each of eight reportingwatersheds are <strong>com</strong>pared for sediment, total phosphorus, and total nitrogen.A <strong>com</strong>parison of the existing and future land use <strong>com</strong>position is shown in Figure 29. The pie chartclassifications aggregate rangeland into the forest category and show Bermuda and fescue together aspasture. The percent of land as forest/range land/brush in the watershed is expected to decrease from 70percent under current conditions to 60 percent under the future scenario. Agricultural areas will likelydecrease from 2 percent to 1 percent. The area currently in pasture is assumed to decrease from 21percent to 15 percent. Low density urban development increases from 2 percent to 18 percent, and highdensity urban development increases from 1 percent to 2 percent.Existing (2006)Future (2055)Urban/HighDensityLow Density 1%2%Pasture21%Agriculture2%Water4%Pasture15%Low Density18% Urban/HighDensity2%Agriculture1%Water4%Forest70%Forest60%Figure 29. Comparison of Existing and Future Land Use CompositionTable 14 shows the percent change in land use area from existing to future conditions. The acreage offorest/rangeland/brush decreases by 14 percent and the acreage of pastureland decreases by 31 percent.The acreage of land used for agricultural production decreases by 17 percent. The acreages of lowdensity and high density urban development increase by 909 percent and 137 percent, respectively.36
Beaver Lake <strong>SWAT</strong> <strong>Model</strong>ing Baseline Analysis February 12, 2009Table 14.Percent Change in Land Use from Existing to Future ConditionsReportingWatershedUrbanResidentialLowDensity (%)UrbanResidentialHighDensity (%)Agriculture(%)Water(%)Forest(includesRangeland/Brush) (%)Pasture(Bermuda/Fescue) (%)Brush Creek 1,143 0 -9 0 -9 -20East Fork 694 192 -10 0 -5 -20Beaver Lake 1,275 243 -29 0 -27 -66Lower White 730 130 -29 0 -29 -58Middle Fork 1,945 123 -11 0 -8 -21Richland Creek 995 43 -7 0 -6 -14War Eagle Creek 2,214 61 -12 0 -11 -25West Fork 356 121 -35 0 -26 -59Total 909 137 -17 0 -14 -31Table 15 <strong>com</strong>pares the existing and future (2055) upland and point source sediment loads delivered toBeaver Lake from each reporting watershed. The total delivered upland sediment load in the watershed ispredicted to increase by 26 percent with most of the increase occurring in the Beaver Lake, Lower WhiteRiver and War Eagle Creek reporting watersheds. As expected, point source sediment loads ( Table 16)are insignificant when <strong>com</strong>pared with upland sources. The upland loads addressed by the model ( Table16) do not include loads derived from construction or roads, and these load sources would need to beincluded to provide a more <strong>com</strong>plete picture of total loads and source contributions. (Note: Supplementalanalysis is being performed by Tetra Tech to help address this gap for <strong>com</strong>pleting a baseline pollutantloading analysis.)Also, additional sediment loads derived from channel erosion were approximated for the entire watershedby post-processing the <strong>SWAT</strong> modeling results for channel delivery. For existing conditions, estimatedsediment loading from channel erosion is approximately twice the loading estimated from uplands andpoint sources (i.e., 137,400 tons/yr <strong>com</strong>pared to 73,513 tons/yr). Contributions from construction sitesand roads are also expected to be large relative to upland loads based on supplemental analyses outside ofthis <strong>SWAT</strong> modeling.37
Beaver Lake <strong>SWAT</strong> <strong>Model</strong>ing Baseline Analysis February 12, 2009Table 15.Existing and Future (2055) Upland Sediment Loads Delivered to Beaver LakeNameExisting Load(US tons/yr)Future Load(US tons/yr)Difference(Future - Existing)Percent ChangeBrush Creek 3,624 4,246 622 17.2%East Fork 3,322 3,393 71 2.1%Beaver Lake 33,206 43,575 10,369 31.2%Lower White 2,715 3,793 1,078 39.7%Middle Fork 2,709 2,816 107 3.9%Richland Creek 7,834 8,744 910 11.6%War Eagle Creek 14,211 20,440 6,229 43.8%West Fork 5,892 5,876 -16 -0.3%Total Load 73,513 92,882 19,370 26.3%Note: Does not include estimates of sediment load from construction sites, roads, and instream channel erosion.Table 16.Sources of Existing and Future (2055) Upland Sediment Loads Delivered to BeaverLakeSourceExisting Load(tons/yr)Future Load(tons/yr)Difference(Future - Existing)Percent ChangeCropland 15,610 12,273 -3,337 -21.4%Pasture 21,810 13,639 -8,171 -37.5%Forest 20,510 16,138 -4,372 -21.3%Range Brush 12,690 10,177 -2,513 -19.8%Urban Low Density 2,231 38,936 36,705 1,645%Urban High Density 628 1,661 1,033 164.5%Point Sources 34 59 25 73.5%Total 73,513 92,883 19,370 26.3%Note: Does not include estimates of sediment load from construction sites, roads, and instream channel erosion.Table 17 summarizes the existing and future upland phosphorus loads delivered to Beaver Lake,including point sources, where applicable, while Table 18 summarizes the upland load sources.Phosphorus load delivered to the lake is predicted to remain nearly stable, declining by 1,004 lbs/yr.Loading from nonpoint sources is predicted to increase by 2,687 lbs/yr, but is offset by a decline in pointsource loads associated with new permit limits for West Fork and Huntsville WWTPs. As with the38
Beaver Lake <strong>SWAT</strong> <strong>Model</strong>ing Baseline Analysis February 12, 2009sediment analysis, the totals presented here do not include any loads of sediment-sorbed phosphorus thatwould be associated with erosion from construction or roads.Table 17.Existing and Future (2055) Upland Phosphorus Loads Delivered to Beaver LakeNameExisting Load(US lbs/yr)Future Load(US lbs/yr)Difference(Future - Existing)Percent ChangeBrush Creek 3,059 2,934 -125 -4.1%East Fork 2,793 2,739 -54 -1.9%Beaver Lake 7,853 10,802 2,949 37.6%Lower White 9,372 13,693 4,321 46.1%Middle Fork 2,274 2,204 -70 -3.1%Richland Creek 3,925 3,774 -151 -3.8%War Eagle Creek 24,568 15,346 -9,222 -37.5%West Fork 6,132 7,480 1,348 22.0%Total Load 59,976 58,972 -1,004 -1.7%Table 18.Sources of Existing and Future (2055) Upland Phosphorus Loads Delivered to BeaverLakeSourceExisting Load(lbs/yr)Future Load(lbs/yr)Difference(Future - Existing)Percent ChangeCropland 896 718 -178 -19.9%Pasture 27,667 17,624 -10,043 -36.3%Forest 3,325 2,728 -597 -18.0%Range Brush 1,412 1,141 -271 -19.2%Urban Low Density 1,055 14,115 13,060 1237.9%Urban High Density 462 1,178 716 155.0%Point Sources 25,159 21,468 -3,691 -14.7%Total 59,976 58,972 -1,004 -1.7%Unlike phosphorus, nitrogen is highly soluble, and most loads entering the stream system ultimately reachthe lake. On the other hand, unmodeled loads of nitrogen associated with construction and road erosionare anticipated to be small. Table 19 shows that the model predicts an increase of 3.7 percent in uplandand point source nitrogen loads under future (2055) conditions. The increase is somewhat larger than the39
Beaver Lake <strong>SWAT</strong> <strong>Model</strong>ing Baseline Analysis February 12, 2009increase attributable to point sources ( Table 20) and includes increased loading from urban lawns. Theselawns are expected to have a somewhat higher loading rate than pasture because significant amounts ofnitrogen mass are removed from pasture in animal biomass and hay.Table 19.Existing and Future (2055) Upland Nitrogen Loads Delivered to Beaver LakeNameExisting Load(US lbs/yr)Future Load(US lbs/yr)Difference(Future - Existing)Percent ChangeBrush Creek 334,640 316,650 -17,990 -5.4%East Fork 785,050 778,080 -6,970 -0.9%Beaver Lake 634,290 814,740 180,450 28.4%Lower White 424,840 485,930 61,090 14.4%Middle Fork 373,500 364,790 -8,710 -2.3%Richland Creek 762,250 765,880 3,630 0.5%War Eagle Creek 1,943,970 1,908,660 -35,310 -1.8%West Fork 657,570 702,750 45,180 6.9%Total Load 5,916,110 6,137,480 221,370 3.7%Table 20.Sources of Existing and Future (2055) Upland Nitrogen Loads to Beaver LakeSourceExisting Load(lbs/yr)Future Load(lbs/yr)Difference(Future - Existing)Percent ChangeCropland 278,110 231,110 -47,000 -16.9%Pasture 3,392,330 2,350,870 -1,041,460 -30.7%Forest 1,437,470 1,250,500 -186,970 -13.0%Range Brush 396,720 333,280 -63,440 -16.0%Urban Low Density 167,190 1,504,050 1,336,900 799.8%Urban High Density 49,130 116,680 67,550 137.5%Point Sources 195,200 350,990 155,790 79.8%Total 5,916,110 6,137,480 221,370 3.7%Delivered loading rates on a per-acre basis are summarized in Table 21 through Table 23 and provide abasis for <strong>com</strong>parison among land uses. These rates represent load reaching the lake after all instreamretention processes; thus delivered load rates are generally lower for subwatersheds such as East Fork thatare farther from the lake. The highest delivered load rates occur for the Beaver Lake reporting40
Beaver Lake <strong>SWAT</strong> <strong>Model</strong>ing Baseline Analysis February 12, 2009subwatershed, representing the area immediately around the lake. Land in this area is only a shortdistance from the lake and is also characterized by large areas of higher slopes and erodible soils.Table 21.Loading Rates (Delivered to Beaver Lake) for Upland Sediment SourcesReportingSubwatershedUrban/Resid.Low Dens.Future (2055) Annual Average Sediment Delivered Loading Rate (US tons/acre/year)Urban/Resid.High Dens.Agric.Rangeland/Brush Forest Pasture TotalBrush Creek 0.28 0.15 1.10 0.22 0.04 0.12 0.15East Fork 0.06 0.09 0.97 0.12 0.01 0.08 0.03Beaver Lake 0.52 0.26 2.29 0.74 0.14 0.38 0.34Lower White 0.25 0.17 1.74 0.24 0.03 0.07 0.19Middle Fork 0.10 0.12 1.12 0.14 0.01 0.12 0.06Richland Creek 0.22 0.10 1.02 0.18 0.03 0.15 0.09War Eagle Creek 0.27 0.08 0.58 0.12 0.03 0.09 0.10West Fork 0.10 0.08 1.29 0.17 0.02 0.14 0.07Entire Watershed 0.29 0.13 1.14 0.25 0.04 0.12 0.13Table 22.Loading Rates (Delivered to Beaver Lake) for Upland Phosphorus SourcesReportingSubwatershedUrban/Resid.Low Dens.Future (2055) Annual Average Total Phosphorus Loading Rate (lbs/acre/year)Urban/Resid.High Dens.Agric.Rangeland/Brush Forest Pasture TotalBrush Creek 0.113 0.103 0.079 0.035 0.008 0.208 0.103East Fork 0.050 0.064 0.058 0.023 0.004 0.144 0.022Beaver Lake 0.170 0.155 0.108 0.062 0.014 0.281 0.084Lower White 0.114 0.117 0.093 0.037 0.009 0.239 0.098Middle Fork 0.073 0.083 0.071 0.028 0.006 0.198 0.045Richland Creek 0.049 0.067 0.069 0.011 0.004 0.143 0.041War Eagle Creek 0.079 0.056 0.041 0.017 0.006 0.118 0.044West Fork 0.072 0.069 0.071 0.032 0.007 0.200 0.048Entire Watershed 0.105 0.092 0.067 0.028 0.006 0.156 0.05141
Beaver Lake <strong>SWAT</strong> <strong>Model</strong>ing Baseline Analysis February 12, 2009Table 23.Loading Rates (Delivered to Beaver Lake) for Upland Nitrogen SourcesReportingSubwatershedUrban/Resid.Low Dens.Future (2055) Annual Average Total Nitrogen Loading Rate (lbs/acre/year)Urban/Resid.High Dens.Agric.Rangeland/Brush Forest Pasture TotalBrush Creek 10.3 9.2 24.0 7.2 2.6 19.8 11.2East Fork 10.4 9.2 18.9 10.0 3.6 22.0 6.2Beaver Lake 11.4 9.5 20.2 7.0 2.2 11.9 6.4Lower White 11.2 9.2 20.2 8.6 2.9 24.4 10.8Middle Fork 10.3 9.3 20.6 9.5 3.0 23.0 7.4Richland Creek 12.0 9.2 18.7 8.8 3.0 20.2 8.3War Eagle Creek 11.1 9.2 23.9 7.1 2.6 21.3 8.8West Fork 11.4 9.0 16.8 11.1 3.8 21.7 8.3Entire Watershed 11.2 9.1 21.4 8.3 2.9 20.7 7.9It is re<strong>com</strong>mended that these <strong>SWAT</strong> modeling results be <strong>com</strong>bined with results from ongoingsupplemental analyses to generate a <strong>com</strong>plete picture of loading to Beaver Lake and <strong>com</strong>parison of allsignificant sources for sediment, phosphorus, and nitrogen load.42
Beaver Lake <strong>SWAT</strong> <strong>Model</strong>ing Baseline Analysis February 12, 20096 ReferencesGassman, P.W., M.R. Reyes, C.H. Green, and J.G. Arnold. 2007. The Soil and Water Assessment Tool:Historical development, applications, and future research directions. Transactions of the ASABE, 50(4):1211-1250.USEPA. 1997. Technical Guidance Manual for Developing Total Maximum Daily Loads, Book II:Streams and Rivers, Part I: Biochemical Oxygen Demand/Dissolved Oxygen andNutrients/Eutrophication. Office of Science and Technology, U.S. Environmental Protection Agency,Washington, DC.White, K.L. and I. Chaubey. 2005. Sensitivity analysis, calibration, and validations for a multisite andmultivariable <strong>SWAT</strong> model. Journal of the American Water Resources Association, 41(5): 1077-1089.43