Annual Report for 2006/07 - Metro Tasmania
Annual Report for 2006/07 - Metro Tasmania
Annual Report for 2006/07 - Metro Tasmania
- No tags were found...

Create successful ePaper yourself
Turn your PDF publications into a flip-book with our unique Google optimized e-Paper software.
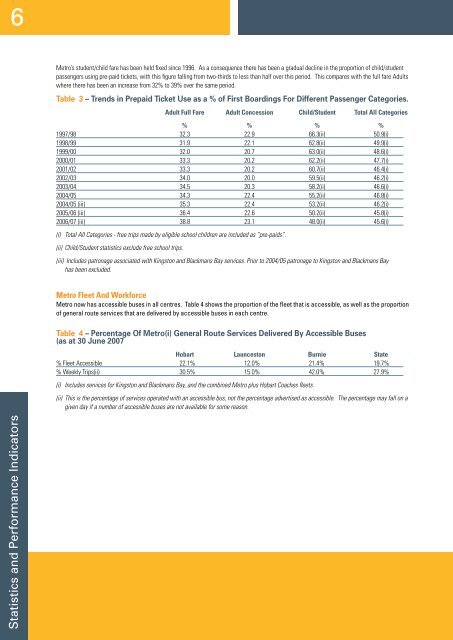
<strong>Metro</strong>’s student/child fare has been held fixed since 1996. As a consequence there has been a gradual decline in the proportion of child/studentpassengers using pre-paid tickets, with this figure falling from two-thirds to less than half over this period. This compares with the full fare Adultswhere there has been an increase from 32% to 39% over the same period.Table 3 – Trends in Prepaid Ticket Use as a % of First Boardings For Different Passenger Categories.Adult Full Fare Adult Concession Child/Student Total All Categories% % % %1997/98 32.3 22.9 66.3(ii) 50.9(i)1998/99 31.9 22.1 62.8(ii) 49.9(i)1999/00 32.0 20.7 63.0(ii) 48.6(i)2000/01 33.3 20.2 62.2(ii) 47.7(i)2001/02 33.3 20.2 60.7(ii) 46.4(i)2002/03 34.0 20.0 59.5(ii) 46.2(i)2003/04 34.5 20.3 58.2(ii) 46.6(i)2004/05 34.3 22.4 55.2(ii) 46.8(i)2004/05 (iii) 35.3 22.4 53.2(ii) 46.2(i)2005/06 (iii) 36.4 22.6 50.2(ii) 45.8(i)<strong>2006</strong>/<strong>07</strong> (iii) 38.8 23.1 48.0(ii) 45.6(i)(i) Total All Categories - free trips made by eligible school children are included as “pre-paids”.(ii) Child/Student statistics exclude free school trips.(iii) Includes patronage associated with Kingston and Blackmans Bay services. Prior to 2004/05 patronage to Kingston and Blackmans Bayhas been excluded.<strong>Metro</strong> Fleet And Work<strong>for</strong>ce<strong>Metro</strong> now has accessible buses in all centres. Table 4 shows the proportion of the fleet that is accessible, as well as the proportionof general route services that are delivered by accessible buses in each centre.Table 4 – Percentage Of <strong>Metro</strong>(i) General Route Services Delivered By Accessible Buses(as at 30 June 20<strong>07</strong>Hobart Launceston Burnie State% Fleet Accessible 22.1% 12.0% 21.4% 19.7%% Weekly Trips(ii) 30.5% 15.0% 42.0% 27.9%(i) Includes services <strong>for</strong> Kingston and Blackmans Bay, and the combined <strong>Metro</strong> plus Hobart Coaches fleets.(ii) This is the percentage of services operated with an accessible bus, not the percentage advertised as accessible. The percentage may fall on agiven day if a number of accessible buses are not available <strong>for</strong> some reason.Statistics and Per<strong>for</strong>mance Indicators