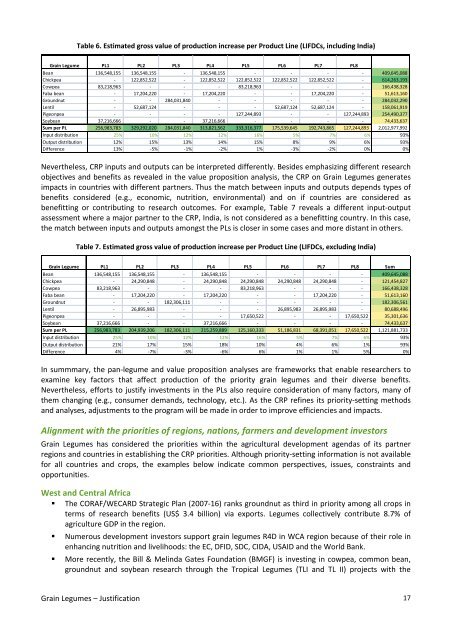
Table 6. Estimated gross value of producti<strong>on</strong> increase per Product Line (LIFDCs, including India)<strong>Grain</strong> Legume PL1 PL2 PL3 PL4 PL5 PL6 PL7 PL8Bean 136,548,155 136,548,155 - 136,548,155 - - - - 409,645,088Chickpea - 122,852,522 - 122,852,522 122,852,522 122,852,522 122,852,522 - 614,263,193Cowpea 83,218,963 - - - 83,218,963 - - - 166,438,328Faba bean - 17,204,220 - 17,204,220 - - 17,204,220 - 51,613,160Groundnut - - 284,031,840 - - - - - 284,032,290Lentil - 52,687,124 - - - 52,687,124 52,687,124 - 158,061,919Pige<strong>on</strong>pea - - - - 127,244,893 - - 127,244,893 254,490,377Soybean 37,216,666 - - 37,216,666 - - - - 74,433,637Sum per PL 256,983,783 329,292,020 284,031,840 313,821,562 333,316,377 175,539,645 192,743,865 127,244,893 2,012,977,992Input distributi<strong>on</strong> 25% 10% 12% 12% 16% 5% 7% 6% 93%Output distributi<strong>on</strong> 12% 15% 13% 14% 15% 8% 9% 6% 93%Difference 13% -5% -1% -2% 1% -3% -2% 0% 0%Nevertheless, CRP inputs and outputs can be interpreted differently. Besides emphasizing different researchobjectives and benefits as revealed in the value propositi<strong>on</strong> analysis, the CRP <strong>on</strong> <strong>Grain</strong> <strong>Legumes</strong> generatesimpacts in countries with different partners. Thus the match between inputs and outputs depends types ofbenefits c<strong>on</strong>sidered (e.g., ec<strong>on</strong>omic, nutriti<strong>on</strong>, envir<strong>on</strong>mental) and <strong>on</strong> if countries are c<strong>on</strong>sidered asbenefitting or c<strong>on</strong>tributing to research outcomes. For example, Table 7 reveals a different input-outputassessment where a major partner to the CRP, India, is not c<strong>on</strong>sidered as a benefitting country. In this case,the match between inputs and outputs am<strong>on</strong>gst the PLs is closer in some cases and more distant in others.Table 7. Estimated gross value of producti<strong>on</strong> increase per Product Line (LIFDCs, excluding India)<strong>Grain</strong> Legume PL1 PL2 PL3 PL4 PL5 PL6 PL7 PL8 SumBean 136,548,155 136,548,155 - 136,548,155 - - - - 409,645,088Chickpea - 24,290,848 - 24,290,848 24,290,848 24,290,848 24,290,848 - 121,454,827Cowpea 83,218,963 - - - 83,218,963 - - - 166,438,328Faba bean - 17,204,220 - 17,204,220 - - 17,204,220 - 51,613,160Groundnut - - 182,306,111 - - - - - 182,306,561Lentil - 26,895,983 - - - 26,895,983 26,895,983 - 80,688,496Pige<strong>on</strong>pea - - - - 17,650,522 - - 17,650,522 35,301,636Soybean 37,216,666 - - 37,216,666 - - - - 74,433,637Sum per PL 256,983,783 204,939,206 182,306,111 215,259,889 125,160,333 51,186,831 68,391,051 17,650,522 1,121,881,733Input distributi<strong>on</strong> 25% 10% 12% 12% 16% 5% 7% 6% 93%Output distributi<strong>on</strong> 21% 17% 15% 18% 10% 4% 6% 1% 93%Difference 4% -7% -3% -6% 6% 1% 1% 5% 0%In summmary, the pan-legume and value propositi<strong>on</strong> analyses are frameworks that enable researchers toexamine key factors that affect producti<strong>on</strong> of the priority grain legumes and their diverse benefits.Nevertheless, efforts to justify investments in the PLs also require c<strong>on</strong>siderati<strong>on</strong> of many factors, many ofthem changing (e.g., c<strong>on</strong>sumer demands, technology, etc.). As the CRP refines its priority-setting methodsand analyses, adjustments to the program will be made in order to improve efficiencies and impacts.Alignment with the priorities of regi<strong>on</strong>s, nati<strong>on</strong>s, farmers and development investors<strong>Grain</strong> <strong>Legumes</strong> has c<strong>on</strong>sidered the priorities within the agricultural development agendas of its partnerregi<strong>on</strong>s and countries in establishing the CRP priorities. Although priority-setting informati<strong>on</strong> is not availablefor all countries and crops, the examples below indicate comm<strong>on</strong> perspectives, issues, c<strong>on</strong>straints andopportunities.West and Central Africa• The CORAF/WECARD Strategic Plan (2007-16) ranks groundnut as third in priority am<strong>on</strong>g all crops interms of research benefits (US$ 3.4 billi<strong>on</strong>) via exports. <strong>Legumes</strong> collectively c<strong>on</strong>tribute 8.7% ofagriculture GDP in the regi<strong>on</strong>.• Numerous development investors support grain legumes R4D in WCA regi<strong>on</strong> because of their role inenhancing nutriti<strong>on</strong> and livelihoods: the EC, DFID, SDC, CIDA, USAID and the World Bank.• More recently, the Bill & Melinda Gates Foundati<strong>on</strong> (BMGF) is investing in cowpea, comm<strong>on</strong> bean,groundnut and soybean research through the Tropical <strong>Legumes</strong> (TLI and TL II) projects with the<strong>Grain</strong> <strong>Legumes</strong> – Justificati<strong>on</strong> 17
objective of increasing productivity and productivity of grain legumes and the income of smallholderfarmers in Burkina Faso, Ghana, Mali, Niger, Nigeria and Senegal.• The N2Africa project (supported by BMGF) aims to leverage biological nitrogen fixati<strong>on</strong> for doublingthe yields of comm<strong>on</strong> bean, cowpea, groundnut and soybean in the WCA regi<strong>on</strong>.• Major investments are also coming from the USAID-sp<strong>on</strong>sored Feed the Future <str<strong>on</strong>g>Program</str<strong>on</strong>g> (Feed theFuture 2010) targeting soybean (al<strong>on</strong>g with rice and maize) to transform commodity value chains forhigh impact <strong>on</strong> nutriti<strong>on</strong>, gender equity and poverty in WCA.Eastern and Southern Africa• ASARECA’s strategic plan 2006-15 ranks groundnut as first priority am<strong>on</strong>g legumes, and states “pulseshave relatively high current and expected future demand in the regi<strong>on</strong>”.• Ethiopia has been increasing the producti<strong>on</strong> of legumes for export during the last decade (IFPRI2012), earning over US$ 90 milli<strong>on</strong> (in additi<strong>on</strong> to local c<strong>on</strong>sumpti<strong>on</strong>) in 2007-08. The Government ofEthiopia is str<strong>on</strong>gly supportive of the pulses value chains for export. Major legume crops arechickpea, comm<strong>on</strong> bean, faba bean, pea and lentil. IFPRI reported that pulses account for 13% ofcultivated land and 15% of protein intake, and c<strong>on</strong>cluded “diversificati<strong>on</strong> by rotating staple cerealswith pulses is an important income opportunity.”• SADC’s new agricultural research subsidiary body, CCARDESA, has not yet produced a cropprioritizati<strong>on</strong> for Southern Africa, but nati<strong>on</strong>al policies in Malawi, Mozambique and Zambia areinformative. Malawi’s 2011-15 prioritized strategy (Malawi Ministry of Agriculture 2011) targets“promoting diversified and enriched foods in complementary feeding programs for maternal nutriti<strong>on</strong>and HIV/AIDS affected people through the use of soybean, comm<strong>on</strong> bean, pige<strong>on</strong>pea and groundnutas key ingredients”. These same legume crops were also part of the government’s supportedagricultural inputs subsidy program aimed at food and nutriti<strong>on</strong> security and reducing poverty.Likewise, Zambia and Zimbabwe have put legumes <strong>on</strong> the priority list, and included in the agriculturalinputs programs that support smallholder farmers.• The Nati<strong>on</strong>al Small Farmers Associati<strong>on</strong> of Malawi (NASFAM) places priority <strong>on</strong> sustainable farmingmethods and risk management against droughts and climate change. As part of StrategicDevelopment Plan process, groundnut and soybean were c<strong>on</strong>sidered as next best opti<strong>on</strong>s to tobacco(NASFAM 2011).• Beans are a priority crop for enhancing both food security and income of smallholder farmers in bothTanzania through Kilimo Kwanza (a nati<strong>on</strong>al agricultural development framework) and in Rwandathrough the Plan for Agricultural in Rwanda.• ASARECA ranks comm<strong>on</strong> beans a “high value crop” and c<strong>on</strong>siders beans to be a “major staple foodcrop in the regi<strong>on</strong>, in terms of c<strong>on</strong>tributi<strong>on</strong> of both calories and protein.”• The USAID’s “Feed the Future” program prioritizes legumes in Malawi; soybean, comm<strong>on</strong> bean,groundnut and sesame in Mozambique; and commodity value chains for maize, legumes and oilseedsin Zambia.• In Uganda, comm<strong>on</strong> bean (for nutriti<strong>on</strong>) is <strong>on</strong>e of the three “Feed the Future” priorities, al<strong>on</strong>g withmaize (for food security) and coffee (for growth).• The BMGF supported Tropical <strong>Legumes</strong> projects are working in Ethiopia, Kenya, Malawi,Mozambique, Tanzania, Uganda and Zimbabwe with the aim of increasing producti<strong>on</strong> andproductivity of legumes.• The N2Africa project targets Malawi, Mozambique, Kenya, Rwanda and Zimbabwe to raise BNF oflegumes and c<strong>on</strong>sequently yield of grain legumes, as well as the subsequent crop (in rotati<strong>on</strong>) thatbenefits from residual nitrogen left in the soil by the legume.South and Southeast Asia• India is the world’s largest producer and c<strong>on</strong>sumer of grain legumes. To address the gap betweenproducti<strong>on</strong> and c<strong>on</strong>sumpti<strong>on</strong> (as described earlier) the Government of India has launched theAccelerated Pulses Producti<strong>on</strong> <str<strong>on</strong>g>Program</str<strong>on</strong>g>me (A3P) under the Nati<strong>on</strong>al Food Security Missi<strong>on</strong> (NFSM).<strong>Grain</strong> <strong>Legumes</strong> – Justificati<strong>on</strong> 18
- Page 4: AcknowledgmentsThe eleven core part
- Page 7 and 8: ISRAITITASITPGRFAKARIKMKSLACLIFDCMA
- Page 9 and 10: One, farmers in some regions have s
- Page 11: • Central and Western Asia and No
- Page 14 and 15: Justification of a CRP on Grain Leg
- Page 16 and 17: Highest levels of poverty/hunger an
- Page 18 and 19: That the consumption of milk, eggs,
- Page 20 and 21: system level; while for policy-econ
- Page 22 and 23: Table 5. Summaries of pan-legume co
- Page 26 and 27: Crops addressed are chickpea, pigeo
- Page 28 and 29: appear to share common mechanisms o
- Page 30 and 31: new technologies is affected by the
- Page 32 and 33: ProductLines and Strategic Componen
- Page 34 and 35: Product Lines (PLs)Addressing abiot
- Page 36 and 37: Activities• Identify potential re
- Page 38 and 39: screening. Comparative studies on p
- Page 40 and 41: Increased water use efficiency (WUE
- Page 42 and 43: • Short-duration, drought toleran
- Page 44 and 45: Table 13. Targeted countries for Pr
- Page 46 and 47: an Integrated Pest Management (IPM)
- Page 48 and 49: Impact pathwayFor improved varietie
- Page 50 and 51: • Multi-environment evaluation of
- Page 52 and 53: Table 18. Targeted countries for Pr
- Page 54 and 55: Promotion of seed business ventures
- Page 56 and 57: producers and input and product mar
- Page 58 and 59: target production domains and valid
- Page 60 and 61: systems must be employed to adequat
- Page 62 and 63: characterization and development of
- Page 64 and 65: Innovative contributionsPublic-priv
- Page 66 and 67: Harvest destination:Bean -LACBean-A
- Page 68 and 69: Promoting institutional innovations
- Page 70 and 71: The CRP will produce diverse types
- Page 72 and 73: Student scholarshipsStudent scholar
- Page 74 and 75:
2010). The availability of high yie
- Page 76 and 77:
disseminate the technologies. On a
- Page 78 and 79:
Gender StrategyRationaleLegumes are
- Page 80 and 81:
uilding activities will lead to inc
- Page 82 and 83:
Gender considerate skills and knowl
- Page 84 and 85:
InnovationsGrain Legumes constitute
- Page 86 and 87:
Utilize bio-economic modeling to un
- Page 88 and 89:
oles to play in (i) providing viabl
- Page 90 and 91:
male and female farmer’s prioriti
- Page 92 and 93:
evaluation in crop-livestock system
- Page 94 and 95:
CRP is appropriately reflected in t
- Page 96 and 97:
As the CRP will work with a wide ra
- Page 98 and 99:
Mitigating RisksGrain Legumes is in
- Page 100 and 101:
• Crop and region specific post-h
- Page 102 and 103:
The CRP is projecting a budget of U
- Page 104 and 105:
Costs for gender research and analy
- Page 106 and 107:
Bhullar NK, Street K, Mackay M, Yah
- Page 108 and 109:
ICARDA. 2010. Ethiopia and ICARDA.
- Page 110 and 111:
Pande S. 2007. Prospects of legumes
- Page 112 and 113:
365. http://dx.doi.org/10.1071/FP11
- Page 114 and 115:
AppendicesAppendix 1. Profiles of t
- Page 116 and 117:
(68,000 ha) (Saxena et al. 2010). W
- Page 118 and 119:
Appendix 2. Profiles of Grain Legum
- Page 120 and 121:
Latin America and the Caribbean (LA
- Page 122 and 123:
Appendix 3. Global trends in grain
- Page 124 and 125:
WCA: COWPEAArea trend: t t-value: 1
- Page 126 and 127:
Direct consumption trend: t-value:
- Page 128 and 129:
ESA: CHICKPEAArea trend: t-value: 7
- Page 130 and 131:
Food consumption trend: : t-value:
- Page 132 and 133:
Production trend: t-value: 5.26 sig
- Page 134 and 135:
ESA: PIGEONPEAArea trend: t-value:
- Page 136 and 137:
Food trend: t-value: 5.07 significa
- Page 138 and 139:
SSEA: GROUNDNUTArea trend: t-value:
- Page 140 and 141:
Production trend: t-value: 8.6 sign
- Page 142 and 143:
LAC: DRY BEANArea trend: t-value: 0
- Page 144 and 145:
CWANA: CHICKPEAArea trend: t-value:
- Page 146:
SyriaTunisiaGrain Legumes - Appendi
- Page 149 and 150:
MoroccooCWANA: LENTILSAreatrend: t-
- Page 151 and 152:
MoroccooTurkeyGrain Legumes - Appen
- Page 153 and 154:
In order to make an income group wi
- Page 155 and 156:
In view of the nutritional status a
- Page 157 and 158:
Crop/constraint Asia ESA WCA CWANA
- Page 159 and 160:
ChickpeaCentral and West Asia and N
- Page 161 and 162:
Figure 4: Area, demand andd supply
- Page 163 and 164:
Figure 8: Area, demand and supply p
- Page 165 and 166:
Figure12: Area, demand and supply p
- Page 167 and 168:
Figure16: Area, demand and supply p
- Page 169 and 170:
Figure 18: Area, demand andd supply
- Page 171 and 172:
Table 1. Values of key parameters u
- Page 173 and 174:
35%30%25%20%15%10%5%0%2014201520162
- Page 175 and 176:
Measure / RegionTable 2. Summary me
- Page 177 and 178:
Table 3. Potential impacts of cowpe
- Page 179 and 180:
Table 5. Potential impacts of groun
- Page 181 and 182:
Table 6. Potential impact of invest
- Page 183 and 184:
Table 8. Summary of the potential i
- Page 185 and 186:
Table 11. A summary of the potentia
- Page 187 and 188:
Country Chickpeas Groundnut Lentils
- Page 189 and 190:
these genes have been incorporated
- Page 191 and 192:
Control of flower thrips (Megalurot
- Page 193 and 194:
maize in both locations in the two
- Page 195 and 196:
WeedsWeeds (parasitic and non-paras
- Page 197 and 198:
Butare L, Rao IM, Lepoivre P, Polan
- Page 199 and 200:
Khalil S, Kharrat M, Malhotra RS, S
- Page 201 and 202:
Sanginga N and Woolmer PN (eds.). 2
- Page 203 and 204:
Visalakshmi V, Ranga Rao GV and Arj
- Page 205 and 206:
them, or how to manage them). The u
- Page 207 and 208:
Grain Legumes should take into acco
- Page 209 and 210:
Table 7: Adoption of improved cowpe
- Page 211 and 212:
2005 rainy season. In neighboring a
- Page 213 and 214:
Machine harvestingManual harvest of
- Page 215 and 216:
Hangen LA and Bennink MR. 2003. Con
- Page 217 and 218:
Appendix 10. Product Line logframes
- Page 219 and 220:
Product Line 2. Heat tolerant chick
- Page 221 and 222:
Output targets Milestones Target re
- Page 223 and 224:
Output targets Milestones Target re
- Page 225 and 226:
Output targets Milestones Target re
- Page 227 and 228:
Output targets Milestones Target re
- Page 229 and 230:
Output targets Milestones Target re
- Page 231 and 232:
Product Line 6. Extra-early chickpe
- Page 233 and 234:
Product Line 7. Herbicide tolerant,
- Page 235 and 236:
Product Line 8. Pigeonpea hybrids a