Multilingual Touchscreen Keyboard Design and Optimization
Multilingual Touchscreen Keyboard Design and Optimization
Multilingual Touchscreen Keyboard Design and Optimization

Create successful ePaper yourself
Turn your PDF publications into a flip-book with our unique Google optimized e-Paper software.
Let us first examine the individual results when optimized specifically for each of the<br />
five languages, summarized in bold numbers in the diagonal cells of Table 2. The first<br />
interesting observation is that after optimization for each language the average travel<br />
distance per tap all fell into a relatively narrow range: 1.76, 1.68, 1.76, 1.63 <strong>and</strong> 1.5 keys<br />
for English, French, Spanish, German <strong>and</strong> Chinese respectively. One might have<br />
expected greater differences between these languages given their different phonology. In<br />
comparison QWERTY is somewhat equally bad for all: 3.31, 3.51, 3.7, 3.26, 3.85 keys<br />
for English, French, Spanish, German <strong>and</strong> Chinese respectively. The ratio between the<br />
average travel distance per tap on QWERTY <strong>and</strong> the average travel distance per tap on<br />
the keyboards individually optimized for each language are large: 1.88, 2.09, 2.10, 1.99,<br />
2.57 for English, French, Spanish, German, <strong>and</strong> Chinese respectively. Figure 8 illustrates<br />
the travel distance difference among the various layouts. Although English has been the<br />
primary target language used in touchscreen keyboard optimization work (Getschow, et<br />
al., 1986; Lewis, 1992; Lewis, Kennedy, et al., 1999; Lewis, et al., 1997; MacKenzie &<br />
Zhang, 1999; Soukoreff & MacKenzie, 1995; Zhai, et al., 2000; Zhai, Hunter, et al.,<br />
2002), English in fact has the least to gain <strong>and</strong> Chinese has the most to gain from<br />
touchscreen keyboard optimization. These results <strong>and</strong> observations are new to our<br />
knowledge.<br />
When the five languages are considered simultaneously, the optimization effect is still<br />
strong. As shown in Table 2, the average distance d for tapping a character on K5 are<br />
1.88, 1.86, 1.91, 1.77 <strong>and</strong> 1.68 keys for English, French, Spanish, German <strong>and</strong> Chinese<br />
respectively, much shorter than QWERTY’s 3,31, 3.51, 3.7, 3.26, <strong>and</strong> 3.85 keys <strong>and</strong><br />
close to the results obtained specifically for each language (1.76, 1.68, 1.76, 1.63 <strong>and</strong> 1.5<br />
keys for English, French, Spanish, German <strong>and</strong> Chinese respectively.) The ratios in<br />
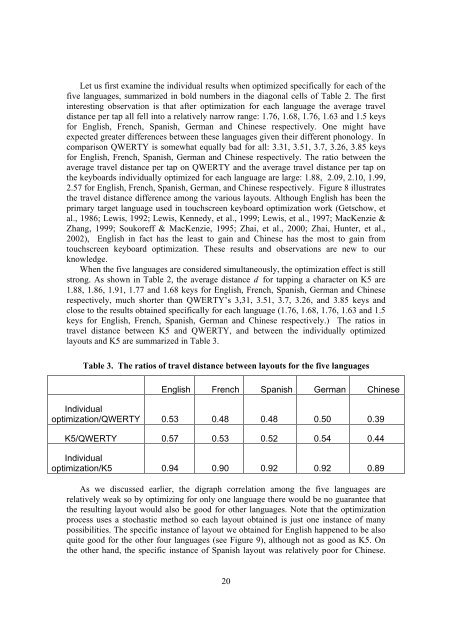
travel distance between K5 <strong>and</strong> QWERTY, <strong>and</strong> between the individually optimized<br />
layouts <strong>and</strong> K5 are summarized in Table 3.<br />
Table 3. The ratios of travel distance between layouts for the five languages<br />
English French Spanish German Chinese<br />
Individual<br />
optimization/QWERTY 0.53 0.48 0.48 0.50 0.39<br />
K5/QWERTY 0.57 0.53 0.52 0.54 0.44<br />
Individual<br />
optimization/K5 0.94 0.90 0.92 0.92 0.89<br />
As we discussed earlier, the digraph correlation among the five languages are<br />
relatively weak so by optimizing for only one language there would be no guarantee that<br />
the resulting layout would also be good for other languages. Note that the optimization<br />
process uses a stochastic method so each layout obtained is just one instance of many<br />
possibilities. The specific instance of layout we obtained for English happened to be also<br />
quite good for the other four languages (see Figure 9), although not as good as K5. On<br />
the other h<strong>and</strong>, the specific instance of Spanish layout was relatively poor for Chinese.<br />
20