- Page 1:
2008 ANNUAL REPORT
- Page 4:
Statement concerning the Group’s
- Page 8 and 9:
Shareholders will be asked to vote
- Page 10:
open to the public for consulting a
- Page 16 and 17: 4000 3000 2000 1000 800 600 400 200
- Page 18 and 19: Dear Shareholders, Directors’ Rep
- Page 20 and 21: 2008 Group’s Consolidated Annual
- Page 22 and 23: 2008 Group’s Consolidated Annual
- Page 24 and 25: 2008 Group’s Consolidated Annual
- Page 26 and 27: 2008 Group’s Consolidated Annual
- Page 28 and 29: 2008 Group’s Consolidated Annual
- Page 30 and 31: 2008 Group’s Consolidated Annual
- Page 32 and 33: 2008 Group’s Consolidated Annual
- Page 34 and 35: 2008 Group’s Consolidated Annual
- Page 36 and 37: 2008 Group’s Consolidated Annual
- Page 38 and 39: 2008 Group’s Consolidated Annual
- Page 40 and 41: 2008 Group’s Consolidated Annual
- Page 42 and 43: 2008 Group’s Consolidated Annual
- Page 44 and 45: 2008 Group’s Consolidated Annual
- Page 46 and 47: 2008 Group’s Consolidated Annual
- Page 48 and 49: 2008 Group’s Consolidated Annual
- Page 50 and 51: 2008 Group’s Consolidated Annual
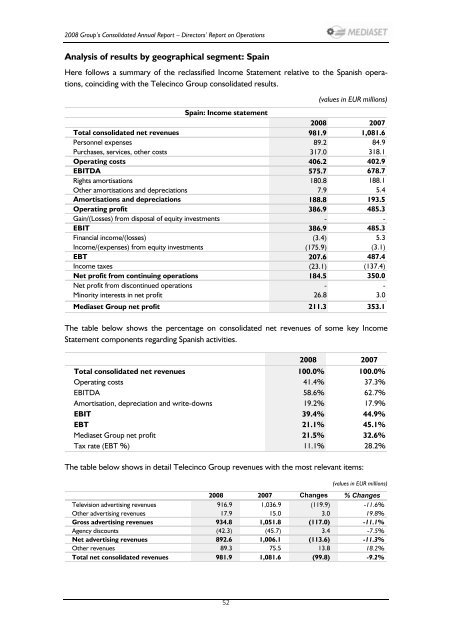
- Page 52 and 53: 2008 Group’s Consolidated Annual
- Page 54 and 55: 2008 Group’s Consolidated Annual
- Page 56 and 57: 2008 Group’s Consolidated Annual
- Page 58 and 59: 2008 Group’s Consolidated Annual
- Page 60 and 61: 2008 Group’s Consolidated Annual
- Page 62 and 63: 2008 Group’s Consolidated Annual
- Page 64 and 65: 2008 Group’s Consolidated Annual
- Page 68 and 69: 2008 Group’s Consolidated Annual
- Page 70 and 71: 2008 Group’s Consolidated Annual
- Page 72 and 73: 2008 Group’s Consolidated Annual
- Page 74 and 75: 2008 Group’s Consolidated Annual
- Page 76 and 77: 2008 Group’s Consolidated Annual
- Page 78 and 79: 2008 Group’s Consolidated Annual
- Page 80 and 81: 2008 Group’s Consolidated Annual
- Page 82 and 83: 2008 Group’s Consolidated Annual
- Page 84 and 85: 2008 Group’s Consolidated Annual
- Page 86 and 87: 2008 Group’s Consolidated Annual
- Page 88 and 89: 2008 Group’s Consolidated Annual
- Page 90 and 91: 2008 Group’s Consolidated Annual
- Page 92 and 93: 2008 Group’s Consolidated Annual
- Page 94 and 95: 2008 Group’s Consolidated Annual
- Page 96: 2008 Group’s Consolidated Annual
- Page 99 and 100: MEDIASET GROUP CONSOLIDATED BALANCE
- Page 101 and 102: MEDIASET GROUP CONSOLIDATED CASH FL
- Page 103 and 104: MEDIASET GROUP CONSOLIDATED BALANCE
- Page 105 and 106: MEDIASET GROUP CONSOLIDATED INCOME
- Page 107 and 108: 2008 Group’s Consolidated Annual
- Page 109 and 110: 2008 Group’s Consolidated Annual
- Page 111 and 112: 2008 Group’s Consolidated Annual
- Page 113 and 114: 2008 Group’s Consolidated Annual
- Page 115 and 116: 2008 Group’s Consolidated Annual
- Page 117 and 118:
2008 Group’s Consolidated Annual
- Page 119 and 120:
2008 Group’s Consolidated Annual
- Page 121 and 122:
2008 Group’s Consolidated Annual
- Page 123 and 124:
2008 Group’s Consolidated Annual
- Page 125 and 126:
2008 Group’s Consolidated Annual
- Page 127 and 128:
2008 Group’s Consolidated Annual
- Page 129 and 130:
2008 Group’s Consolidated Annual
- Page 131 and 132:
2008 Group’s Consolidated Annual
- Page 133 and 134:
2008 Group’s Consolidated Annual
- Page 135 and 136:
2008 Group’s Consolidated Annual
- Page 137 and 138:
2008 Group’s Consolidated Annual
- Page 139 and 140:
2008 Group’s Consolidated Annual
- Page 141 and 142:
2008 Group’s Consolidated Annual
- Page 143 and 144:
2008 Group’s Consolidated Annual
- Page 145 and 146:
2008 Group’s Consolidated Annual
- Page 147 and 148:
2008 Group’s Consolidated Annual
- Page 149 and 150:
2008 Group’s Consolidated Annual
- Page 151 and 152:
2008 Group’s Consolidated Annual
- Page 153 and 154:
2008 Group’s Consolidated Annual
- Page 155 and 156:
2008 Group’s Consolidated Annual
- Page 157 and 158:
2008 Group’s Consolidated Annual
- Page 159 and 160:
2008 Group’s Consolidated Annual
- Page 161 and 162:
2008 Group’s Consolidated Annual
- Page 163 and 164:
2008 Group’s Consolidated Annual
- Page 165 and 166:
2008 Group’s Consolidated Annual
- Page 167 and 168:
2008 Group’s Consolidated Annual
- Page 169 and 170:
2008 Group’s Consolidated Annual
- Page 171 and 172:
2008 Group’s Consolidated Annual
- Page 173 and 174:
2008 Group’s Consolidated Annual
- Page 175 and 176:
2008 Group’s Consolidated Annual
- Page 177 and 178:
2008 Group’s Consolidated Annual
- Page 181:
Statement concerning the Group’s
- Page 190 and 191:
Mediaset S.p.A. 2008 Financial Stat
- Page 192 and 193:
Mediaset S.p.A. 2008 Financial Stat
- Page 194 and 195:
Mediaset S.p.A. 2008 Financial Stat
- Page 196 and 197:
Mediaset S.p.A. 2008 Financial Stat
- Page 198 and 199:
Mediaset S.p.A. 2008 Financial Stat
- Page 200 and 201:
Mediaset S.p.A. 2008 Financial Stat
- Page 202 and 203:
Mediaset S.p.A. 2008 Financial Stat
- Page 204 and 205:
Mediaset S.p.A. 2008 Financial Stat
- Page 206 and 207:
Mediaset S.p.A. 2008 Financial Stat
- Page 208 and 209:
Mediaset S.p.A. 2008 Financial Stat
- Page 210 and 211:
Mediaset S.p.A. 2008 Financial Stat
- Page 212 and 213:
Mediaset S.p.A. 2008 Financial Stat
- Page 214 and 215:
Mediaset S.p.A. 2008 Financial Stat
- Page 216 and 217:
Mediaset S.p.A. 2008 Financial Stat
- Page 218 and 219:
Mediaset S.p.A. 2008 Financial Stat
- Page 220 and 221:
Mediaset S.p.A. 2008 Financial Stat
- Page 222 and 223:
Mediaset S.p.A. 2008 Financial Stat
- Page 224 and 225:
Mediaset S.p.A. 2008 Financial Stat
- Page 227 and 228:
Introduction ANNUAL REPORT OF THE B
- Page 229 and 230:
Mediaset S.p.A. 2008 Annual Report
- Page 231 and 232:
Mediaset S.p.A. 2008 Annual Report
- Page 233 and 234:
Mediaset S.p.A. 2008 Annual Report
- Page 235 and 236:
Mediaset S.p.A. 2008 Annual Report
- Page 237 and 238:
Mediaset S.p.A. 2008 Annual Report
- Page 239 and 240:
Mediaset S.p.A. 2008 Annual Report
- Page 241 and 242:
Mediaset S.p.A. 2008 Annual Report
- Page 243 and 244:
Mediaset S.p.A. 2008 Annual Report
- Page 245 and 246:
Mediaset S.p.A. 2008 Annual Report
- Page 247 and 248:
Mediaset S.p.A. 2008 Annual Report
- Page 249 and 250:
Mediaset S.p.A. 2008 Annual Report
- Page 251 and 252:
Mediaset S.p.A. 2008 Annual Report
- Page 253 and 254:
Mediaset S.p.A. 2008 Annual Report
- Page 255 and 256:
Mediaset S.p.A. 2008 Annual Report
- Page 257 and 258:
Mediaset S.p.A. 2008 Annual Report
- Page 259 and 260:
Mediaset S.p.A. 2008 Annual Report
- Page 261 and 262:
Mediaset S.p.A. 2008 Annual Report
- Page 263 and 264:
Mediaset S.p.A. 2008 Annual Report
- Page 265 and 266:
Mediaset S.p.A. 2008 Annual Report
- Page 267 and 268:
Mediaset S.p.A. 2008 Annual Report
- Page 269 and 270:
Mediaset S.p.A. 2008 Annual Report
- Page 271 and 272:
Mediaset S.p.A. 2008 Annual Report
- Page 273 and 274:
Mediaset S.p.A. 2008 Annual Report
- Page 275 and 276:
Mediaset S.p.A. 2008 Annual Report
- Page 277 and 278:
Mediaset S.p.A. 2008 Annual Report
- Page 279 and 280:
Mediaset S.p.A. 2008 Annual Report
- Page 281 and 282:
Mediaset S.p.A. 2008 Annual Report
- Page 283 and 284:
Mediaset S.p.A. 2008 Annual Report
- Page 285 and 286:
Mediaset S.p.A. 2008 Annual Report
- Page 287 and 288:
Mediaset S.p.A. 2008 Annual Report
- Page 289 and 290:
Mediaset S.p.A. 2008 Annual Report
- Page 291 and 292:
Mediaset S.p.A. 2008 Annual Report
- Page 294 and 295:
MEDIASET S.p.A. Balance Sheet as at
- Page 296 and 297:
MEDIASET S.p.A. Income Statement as
- Page 298 and 299:
MEDIASET S.p.A. Statement of change
- Page 300 and 301:
MEDIASET S.p.A. Balance Sheet pursu
- Page 302 and 303:
Third party assets use pertaining t
- Page 304 and 305:
Mediaset S.p.A. 2008 Annual Report
- Page 306 and 307:
Mediaset S.p.A. 2008 Annual Report
- Page 308 and 309:
Mediaset S.p.A. 2008 Annual Report
- Page 310 and 311:
Mediaset S.p.A. 2008 Annual Report
- Page 312 and 313:
Mediaset S.p.A. 2008 Annual Report
- Page 314 and 315:
Mediaset S.p.A. 2008 Annual Report
- Page 316 and 317:
Mediaset S.p.A. 2008 Annual Report
- Page 318 and 319:
Table 2 Stock options allocated to
- Page 320 and 321:
Mediaset S.p.A. 2008 Annual Report
- Page 322 and 323:
Mediaset S.p.A. 2008 Annual Report
- Page 324 and 325:
Mediaset S.p.A. 2008 Annual Report
- Page 326 and 327:
Mediaset S.p.A. 2008 Annual Report
- Page 328 and 329:
Mediaset S.p.A. 2008 Annual Report
- Page 330 and 331:
Mediaset S.p.A. 2008 Annual Report
- Page 332 and 333:
Mediaset S.p.A. 2008 Annual Report
- Page 334 and 335:
Mediaset S.p.A. 2008 Annual Report
- Page 336 and 337:
Mediaset S.p.A. 2008 Annual Report
- Page 338 and 339:
Mediaset S.p.A. 2008 Annual Report
- Page 340 and 341:
Mediaset S.p.A. 2008 Annual Report
- Page 342 and 343:
Mediaset S.p.A. 2008 Annual Report
- Page 344 and 345:
Mediaset S.p.A. 2008 Annual Report
- Page 346 and 347:
Mediaset S.p.A. 2008 Annual Report
- Page 348 and 349:
Mediaset S.p.A. 2008 Annual Report
- Page 350 and 351:
Mediaset S.p.A. 2008 Annual Report
- Page 352 and 353:
Mediaset S.p.A. 2008 Annual Report
- Page 354 and 355:
Mediaset S.p.A. 2008 Annual Report
- Page 356 and 357:
Mediaset S.p.A. 2008 Annual Report
- Page 358 and 359:
Mediaset S.p.A. 2008 Annual Report
- Page 360 and 361:
Mediaset S.p.A. 2008 Annual Report
- Page 362 and 363:
Mediaset S.p.A. 2008 Annual Report
- Page 364 and 365:
Mediaset S.p.A. 2008 Annual Report
- Page 366 and 367:
List of investments in subsidiary a
- Page 369:
Mediaset S.p.A. Table of equity inv
- Page 374 and 375:
� meeting company and group top m
- Page 376:
ENCLOSURE: list of positions held b
- Page 383 and 384:
EXCERPT OF THE RESOLUTIONS MADE BY
- Page 385 and 386:
� to entrust the Board of Directo