
You also want an ePaper? Increase the reach of your titles
YUMPU automatically turns print PDFs into web optimized ePapers that Google loves.
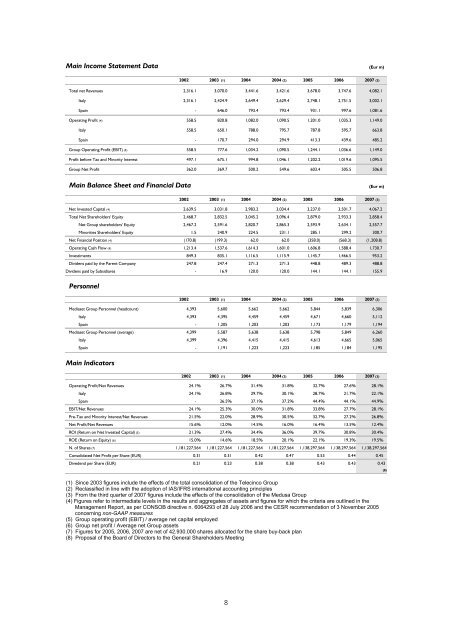
Main Income Statement Data (Eur m)<br />
2002 2003 (1) 2004 2004 (2) 2005 2006 <strong>2007</strong> (3)<br />
Total net Revenues 2,316.1 3,070.0 3,441.6 3,421.6 3,678.0 3,747.6 4,082.1<br />
Italy 2,316.1 2,424.9 2,649.4 2,629.4 2,748.1 2,751.5 3,002.1<br />
Spain - 646.0 793.4 793.4 931.1 997.6 1,081.6<br />
Operating Profit (4) 558.5 820.8 1,082.0 1,090.5 1,201.0 1,035.3 1,149.0<br />
Italy 558.5 650.1 788.0 795.7 787.8 595.7 663.8<br />
Spain - 170.7 294.0 294.9 413.3 439.6 485.2<br />
Group Operating Profit (EBIT) (4) 558.5 777.6 1,034.2 1,090.5 1,244.1 1,036.6 1,149.0<br />
Profit before Tax and Minority Interest 497.1 675.1 994.8 1,046.1 1,202.2 1,019.6 1,095.5<br />
Group Net Profit 362.0 369.7 500.2 549.6 603.4 505.5 506.8<br />
Main Balance Sheet and Financial Data (Eur m)<br />
2002 2003 (1) 2004 2004 (2) 2005 2006 <strong>2007</strong> (3)<br />
Net Invested Capital (4) 2,639.5 3,031.8 2,983.2 3,034.4 3,237.0 3,501.7 4,067.2<br />
Total Net Shareholders' Equity 2,468.7 2,832.5 3,045.2 3,096.4 2,879.0 2,933.3 2,858.4<br />
Net Group shareholders' Equity 2,467.2 2,591.6 2,820.7 2,865.3 2,593.9 2,634.1 2,557.7<br />
Minorities Shareholders' Equity 1.5 240.9 224.5 231.1 285.1 299.2 300.7<br />
Net Financial Position (4) (170.8) (199.3) 62.0 62.0 (358.0) (568.3) (1,208.8)<br />
Operating Cash Flow (4) 1,213.4 1,537.6 1,614.3 1,601.0 1,606.8 1,588.4 1,730.7<br />
Investiments 849.3 835.1 1,116.5 1,115.9 1,145.7 1,466.5 953.2<br />
Dividens paid by the Parent Company 247.8 247.4 271.3 271.3 448.8 489.3 488.8<br />
Dividens paid by Subsidiares - 16.9 120.0 120.0 144.1 144.1 155.9<br />
Personnel<br />
2002 2003 (1) 2004 2004 (2) 2005 2006 <strong>2007</strong> (3)<br />
Mediaset Group Personnel (headcount) 4,393 5,600 5,662 5,662 5,844 5,839 6,306<br />
Italy 4,393 4,395 4,459 4,459 4,671 4,660 5,112<br />
Spain - 1,205 1,203 1,203 1,173 1,179 1,194<br />
Mediaset Group Personnel (average) 4,399 5,587 5,638 5,638 5,798 5,849 6,260<br />
Italy 4,399 4,396 4,415 4,415 4,613 4,665 5,065<br />
Spain - 1,191 1,223 1,223 1,185 1,184 1,195<br />
Main Indicators<br />
2002 2003 (1) 2004 2004 (2) 2005 2006 <strong>2007</strong> (3)<br />
Operating Profit/Net Revenues 24.1% 26.7% 31.4% 31.8% 32.7% 27.6% 28.1%<br />
Italy 24.1% 26.8% 29.7% 30.1% 28.7% 21.7% 22.1%<br />
Spain - 26.5% 37.1% 37.2% 44.4% 44.1% 44.9%<br />
EBIT/Net Revenues 24.1% 25.3% 30.0% 31.8% 33.8% 27.7% 28.1%<br />
Pre-Tax and Minority Interest/Net Revenues 21.5% 22.0% 28.9% 30.5% 32.7% 27.2% 26.8%<br />
Net Profit/Net Revenues 15.6% 12.0% 14.5% 16.0% 16.4% 13.5% 12.4%<br />
ROI (Return on Net Invested Capital) (5) 21.3% 27.4% 34.4% 36.0% 39.7% 30.8% 30.4%<br />
ROE (Return on Equity) (6) 15.0% 14.6% 18.5% 20.1% 22.1% 19.3% 19.5%<br />
N. of Shares (7) 1,181,227,564 1,181,227,564 1,181,227,564 1,181,227,564 1,138,297,564 1,138,297,564 1,138,297,564<br />
Consolidated Net Profit per Share (EUR) 0.31 0.31 0.42 0.47 0.53 0.44 0.45<br />
Divedend per Share (EUR) 0.21 0.23 0.38 0.38 0.43 0.43 0.43<br />
(8)<br />
(1) Since 2003 figures include the effects of the total consolidation of the Telecinco Group<br />
(2) Reclassified in line with the adoption of IAS/IFRS international accounting principles<br />
(3) From the third quarter of <strong>2007</strong> figures include the effects of the consolidation of the Medusa Group<br />
(4) Figures refer to intermediate levels in the results and aggregates of assets and figures for which the criteria are outlined in the<br />
Management <strong>Report</strong>, as per CONSOB directive n. 6064293 of 28 July 2006 and the CESR recommendation of 3 November 2005<br />
concerning non-GAAP measures<br />
(5) Group operating profit (EBIT) / average net capital employed<br />
(6) Group net profit / Average net Group assets<br />
(7) Figures for 2005, 2006, <strong>2007</strong> are net of 42.930.000 shares allocated for the share buy-back plan<br />
(8) Proposal of the Board of Directors to the General Shareholders Meeting<br />
8