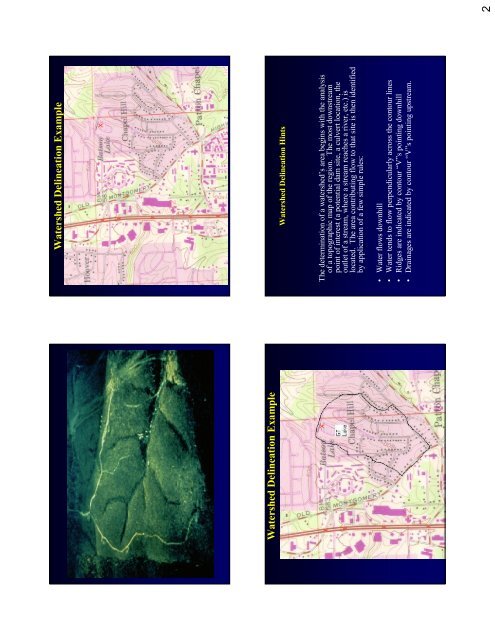
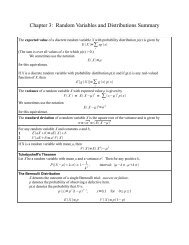
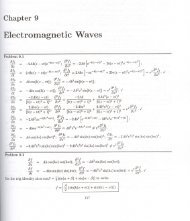
Watershed Delineation ExampleXWatershed Delineation ExampleXWatershed Delineation HintsThe determination of a watershed’s area begins with the analysisof a topographic map of the region. The most downstreampoint of interest (a potential dam site, a culvert location, theoutlet of a stream, where a stream reaches a river, etc.) islocated. The area contributing flow to that site is then identifiedby application of a few simple rules:• Water flows downhill• Water tends to flow perpendicularly across the contour lines• Ridges are indicated by contour “V”s pointing downhill• Drainages are indicated by contour “V”s pointing upstream.2
Information SourcesThe Delineation ProcessUSGS Topographic Maps• The fundamental source of data for delineating <strong>and</strong> studyingwatersheds is the U.S. Geological Survey Quadrangle map. Each“Quad Sheet” map covers 7.5 minutes of longitude <strong>and</strong> latitude.• These maps give a wealth of information including topographiccontour lines, locations of cities, buildings, roads, road types,railroads, pipelines, water bodies, forested l<strong>and</strong>, stream networks,<strong>and</strong> USGS stream gauging stations <strong>and</strong> benchmarks.• Quad sheet maps typically have a scale of 1:24,000 (i.e. 1 inch onthe map = 24,000 inches in• Depending on the age of the map, elevation data may be in Englishor Metric units. Typically, here in the Midwest, the contourintervals of the elevation data are 5 feet or 1.5 meter. For watersheddelineation, quad sheet maps offer us the best starting point.The Delineation Process• There are two basic steps to follow in watershed delineation.• Step 1:– Choose the point of the watershed outlet. This is generally our point ofinterest for designing a structure or monitoring location.• Step 2:– Delineate the watershed boundary by drawing perpendicular lines acrossthe elevation contour lines for l<strong>and</strong> that drains to the point of interest.• Note - There are a few things to remember when you are workingwith topographic maps.– A watershed boundary always runs perpendicular to the contour lines.– “Arrows” that point upstream are valleys.– “Arrows” that point downstream are hills.Digital Elevation ModelsDigital Elevation Models (DEM’s) store topographic datain the form of grid cells. Typically, these grid cells have aresolution of 30 meters <strong>and</strong> elevation intervals of 1 foot or1 meter.Using a DEM within a Geographical Information System(GIS), we can perform digital terrain analysis (DTA) suchas calculating slopes, flow lengths, <strong>and</strong> delineatewatershed boundaries <strong>and</strong> stream networks.However, there are certain drawbacks to DTA becausesome algorithms are not very smart, especially indelineating watershed boundaries.3