HUMBERTO AVILA, M.Sc. Ph.D. student - The University of Alabama
HUMBERTO AVILA, M.Sc. Ph.D. student - The University of Alabama
HUMBERTO AVILA, M.Sc. Ph.D. student - The University of Alabama
- No tags were found...

Create successful ePaper yourself
Turn your PDF publications into a flip-book with our unique Google optimized e-Paper software.
<strong>HUMBERTO</strong> <strong>AVILA</strong>, M.<strong>Sc</strong>. <strong>Ph</strong>.D. <strong>student</strong>Academic Background:•<strong>Ph</strong>.D. Student in Water Resources Engineering atthe <strong>University</strong> <strong>of</strong> <strong>Alabama</strong>. Currently working onComputational Fluid Dynamics and <strong>Ph</strong>ysicalModeling <strong>of</strong> Hydrodynamic Stormwater Devices.•M.<strong>Sc</strong>. Water Resources, Universidad de losAndes, Colombia, 2003•Specialization in River and Coastal Eng.,Universidad del Norte, Colombia, 2001•Bachelor in Civil Engineering, Universidad delNorte, Colombia, 2001On the Black Warrior River, 2007Experience•Researcher in several projects related to UrbanWater Systems, River Engineering, and WaterManagement.•Consultant and Designer <strong>of</strong> several projects inColombia.•Pr<strong>of</strong>essor <strong>of</strong> Water Resources Engineering at theUniversidad del Norte, Colombia.
Factors Affecting <strong>Sc</strong>our <strong>of</strong> PreviouslyCaptured Sediment from StormwaterCatchbasin SumpsHumberto Avila, Robert Pitt, and S. Rocky Durrans<strong>Ph</strong>.D. <strong>student</strong>, Cudworth Pr<strong>of</strong>essor <strong>of</strong> Urban Water Systems, andPr<strong>of</strong>essor <strong>of</strong> Water Resources Engineering, respectively. <strong>The</strong>Department <strong>of</strong> Civil, Construction, and Environmental Engineering,<strong>The</strong> <strong>University</strong> <strong>of</strong> <strong>Alabama</strong>, Tuscaloosa, AL 35487 USAStormwater and Urban Water Systems ModelingFebruary 22–23, 2007Toronto, Canada
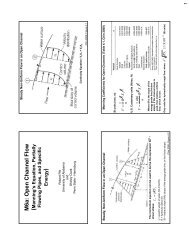
IntroductionSediment-retaining performance in a catchbasin depends on the size andgeometry <strong>of</strong> the device, the flow rate, sediment size, and specific gravity <strong>of</strong>the sediment.<strong>Sc</strong>our phenomenon includes all those parameters previously mentioned,in addition to the depth <strong>of</strong> the water protection layer and the consolidation <strong>of</strong>the sediment bed due to aging.An experimental design was developed and analyzed with fourparameters: flow rate, sediment size, overlying water protection depth, andspecific gravity <strong>of</strong> the sediment. A 2-dimensional Computational FluidDynamic (CFD) model was implemented in Fluent 6.2.Shear stresses at different sediment depths were also calculated fordifferent flow rates and inlet geometries. <strong>The</strong>se shear stress values werecompared to the critical shear stress <strong>of</strong> different particle sizes.
Experimental Design<strong>The</strong> experiments examined the reduction <strong>of</strong> sediment mass from a catchbasinsump over time under the effect <strong>of</strong> a submersible-vertical water jet.<strong>The</strong> geometry <strong>of</strong> the manhole was the same as the optimal manhole geometryrecommended by Larger, et al (1977), and tested by Pitt 1979; 1985; and 1993.<strong>The</strong> diameter <strong>of</strong> the chamber (4D) was assumed to be 1.20 m, with D= 0.3 m (12in) being the diameter <strong>of</strong> the outlet.<strong>The</strong> initial 2D model examined the longitudinal center-line cross section.
Inflow jetDescription <strong>of</strong> the ModelOutflowA 2D-Computational FluidDynamic Model was implementedin FLUENT 6.2, applying theEulerian multiphase model,considering a dense fluidized bed.WaterdepthSedimentdepth<strong>The</strong> sediment bed was exposedto a continuous flow from avertical-submergible water jetduring a 3600 sec (60 min) period.<strong>The</strong> water jet was modeled torepresent gutter flows and an inlinepipe.General representation <strong>of</strong> a simulation. Inflow, andoutflow directions are indicated by arrows. Upper layer<strong>of</strong> water in blue, and sediment layer in color scale.
Full Factorial 2 4 Experimental DesignFactor Low HighA Flow rate (L/s) 1.6 20.8B Diameter (mm) 50 500C Water Depth (m) 0.2 1.0D Specific gravity (g/cc) 1.5 2.5Treatment A B C D AB AC AD BC BD CD ABC ABD ACD BCD ABCDl - - - - + + + + + + - - - - +a + - - - - - - + + + + + + - -b - + - - - + + - - + + + - + -ab + + - - + - - - - + - - + + +c - - + - + - + - + - + - + + -ac + - + - - + - - + - - + - + +bc - + + - - - + + - - - + + - +abc + + - - + - - - - + - - + + +d - - - + + + - + - - - + + + -ad + - - + - - + + - - + - - + +bd - + - + - + - - + - + - + - +abd + + - + + - + - + - - + - - -cd - - + + + - - - - + + + - - +acd + - + + - + + - - + - - + - -bcd - + + + - - - + + + - - - + -abcd + + + + + + + + + + + + + + +
Simulation <strong>of</strong> case ABCSimulation <strong>of</strong> case ABCflow rate at high (20.8 L/sec)depth <strong>of</strong> water at high (1 m)diameter at high (500 µm)specific gravity at low (1.5 g/cc)Colors represent Volume Fraction <strong>of</strong> Sediment
Sediment Depth (m)Reduction <strong>of</strong> sediment depth over timeA AB AC AD ABC ABD ACD ABCDL B C D BC BD CD BCD1.110.90.80.7ABCDHighQ (L/s)D (mm)hw (m)SG0.60.50.40.3AADAB0.20.100 500 1000 1500 2000 2500 3000 3500Time (sec)Runs A, AD, and AB show how the specific gravity and the diameter affect theresponse, reducing the loss <strong>of</strong> sediment over time.Particle size has more effect on the loss <strong>of</strong> sediment than specific gravity.
Absolute CoefficientAbsolute CoefficientAbsolute CoefficientAbsolute CoefficientExperimental Design0.140.120.10.080.060.04Pareto <strong>of</strong> Coefficients - Y-hat Model600 secFlow rate (A) andwater depth (C)are the mostimportant factorsfor all timeframes0.180.160.140.120.10.080.060.04Pareto <strong>of</strong> Coefficients - Y-hat Model1,000 secSpecific gravity (D) leastimportant main factor0.020.020A C AC B AB D AD BC ABC CD ACD BCD ABD BDEffect Name0A C AC B AB BC D ABC AD CD ACD ABD BCD BDEffect Name0.20.18Pareto <strong>of</strong> Coefficients - Y-hat Model1,8000.20.18Pareto <strong>of</strong> Coefficients - Y-hat Model3,000 sec0.160.160.140.140.120.120.10.10.080.080.060.060.040.040.020.020A C B AC AB BC ABC D ABD AD BD CD ACD BCDEffect Name0A C B AC BC AB ABC D ABD BD AD CD BCD ACDEffect Name
Evaluation <strong>of</strong> Shear Stress: Description <strong>of</strong> the Model•Flow rates considered: 2, 5, 10, 20, and 40 L/s (30, 80, 160, 320,and 630 GPM). <strong>The</strong>se flows are high when compared to typicalinlet flows for catchbasin inlets, but were selected to correspond tothe available earlier laboratory and CFD test results to enablemore accurate comparisons.Annual Flow Rate Distributaries (GPM/acre pavement), (1 L/s ≈15 GPM) (Pitt and Khambhammettu 2006)Location 50 thPercentile70 thPercentile90 thPercentileMaximum flow rateexpected duringtypical rain yearSeattle, WA 16 28 44 60Portland, ME 31 52 80 130Milwaukee, WI 35 60 83 210<strong>Ph</strong>oenix, AZ 38 60 150 190Atlanta, GA 45 65 160 440
Evaluation <strong>of</strong> Shear Stress: Description <strong>of</strong> the ModelInlet geometries evaluated during this study: a 0.8 m-widerectangular inlet (representing typical gutter flows entering thecatchbasin) and a 300-mm-pipe inlet (12 inches) (representing inlinesump conditions); the outlet diameter (D) is 300 mm for bothcases.Elevations <strong>of</strong> sediment: 1.0, 0.8, and 0.6 m below the outlet. <strong>The</strong>sediment surface was assumed as a flat bottom.Water SurfaceWater SurfaceWater SurfaceSediment Surface1.0 m below the outletSediment Surface0.8 m below the outletSediment Surface0.6 m below the outlet
Simulation <strong>of</strong> Water ImpactSimulation <strong>of</strong> manhole with circular inlet (300 mmdiameter) and 40 L/s flow rate. Colors represent velocity(includes water and air phases).
Comparison <strong>of</strong> Hydrodynamic Effect: Water Impact<strong>The</strong> impact force <strong>of</strong> the waterfall coming from the pipe inlet isconsiderably higher than when the inlet is rectangular gutter flow.In the case <strong>of</strong> the rectangular inlet (left) the jet (with velocity magnitudes<strong>of</strong> about 1.2 m/s) only reaches about 0.15 m below the outlet; in contrast,the jet reaches about 0.5 m below the outlet when the inlet is circular.Steady-state velocity vectors ranged between 0 and 2.0 m/s. Flow rate: 20 L/s, Sediment levelbelow the outlet: 0.8 m. Rectangular inlet (left), circular inlet (right).
Comparison <strong>of</strong> Hydrodynamic Effect: Velocity FieldOnce steady-state condition is established, a rotationalvelocity field is developed due to the water flowing toward theoutlet; this velocity field reaches the sediment surface or thebottom <strong>of</strong> the chamber.Steady-state velocity vectors ranged between 0 and 0.5 m/s. Flowrate: 20 L/s, Sediment level below the outlet: 0.8 m. Rectangularinlet (left), circular inlet (right).
Initial Motion and Initial Suspension Criteria<strong>The</strong> sediment bed shifting will not necessarily representmigration out <strong>of</strong> the device because the sediment does notnecessarily reach the elevated outlet. Only suspendedsediment is assumed to leave the chamber.<strong>The</strong> Cheng-Chiew criterion (1999), which involves bothinitial motion and initial suspension, was evaluated. Thiscriterion relates the critical shear stress with the probabilitythat sediment with a particular specific gravity, diameter, andsettling velocity, becomes bed load or gets suspended.This shear stress was compared to initial-motion and initialsuspensioncritical shear stresses associated with a specificparticle size. A total <strong>of</strong> 30 different scenarios have beenevaluated to date.
t*Initial Motion and Initial Suspension CriteriaCritical Shear Stress CriteriaCheng-Chiew (1999) Initial MotionCheng-Chiew P=1% Initial SuspensionCheng-Chiew P=10% Van Rijn (1984)Xie (1981) Shields (Vanoni, 1975)1Suspended Load0.1Bed LoadNo motion0.010 1 10 100 1000Re *
Shear Stress (Pa)Initial Motion and Initial Suspension CriteriaInitial Motion and Initial Suspension Shear StressCheng-Chiew Criterion (1999)100Initial MotionInitial Suspension(Lb/ft 2 )2.09100.20910.02090.10.011 10 100 1000 10000 100000Diameter (mm)
Shear Stress: 0.8 m-wide Rectangular InletShear stress on the sediment layer at different elevations in aconventional manhole with a rectangular inlet <strong>of</strong> 0.8-m wide, and initialsuspension threshold for different particle sizes. Series <strong>of</strong> graphclassified by flow rate: 40, 20, 10, 5, and 2 LPS
Shear Stress: 300 mm-diameter Pipe InletShear stress on the sediment layer at different elevations in aconventional manhole with circular inlet <strong>of</strong> 300-mm diameter, andinitial suspension threshold for different particle sizes. Series <strong>of</strong>graph classified by flow rate: 40, 20, 10, 5, and 2 LPS
Conclusions (1)Flow rate, particle size, water depth, and their interactionsare significant factors that affect the scour <strong>of</strong> sediment in aconventional catchbasin sump.<strong>The</strong> inlet geometry has a significant effect on the scourpotential <strong>of</strong> sediments captured in conventional catchbasinsumps. <strong>The</strong> impact force will be greater when the waterfall isconcentrated in the smaller area associated with a pipe inlet.<strong>The</strong> overlying water layer depth above the sediment has animportant function in protecting the sediment layer from scour.High shear stresses caused by the impacting water jet will noteasily reach the sediment surface if the water is deep.
Conclusions (2)Flows smaller than 2.0 L/s (30 GPM), typical for stormwatercatchbasins, do not expose particles greater than 50 mm tosuspension in manholes with rectangular inlets wider than 0.8m. This suggests that the sediment would not be exposed toscour most <strong>of</strong> the time.CFD modeling to include 3D analyses (using Flow-3Ds<strong>of</strong>tware), and detailed laboratory tests using a full-scalemanhole are being used to verify the computational results.Finally, the results will be implemented in the WinSLAMMstormwater model to better consider sediment scour fromsmall hydrodynamic devices.