london city airport master plan - London City Airport Consultative ...
london city airport master plan - London City Airport Consultative ...
london city airport master plan - London City Airport Consultative ...

Create successful ePaper yourself
Turn your PDF publications into a flip-book with our unique Google optimized e-Paper software.
<strong>London</strong> <strong>City</strong> <strong>Airport</strong> – Master Plan – Statement of Intent<br />
LONDON CITY AIRPORT<br />
MASTER PLAN<br />
STATEMENT OF INTENT<br />
December 2004<br />
<strong>City</strong> Aviation House<br />
<strong>London</strong> <strong>City</strong> <strong>Airport</strong><br />
Royal Docks<br />
<strong>London</strong> E16 2PB<br />
www.<strong>london</strong><strong>city</strong><strong>airport</strong>.com
<strong>London</strong> <strong>City</strong> <strong>Airport</strong> – Master Plan – Statement of Intent<br />
CONTENTS<br />
1. Introduction<br />
2. Scheduled Passenger Traffic Forecasts for <strong>London</strong> <strong>City</strong><br />
<strong>Airport</strong><br />
3. Corporate Aviation<br />
4. <strong>London</strong> <strong>City</strong> <strong>Airport</strong> Master Plan Description<br />
5. Going Forward
<strong>London</strong> <strong>City</strong> <strong>Airport</strong> – Master Plan – Statement of Intent<br />
1. INTRODUCTION<br />
1.1 The White Paper, The Future of Air Transport, published in December 2003 stated<br />
that the Government expects <strong>airport</strong> operators to produce <strong>master</strong> <strong>plan</strong>s to take<br />
account of the conclusions on future developments set out in the White Paper in<br />
order that they can inform the content of Local Development Frameworks. In July<br />
2004 after feedback from stakeholders for further clarity on this expectation, the<br />
Government published ‘Guidance on the Preparation of <strong>Airport</strong> Master Plans’. This<br />
document helpfully details the purpose, scope, process and timetable for producing<br />
<strong>master</strong> <strong>plan</strong>s.<br />
1.2 <strong>London</strong> <strong>City</strong> <strong>Airport</strong> does not have an existing <strong>master</strong> <strong>plan</strong> that can be updated and<br />
therefore it has not been possible to produce a full <strong>master</strong> <strong>plan</strong> in the 6 months<br />
following the publication of the Guidance. During 2004 however, <strong>London</strong> <strong>City</strong><br />
<strong>Airport</strong> has succeeded in further formulating its passenger forecasts and outline<br />
development proposals and is able to present them here in a high level statement of<br />
intent.<br />
1.3 This statement of intent contains passenger forecasts for <strong>London</strong> <strong>City</strong> <strong>Airport</strong><br />
detailing reasons why we believe the ultimate potential of the <strong>London</strong> <strong>City</strong> <strong>Airport</strong><br />
site is greater than that suggested by the Government in the White Paper.<br />
- 1-1 -
<strong>London</strong> <strong>City</strong> <strong>Airport</strong> – Master Plan – Statement of Intent<br />
2. SCHEDULED PASSENGER TRAFFIC FORECASTS FOR<br />
LONDON CITY AIRPORT<br />
INTRODUCTION<br />
2.1 This section sets out long-term projections of demand for scheduled air services at<br />
<strong>London</strong> <strong>City</strong> <strong>Airport</strong> (LCY). Two different sources or approaches have been used to<br />
determine a Base Case Forecast for LCY:<br />
• Government forecasts<br />
• Forecast growth in the <strong>London</strong> working population particularly the finance<br />
and business services sectors based in LCY’s key catchment areas, and the<br />
correlation between recent growth in <strong>London</strong>’s finance and business services<br />
sector and passenger growth at LCY.<br />
2.2 Factual information about the growth of East <strong>London</strong> and the Thames Gateway has<br />
further supported the final base case forecast for scheduled passenger traffic.<br />
2.3 Demand, and forecasts for Corporate Aviation are discussed later in Chapter 3.<br />
GOVERNMENT FORECASTS<br />
Government Studies Informing White Paper Process (SERAS & RASCO)<br />
2.4 In preparing its aviation White Paper, the Government completed a study of South<br />
East and East of England Regional Air Services (SERAS). In addition it published six<br />
Regional Air Services (RAS) studies covering Wales, Scotland, the South West,<br />
Northern Ireland, the Midlands and the North of England. The latter have been<br />
integrated within the over-arching Regional Air Services Co-ordination (RASCO)<br />
Study. The SERAS and RASCO studies were published with the White Paper<br />
consultation process launched in July 2002. These documents included the DTLR<br />
2000 aviation forecasts updated to include in addition the years 2020 to 2030.<br />
Forecasts by Market Segment<br />
2.5 Key points from the DTLR 2000 forecasts are:<br />
• Total passengers in 2020 is 400 million passengers per annum (mppa), split<br />
330mppa international and 70mppa domestic<br />
• Overall growth in air travel is predicted at 4.3% a year<br />
- 2-2 -
<strong>London</strong> <strong>City</strong> <strong>Airport</strong> – Master Plan – Statement of Intent<br />
• Short haul, international, business travel growth rates:<br />
- UK-originating to increase at 4.7% a year to 20mppa by 2020<br />
- Foreign–originating to increase at 9.1% a year to 25mppa by 2025<br />
- Overall growth rate in this segment 6.6%<br />
• Short haul, international, leisure travel growth is predicted at 4% a year<br />
• Domestic travel between <strong>London</strong> and the regions is predicted to increase at<br />
3.3% a year<br />
Overall Forecasts for South East England<br />
2.6 The Government’s headline prediction is that with steadily increasing GDP and<br />
propensity to travel, the demand for air travel in the South East of England will<br />
double by 2020 and reach 301 mppa by 2030.<br />
2.7 The Aviation White Paper supports the provision of two new runways in the South<br />
East of England by 2030 to accommodate this demand although it is unlikely that the<br />
first, at Stansted <strong>airport</strong> could be delivered sooner than 2012. During this time LCY’s<br />
main competitor, Heathrow, will have little if any spare capa<strong>city</strong> to accommodate<br />
growth in regional/short haul services.<br />
SERAS Forecasts for <strong>London</strong> <strong>City</strong> <strong>Airport</strong><br />
2.8 The South-East consultation document considers <strong>London</strong> <strong>City</strong> <strong>Airport</strong> to be a ‘first<br />
tier’ <strong>airport</strong> of the South East alongside Southampton and Norwich <strong>airport</strong>s. Each of<br />
these <strong>airport</strong>s is considered to be able to play an important niche role in the future.<br />
LCY is identified as specialising as a mainly business <strong>airport</strong>.<br />
2.9 The main consultation document states the following in relation to <strong>London</strong> <strong>City</strong><br />
<strong>Airport</strong>:<br />
Retention of the existing 1200m runway with a new runway holding area, apron extension<br />
and additional terminal capa<strong>city</strong>. This would continue to support services using aircraft of a<br />
similar nature to those used today and assumes maximum use of the existing runway within<br />
the current air transport movement limits*. The terminal capa<strong>city</strong> of this option is around<br />
5mppa.<br />
2.10 *The current air transport movement limits for <strong>London</strong> <strong>City</strong> <strong>Airport</strong> are 73,000 per<br />
year.<br />
2.11 The DfT air passenger forecasting model presents forecasts for <strong>London</strong> <strong>City</strong> <strong>Airport</strong><br />
under two different demand scenarios:<br />
- 2-3 -
<strong>London</strong> <strong>City</strong> <strong>Airport</strong> – Master Plan – Statement of Intent<br />
(i) with no additional runway capa<strong>city</strong> in the South East but maximum use<br />
made of existing runways at the main <strong>airport</strong>s (constrained case)<br />
(ii) one with three new runways at the main <strong>airport</strong>s (high capa<strong>city</strong>).<br />
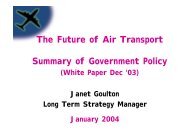
Fig. 1.0 Government Passenger Forecasts for LCY (SERAS, 2002)<br />
Million passengers per year<br />
6<br />
5<br />
4<br />
3<br />
2<br />
1<br />
0<br />
Without new<br />
runways in<br />
the South<br />
East<br />
2000 2005 2010 2015 2020 2025 2030<br />
- 2-4 -<br />
With new runways<br />
in the South East<br />
Table 1.0 – Government Forecasts for LCY (SERAS, 2002)<br />
Scenario 2002 2005 2010 2015 2020 2025 2030<br />
a) SE Runway Capa<strong>city</strong><br />
Constrained<br />
b) SE Runway Capa<strong>city</strong> Less<br />
Constrained<br />
2.12 Both these forecasts show <strong>London</strong> <strong>City</strong> <strong>Airport</strong> attaining a passenger throughput of<br />
approximately 5mppa by 2030, after which growth is viewed as being capped by the<br />
current air transport movement limit of 73,000 movements per year.<br />
<strong>London</strong> <strong>City</strong> <strong>Airport</strong>’s View on the SERAS Forecasts<br />
2.13 <strong>London</strong> <strong>City</strong> <strong>Airport</strong> does not agree with these forecasts for the following reasons:<br />
• Under both scenarios, the forecasts show that LCY would attract traffic<br />
quickly if there are capa<strong>city</strong> constraints elsewhere in the South East. If extra<br />
runways are provided in the South East, Government forecasts show that<br />
Year<br />
N/A 2.1 4.3 4.3 4.8 5.1 5.1<br />
N/A 2.1 4.1 2.0 4.0 4.2 4.8
<strong>London</strong> <strong>City</strong> <strong>Airport</strong> – Master Plan – Statement of Intent<br />
<strong>London</strong> <strong>City</strong> <strong>Airport</strong> will retain much of its traffic in the longer term. LCY<br />
concurs with this statement. However LCY believes it is unlikely that an<br />
annual throughput in excess of 4 mppa will be reached by 2010 as this would<br />
require annual growth of 17% over each of the next 6 years.<br />
• It is also unlikely that LCY will experience a dramatic fall in its passenger<br />
throughput in the years 2010 to 2015 even if runway capa<strong>city</strong> is provided at<br />
Stansted or Heathrow. This is due to the presence of strong local <strong>City</strong> and<br />
Docklands based demand that to date has proved loyal to LCY because of<br />
LCY’s unique service features. It is also unlikely that a second runway could<br />
be provided in the South East by 2010. Indeed the White Paper acknowledges<br />
that a second runway at Stansted <strong>Airport</strong> is unlikely to be operational until<br />
2012. The prospect of a third runway at Heathrow by 2015 is therefore also<br />
unlikely since the runway at Stansted is proposed to be built first.<br />
• LCY believes that the Government’s assumption that 5mppa could be<br />
achieved within 73,000 movements a year is optimistic as this implies 68<br />
passengers per air transport movement (ATM), and thus larger aircraft and<br />
load factors than are likely to be achieved while <strong>London</strong> <strong>City</strong> <strong>Airport</strong> serves a<br />
primarily business-focused market. There is no sign that the Government’s<br />
assumption of an average aircraft size of 100 seats at LCY is realistic.<br />
• The Government has taken 73,000 ATMs as a finite physical capa<strong>city</strong> limit<br />
rather than a <strong>plan</strong>ning constraint.<br />
2.14 When the Secretary of State for Transport, Alistair Darling, launched the Future of<br />
Air Transport consultation in parliament in July 2002, he stated that ‘doing nothing is<br />
not an option’ and that ‘as a first step we need to do all we possibly can to make the<br />
most of existing capa<strong>city</strong>’.<br />
2.15 It appears that this option proposed for LCY in the consultation document is at odds<br />
with the sentiment expressed by the Secretary of State since it refers to the current air<br />
transport limits imposed on LCY by the local <strong>plan</strong>ning authority, the <strong>London</strong><br />
Borough of Newham.<br />
2.16 The current annual air transport movement limit of 73,000 was granted in 1997 when<br />
the <strong>airport</strong> applied to double the previous limit of 36,500 ATMs in order to allow the<br />
maximum use of existing infrastructure and allow the economic benefits flowing<br />
from more air services to be secured by the local community. At no time has the<br />
ultimate physical capa<strong>city</strong> of the runway been assessed as limited to only 73,000<br />
ATMs. Indeed single runways elsewhere can be seen to have significantly higher<br />
capacities, one example being Gatwick with 250,000 ATMs in 2000.<br />
- 2-5 -
<strong>London</strong> <strong>City</strong> <strong>Airport</strong> – Master Plan – Statement of Intent<br />
2.17 LCY believes that its future growth should not be artificially constrained by the<br />
current <strong>plan</strong>ning limit on ATMs. The White Paper acknowledges LCY’s response to<br />
the consultation by recognising that with further development, a higher throughput<br />
than 5mppa could be achieved. LCY envisages long-term growth potential well<br />
beyond 73,000ATMs and 5mppa.<br />
GROWTH IN LONDON<br />
2.18 One of the reasons that LCY strongly believes that its growth potential extends<br />
beyond 5mppa is because of forecasts and strategic direction given by the Greater<br />
<strong>London</strong> Authority in its <strong>London</strong> Plan published in February 2004. This <strong>plan</strong> provides<br />
the economic, social and environmental framework to guide <strong>London</strong>’s future<br />
development until 2020. The <strong>London</strong> Plan details the development strategy for five<br />
distinct sub-regions of the <strong>city</strong>: West, North, Central, South and East. Within each<br />
sub-region of the Plan, 3 types of area are identified with the scope for the most<br />
significant development or change. These areas are Opportunity Areas, Areas for<br />
Regeneration and Areas for Intensification.<br />
2.19 Opportunity Areas are brownfield sites and places with potential for increases in<br />
density. These are primarily identified as being located in the east of <strong>London</strong> along<br />
the Thames Gateway. It is proposed that such areas would typically accommodate at<br />
least 5,000 jobs or 2,500 homes or a mix of the two. Areas for Regeneration - those<br />
prioritised for action and investment particularly in the fields of housing, education,<br />
employment, environment and health – are also concentrated in East <strong>London</strong>, north<br />
of the River Thames.<br />
2.20 East <strong>London</strong> and the Thames Gateway are identified in the <strong>London</strong> Plan as the<br />
‘priority’ sub-region because it has the highest number of the capital’s Opportunity<br />
Areas and Areas for Regeneration. The document says ‘much of the forecast growth<br />
should be accommodated in areas close to the <strong>City</strong> including the <strong>City</strong> fringe, Isle of Dogs,<br />
Stratford and along the Thames Gateway. In addition to a high level of economic<br />
development, East <strong>London</strong> should accommodate significant new housing’. It goes on ‘East<br />
<strong>London</strong> should become <strong>London</strong>’s gateway to mainland Europe, building particularly on the<br />
Stratford International Railway Station, but also on access to <strong>City</strong> and Stansted <strong>airport</strong>s, the<br />
Channel Tunnel and the Port of <strong>London</strong>………..Stratford should take advantage of its<br />
proximity to the Channel Tunnel Rail Link (CTRL) and the enhanced links this will bring to<br />
the wider South East region and Europe to promote itself as a home for European Business.<br />
2.21 We have extracted (below) some of the data from the <strong>London</strong> Plan that clearly<br />
identifies East <strong>London</strong> for future economic growth.<br />
- 2-6 -
<strong>London</strong> <strong>City</strong> <strong>Airport</strong> – Master Plan – Statement of Intent<br />
POPULATION GROWTH IN LONDON<br />
2.22 The <strong>London</strong> Plan predicts a population increase in <strong>London</strong> of 800,000 people<br />
between 2002 and 2016. This is equivalent to a <strong>city</strong> the size of Leeds. <strong>London</strong>’s<br />
working age population is predicted to grow by 516,000 people over this time period.<br />
2.23 To meet the <strong>plan</strong>ned population growth of 800,000 people, the <strong>London</strong> Plan forecasts<br />
that the number of households in <strong>London</strong> will need to grow by 336,000 to 2016. This<br />
is equivalent to 22,400 additional households per year.<br />
2.24 Table 1.1 below summarises the spatial allocation of jobs and housing across <strong>London</strong>.<br />
This clearly identifies East <strong>London</strong> as the recipient of almost a third of all of<br />
<strong>London</strong>’s housing provision until 2016 and an even greater proportion of <strong>London</strong>’s<br />
jobs.<br />
Table 1.1 Minimum homes and jobs targets for <strong>London</strong>’s sub-regions to 2016<br />
Sub-Region Housing Proportion of Jobs Allocation Proportion of<br />
Allocation Total (%)<br />
Total (%)<br />
Central <strong>London</strong> 140,000 30.5 239,000 37.5<br />
East <strong>London</strong> 142,000 31 249,000 39<br />
West <strong>London</strong> 60,000 13 86,000 13.5<br />
North <strong>London</strong> 60,000 13 26,000 4<br />
South <strong>London</strong> 57,000 12.5 36,000 6<br />
TOTAL MINIMUM OF 100 MINIMUM OF 100<br />
459,000<br />
636,000<br />
Source: The <strong>London</strong> Plan GLA 2004<br />
EMPLOYMENT GROWTH IN FINANCE AND BUSINESS SERVICES SECTORS AND<br />
IMPACT ON DEMAND FOR LCY<br />
2.25 Projections for the Mayor’s <strong>London</strong> Plan suggest that total employment in <strong>London</strong><br />
will increase by 636,417 jobs between 2001 and 2016. As Table 1.2 shows, the largest<br />
volume (69%) of the total increase in employment over this period will come from<br />
the Business Services sector (accountancy, law, management consultancy, corporate<br />
finance advice, telecommunications, advertising, marketing services and new<br />
media). The greatest percentage increase will be seen in ‘Other Services’ - predicted<br />
to grow by 50%. ‘Other Services’ refers to entertainment, leisure and creative<br />
industries.<br />
- 2-7 -
Year/Sector<br />
<strong>London</strong> <strong>City</strong> <strong>Airport</strong> – Master Plan – Statement of Intent<br />
Table 1.2 Employment Projections for Growth Sectors<br />
Hotels &<br />
Restaurants<br />
Financial<br />
Services<br />
- 2-8 -<br />
Business<br />
Services<br />
Health &<br />
Education Other Services<br />
2001 303,583 249,667 1,152,667 610,000 351,750<br />
2006 350,000 260,000 1,300,000 627,000 415,000<br />
2011 400,000 270,000 1,445,000 644,000 470,000<br />
2016 445,000 275,000 1,590,000 660,000 530,000<br />
Increase 141,417 25,333 437,333 50,000 178,250<br />
Source GLA (Volterra Consultants) 2002<br />
2.26 One of the reasons that LCY strongly believes that its growth potential extends<br />
beyond 5mppa is because work has been undertaken on the relationship between<br />
passenger growth at LCY and both the growth in financial and business service<br />
employment and the growth of employment on the Canary Wharf Estate.<br />
2.27 Linear regression was used to determine the correlation between passenger numbers<br />
from 1997 to 2001 inclusive and the numbers of persons working in the business and<br />
financial services sector within <strong>London</strong>.<br />
2.28 The regression relationship was then used to predict LCY passenger growth on the<br />
basis of Greater <strong>London</strong> Authority’s forecast growth in business and financial<br />
services sector jobs in <strong>London</strong>. A similar approach was used in relation to recent and<br />
forecast growth in employment at the Canary Wharf estate. The results are shown<br />
in Figures 1.1 and 1.2.<br />
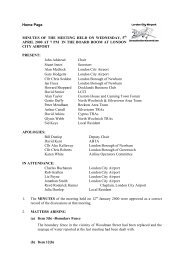
Figure 1.1 - Growth of Financial and Business Services and <strong>London</strong> <strong>City</strong> <strong>Airport</strong><br />
Passengers<br />
Passengers per year at <strong>London</strong> <strong>City</strong> <strong>Airport</strong><br />
4,000,000<br />
3,500,000<br />
3,000,000<br />
2,500,000<br />
2,000,000<br />
1,500,000<br />
Actual – 1997 to 2001<br />
Passenger projections based<br />
on GLA job forecasts for<br />
years shown<br />
2006<br />
2011<br />
2016<br />
1,000,000<br />
1,000,000 1,200,000 1,400,000 1,600,000 1,800,000 2,000,000<br />
No of Jobs in <strong>London</strong>’s Financial and Business Services Sectors
<strong>London</strong> <strong>City</strong> <strong>Airport</strong> – Master Plan – Statement of Intent<br />
2.29 On the basis alone of employment growth in the financial and business services<br />
sectors overall, passenger numbers are predicted to exceed 2mppa before 2006 and<br />
reach 2.9mppa by 2016. However, we firmly believe this figure to be an<br />
underestimate, as this does not take into account the advent of the direct Docklands<br />
Light Railway (DLR) service to LCY in 2005 that will make LCY more attractive and<br />
increase its share of market demand. The DLR service will provide a direct fixed rail<br />
link between LCY, Canary Wharf and the <strong>City</strong>, key catchment areas for the <strong>airport</strong>.<br />
The further extension of the DLR south of the river to Woolwich in 2008, with a<br />
multitude of onward connections possible from there to south-east <strong>London</strong> and Kent,<br />
bolsters further LCY’s catchment area to the east into the Thames Gateway.<br />
Passengers per year at <strong>London</strong> <strong>City</strong><br />
<strong>Airport</strong><br />
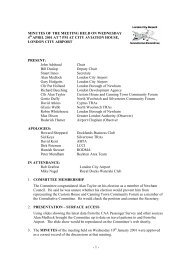
Figure 1.2 - Growth of Employment on Canary Wharf Estate and <strong>London</strong> <strong>City</strong><br />
<strong>Airport</strong> Passengers<br />
3,500,000<br />
3,000,000<br />
2,500,000<br />
2,000,000<br />
1,500,000<br />
1,000,000<br />
500,000<br />
-<br />
Actual passenger numbers: 1993<br />
to 2003<br />
- 15,000 30,000 45,000 60,000 75,000 90,000 105,000 120,000<br />
Number of jobs at Canary Wharf<br />
- 2-9 -<br />
2007<br />
2010<br />
Passenger projection based on<br />
anticipated population at<br />
Canary Wharf<br />
Note: Figures 1.1 and 1.2 are based on linear regression analysis with strong correlation coefficients.<br />
However, the further ahead the results are used to predict, the less reliable they become. The results<br />
also depend on the reliability of the forecast numbers of jobs in the financial services sector and at<br />
Canary Wharf estate, and these are related to one another.<br />
2.30 On the basis of employment growth on the Canary Wharf estate, Figure 1.2 predicts<br />
2.7mppa at LCY by 2010, which is as far as Canary Wharf group’s publicly available<br />
and date related forecasts currently extend. The Canary Wharf Group estimates that<br />
once all the land that it owns is fully developed 125,000 people will work on its<br />
estate. It is not prepared to forecast when all land will be fully developed. However,<br />
it is interesting to note that in 2002 the final working population at Canary Wharf<br />
was estimated to be only 90,000 -100,000. The working population on the Canary<br />
Wharf estate at the end of 2004 is 65,000.
<strong>London</strong> <strong>City</strong> <strong>Airport</strong> – Master Plan – Statement of Intent<br />
2.31 Again, we believe this projection to be an underestimate for the reason mentioned<br />
above and due to the fact they do not take into account the shortfall in capa<strong>city</strong><br />
elsewhere in the South East, notably at Heathrow, and the overspill from Heathrow<br />
to LCY.<br />
2.32 There will also be additional growth in the Docklands locality, including 20,000 jobs<br />
projected at the Millennium Quarter south of the Canary Wharf estate by 2015 and a<br />
further 30,000 jobs in the Royal Docks area in a similar timeframe, bringing the total<br />
to perhaps 150,000 jobs in the whole Docklands area by 2015 in financial and<br />
business support services.<br />
2.33 The financial sector’s slowdown and job losses halted passenger growth at LCY in<br />
2002 and 2003 at LCY. Growth has returned in 2004 and it is expected that the full<br />
calendar year will see approximately 1.67 million passengers, the highest the <strong>airport</strong><br />
has even seen.<br />
2.34 The LCY team that compiled LCY’s SERAS consultation response in 2002 undertook<br />
some research on current and future purchasing habits of corporate firms. The<br />
results showed that such companies are focused on cost reduction and streamlining<br />
procurement by focusing on travel policy compliance, cutting the cost of ground<br />
travel to <strong>airport</strong>s (for which DLR will be welcome) and switching to self-booking of<br />
flights using self-service reservation systems on corporate intranets to reduce travel<br />
agents’ commissions.<br />
2.35 Despite the cyclical downturn and employment reductions that were occurring at the<br />
time the LCY survey was carried out in the finance sector, most corporate firms<br />
claimed they had no <strong>plan</strong>s to replace business travel with alternatives such as videoconferencing<br />
or use budget airlines.<br />
- 2-10 -
<strong>London</strong> <strong>City</strong> <strong>Airport</strong> – Master Plan – Statement of Intent<br />
FORECAST FOR LCY<br />
The Base Case<br />
1.6mppa<br />
Figure 1.3 – Base Case Forecast & Assumptions<br />
463,000 additional jobs in <strong>London</strong><br />
in financial and business services<br />
DLR Link to<br />
LCY 2005<br />
3mppa+<br />
LCY average<br />
annual growth 9%<br />
Growth of Thames Gateway<br />
Employment in<br />
Canary Wharf and<br />
Royals ~ 150,000<br />
Now (2004) 2010 2020 2030<br />
- 2-11 -<br />
5.0mppa<br />
LCY average<br />
annual growth 6%<br />
8.0mppa<br />
2.36 Government forecasts for LCY, and projections based on growth in financial and<br />
business services suggest demand of 3.0mppa by 2010. This corresponds to an<br />
average growth rate of 9% a year, similar to the rate of growth at LCY between 1997<br />
and 2001. LCY’s 2000 forecasts in connection with the Operational Improvements<br />
Programme – the <strong>plan</strong>ning permission already granted for the physical expansion of<br />
the <strong>airport</strong> by a runway holding point and 4 or 5 extra apron stands - predicted<br />
2.98m scheduled passengers by 2010.<br />
2.37 Government forecast growth rates to 2020 (DETR, 2000) for short-haul business and<br />
leisure market segments stated above have been taken into account in determining<br />
this base case.<br />
2.38 After 2010 growth is expected to slow. Reasons for this include the opening at<br />
Heathrow of Terminal 5 Phase 1 in 2007 and Phase 2 in 2011, a Crossrail link to<br />
Heathrow after 2010 ahead of a possible station in the Royal Docks and by 2012 an<br />
additional runway at Stansted. Forecasting beyond 2010 the base case assumes 6%<br />
annual growth
<strong>London</strong> <strong>City</strong> <strong>Airport</strong> – Master Plan – Statement of Intent<br />
2.39 Table 1.3 shows the forecast scheduled passenger numbers by 5-year intervals.<br />
Base<br />
Case<br />
Table 1.3 Base Case Forecast for LCY 2004-2030<br />
2004 2005 2010 2015 2020 2025 2030<br />
1.67 1.84 3.0 3.87 5.0 6.3 8.0<br />
Characteristics of Future Demand<br />
2.40 It is not anticipated that the operating hours of the <strong>airport</strong> will significantly change in<br />
the future. Thus the increasing volume of passengers will be accommodated within<br />
the same hours by increasing the proportion of traffic handled in off peak periods.<br />
2.41 The average hourly passenger loads are expected to increase at a relatively higher<br />
rate during off-peak hours than in the peak hours. This will arise from the increased<br />
frequencies on the major routes providing more attractive mid-day travel options for<br />
business travellers, together with an increasing development of the leisure market at<br />
LCY. In addition it is anticipated that the average aircraft size will increase relatively<br />
less during these peak periods.<br />
- 2-12 -
<strong>London</strong> <strong>City</strong> <strong>Airport</strong> – Master Plan – Statement of Intent<br />
3. CORPORATE AVIATION<br />
SERAS Forecast Demand for Corporate Aviation in the South East<br />
3.1 One of the documents published by the Government when it launched the Aviation<br />
White Paper consultation process in July 2002, was a study on the demand for<br />
business aviation services in the South East.<br />
3.2 The study acknowledges that this sector of the market has to date largely relied on<br />
ability to access slots at the major <strong>airport</strong>s in the South East (particularly Heathrow<br />
and Gatwick and increasingly Luton and Stansted). The trend for corporate aviation<br />
to be pushed out of the major <strong>airport</strong>s, in favour of using the slots for more valuable<br />
commercial traffic, is unlikely to be reversed.<br />
3.3 Government forecasts (SERAS supporting study ‘Business Aviation in the South East<br />
Part 3: Future Capa<strong>city</strong> for Business Aviation’ May 2002, Table 1) predict corporate<br />
aviation growth rates of between 0% and 3%.<br />
3.4 The SERAS Business Aviation Study predicts a substantial shortfall in capa<strong>city</strong> for<br />
corporate aviation in the South East. It predicts only 5,000 movements at Heathrow,<br />
Gatwick, Stansted and Luton in 2030 compared with 36,000 movements at these<br />
<strong>airport</strong>s now. Alternative sites identified for corporate aviation ‘near’ <strong>London</strong><br />
include Biggin Hill, Blackbushe, Fairoaks, Farnborough, Northolt and Southend. The<br />
government expects Farnborough and Northolt will together be constrained to fewer<br />
than 40,000 movements of all types. The other <strong>airport</strong>s identified for corporate<br />
aviation lack facilities or suffer in terms of their distance from <strong>London</strong> and poor<br />
connections. The SERAS study suggests that the shortfall in capa<strong>city</strong> to meet<br />
corporate aviation demand in the South East will be felt as early as 2005 and will get<br />
progressively worse reaching a capa<strong>city</strong> shortfall of some 100,000 movements by<br />
2030, representing 68% of the total market demand.<br />
3.5 This study forecast 1,000 corporate aircraft movements per year at LCY for the entire<br />
30-year <strong>plan</strong>ning timeframe. In the 12 months to November 2004, LCY handled 6,631<br />
corporate aviation movements.<br />
3.6 <strong>London</strong> <strong>City</strong> <strong>Airport</strong> believes that the Government has under-estimated the<br />
contribution that LCY can make towards meeting demand for business aviation<br />
services in the South East.<br />
- 3-13 -
<strong>London</strong> <strong>City</strong> <strong>Airport</strong> – Master Plan – Statement of Intent<br />
3.7 Our reasons are as follows:<br />
• Part of the reason for the under-estimate may be the fact that the study was 5<br />
years old when it informed the consultation process.<br />
• The principal drivers of corporate aviation are speed, convenience and<br />
discretion. Corporate aviation complements the scheduled aviation business<br />
at LCY because it allows users to reach destinations not served by scheduled<br />
carriers. It allows clients to visit maybe 3 or 4 destinations in a single working<br />
day; something not achievable using scheduled carriers.<br />
• These drivers are the reasons for corporate aviation being likely to grow<br />
strongly at <strong>London</strong> <strong>City</strong> <strong>Airport</strong> in future years. LCY, being the closest <strong>airport</strong><br />
to central <strong>London</strong>, is in a prime position to cater for this market that<br />
otherwise has to be accommodated at <strong>airport</strong>s on the fringes of <strong>London</strong>, or<br />
not in <strong>London</strong> at all. A passenger using LCY can be in the centre of <strong>London</strong> in<br />
less than 30 minutes. This is not achievable at any of the other <strong>airport</strong>s<br />
identified by the Government as being sites to accommodate future demand<br />
for corporate aviation.<br />
• Corporate aviation in Europe is forecast to grow strongly in the coming years<br />
due to the rise in Europe of a US originating innovation, fractional ownership,<br />
where 100% aircraft ownership is not necessary. The corporate equivalent to<br />
‘low-cost’ scheduled airlines, it is possible to purchase a fractional interest<br />
equivalent to a given number of hours of use. Netjets is the leader in this field<br />
and owns and operates manages around 500 aircraft worldwide with orders<br />
for a further 1,200. Netjets Europe was launched in 1996 and today has a fleet<br />
of 50 aircraft based in Europe. Netjets, already a customer of LCY, had 9,768<br />
movements in the 12 months July 2003 – June 2004 in the <strong>London</strong> area. Of<br />
these 1,672 or 17% were handled at <strong>London</strong> <strong>City</strong> <strong>Airport</strong>. Of all the European<br />
<strong>airport</strong>s that Netjets flew to during the same period, LCY was the 6th most<br />
used <strong>airport</strong>. In the eleven months to November 2004 Netjets operated 2,535<br />
movements at LCY.<br />
• LCY is ideally positioned to accommodate some of the demand arising in<br />
central and east <strong>London</strong>.<br />
• Aircraft types such as the Dassault Falcon series and Cessna Citation series,<br />
which account for a significant proportion of business aviation fleets, are<br />
certified for use at LCY. Approximately 40% of all European corporate jets can<br />
access LCY. <strong>London</strong> <strong>City</strong> <strong>Airport</strong> has only recently begun to market this<br />
- 3-14 -
<strong>London</strong> <strong>City</strong> <strong>Airport</strong> – Master Plan – Statement of Intent<br />
business seriously and new operators are applying for permission to use the<br />
facility on a weekly basis. This strong level of interest has exceeded all<br />
expectations.<br />
3.8 <strong>London</strong> <strong>City</strong> <strong>Airport</strong>’s corporate Jet Centre is ideally placed to continue providing<br />
capa<strong>city</strong> for this section of the market and LCY welcomes the Government’s general<br />
statement in the White Paper as set out in the paragraph below:<br />
The ability of business aviation to gain access to the main <strong>airport</strong>s in South East will continue<br />
to be problematic as capa<strong>city</strong> constraints cause <strong>airport</strong> to focus on more valuable commercial<br />
traffic. The Government recognises the important contribution made by small <strong>airport</strong>s in the<br />
South East in providing capa<strong>city</strong> for business aviation. We support the adoption of policies<br />
which encourage the continued provision of these services.<br />
FORECAST FOR LONDON CITY AIRPORT<br />
3.9 Corporate aviation trends for <strong>London</strong> <strong>City</strong> <strong>Airport</strong> for the past 5 years are shown in<br />
Figure 2.0. The high growth rates experienced over the past couple of years support<br />
the points made above and have been possible due to the new dedicated facility.<br />
Figure 2.0 – Corporate Aviation Movements and Passengers at <strong>London</strong> <strong>City</strong> <strong>Airport</strong> 2000<br />
to 2004 (est)<br />
Corporate Aviation Movements<br />
8,000<br />
7,000<br />
6,000<br />
5,000<br />
4,000<br />
3,000<br />
2,000<br />
1,000<br />
0<br />
- 3-15 -<br />
�����������<br />
�����������<br />
�����������<br />
�����������<br />
�����������<br />
�����������<br />
�����������<br />
�����������<br />
�����������<br />
�����������<br />
�����������<br />
�����������<br />
�����������<br />
�����������<br />
�����������<br />
2000 2001 2002 2003 2004 est<br />
CA Movts 1,958 1,762 2,788 3,784 6,878<br />
CA Pax 6,747 6,266 6,992 8,130 14,271<br />
16,000<br />
14,000<br />
12,000<br />
10,000<br />
8,000<br />
6,000<br />
4,000<br />
2,000<br />
0<br />
Corporate Aviation Passengers
<strong>London</strong> <strong>City</strong> <strong>Airport</strong> – Master Plan – Statement of Intent<br />
3.10 <strong>London</strong> <strong>City</strong> <strong>Airport</strong> expects further rapid early corporate aviation growth rates,<br />
reducing in the longer term, to give a long term forecast as shown in Table 2.0 and<br />
Figure 2.2.<br />
Table 2.0 - Corporate Aviation Movements for South East & <strong>London</strong> <strong>City</strong> <strong>Airport</strong><br />
Scenario 2005 2010 2015 2020 2025 2030<br />
LCY Forecast 8,562 16,000 20,000 25,000 26,275 27,615<br />
SERAS ‘High’ Scenario for all<br />
South East <strong>Airport</strong>s<br />
- 81,000 - 109,000 - 146,000<br />
LCY Market Share - 20% - 23% - 17%<br />
Fig 2.2 Forecast Corporate Aviation Movements at <strong>London</strong> <strong>City</strong> <strong>Airport</strong> 2005-2030<br />
30000<br />
25000<br />
20000<br />
15000<br />
10000<br />
5000<br />
0<br />
2005 2010 2015 2020 2025 2030<br />
CA Mvts 8562 16000 20000 25000 26275 27615<br />
- 3-16 -
<strong>London</strong> <strong>City</strong> <strong>Airport</strong> – Master Plan – Statement of Intent<br />
4. LONDON CITY AIRPORT MASTER PLAN DESCRIPTION<br />
INTRODUCTION<br />
4.1 This chapter details the phases of development <strong>plan</strong>ned for the <strong>airport</strong> site and<br />
immediate environs. The phases detailed below cover a period of 20 – 25 years,<br />
depending upon commercial demand for the <strong>Airport</strong>.<br />
4.2 The development begins with a base case (Phase 1). This represents the scenario from<br />
the completion of the Docklands Light Railway (DLR) <strong>airport</strong> extension scheduled by<br />
late 2005.<br />
4.3 The description of development occurring in phases 2, 3 and 4 is grouped by<br />
category of activity or infrastructure and guides the reader through the <strong>plan</strong>s from<br />
the western end of the <strong>airport</strong> site to the eastern end of the site. Once the site is fully<br />
developed it is expected to be able to accommodate approximately 8mppa.<br />
PHASE 1<br />
Base Case 2005<br />
4.4 This phase represents the <strong>airport</strong> in 2005 with the corporate aviation Jet Centre<br />
building, main terminal building and pier fixed in their current locations, alongside<br />
the runway and new holding point completed in autumn 2003. The airside roadway<br />
runs adjacent and parallel to the pier and aircraft self-manoeuvre onto stand.<br />
4.5 Shown on this base case is the alignment of the DLR together with altered surface<br />
access arrangements, the DLR <strong>London</strong> <strong>City</strong> <strong>Airport</strong> station and the link into the<br />
terminal currently being constructed. The completion of the DLR will result in an<br />
increase in the amount of land designated as ‘airside’ at the western end of the<br />
airfield. Also shown is the addition of the eastern apron built over the King George V<br />
Dock next to the terminal. This is designed around the largest aircraft likely to<br />
operate.<br />
4.6 The location of the replaced <strong>airport</strong> headquarters building, <strong>City</strong> Aviation House, a<br />
new compound for use by car hire operators and a new in-flight catering building is<br />
also shown. The maintenance facilities currently housed in the ‘blue shed’ warehouse<br />
and the location of the Royal Docks Water Ski Club are identified. The alignment of<br />
- 4-17 -
<strong>London</strong> <strong>City</strong> <strong>Airport</strong> – Master Plan – Statement of Intent<br />
the DLR is shown as extending eastwards to King George V station from where it<br />
will proceed underground to Woolwich by 2008.<br />
PHASE 2<br />
Jet Centre<br />
4.7 The Jet Centre building doubles its size from the base case by expanding on the<br />
western side of the building with 6 modules width. Further landside car parking may<br />
accompany this, however a passenger ‘drop-off’ lane will be created parallel to<br />
Hartmann road, which reduces the need for this. Further aircraft parking space could<br />
be provided to the east of the facility by relocation of older buildings.<br />
4.8 The Transco gas valve situated next to the Jet Centre building can be moved to create<br />
additional aircraft parking. The vehicle check-point (VCP) which is a demountable<br />
building designed for relocation, would move southeastwards from its current<br />
position to make way for the next stages of this development.<br />
West End of the Site<br />
4.9 An extension to the existing pier occurs to provide a gate 10. The ‘Ledger’ building<br />
(housing ground services and airline engineering functions) is removed, and<br />
replaced by a new building to the immediate west of the pier extension (with space<br />
for equipment storage underneath). Adjoining the Ground Services facility,<br />
building(s) to accommodate engineering and corporate maintenance facilities would<br />
be provided.<br />
4.10 An aircraft hangar is provided. The fuel farm location remains as in the base case,<br />
but with the introduction of hydrant fuelling, the fuel dispensing area is initially<br />
merged with the fuel farm and then removed entirely. A ‘new’ fire station is<br />
provided to the west of the current location. A new vehicle checkpoint is provided to<br />
the south of the new fire station. The airside road is moved to the rear of the stands<br />
allowing a change to nose-in aircraft parking. The apron is ‘straightened’ at this<br />
western end allowing more aircraft parking space.<br />
Aircraft Parking<br />
4.11 The airside roadway on the main apron moves north of the aircraft parking stands.<br />
The parking configuration is changed to nose-in to facilitate handling.<br />
- 4-18 -
<strong>London</strong> <strong>City</strong> <strong>Airport</strong> – Master Plan – Statement of Intent<br />
‘Triangle’ Terminal Building<br />
4.12 A western extension to the terminal building is created on land isolated by the DLR<br />
railway line.<br />
Apron & Terminal<br />
4.13 The terminal is extended eastwards (‘finger’ extension) and a deeper pier structure<br />
with integral lounges is provided to serve the aircraft stands on the eastern apron.<br />
Commercial Property Development<br />
4.14 Vacant land at the eastern end of the site currently on long-term lease to the <strong>Airport</strong><br />
Group is scheduled for medium density development as part of the associated<br />
<strong>plan</strong>ning agreements, (shown as residential but could be mixed-use). ‘Social’ housing<br />
could be provided on land to the south of KGV DLR station and north of Newland<br />
Street.<br />
4.15 The DLR is extended to Woolwich providing access to the development and onwards<br />
into the <strong>City</strong>, from south of the Thames.<br />
4.16 The Royal Docks Management Authority also <strong>plan</strong>s to have created a new water-ski<br />
club and ski tow course.<br />
Albert Island (east of the runway)<br />
4.17 As assumption is made that this piece of land can come into LCY ownership<br />
following negotiations with the <strong>London</strong> Development Agency already in progress.<br />
As most of this area is within the public safety zone of the <strong>airport</strong>, general, non<strong>airport</strong><br />
development is restricted.<br />
4.18 The Fire Training Ground and facility are relocated at this time from the west end of<br />
the airfield to this Island and swing bridge controlled access is provided from the<br />
airfield for fire service use.<br />
PHASE 3<br />
Jet Centre<br />
4.19 A further extension to the eastern end of the Jet Centre building of approximately a<br />
third occurs plus an extension of the ‘drop-off’ lane. Aircraft parking is expanded to<br />
the north of the runway’s approach lighting (‘North Apron’). This is provided<br />
following the relocation of the Fire training Ground in the previous phase.<br />
- 4-19 -
<strong>London</strong> <strong>City</strong> <strong>Airport</strong> – Master Plan – Statement of Intent<br />
West End<br />
4.20 The fuel farm is removed completely to the eastern end of the <strong>airport</strong> site. The<br />
hangar facility is extended westwards (over the old fuel farm location) and extra<br />
apron space becomes available to the north of this hangar extension.<br />
Apron & Terminal<br />
4.21 The terminal is further extended eastward by infilling the dock between the dock<br />
edge and the pier. The pier is further extended eastwards to serve additional aircraft<br />
parking stands.<br />
Aircraft Parking Stands<br />
4.22 Up to 5 new stands, and taxi-lane running the length of runway to join with the<br />
runway 28-hold point, are constructed.<br />
Surface Access & Support Facilities<br />
4.23 The terminal forecourt area is extended eastwards over the current business car park.<br />
Provision is made for a multi-storey car park of up to seven storeys (approximately<br />
along half the length of car park as shown on base case). <strong>City</strong> Aviation House is<br />
extended by approximately 30m eastwards and 30m westwards. A dedicated<br />
facilities maintenance building is built to the east of the multi-storey car park. Car<br />
hire is also assumed to have relocated off site or provided for within the multi-storey<br />
car park.<br />
Albert Island<br />
4.24 With the phased introduction of hydrant fuelling, a pipe feed from a small bargesupplied<br />
terminal located on the Island replaces the fuel dispensing facility and<br />
storage farm at the western end of the site.<br />
4.25 A combined heat and power (CHP) <strong>plan</strong>t is provided to serve both the <strong>airport</strong> and<br />
the residential development.<br />
PHASE 4<br />
Terminal<br />
4.26 The terminal is further extended eastwards along the southern portion of the apron<br />
previously built over the dock and absorbs the deep pier structure.<br />
4.27 This allows the temporary closure of the original terminal so that the northern half<br />
can be removed along with the gate structures for gates 1 –3. This area is converted<br />
- 4-20 -
<strong>London</strong> <strong>City</strong> <strong>Airport</strong> – Master Plan – Statement of Intent<br />
to aircraft parking stands aligned with those built over the dock and allows for<br />
larger-sized aircraft to use stands 1-4.<br />
4.28 As this work removes the Air Traffic Control tower from its current location, a new<br />
tower is built.<br />
Passenger Access<br />
4.29 With the increase in terminal capa<strong>city</strong>, modifications are made to extend the terminal<br />
drop-off zone and associated public transport facilities eastwards.<br />
Aircraft Parking Stands<br />
4.30 A further area of apron and pier is built for up to five aircraft stands. This adjoins the<br />
parallel taxi-lane built in the previous phase for access to the runway 28 hold.<br />
- 4-21 -
<strong>London</strong> <strong>City</strong> <strong>Airport</strong> – Master Plan – Statement of Intent<br />
5. GOING FORWARD<br />
5.1 It is <strong>London</strong> <strong>City</strong> <strong>Airport</strong>’s intention to work in 2005 on producing a full <strong>master</strong> <strong>plan</strong><br />
following guidelines published by the Government and assessing in detail the core<br />
areas of safeguarding and land/property take, surface access initiatives, impact on<br />
people and the natural environment and proposals to minimise and mitigate<br />
impacts.<br />
5.2 We intend to submit a <strong>master</strong> <strong>plan</strong> in line with the Government’s guidelines by the<br />
end of the 2005.<br />
- 5-22 -