Engineering
Engineering
Engineering

You also want an ePaper? Increase the reach of your titles
YUMPU automatically turns print PDFs into web optimized ePapers that Google loves.
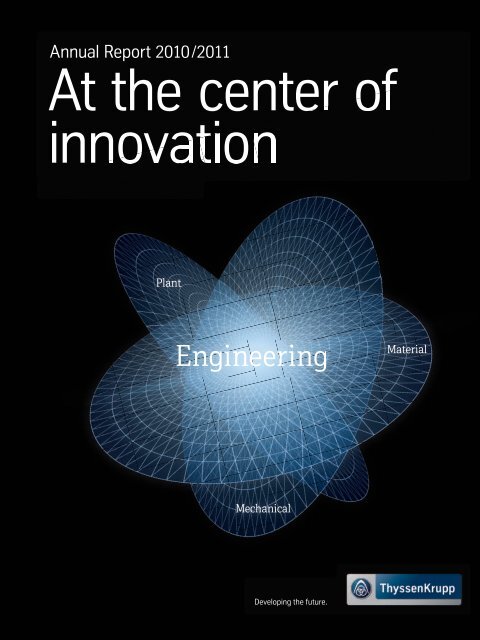
Annual Report 2010/2011<br />
At the center of<br />
innovation<br />
Plant<br />
<strong>Engineering</strong><br />
Mechanical<br />
Developing the future.<br />
Material
ThyssenKrupp overview 2010/2011<br />
Facts<br />
If the information “ThyssenKrupp overview” is missing, you can download the<br />
data from our website: www.thyssenkrupp.com/qAB4W2<br />
Facts – ThyssenKrupp<br />
overview 2010/2011<br />
U4
Our<br />
mission statement<br />
We are ThyssenKrupp – The Technology & Materials Company.<br />
Competence and diversity, global reach, and tradition form the basis of our<br />
worldwide market leadership. We create value for customers, employees<br />
and shareholders.<br />
We Meet the Challenges of Tomorrow with our Customers.<br />
We are customer-focused. We develop innovative products and services that<br />
create sustainable infrastructures and promote effi cient use of resources.<br />
We Hold Ourselves to the Highest Standards.<br />
We engage as entrepreneurs, with confi dence, a passion to perform, and<br />
courage, aiming to be best in class. This is based on the dedication and<br />
performance of every team member. Employee development is especially<br />
important. Employee health and workplace safety have top priority.<br />
We Share Common Values.<br />
We serve the interests of the Group. Our interactions are based on<br />
transparency and mutual respect. Integrity, credibility, reliability and<br />
consistency defi ne everything we do.<br />
C2
We<br />
At ThyssenKrupp 180,000 employees in around 80 countries<br />
work with passion and expertise to develop solutions for sustainable<br />
progress. Their skills and commitment are the basis of our<br />
success. In fiscal year 2010/2011 ThyssenKrupp generated sales<br />
of €49 billion.<br />
For us, innovations and technical progress are key factors in managing<br />
global growth and using finite resources in a sustainable<br />
way. With our engineering expertise in the areas of “Material”,<br />
“Mechanical” and “Plant”, we enable our customers to gain an<br />
edge in the global market and manufacture innovative products<br />
in a cost- and resource-efficient way.<br />
The basis for this is responsible corporate governance geared<br />
towards long-term value growth. In an ever-changing business<br />
environment we are continuously evolving our company to enable<br />
us to meet the global challenges of the future with innovative<br />
solutions.<br />
| 01
Our<br />
capabilities<br />
Material<br />
We combine efficient materials manufacturing and processing with customer-specific<br />
solutions right through to distribution, and provide services on the basis of powerful<br />
IT and logistics systems.<br />
Our high-tech materials for the machinery, energy and automotive sectors set new<br />
standards in resource efficiency and environmental protection. They also display<br />
outstanding properties. ThyssenKrupp’s quality products give our customers a key<br />
market edge in many sectors.<br />
Mechanical<br />
We design and manufacture components for the automotive, machinery, energy<br />
and construction sectors, and provide complete end-to-end solutions, including<br />
elevators, escalators and moving walks.<br />
Our components ensure maximum efficiency and smooth operation, while reducing<br />
environmental impact and resource use. Wherever mechanical components are<br />
required, ThyssenKrupp offers top-level solutions.<br />
Plant<br />
With our global engineering and service network we design and build plants for the<br />
production of plastics and fertilizers and processing of raw materials.<br />
Our plants save resources, reduce pollution and guarantee operators maximum<br />
efficiency. With its advanced technologies ThyssenKrupp makes a key contribution<br />
to cost-efficient plant operation in the chemical and raw materials industries.
Material<br />
Mechanical<br />
Plant<br />
02 | 03
Making<br />
tomorrow possible<br />
Our engineering expertise allows us to serve the growing global<br />
demand for commodities, resources and energy with better and<br />
better products. ThyssenKrupp’s strengths in the areas of “Material”,<br />
“Mechanical” and “Plant” are the key to sustainable progress in the<br />
field of tension between growth and environmental protection.<br />
This enables ThyssenKrupp’s customers to stand out from the global<br />
competition and manufacture innovative products efficiently. In a<br />
world increasingly sensitive to environmental and climate issues, this<br />
represents a significant competitive advantage. Constantly rising raw<br />
materials prices are also making efficient resource use more and more<br />
essential.
Meeting global demand for<br />
“more” and “better” with engineering.<br />
Demographic change Climate change<br />
More consumer<br />
and capital goods<br />
Urbanization<br />
More infrastructure<br />
and buildings<br />
Globalization<br />
More resource<br />
and energy use<br />
Plant<br />
<strong>Engineering</strong><br />
Mechanical<br />
Material<br />
04 | 05<br />
Better ways of reducing<br />
CO 2 emissions<br />
Finite<br />
resources<br />
Better<br />
methods and<br />
processes<br />
Political<br />
framework conditions<br />
Better protection<br />
for the environment
Letter to shareholders<br />
Dr.-Ing. Heinrich Hiesinger<br />
Chairman of the Executive Board
06| 06 07<br />
Today I am reporting to you on the past fiscal year of your Company for the first time. As you know,<br />
I succeeded Ekkehard Schulz as Chairman of the Executive Board after the Annual General Meeting in<br />
January 2011. It did not take long for me to regard ThyssenKrupp as “my” company – just like our 180,000<br />
employees around the world. The Group’s management team and workforce performed well in 2010/2011.<br />
You can find out about this in detail in our Annual Report and our new ThyssenKrupp Yearbook.<br />
Business performance: Solid at operating level<br />
Our operating performance in the reporting year was solid. We were able to leverage two key factors: the<br />
initially still strong economic situation in our markets, and our internal efficiency and structural enhancement<br />
programs. As a result we met our ambitious targets for 2010/2011, despite the increased uncertainty in<br />
some customer sectors at the end of the year: Order intake and sales grew at double-digit rates. Order intake<br />
was €50 billion, and sales €49 billion. Our operating earnings are also impressive: excluding special items,<br />
adjusted EBIT was 42% higher at €1.8 billion, which was – just – within the forecast target corridor.<br />
Strategic development program: Systematically initiated<br />
We have good reason to be confident about the future of the Group. Our strong technological capabilities<br />
open up good opportunities for us in the markets of the future. But limited financial resources mean we<br />
cannot invest appropriately in all businesses to utilize these opportunities. The Executive Board analyzed the<br />
situation in detail, carefully weighed up the options, and together with the management boards of the<br />
business areas defined the core elements of our Strategic Way Forward. I am very pleased that these<br />
decisions were also made with the agreement of the employee representatives.<br />
– We will focus our portfolio further in the future. Our strengths are in providing intelligent solutions, above<br />
all for efficient infrastructure and resource use; in many of these areas we are already best in class or<br />
have the potential to become best in class.<br />
– We will divest activities that we cannot develop appropriately in the Group. This will affect total sales of<br />
€10 billion and around 35,000 employees. The separation of Stainless Global is a key element of this<br />
portfolio optimization. However, we will only sell our businesses to “best owners” who can provide good<br />
future prospects.<br />
– Step-by-step reduction of our net financial debt will give us room for future investment – in our core<br />
businesses, in new products and processes, in research and development, in our employees. All<br />
investments will be based on clear criteria – growth, profitability and capital efficiency.<br />
– While investments in recent years were concentrated mainly in the Materials area with our new steel<br />
making and processing plants in Brazil and the USA, in the future we will be investing more strongly in<br />
Technologies. We will be targeting emerging markets such as China and India that offer attractive growth<br />
opportunities, whereas in the past our activities were mainly focused on Europe and the NAFTA region.<br />
– The corporate program “impact” will support our strategic development and help us reach a higher<br />
performance level.
Letter to shareholders<br />
To assist our strategic development, we have drawn up a new Group mission statement with the involvement<br />
of many employees around the world. Under the motto “We are ThyssenKrupp”, it sums up our basic<br />
philosophy: customer and employee focus, innovativeness and quality, market leadership and<br />
internationality, community and diversity. We want to live these values more fully in the future.<br />
Steel Americas and Stainless Global: Book values adjusted<br />
One area of concern in 2010/2011 was the ramp-up of the new steel plants at Steel Americas, particularly<br />
in Brazil, which was associated with persistent losses. We also face negative developments which are beyond<br />
our control. For example, high raw material costs are negatively impacting our cost position, as are<br />
exchange-rate influences, specifically the relative strength of the Brazilian real. The slower recovery and<br />
currently renewed weakness of the markets in the USA and Europe are also hampering market entry for<br />
products of Steel Americas. As a consequence of this, we recognized impairment charges of €2.1 billion in<br />
our 2010/2011 financial statements. Irrespective of this, the successful completion of the ramp-up phase,<br />
optimization of production costs and successful entry to the US market represent our biggest opportunity for<br />
value growth in the short term. The strategic rationale remains unchanged, and we expect good returns in<br />
the medium term. For us as a premium supplier of flat-rolled carbon steel, the Americas are markets with<br />
potential, and our plants are an important key and a state-of-the-art base from which to establish ourselves<br />
there sustainably and profitably.<br />
Impairment charges totaling €800 million were also necessary at the previous Stainless Global business<br />
area – now Inoxum – in 2010/2011. €290 million related to goodwill impairment and €510 million to a fair<br />
value adjustment in connection with the carve-out of the entity. The main reasons for the fair value<br />
adjustment were the current valuations applied to stainless steel producers, which include high risk<br />
premiums and high discounts due to the unsolved structural problems on the stainless steel market.<br />
As a result, the Group’s operating (adjusted) EBIT was offset by total impairments of €2.9 billion. Adding in<br />
other net positive special items of €124 million, Group EBIT was negative at €(988) million.<br />
Tasks and outlook for 2011/2012: Challenging<br />
We began implementing the strategic measures immediately after the fundamental decisions were made by<br />
the Executive Board and Supervisory Board in May 2011. It remains our aim to complete the announced<br />
portfolio measures by the end of 2012. The first steps have now been successfully implemented: We have<br />
sold Metal Forming and created the conditions for the carve-out of Stainless Global. Positioning the Group for<br />
the future is one of the Executive Board’s permanent tasks. Portfolio optimization is therefore an ongoing<br />
process.<br />
Our earnings targets for the new fiscal year are subject to risks; the main reason for this are the growing<br />
uncertainties regarding the future of the economy. Just a few months ago there seemed little likelihood that<br />
the sovereign debt crisis and the financial market turbulence would spread to the real economy. Now the<br />
economic forecasts are being revised downwards more sharply and the risk of a slowdown is increasing. In<br />
view of the significant scale of the uncertainties, we cannot at present provide a reliable forecast for the fiscal
08| 09<br />
year just started. We, too, must proceed cautiously and will firm up our estimates quarter by quarter. But<br />
we will continue to apply strict discipline in the areas of costs, capital spending and net working capital.<br />
2012 will therefore be a challenging year for the Group. We will continue to pursue our Strategic Way<br />
Forward, complete the current changes to our portfolio, establish Inoxum as an independent entity,<br />
accomplish the technical ramp-up at Steel Americas, and further improve our financial situation. By doing<br />
this we will create the basis for further sustainable growth.<br />
Dividend: Continuity maintained<br />
ThyssenKrupp generated solid operating earnings in 2010/2011 but also had to deal with negatives. Our<br />
strategic tasks and the uncertain economic outlook will continue to demand a great deal of us. We have<br />
carefully weighed all the circumstances and consider it important and legitimate to maintain our policy of<br />
dividend continuity. At the Annual General Meeting in January 2012, the Executive Board and Supervisory<br />
Board will therefore propose the payment of a dividend for the past fiscal year in the same amount as the<br />
previous year, i.e. €0.45 per share.<br />
I would like to take this opportunity to thank all those who have given our Company their trust and<br />
support over the past fiscal year - kindly or critically, as shareholders or analysts, employees or customers,<br />
representatives of government, media or the many community organizations with which we are in dialogue.<br />
We will continue to work hard to earn your trust every day.<br />
Yours sincerely,<br />
Dr.-Ing. Heinrich Hiesinger<br />
Chairman of the Executive Board<br />
Essen, November 2011
Contents<br />
Our mission statement C2<br />
Facts – ThyssenKrupp overview 2010/2011 C4<br />
We 01<br />
Our capabilities 02<br />
Making tomorrow possible 04<br />
Letter to shareholders 06
To our shareholders<br />
1.1 Executive Board and Supervisory Board 17 – 21<br />
1.2 Report by the Supervisory Board 22 – 28<br />
1.3 Corporate governance report 29 – 40<br />
1.4 ThyssenKrupp stock 41 – 44<br />
Management report on the Group<br />
2.1 Profile and strategy 49 – 55<br />
2.2 Consolidated results of operations 57 – 69<br />
2.3 Results of operations of the business areas 71 – 83<br />
2.4 Financial position 85 – 91<br />
2.5 Non-financial performance indicators 93 – 101<br />
2.6 Subsequent events 101<br />
2.7 Expected developments and associated 102 – 119<br />
opportunities and risks<br />
2.8 Legal information 120 – 124<br />
Consolidated financial statements<br />
3.1 Consolidated statement of financial position 129<br />
3.2 Consolidated statement of income 130<br />
3.3 Consolidated statement of comprehensive income 131<br />
3.4 Consolidated statement of changes in equity 132<br />
3.5 Consolidated statement of cash flows 133<br />
3.6 Notes to the consolidated financial statements 134<br />
Auditors’ report 223<br />
Responsibility statement 224<br />
Additional information<br />
4.1 Multi-year overview 229 – 230<br />
4.2 Other directorships held by 231<br />
Executive Board members<br />
4.3 Other directorships held by 232 – 233<br />
Supervisory Board members<br />
4.4 Glossary 234<br />
4.5 Index 235 – 236<br />
4.6 List of abbreviations 237<br />
4.7 Index of tables and graphics 238<br />
4.8 Contact and 2012/2013 dates 239<br />
Our fiscal year begins on October 01 and ends on<br />
September 30 of the following year.<br />
This annual report was published to coincide with the<br />
Company’s Press Conference on December 02, 2011.<br />
10 | 11<br />
Contents
To our shareholders<br />
To our shareholders<br />
Good corporate governance calls for trusting cooperation between<br />
the Executive Board and the Supervisory Board – in the interest of<br />
the Company and with the aim of sustainably enhancing its value.<br />
In the following section we provide information about both bodies,<br />
their work, and our share performance in the reporting year.<br />
To our shareholders<br />
1.1 Executive Board and Supervisory Board 17 – 21<br />
— Executive Board 18<br />
— Supervisory Board 20<br />
— Supervisory Board Committees 21<br />
1.2 Report by the Supervisory Board 22 – 28<br />
1.3 Corporate governance report 29 – 40<br />
— Corporate governance overview 29<br />
— Corporate governance declaration 33<br />
— Compensation report 33<br />
1.4 ThyssenKrupp stock 41 – 44
One competence,<br />
three areas of application<br />
Plant<br />
<strong>Engineering</strong><br />
Mechanical<br />
Material<br />
Solutions for<br />
many sectors
Solutions for many sectors<br />
In the fi eld of tension between rising global demand for<br />
commodities, energy and raw materials and the need to<br />
protect the environment and conserve resources, our<br />
engineering expertise facilitates sustainable growth.<br />
Needs for “more” and “better” can be satisfi ed in equal<br />
measure. Our competencies are focused in three areas:<br />
“Material”, “Mechanical” and “Plant”.<br />
They refl ect ThyssenKrupp’s broad capabilities. In each<br />
of these complementary areas we off er state-of-the-art,<br />
innovative solutions. Our materials, components and<br />
plants enable our customers in many sectors to gain an<br />
edge in the global market.
Automotive<br />
We operate in the above sectors,<br />
among others. More information<br />
on this subject can be found in the<br />
ThyssenKrupp Yearbook.<br />
Aerospace<br />
Chemicals<br />
<strong>Engineering</strong><br />
Energy<br />
Minerals & Mining<br />
Construction
To our shareholders<br />
1.1 To our shareholders Executive Board and Supervisory Board<br />
Executive Board and<br />
Supervisory Board<br />
Under Germany’s two-tier corporate governance system, stock<br />
corporations have two boards with clearly separated functions:<br />
The executive board is responsible for managing the company;<br />
the supervisory board oversees and advises the executive board.<br />
Both work together closely in the interest of the company. On<br />
the following pages we present our Executive Board and<br />
Supervisory Board.<br />
16 | 17
1.1 To our shareholders Executive Board and Supervisory Board<br />
Executive Board<br />
Dr.-Ing. Heinrich Hiesinger<br />
Chairman, born 1960, member of the<br />
Executive Board since October 01, 2010,<br />
appointed until September 30, 2015,<br />
responsible for the corporate centers<br />
Corporate Development, Corporate<br />
Technology, Innovation & Quality,<br />
Executives Management, Corporate<br />
Information Technology, Internal Auditing<br />
and for the ThyssenKrupp Academy.<br />
Under the corporate program “impact”<br />
responsible for the “Innovation & Technology”<br />
and “Performance & Portfolio” initiatives.<br />
Dr. Olaf Berlien<br />
also Executive Board Chairman of<br />
ThyssenKrupp Elevator AG, born 1962,<br />
member of the Executive Board since 2002,<br />
appointed until March 31, 2017, responsible<br />
for the Technologies division. Responsible<br />
for the regions Asia/Pacific and Middle<br />
East & North Africa. Under the corporate<br />
program “impact” responsible for the<br />
“Customers & Markets” initiative.<br />
Dr. Jürgen Claassen<br />
born 1958, member of the Executive Board<br />
since January 21, 2011, appointed until<br />
January 20, 2016, responsible for the<br />
corporate centers Legal & Compliance,<br />
Corporate Communications, Corporate<br />
Programs, Corporate Sustainability,<br />
Environment & Politics, Corporate Affairs<br />
and for ThyssenKrupp Management<br />
Consulting. Responsible for the regions<br />
Western Europe I and Africa. Under the<br />
corporate program “impact” responsible<br />
for the “People & Development” initiative.
To our shareholders<br />
Edwin Eichler<br />
also Executive Board Chairman of<br />
ThyssenKrupp Steel Europe AG, born<br />
1958, member of the Executive Board<br />
since 2002, appointed until September 30,<br />
2017, responsible for the Materials division.<br />
Responsible for the regions North and South<br />
America, Russia/Central Asia, and Central<br />
and Eastern Europe. Under the corporate<br />
program “impact” responsible for the<br />
“Customers & Markets” initiative.<br />
Guido Kerkhoff<br />
Born 1967, member of the Executive<br />
Board since April 01, 2011, appointed<br />
until March 31, 2016, responsible for the<br />
corporate centers Controlling & Risk,<br />
Accounting & Financial Reporting,<br />
Corporate Finance, Taxes & Customs,<br />
Investor Relations, Materials Management,<br />
Mergers & Acquisitions and for ThyssenKrupp<br />
Risk and Insurance Services. Under the<br />
corporate program “impact” responsible for<br />
the “Performance & Portfolio” initiative.<br />
Ralph Labonte<br />
born 1953, member of the Executive Board<br />
since 2003, appointed until December 31,<br />
2012, responsible for the corporate center<br />
Human Resources and for ThyssenKrupp<br />
Business Services, ThyssenKrupp IT<br />
Services, ThyssenKrupp Corporate Services,<br />
ThyssenKrupp Real Estate. Responsible<br />
for the regions Germany and Western<br />
Europe II. Under the corporate program<br />
“impact” responsible for the “People &<br />
Development” initiative.<br />
Prof. Dr.-Ing. Ekkehard D. Schulz left the Executive Board at the close of the Annual General Meeting on January 21, 2011 and<br />
Dr. Alan Hippe at the close of March 31, 2011.<br />
18 | 19
1.1 To our shareholders Executive Board and Supervisory Board<br />
Supervisory Board<br />
Prof. Dr. h.c. mult. Berthold Beitz, Essen<br />
Honorary Chairman, Chairman of the Board of Trustees<br />
of the Alfried Krupp von Bohlen und Halbach Foundation<br />
Prof. Dr. Günter Vogelsang, Düsseldorf<br />
Honorary Chairman<br />
Dr. Gerhard Cromme, Essen<br />
Chairman,<br />
former Chairman of the Executive Board of ThyssenKrupp AG<br />
Bertin Eichler, Frankfurt/Main<br />
Vice Chairman,<br />
Member of the Executive Committee of the IG Metall trade union<br />
Markus Grolms, Bochum<br />
Trade union secretary at the Düsseldorf branch<br />
office of IG Metall<br />
Susanne Herberger, Dresden<br />
Engineer (FH) – information technology, Chairwoman<br />
of the General Works Council of ThyssenKrupp Aufzüge GmbH,<br />
Chairwoman of the Works Council Union ThyssenKrupp Elevator<br />
Technology<br />
Bernd Kalwa, Krefeld<br />
Lathe operator, Chairman of the General Works Council<br />
of ThyssenKrupp Nirosta GmbH, Chairman of the Works<br />
Council Union ThyssenKrupp Stainless Global<br />
Prof. Dr. Hans-Peter Keitel, Essen<br />
President of the Federation of German Industries<br />
(Bundesverband der Deutschen Industrie e.V.)<br />
Ernst-August Kiel, Blumenthal<br />
Fitter, Chairman of the Works Council of<br />
Howaldtswerke-Deutsche Werft GmbH,<br />
Chairman of the Works Council Union<br />
ThyssenKrupp Marine Systems<br />
Prof. Dr. Ulrich Lehner, Düsseldorf<br />
Member of the Shareholders’ Committee of<br />
Henkel AG & Co. KGaA<br />
Sabine Maaßen, Dinslaken<br />
(since January 22, 2011)<br />
Legal counsel to IG Metall<br />
Prof. Dr. Bernhard Pellens, Bochum<br />
Professor of Business Studies and International Accounting,<br />
Ruhr University Bochum<br />
Peter Remmler, Wolfsburg<br />
Wholesale and export trader, Chairman of the Works Council of<br />
ThyssenKrupp Schulte GmbH (Braunschweig), Chairman of the Works<br />
Council Union ThyssenKrupp Materials Services<br />
Dr. Kersten v. Schenck, Bad Homburg<br />
Attorney and notary public<br />
Peter Scherrer, Brussels<br />
(until January 21, 2011)<br />
General Secretary of the European Metalworkers’ Federation<br />
Thomas Schlenz, Duisburg<br />
Shift foreman, Chairman of the Group Works Council<br />
of ThyssenKrupp AG<br />
Dr. Henning Schulte-Noelle, Munich<br />
(until January 21, 2011)<br />
Chairman of the Supervisory Board of Allianz SE<br />
Prof. Dr.-Ing. Ekkehard D. Schulz, Krefeld<br />
(since January 21, 2011)<br />
Former Chairman of the Executive Board of ThyssenKrupp AG
To our shareholders<br />
Wilhelm Segerath, Duisburg<br />
Automotive bodymaker, Chairman of the General Works<br />
Council of ThyssenKrupp Steel Europe AG, Chairman of<br />
the Works Council Union ThyssenKrupp Steel Europe<br />
Peer Steinbrück, Bonn<br />
Member of the German Parliament,<br />
Federal Minister (retd.)<br />
Christian Streiff, Paris<br />
Former President of PSA Peugeot Citroën S.A.<br />
Jürgen R. Thumann, Düsseldorf<br />
Chairman of the Advisory Board of the Heitkamp & Thumann Group<br />
Prof. Dr. Beatrice Weder di Mauro,<br />
Frankfurt/Main<br />
Professor of Economics, Economic Policy &<br />
International Macroeconomics, Johannes Gutenberg<br />
University of Mainz, member of the German Council<br />
of Economic Experts<br />
Klaus Wiercimok, Düsseldorf<br />
Attorney, Head of the Materials Services department at<br />
Corporate Center Legal & Compliance of ThyssenKrupp AG<br />
As at: December 02, 2011<br />
Supervisory Board Committees<br />
Executive Committee<br />
Dr. Gerhard Cromme (Chair)<br />
Bertin Eichler<br />
Thomas Schlenz<br />
Jürgen R. Thumann<br />
Mediation Committee under<br />
Art. 27 par. 3 Codetermination Act<br />
Dr. Gerhard Cromme (Chair)<br />
Bertin Eichler<br />
Thomas Schlenz<br />
Jürgen R. Thumann<br />
Personnel Committee<br />
Dr. Gerhard Cromme (Chair)<br />
Bertin Eichler<br />
Thomas Schlenz<br />
Jürgen R. Thumann<br />
Audit Committee<br />
Prof. Dr. Bernhard Pellens (Chair)<br />
Dr. Gerhard Cromme<br />
Bertin Eichler<br />
Prof. Dr. Ulrich Lehner<br />
Thomas Schlenz<br />
Wilhelm Segerath<br />
Strategy, Finance and Investment Committee<br />
Dr. Gerhard Cromme (Chair)<br />
Bertin Eichler<br />
Markus Grolms<br />
Susanne Herberger<br />
Bernd Kalwa<br />
Dr. Kersten v. Schenck<br />
Prof. Dr. Ekkehard D. Schulz<br />
Peer Steinbrück<br />
Nomination Committee<br />
Dr. Gerhard Cromme (Chair)<br />
Prof. Dr. Bernhard Pellens<br />
Jürgen R. Thumann<br />
Prof. Dr. Beatrice Weder di Mauro<br />
20 | 21
1.2 To our shareholders Report by by the Supervisory Board<br />
Report by the Supervisory Board<br />
In this report the Supervisory Board gives an account of the<br />
performance of its functions and the key aspects of its work<br />
in fiscal 2010/2011. Its discussions focused on the business<br />
and financial situation of the Group, the major investment<br />
projects in Brazil and the USA, and the Strategic Way Forward<br />
for the Group.<br />
Dr. Gerhard Cromme<br />
Chairman of the Supervisory Dr. Gerhard Board Cromme<br />
Chairman of the Supervisory Board<br />
22
To our shareholders<br />
1.2 To our shareholders Report by the Supervisory Board<br />
Five Supervisory Board meetings were<br />
held in the reporting year.<br />
Page 21<br />
22 | 23<br />
Monitoring and advising the Executive Board<br />
In the reporting year the Supervisory Board again regularly advised the Executive Board on the management<br />
of the Company and continuously supervised its conduct of business. We satisfied ourselves that business<br />
complied with all legal and regulatory requirements. The Executive Board fulfilled its duty to inform and<br />
furnished us with regular written and verbal reports containing up-to-date and comprehensive information<br />
on all incidents and measures of relevance to the Company. In our committees and in full Supervisory Board<br />
meetings we always had ample opportunity to critically examine the reports, applications and resolution<br />
proposals of the Executive Board and contribute suggestions. In particular, all events of importance to the<br />
Company were discussed intensively by the committees and the full Supervisory Board on the basis of<br />
written and verbal reports by the Executive Board. Where required by law and the Articles of Association, we<br />
took a vote. In justified cases resolutions were passed outside meetings by written procedure.<br />
In the periods between meetings, the Supervisory Board Chairman and the Chairman of the Audit<br />
Committee were in regular contact with the Executive Board and were informed about major developments.<br />
The shareholder and the employee representatives each held separate meetings before the Supervisory<br />
Board meetings to discuss items on the agenda.<br />
In 2010/2011, four regular and one extraordinary Supervisory Board meetings were held. The average<br />
attendance at the meetings was 94%. No Supervisory Board members took part in fewer than half of the<br />
meetings. With two exceptions, the committee meetings were fully attended.<br />
Signs of conflicts of interest of Executive Board and Supervisory Board members, which must be disclosed<br />
to the Supervisory Board immediately and reported to the Annual General Meeting, did not occur in the past<br />
fiscal year.<br />
Effective work in the committees<br />
To perform its functions efficiently, the Supervisory Board has formed six committees. The committees<br />
prepare the resolutions of the Supervisory Board as well as the issues to be dealt with at the full meetings.<br />
Where legally permissible, in suitable cases decision-making powers of the Supervisory Board were delegated<br />
to individual committees. All committees are chaired by the Supervisory Board Chairman, with the exception<br />
of the Audit Committee. The content and results of each committee meeting were immediately communicated<br />
to the Supervisory Board. The compositions of the individual committees are shown on page 21.<br />
Executive Committee<br />
The Executive Committee (Praesidium) met seven times and conducted one conference call in the reporting<br />
year. In my capacity as Chairman, I maintained close contact with the individual Executive Committee<br />
members between meetings to discuss projects of particular importance. In addition to preparing the full<br />
Supervisory Board meetings, our main subjects of deliberation were the earnings performance, financial<br />
position and ratings situation of the Group, the Executive Board’s strategy for the Group going forward<br />
including the carve out of Stainless Global, the major investment projects in Brazil and the USA, the sale of<br />
treasury shares in July 2011, and in a meeting at the beginning of December 2011 impairment in the Steel<br />
Americas and Stainless Global business areas.
1.2 To our shareholders Report by by the the Supervisory Board Board<br />
Pages 33 33–37<br />
- 37<br />
The Audit Committee obtained a a statement<br />
of statement independence of independence from the auditors from the KPMG.<br />
auditors KPMG.<br />
Personnel Committee<br />
The Personnel Committee likewise met seven times and held one conference call. It dealt in detail with the<br />
structure of the Executive Board compensation system and the compensation for each Executive Board<br />
member and submitted corresponding resolution proposals to the full Supervisory Board. Details of the<br />
compensation system are presented in the compensation report on pages 33-37. Further key topics<br />
discussed were the appointment of Mr. Guido Kerkhoff to the Executive Board of ThyssenKrupp AG as well<br />
as amendments to the Executive Board organization chart. The Personnel Committee also gave its approval<br />
for the acceptance of external directorships by individual Executive Board members and the retention of the<br />
law firm Clifford Chance, for which Supervisory Board member Dr. Kersten v. Schenck works as Of Counsel.<br />
Mediation Committee<br />
Once again in fiscal 2010/2011 it was not necessary to convene the Mediation Committee in accordance<br />
with § 27 par. 3 German Codetermination Act (MitbestG).<br />
Audit Committee<br />
The Audit Committee held four meetings in 2010/2011. Alongside the committee members, the financialstatement<br />
auditors, the Chairman of the Executive Board, the Chief Financial Officer and the Executive Board<br />
member responsible for compliance regularly attended the meetings. For selected agenda items, further<br />
Executive Board members and the responsible senior vice presidents also took part. The committee mainly<br />
dealt with the parent-company and consolidated financial statements for 2009/2010, the monitoring of the<br />
accounting process, and the effectiveness of the internal control system, risk management system and<br />
internal auditing system. The 2010/2011 interim reports were discussed at length prior to their publication.<br />
The auditors reported in detail on all occurrences of significance to the work of the Supervisory Board<br />
identified in the course of the audit of the annual financial statements and the audit review of the interim<br />
reports.<br />
Ahead of the Annual General Meeting on January 21, 2011, a proposal was submitted to the full<br />
Supervisory Board for the election of the auditors for the 2010/2011 fiscal year. After their election by the<br />
Annual General Meeting, the auditors were engaged by the Audit Committee to audit the parent-company<br />
and consolidated financial statements and to carry out audit reviews of the interim reports. A fee was agreed<br />
with the auditors. The auditors declared to the Audit Committee that no circumstances exist which could<br />
lead to the assumption of prejudice on their part, and reported on the non-audit services they had<br />
performed. The Audit Committee obtained the required auditors’ statement of independence and monitored<br />
the qualification of the auditors. A further central issue was the preparation of the bidding process for the<br />
audit contract which was initiated in the past fiscal year.<br />
In its meetings in November 2010 and May 2011 the committee was informed in detail about the Group’s<br />
compliance activities, which were then also addressed in the full Supervisory Board meetings. The regular<br />
discussion of the investment projects in Brazil and the USA continued in the reporting year. In addition, the<br />
committee studied the audit plan and quality management system of the Group’s internal auditing<br />
department, the results of audits carried out, and regular reports on legal risks. On this basis it satisfied<br />
itself that the management of the Company is in compliance with the law.<br />
24
To our shareholders<br />
1.2 To our shareholders Report by the Supervisory Board<br />
The number of members of of the Nomination<br />
Nomination Committee was Committee increased was to four. increased<br />
to four.<br />
24 | 25<br />
On the basis of an updated profitability analysis by Ernst & Young, the Audit Committee met on December<br />
01, 2011 to discuss in detail the subject of impairment losses in the Steel Americas business area and its<br />
effects on the consolidated and parent-company financial statements. Impairment in the Stainless Global<br />
business area was also discussed in this meeting.<br />
Strategy, Finance and Investment Committee<br />
In two meetings in fiscal 2010/2011, the Strategy, Finance and Investment Committee dealt primarily with<br />
the Strategic Way Forward for the Group and the competitive position of the individual business areas. The<br />
Group’s investment policy was reviewed taking into consideration the current ratings situation. Further key<br />
topics were the corporate and investment planning and preparation of corresponding Supervisory Board<br />
resolutions, the major investment projects in Brazil and the USA, and the planned divestment projects. In a<br />
meeting on December 01, 2011 this Committee also dealt in detail with impairment losses in the Steel<br />
Americas and Stainless Global business areas.<br />
Nomination Committee<br />
The Nomination Committee held one meeting in the reporting year and addressed the question of a<br />
successor for Dr. Henning Schulte-Noelle, who stood down from the Supervisory Board with effect from the<br />
close of the Annual General Meeting on January 21, 2011. The Nomination Committee concurred with the<br />
proposal of the Alfried Krupp von Bohlen und Halbach Foundation to propose to the Annual General Meeting<br />
that it elect Prof. Dr.-Ing. Ekkehard D. Schulz as successor.<br />
Main content of Supervisory Board meetings and resolutions<br />
The meeting on November 26, 2010 focused on the parent-company and consolidated financial statements<br />
for the year ended September 30, 2010, and the Executive Board’s proposal for the appropriation of net<br />
income. We reported on this in detail in the last Annual Report. On the basis of a detailed report by the<br />
Executive Board and the deliberations of the Strategy, Finance and Investment Committee, we also<br />
discussed the corporate planning for the 2010/2011 fiscal year with the Executive Board; this included the<br />
plausibility of the expectations presented and the earnings opportunities and risks. Further matters<br />
discussed were the changeover of the Group’s internal performance indicator from EBT to EBIT, the ratings<br />
situation, the planned disposals of the Metal Forming group and the Xervon group, as well as the position<br />
and opportunities of ThyssenKrupp in the BIC countries. Other key topics were the development of raw<br />
material costs and the framing of contracts with raw material suppliers, particularly in the steel sector. The<br />
Supervisory Board requested the Executive Board to examine all alternatives to safeguard supply security.<br />
We dealt in depth with ThyssenKrupp Forging Group’s project to build a crankshaft production plant in China,<br />
which we then approved. The Supervisory Board also adopted the agenda for the Company’s Annual<br />
General Meeting on January 21, 2011 together with the proposals for resolution. We supported the proposal<br />
of the Alfried Krupp von Bohlen und Halbach Foundation and the recommendation of the Nomination<br />
Committee to propose to the Annual General Meeting to elect Prof. Dr.-Ing. Schulz to the Supervisory Board.<br />
In our view, after the election of Prof. Dr.-Ing. Schulz the board continues to have an adequate number of<br />
independent members. Prof. Dr. Beatrice Weder di Mauro was elected to the Nomination Committee as an<br />
additional member.<br />
Further, based on previous preparation by the Executive Committee, the Supervisory Board discussed the<br />
results of its efficiency review. In this connection we agreed with the Executive Board that in the future<br />
training events on special topics should be organized for the Supervisory Board.
1.2 To our shareholders Report by by the the Supervisory Board Board<br />
The Supervisory Board approved the the<br />
Group’s Strategic Way Forward on on May 13,<br />
2011. May 13, 2011.<br />
In the Supervisory Board meeting immediately before the Annual General Meeting on January 21, 2011, the<br />
Executive Board reported to us on the current state of the Group and the development of the Steel Americas<br />
business area. At the recommendation of the Personnel Committee, the Supervisory Board approved in<br />
principle the parameters of an updated bonus scheme for the Executive Board. In view of the appointment of<br />
Dr. Heinrich Hiesinger as Executive Board Chairman and Dr. Jürgen Claassen as Executive Board member<br />
with effect from the close of the Annual General Meeting, we adopted a new organization chart for the<br />
Executive Board. In addition, we approved the premature termination of the appointment of Dr. Alan Hippe<br />
as Executive Board member effective March 31, 2011.<br />
An extraordinary Supervisory Board meeting was held on March 04, 2011, at which Mr. Kerkhoff was<br />
appointed to succeed Dr. Hippe as member of the Executive Board of ThyssenKrupp AG for a period of five<br />
years with effect from April 01, 2011. The Executive Board reported on the current state of the Group and<br />
the status of various divestment projects.<br />
A further Supervisory Board meeting was held on May 13, 2011. In addition to its regular report on the state<br />
of the Group, the Executive Board reported in detail on the development of Steel Americas as well as the<br />
financial position and ratings situation of the Group. A central topic was the Strategic Way Forward for the<br />
Group. The Executive Board presented in detail the main features of its strategy and the proposed measures.<br />
After thorough discussion the Supervisory Board approved the strategic plan in principle. In this meeting we<br />
focused our attention in particular on the Executive Board’s report on the compliance system. In addition,<br />
the Supervisory Board was informed about the proposed bidding process for the financial-statement audit<br />
contract, which had previously been discussed in detail in the Audit Committee. We approved the disposal of<br />
the Metal Forming group to the Spanish company Gestamp Automoción S.L.; the status of the<br />
reorganization of the Marine Systems business area was discussed. In line with the proposal of the<br />
Personnel Committee, the Supervisory Board then adopted an updated bonus scheme for the Executive<br />
Board for the current fiscal year, the parameters of which had been resolved in the meeting on<br />
January 21, 2011. Dr. Olaf Berlien’s appointment as member of the Executive Board of ThyssenKrupp AG<br />
was renewed for a further five years until March 31, 2017.<br />
After prior discussion in the Executive Committee, in July 2011 the Supervisory Board approved by written<br />
procedure the sale of the treasury shares held by ThyssenKrupp AG in the amount of 9.6% of the capital<br />
stock. In the Supervisory Board meeting on September 02, 2011 the Executive Board reported in depth on<br />
the effects of the sale of this share package on the financial and accounting figures and the ratings situation.<br />
A further topic was the progress report on the implementation of the Group’s strategy going forward<br />
including the accompanying corporate program ThyssenKrupp impact. The Executive Board also informed<br />
us about the status of the divestment projects; we discussed in particular the options for separating the<br />
activities of the Stainless Global business area. The Executive Board explained the opportunities and risks of<br />
the individual alternatives in the international marketplace. The Supervisory Board has every confidence that<br />
the Executive Board will successfully implement the strategy and the necessary change processes. We also<br />
approved the disposal of the Xervon group and the acquisition of two elevator companies in the USA and<br />
Europe. The meeting was followed by a training and discussion event on “M&A transaction models: IPO and<br />
spin-off”.<br />
26
To our shareholders<br />
1.2 To our shareholders Report by the Supervisory Board<br />
Pages 29 29–40<br />
- 40<br />
The Supervisory Board examined and and<br />
approved the 2010/2011 parent-company<br />
and consolidated financial statements.<br />
26 | 27<br />
Corporate governance and Declaration of Conformity<br />
The Supervisory Board monitors on an ongoing basis the implementation of the provisions of the German<br />
Corporate Governance Code and the development of corporate governance standards. The Executive Board<br />
– also on behalf of the Supervisory Board – reports on corporate governance at ThyssenKrupp in the<br />
corporate governance report in accordance with section 3.10 of the German Corporate Governance Code.<br />
The Executive Board and Supervisory Board issued an updated Declaration of Conformity in accordance with<br />
§ 161 subs. 1 of the German Stock Corporation Act (AktG) on January 21, 2011 and again at October 01,<br />
2011; both are permanently available to shareholders on the Company website. ThyssenKrupp AG complies<br />
with all the current recommendations of the Government Commission on the German Corporate Governance<br />
Code, and also follows all the Code’s suggestions.<br />
Audit of the parent-company and consolidated financial statements<br />
KPMG AG Wirtschaftsprüfungsgesellschaft, Berlin, audited the parent-company financial statements for the<br />
fiscal year October 01, 2010 to September 30, 2011 prepared by the Executive Board in accordance with<br />
HGB (German GAAP) rules, and the management report of ThyssenKrupp AG. The auditors issued an<br />
unqualified audit opinion. In accordance with § 315 a HGB, the consolidated financial statements of<br />
ThyssenKrupp AG for the fiscal year from October 01, 2010 to September 30, 2011 and the management<br />
report on the Group were prepared on the basis of International Financial Reporting Standards (IFRS) as<br />
applicable in the European Union. The consolidated financial statements and the management report on the<br />
Group were also given an unqualified audit opinion. The auditors also confirmed that the Executive Board<br />
has installed an appropriate reporting and monitoring system which is suitable in its design and handling to<br />
identify at an early stage developments which could place the continued existence of the Company at risk.<br />
The Audit Committee and the auditors had selected the following focus themes for the reporting year:<br />
“Review of the functioning of the internal control systems at ThyssenKrupp CSA in the area of accounting,<br />
focusing in particular on the operating accounting and cost accounting processes”. The final documents and<br />
audit reports were discussed at length in the Audit Committee meeting on December 01, 2011 and the<br />
meeting of the Supervisory Board on December 02, 2011. A central reporting item concerned the<br />
impairment losses in the Steel Americas and Stainless Global business areas, the causes and effects of<br />
which we discussed in detail in the full Supervisory Board meeting. The auditors reported on the main<br />
results of their review, addressing in particular the impairment losses in the Steel Americas and Stainless<br />
Global business areas. They also outlined their findings on the internal control and risk management<br />
systems in relation to the accounting process; they were also available to answer questions and provide<br />
supplementary information. The Chairman of the Audit Committee reported in depth at the full Supervisory<br />
Board meeting on the Audit Committee’s examination of the parent-company and consolidated financial<br />
statements. Following our own examination and discussion of the parent-company financial statements, the<br />
consolidated financial statements, the management report and the management report on the Group, we<br />
accepted the result of the audit and approved the parent-company and consolidated financial statements.<br />
The parent-company financial statements are thus adopted. On the basis of our own examination and after<br />
weighing all the arguments, we concurred with the Executive Board’s proposal for the appropriation of net<br />
income aimed at maintaining the dividend continuity practiced in previous years. We regard the proposed<br />
dividend as appropriate.
1.2 To our shareholders Report by by the the Supervisory Board Board<br />
Pages 18 18–19<br />
- 19<br />
Composition of the Supervisory Board and Executive Board<br />
At the close of the Annual General Meeting on January 21, 2011 Dr. Schulte-Noelle and Mr. Peter Scherrer<br />
stood down from the Supervisory Board. The Annual General Meeting elected Prof. Dr.-Ing. Schulz to<br />
succeed Dr. Schulte-Noelle. By court decision Ms. Sabine Maaßen was appointed to succeed Mr. Scherrer<br />
with effect from January 22, 2011. The Supervisory Board thanked Dr. Schulte-Noelle, the longest-serving<br />
member of the board, as well as Mr. Scherrer for their good work.<br />
I have already reported on the personnel changes in the Executive Board of ThyssenKrupp AG in the<br />
2010/2011 fiscal year; a summary is presented in the overview of the composition of the Executive Board on<br />
pages 18-19. In addition, in its meeting on December 02, 2011 the Supervisory Board extended the<br />
appointment of Mr. Edwin Eichler as Executive Board member until September 30, 2017. The Supervisory<br />
Board expressed thanks and recognition to the departing Executive Board members, Prof. Dr.-Ing. Schulz,<br />
who shaped the ThyssenKrupp Group over many years, and also Dr. Hippe.<br />
On behalf of the entire Supervisory Board I thank the management, employees and employee<br />
representatives of all Group companies for their work in the past fiscal year.<br />
The Supervisory Board<br />
Dr. Gerhard Cromme<br />
Chairman<br />
Essen, December 02, 2011<br />
28
To our shareholders<br />
1.3 To our shareholders Corporate governance report report<br />
Corporate governance report<br />
Good corporate governance is an issue that applies to all areas of<br />
ThyssenKrupp. It promotes trust by investors, financial markets,<br />
business partners, employees and the public in the management<br />
and oversight of the Company and is a key foundation for<br />
sustainable business success.<br />
ThyssenKrupp complies in in full full with<br />
all recommendations of of the German<br />
Corporate Governance Code.<br />
28 | 29<br />
In this section and in the corporate governance declaration in accordance with § 289a German Commercial<br />
Code (HGB) the Executive Board – also on behalf of the Supervisory Board – reports on corporate<br />
governance at ThyssenKrupp in accordance with section 3.10 of the German Corporate Governance Code.<br />
This section also includes the compensation report.<br />
Corporate governance overview<br />
Implementation of the German Corporate Governance Code<br />
In the reporting year the Executive Board and Supervisory Board of ThyssenKrupp AG again dealt intensively<br />
with the requirements of the German Corporate Governance Code as amended on May 26, 2010. Up to the<br />
Annual General Meeting on January 21, 2011, ThyssenKrupp AG did not fully comply with the<br />
recommendation in section 5.4.5 of the Code that an executive board member should not hold more than<br />
three supervisory board seats in external listed companies or in the supervisory bodies of non-listed<br />
companies subject to comparable requirements. On Prof. Dr.-Ing. Ekkehard D. Schulz’s retirement from the<br />
Executive Board of ThyssenKrupp AG at the close of the Annual General Meeting, the Code’s<br />
recommendations were again complied with in full. After the Annual General Meeting on January 21, 2011<br />
the Supervisory Board and Executive Board therefore issued an updated, unqualified Declaration of<br />
Conformity. At October 01, 2011 the Declaration of Conformity was again updated and issued without<br />
qualification. All Declarations of Conformity issued to date are permanently available on the ThyssenKrupp<br />
website.<br />
The Code is also implemented at our listed subsidiary Eisen- und Hüttenwerke AG, taking into account the<br />
particularities of its membership of the Group. Individual deviations are presented and explained in the<br />
company’s Declaration of Conformity of October 01, 2011.<br />
Compliance as a management duty of the Executive Board<br />
Compliance, in the sense of measures to ensure adherence to statutory requirements and internal company<br />
policies and observance of these measures by the Group companies, is a key management duty at<br />
ThyssenKrupp. A compliance program focusing on antitrust law and anti-corruption policies was introduced<br />
directly after the merger of predecessor companies Thyssen and Krupp in 1999. It has been regularly<br />
reviewed and enhanced ever since. In May 2011, in connection with the strategic development of the Group,<br />
the Executive Board of ThyssenKrupp AG decided to massively expand the compliance program and<br />
increase the number of staff in the compliance unit. The compliance program contains far-reaching<br />
measures to ensure adherence to corruption and antitrust regulations and the Group policies based on<br />
them.
1.3 To our shareholders shareholders Corporate governance report<br />
Zero tolerance of of antitrust violations and and<br />
corruption is is the core of of our our Compliance<br />
Commitment.<br />
Page 117<br />
www.thyssenkrupp.com<br />
The Executive Board of ThyssenKrupp AG has unequivocally expressed its rejection of antitrust violations<br />
and corruption in the ThyssenKrupp Compliance Commitment. Antitrust violations and corruption are not<br />
tolerated in any way and result in sanctions against the employees concerned. All employees are requested<br />
to cooperate actively in their areas of responsibility in implementing the compliance program. The<br />
Compliance Commitment is supplemented by various Group policy statements and publications. In these,<br />
the underlying statutory requirements are explained in more detail. The key messages of our compliance<br />
policies and guidance notes are summarized in a Compliance Code of Conduct.<br />
A compliance unit has been set up to develop, manage and implement the program. For example, full-time<br />
compliance officers inform employees about the relevant statutory provisions and internal policies in regular<br />
training sessions. They are also available to answer individual questions. As an additional compliance<br />
element, ThyssenKrupp has introduced a whistleblower hotline. It is run for us by an external law firm. The<br />
whistleblower hotline is available to employees of the Group and third parties to report possible<br />
infringements of laws or policies at Group companies. Here too the focus is on antitrust and anti-corruption<br />
compliance. The hotline can be contacted from anywhere in the world and is toll-free.<br />
In May 2011 the Bochum public prosecutor’s office and the Federal Cartel Office instigated investigations<br />
into antitrust violations in connection with the so-called “rail cartel”. The matter involves allegations of anticompetitive<br />
agreements in sections of the rail business in Germany. Within the ThyssenKrupp Group, the<br />
investigations concern ThyssenKrupp GfT Gleistechnik GmbH and several employees. More information is<br />
provided in the risk report in the section “Expected developments and associated opportunities and risks” .<br />
Objectives of the Supervisory Board with regard to the composition of corporate bodies<br />
In appointing Executive Board members and determining the composition of the Supervisory Board, the<br />
Executive Committee, Nomination Committee and Supervisory Board of ThyssenKrupp AG aim to maintain a<br />
balanced mix of specialist qualifications and also take into account the criterion of diversity. On September<br />
03, 2010 concrete objectives were established for the future composition of the Supervisory Board. These<br />
objectives were published in the corporate governance report in the 2009/2010 Annual Report, which is<br />
accessible on the internet at www.thyssenkrupp.com/financial-reports/09_10/en/governance.html. These<br />
objectives are not limited to the issue of female representation but reflect further criteria to ensure the<br />
heterogeneous composition of the Supervisory Board – including an international background, suitable<br />
specialist knowledge, technical expertise, knowledge of the Company and not least independence. The<br />
Supervisory Board’s proposals for the election of Supervisory Board members should continue to be based<br />
on the welfare of the Company while giving consideration to these objectives.<br />
This was also the basis on which the election proposal submitted to the Annual General Meeting on January<br />
21, 2011 was prepared. The Nomination Committee and the full Supervisory Board discussed and<br />
subsequently adopted the proposal of the Alfried Krupp von Bohlen und Halbach Foundation to elect Prof.<br />
Dr.-Ing. Schulz to the Supervisory Board as a shareholder representative. Both bodies consider the election<br />
of Prof. Dr.-Ing. Schulz appropriate in particular in view of his knowledge of the Company and his technical<br />
expertise.<br />
30
To our shareholders<br />
1.3 To our shareholders Corporate governance report<br />
Pages 231 231–233 - 233<br />
Page 186<br />
The Annual General Meeting is is broadcast<br />
live on the internet.<br />
30 | 31<br />
Since the appointment of Ms. Maaßen to the Supervisory Board effective January 22, 2011, the Supervisory<br />
Board has one female member on the shareholder side and two on the employee side, which means that<br />
women now make up 15% of the Supervisory Board. The objective established in the prior year to maintain<br />
a female proportion of 10% has therefore been more than fulfilled. In the Supervisory Board meeting on<br />
November 26, 2010, Prof. Dr. Weder di Mauro was additionally appointed as a fourth member of the<br />
Nomination Committee.<br />
Avoiding conflicts of interest<br />
Again this reporting year, the only case of a consulting or other service agreement between Supervisory<br />
Board members and the Company related to Dr. Kersten v. Schenck, who is a member of our Company’s<br />
Supervisory Board and at the same time an of counsel of the law firm Clifford Chance. To the extent that<br />
Clifford Chance provided legal advice to the Company in 2010/2011, the engagement was approved by the<br />
Personnel Committee of the Supervisory Board. Conflicts of interest of Executive or Supervisory Board<br />
members, which must be disclosed immediately to the Supervisory Board, did not occur.<br />
Details of the other directorships held by Executive Board and Supervisory Board members on statutory<br />
supervisory boards or comparable German and non-German control bodies of business enterprises are<br />
provided in the section “Additional information”. Details of related party transactions are given in Note 23 to<br />
the Consolidated Financial Statements.<br />
Directors’ dealings<br />
According to § 15a Securities Trading Act (WpHG) the members of the Executive Board and Supervisory<br />
Board and persons close to them are required by law to disclose the purchase and sale of ThyssenKrupp AG<br />
shares or related financial instruments whenever the value of the transactions amounts to €5,000 or more<br />
within a calendar year. One transaction was reported to ThyssenKrupp AG for the 2010/2011 fiscal year; it is<br />
published on our website.<br />
At September 30, 2011 the total volume of ThyssenKrupp AG shares held by all Executive Board and<br />
Supervisory Board members amounted to less than 1% of the shares issued by the Company.<br />
Deductible in D&O insurance<br />
In accordance with the statutory requirements, the Company has taken out directors and officers (D&O)<br />
liability insurance for the members of the Executive Board with an appropriate deductible pursuant to § 93<br />
subs. 2, sentence 3 Stock Corporation Act (AktG). D&O insurance with an appropriate deductible has also<br />
been agreed for the members of the Supervisory Board in accordance with the German Corporate<br />
Governance Code.<br />
Shareholders and Annual General Meeting<br />
The shareholders of ThyssenKrupp AG exercise their rights at the Company’s Annual General Meeting, which<br />
is chaired by the chairman of the Supervisory Board. The Annual General Meeting takes place once a year.<br />
Each share confers one vote.<br />
Shareholders can exercise their voting rights at the Annual General Meeting in person or by proxy, for which<br />
they can authorize a person of their choice or a Company-nominated proxy acting on their instructions.<br />
Proxy voting instructions to Company-nominated proxies can be issued via the internet before and during<br />
the Annual General Meeting up to the end of the general debate. Shareholders can also cast their votes in<br />
writing by postal vote - without authorizing a proxy. Shareholders unable to attend the Annual General<br />
Meeting, as well as interested members of the public, can follow the meeting live and in full on the internet.
1.3 To our shareholders Corporate governance report report<br />
Pages 108–119<br />
Pages 108-119<br />
Accounting at ThyssenKrupp is is based on<br />
on the the International Financial Reporting<br />
Standards (IFRS).<br />
All documents and information on the Annual General Meeting are made available to shareholders in good<br />
time on our website. In addition, questions can be addressed to members of our investor relations<br />
department via an infoline or e-mail.<br />
Appropriate control and risk management system<br />
For us, the continuous and systematic management of business opportunities and risks is fundamental to<br />
professional corporate governance. It helps ensure that risks are identified and evaluated early and<br />
appropriately managed. The Executive Board reports regularly to the Supervisory Board about the status of<br />
material Group risks. The Supervisory Board Audit Committee regularly concerns itself with monitoring of the<br />
accounting process, the effectiveness of the internal control, risk management and auditing systems as well<br />
as monitoring of the financial statement audit. The individual systems are continuously enhanced and<br />
adapted to changing conditions throughout the Group. Key features of our control and risk management<br />
systems can be found in the section “Expected developments and associated opportunities and risks”.<br />
Transparent governance through extensive information<br />
Our dialogue with the capital market is aimed at informing all target groups fully, equally and quickly.<br />
Shareholders and potential investors can find out about the latest developments in the Group at any time on<br />
our website, where all press releases and stock exchange (ad hoc) announcements of ThyssenKrupp AG are<br />
published in German and English. The Company’s Articles of Association and the rules of procedure for the<br />
Executive Board, Supervisory Board and the Audit Committee can also be viewed on the website, as can the<br />
consolidated financial statements, interim reports and information on implementation of the<br />
recommendations and suggestions of the German Corporate Governance Code. All interested parties can<br />
subscribe to an electronic newsletter on the website which reports news from the Group.<br />
Our investor relations work keeps us in close touch with our shareholders and potential investors. For<br />
example we hold regular meetings with analysts and institutional investors. The venues and dates of<br />
roadshows and investors’ conferences are posted on our website. An intensive dialogue also takes place at<br />
analysts’ and investors’ conferences and in regular and ad hoc conference calls. All presentations for these<br />
events are freely accessible on the website, which also offers video or audio recordings of the main events.<br />
We provide information on recurring dates, such as the date of the Annual General Meeting or the<br />
publication dates of interim reports, in a financial calendar published in the annual report, the interim<br />
reports and on the Company’s website.<br />
Accounting and financial statement auditing by KPMG<br />
In line with European Union requirements, the consolidated financial statements and interim reports of<br />
ThyssenKrupp are prepared in accordance with the International Financial Reporting Standards (IFRS). The<br />
statutory parent-company financial statements of ThyssenKrupp AG, on which the dividend payment is<br />
based, are drawn up in accordance with German GAAP (HGB). For the reporting period we again agreed with<br />
32
To our shareholders<br />
1.3 To our shareholders Corporate governance report<br />
www.thyssenkrupp.com<br />
Page 120<br />
Executive Board member contracts at<br />
at ThyssenKrupp do do not not contain a a<br />
change-of-control clause.<br />
32 | 33<br />
the financial-statement auditors, KPMG AG Wirtschaftsprüfungsgesellschaft, Berlin, that the chairman of the<br />
Audit Committee would be informed immediately of any possible grounds for exclusion or bias arising during<br />
the audit insofar as they are not immediately eliminated, and that the auditors would report immediately on<br />
any findings or occurrences during the audit which have a significant bearing on the duties of the<br />
Supervisory Board. It was also agreed that the auditors would inform the Supervisory Board or make a note<br />
in the audit report of any facts ascertained during their examination that conflict with the Declaration of<br />
Conformity issued.<br />
Corporate governance declaration<br />
The corporate governance declaration in accordance with § 289a German GAAP (HGB) is presented on<br />
our website at www.thyssenkrupp.com/en/investor/unternehmensfuehrung.html. It contains a description of<br />
how the Executive Board and Supervisory Board operate, the declaration of conformity in accordance with<br />
§ 161 Stock Corporation Act (AktG), and details of key governance practices.<br />
Compensation report<br />
The following compensation report forms part of the management report.<br />
Performance-based compensation for the Executive Board<br />
According to the Act on the Appropriateness of Management Board Remuneration (VorstAG) and a<br />
corresponding provision in the rules of procedure for the Supervisory Board, the full Supervisory Board is<br />
responsible for determining individual Executive Board compensation following preparation by the Personnel<br />
Committee. The compensation system was approved by the Annual General Meeting on January 21, 2011<br />
with a majority of 94.91% of the capital represented.<br />
The compensation for the Executive Board members comprises non-performance-related and performancerelated<br />
components. The non-performance-related components are the fixed compensation, additional<br />
benefits and pension plans, while the performance-related components are the performance bonus and the<br />
LTI as a component with a long-term incentive effect. On top of this there is an additional bonus<br />
representing a cash flow-based management incentive, on the award of which the Supervisory Board makes<br />
a new decision each year.<br />
Criteria for the appropriateness of Executive Board compensation include the duties of the individual<br />
Executive Board members, their personal performance, the business situation, the success and prospects of<br />
the Company and also the prevailing level of compensation at peer companies and the compensation<br />
structure applying in the Company. The performance-related components contain elements that are<br />
measured over several years. They therefore set long-term incentives and focus the compensation structure<br />
on the sustainable development of the Company.<br />
Executive Board member contracts concluded since the start of fiscal year 2008/2009 provide for a<br />
severance payment in the event of early termination without cause. The severance payment is limited to a<br />
maximum of two years’ compensation including benefits (severance payment cap) and compensates no<br />
more than the remaining term of the employment agreement. A promise of payments in the event of early<br />
termination due to a change of control does not exist.
1.3 To our shareholders Corporate governance report report<br />
The performance bonus for for Executive Board<br />
members Board members is linked is to linked the performance to the<br />
indicators performance EBT indicators and ROCE. EBT and ROCE.<br />
Pages 54 54–55<br />
- 55<br />
Fixed compensation<br />
Since the last review at October 01, 2010, the fixed compensation for an ordinary Executive Board member<br />
has been €670,000 per year, paid out as non-performance-related basic compensation in monthly<br />
installments as a salary. The Executive Board members also receive benefits, mainly comprising the use of a<br />
company car, telephone as well as insurance premiums. Individual Executive Board members have to pay<br />
tax on these benefits as compensation components. The benefits apply in principle to all Executive Board<br />
members; the amount varies according to personal situation. The fixed compensation is generally reviewed<br />
every two years.<br />
Performance bonus<br />
The first element of the performance-related compensation is the performance bonus. In accordance with<br />
the performance bonus rules resolved by the Supervisory Board, the amount of the performance bonus is<br />
dependent on the Group’s EBT (earnings before taxes) and ROCE (return on capital employed), each of<br />
which is considered equally as a criterion. The performance bonus is therefore aligned with the performance<br />
indicators used in the Group. For example, if EBT is €2 billion and ROCE is 14.5%, the performance bonus is<br />
€1 million. A €100 million change in EBT or a change in ROCE by 0.5% points leads to a corresponding<br />
€25,000 change in the performance bonus. Individual performance can be recognized up to 20%.<br />
Extraordinary events are ignored in determining the performance bonus. The performance bonus is paid out<br />
to the individual Executive Board members two weeks after its establishment by the Supervisory Board. With<br />
a view to the Act on the Appropriateness of Management Board Compensation (VorstAG) the Supervisory<br />
Board determined that from fiscal year 2009/2010 a quarter of the performance bonus must be converted<br />
into ThyssenKrupp stock rights to be paid out after a three-year lock-up period. In view of the fact that EBIT<br />
is now used as a performance indicator in place of EBT, the Supervisory Board has decided to use EBIT<br />
instead of EBT alongside ROCE in an otherwise unchanged performance bonus system from fiscal year<br />
2011/12.<br />
LTI<br />
From fiscal year 2010/2011 a further compensation component is the LTI, a variable compensation<br />
component with a long-term incentive effect. In accordance with a resolution by the Supervisory Board, the<br />
MTI plan still applying for fiscal year 2009/2010 was modified and is being continued under the name Long<br />
Term Incentive plan – LTI. The LTI system is as follows:<br />
For a certain initial value, which for an ordinary Executive Board member amounts to €500,000, notional<br />
shares are granted. These so-called stock rights are not stock options. The number of stock rights issued to<br />
an Executive Board member is determined by the average stock price in the 1st quarter of the performance<br />
period. These stock rights are recognized as part of compensation at their value at grant date, calculated in<br />
accordance with international accounting standards. The number of stock rights issued under the LTI plan is<br />
then adjusted at the end of the respective three-year performance period. The basis for this is a comparison<br />
of average TKVA in the three-year performance period – beginning October 01 of the fiscal year in which the<br />
stock rights were granted – with the average TKVA of the previous three fiscal years. This compensation<br />
component therefore covers in total a period of six years. An increase in TKVA by €200 million results in a<br />
5% increase in stock rights; if average TKVA decreases by €200 million, the number of stock rights<br />
decreases by 10%. More information on TKVA is provided in the section “Value-based management”. At the<br />
end of the performance period the granted stock rights are paid out on the basis of ThyssenKrupp’s average<br />
share price in the first three months after the end of the performance period. Payments under the LTI plan<br />
are limited to €1.5 million for an ordinary Executive Board member.<br />
34
To our shareholders<br />
1.3 To our shareholders Corporate governance report<br />
The bonus component of of Executive Board<br />
compensation is is determined on on the the basis<br />
of a cash flow-related indicator.<br />
34 | 35<br />
Additional bonus<br />
This system of performance bonus and LTI is appropriate but requires supplementation under certain<br />
constellations. For example, due to the high negative TKVA in fiscal year 2008/2009 and despite substantial<br />
increases in the 2009/2010 and 2010/2011 fiscal years there will be no payments under the previous MTI<br />
plan for the reporting period – just as there were none for the last two fiscal years – owing to the plan’s longterm<br />
focus. In difficult economic years, which demand particular efforts of the Executive Board, the work of<br />
the Executive Board should not be rewarded only with the fixed compensation, as was the case in<br />
2008/2009. In view of the tasks facing the Executive Board and its particular responsibility this would impair<br />
the competitiveness of our executive remuneration. It must also be considered that high financial discipline<br />
is essential in critical times. For this reason a performance-based compensation element based on a cash<br />
flow-related indicator has been established for a certain period. This indicator is the ratio of funds from<br />
operations to total debt (FFO/TD), which makes it possible to balance out fluctuations in EBT, net working<br />
capital and capital expenditures. The achievement of set targets by the Executive Board is to be rewarded<br />
with an additional bonus. The additional bonus is based 50% on the year-end values and 50% on the<br />
annual average values of FFO/TD; with a year-end value of 18.2% and an annual average value of 17.2%<br />
the additional bonus amounts to €350,000; it changes by €50,000 for each 1.1% change in the year-end<br />
value and 0.8% change in the annual average value. To ensure the sustainability and multi-year assessment<br />
basis required by the VorstAG particularly in the ratio between short-term and long-term compensation, 55%<br />
of the additional bonus is converted into ThyssenKrupp stock rights and paid out after a three-year lock-up<br />
period (as with the performance bonus). Whether this additional bonus is granted again, and if so at what<br />
level, will be decided each year.<br />
Pensions<br />
Pensions are paid to former Executive Board members who have either reached pension age or become<br />
permanently incapacitated for work. Under the amended contract provisions now applied, pensions<br />
(“transitional allowances”) are no longer paid upon premature termination or non-renewal of employment<br />
contracts.<br />
The pension of an Executive Board member already in office is a percentage of the final fixed salary they<br />
received before their employment contract ended. This percentage increases with the duration of the<br />
Executive Board member’s appointment. In general it is 30% at the start of the first five-year period of<br />
appointment, 50% at the start of the second and 60% at the start of the third. Dr. Heinrich Hiesinger’s<br />
pension is 50%. Current pensions are adjusted annually in line with the consumer price index. For new<br />
Executive Board members to be appointed in the future, this final-salary pension plan has been switched to<br />
a defined-contribution pension plan, with the annual pension benefit (“module”) amounting to 40% of the<br />
annual fixed salary.<br />
Under the surviving dependants’ benefits plan, a widow receives 60% of the pension and each dependant<br />
child (generally up to the age of 18, maximum age 25 years, in justified exceptional cases up to the age of<br />
27) 20%, up to a maximum of 100% of the pension amount.
1.3 To our shareholders Corporate governance report report<br />
Executive Board compensation 2010/2011 in €'000s<br />
Fixed<br />
salary<br />
Annual income<br />
Addi-<br />
tional<br />
benefits<br />
Total Executive Board compensation granted in 2010/2011<br />
The following table shows details of compensation and pensions for individual Executive Board members in<br />
fiscal year 2010/2011. The prior-year figures are shown in square brackets:<br />
Performance<br />
bonus<br />
(75%)<br />
Stock<br />
appreciation<br />
rights granted<br />
in fiscal year<br />
from 25% of<br />
performance<br />
bonus<br />
Stock<br />
appreciation<br />
rights granted<br />
in fiscal year<br />
from 55% of<br />
additional<br />
bonus<br />
LTI rights<br />
granted in<br />
fiscal year<br />
(prior year: MTI) Pensions<br />
Addi-<br />
tional<br />
bonus<br />
(45%) Number Value 3) Number Value 3) Number Value 3) Total<br />
Expense/<br />
(income)<br />
from<br />
share-<br />
based<br />
compen-<br />
sation in<br />
the fiscal<br />
year<br />
Annual<br />
pension<br />
when<br />
payable<br />
Service<br />
costs<br />
recorded<br />
in the<br />
fiscal<br />
year *)<br />
Dr.-Ing.<br />
Heinrich<br />
Hiesinger<br />
1,207 26 779 219 10,262 190 10,557 196 31,722 903 3,520 661 670 1,183 1,191<br />
1)<br />
Chairman<br />
(from Jan. 21, 2011)<br />
Vice Chairman<br />
(from Oct. 01, 2010<br />
to Jan. 20, 2011)<br />
Dr.-Ing.<br />
Ekkehard D.<br />
Schulz<br />
[—] [—] (—] [—] [—] [—] [—] [—] [—] [—] [—] [—] [—] [—] [—]<br />
342 79 218 61 2,872 53 2,955 55 8,907 254 1,062 152 0 — 11,447<br />
2)<br />
Chairman<br />
(until<br />
Jan. 21, 2011) [966] [130] [611] [532] [8,964] [210] [28,626] [671] [10,172] [229] [3,349] [1,019] [0] [—] [13,250]<br />
Dr. Olaf<br />
670 41 433 121 5,697 106 5,861 109 17,612 502 1,982 347 335 379 4,220<br />
Berlien [585] [94] [370] [322] [5,433] [127] [17,349] [407] [6,165] [139] [2,044] [617] [293] [245] [4,683]<br />
Dr. Jürgen<br />
Claassen<br />
465 16 300 84 3,956 73 4,078 76 12,230 348 1,362 323 201 422 1,423<br />
(from Jan. 21, 2011) [—] [—] [—] [—] [—] [—] [—] [—] [—] [—] [—] [—] [—] [—] [—]<br />
670 43 433 121 5,697 106 5,861 109 17,612 502 1,984 347 335 509 5,487<br />
Edwin Eichler [585] [79] [370] [322] [5,433] [127] [17,349] [407] [6,165] [139] [2,029] [617] [293] [348] [5,707]<br />
Dr. Alan Hippe<br />
335 14 216 61 2,848 53 2,930 54 8,806 251 984 164 — — —<br />
(until Mar. 31, 2011) [585] [99] [370] [322] [5,433] [127] [17,349] [407] [6,165] [139] [2,049] [617] [176] [302] [681]<br />
Guido Kerkhoff<br />
335 11 216 61 2,848 53 2,930 54 8,806 251 981 183 201 232 233<br />
(from Apr. 01, 2011) [—] [—] [—] [—] [—] [—] [—] [—] [—] [—] [—] [—] [—] [—] [—]<br />
670 32 433 121 5,697 106 5,861 109 17,612 502 1,973 347 335 424 8,967<br />
Ralph Labonte [585] [92] [370] [322] [5,433] [127] [17,349] [407] [6,165] [139] [2,042] [617] [293] [292] [8,783]<br />
4,694 262 3,028 849 39,877 740 41,033 762 123,307 3,513 13,848 2,524 2,077 3,149 32,968<br />
Total [3,306] [494] [2,091] [1,820] [30,696] [718] [98,022] [2,299] [34,832] [785] [11,513] [3,487] [1,055] [1,187] [33,104]<br />
1) As Vice Chairman of the Executive Board Dr. Hiesinger received a supplement of 35%, as Chairman of the Executive Board 100%.<br />
2) Supplement 65%<br />
3) at grant date<br />
4) Past service cost was not incurred in the 2010/2011 fiscal year<br />
The corresponding prior-year figures (in €'000s) for the Executive Board member Dr. Ulrich Middelmann who stepped down in fiscal 2009/2010 (date of departure: Jan. 21, 2010 ) are: Fixed salary: 226;<br />
additional benefits: 46; performance bonus: 142; additional bonus: 124; stock appreciation rights from performance bonus: 49; stock appreciation rights from additional bonus: 155; MTI rights: 54; total: 796;<br />
expense from share-based compensation: 237; service cost in reporting year: 0; present value 13,298.<br />
Guido Kerkhoff joined the Executive Board on April 01, 2011. In the reporting year, Mr. Kerkhoff received compensation of just under €1.4 million for the loss of share awards from Deutsche Telekom AG<br />
due to his move to ThyssenKrupp AG.<br />
36<br />
Present<br />
value<br />
of the<br />
obligation
To our shareholders<br />
1.3 To our shareholders Corporate governance report<br />
The Mid-Term Incentive Plan encourages<br />
Alongside the Executive Board, further<br />
and rewards value-oriented executive<br />
executives receive part of their<br />
behavior.<br />
remuneration in the form of share-based<br />
compensation.<br />
36 | 37<br />
Total compensation paid to active members of the Executive Board for their work in fiscal year 2010/2011<br />
amounted to €13.8 million (prior year: €12.3 million). The performance bonus is based on continuing<br />
operations. The impairment losses in the Steel Americas business area were not taken into consideration.<br />
Based on a contractual commitment that no longer applies to subsequently appointed Executive Board<br />
members, Prof. Dr.-Ing. Schulz will continue to receive a chauffeur-driven car and specific insurance benefits<br />
for a period of five years after entering into retirement on account of his having served on the Executive<br />
Board for over ten years; he is also entitled to an office with secretary for five years on account of his efforts<br />
for the Company; the present value of this is €935,000. The Company has recognized pension provisions for<br />
the future pension entitlements on the basis of IFRS.<br />
No further benefits have been promised to any Executive Board members in the event that they leave their<br />
post. In the reporting year, no members of the Executive Board received benefits or corresponding promises<br />
from third parties in connection with their Executive Board positions. As in previous years, no loans or<br />
advance payments were granted to members of the Executive Board, nor were any guarantees or other<br />
commitments entered into in their favor.<br />
The 6th installment of the MTI, which became due in the past fiscal year, resulted in no payment due to the<br />
sharp drop in TKVA in 2009/2010. In January 2011 the Executive Board members were granted new stock<br />
rights under the 1st installment of the LTI. Under the 7th to 8th installments of the MTI and the 1st<br />
installment of the LTI the Executive Board members have a total of 245,331 stock rights which have been<br />
awarded but are not yet payable.<br />
Total compensation paid to former members of the Executive Board and their surviving dependants<br />
amounted to €14.6 million (prior year: €14.5 million). In accordance with IFRS an amount of €192.7 million<br />
(prior year: €190.6 million) was accrued for pension obligations benefiting former Executive Board members<br />
and their surviving dependants.<br />
Share-based compensation for further executives<br />
Alongside the Executive Board, further selected executives of the Group receive part of their remuneration in<br />
the form of share-based compensation. This relates to the MTI and also to a program for the purchase of<br />
ThyssenKrupp shares at a discount.<br />
The aim of the MTI is to encourage and reward value-oriented executive behavior based on the Group’s<br />
goals, and also to help strengthen ties with the Group. Beginning with the 2nd installment of the MTI, issued<br />
in 2004, the group of employees eligible to receive stock rights was expanded on modified terms to include<br />
the executive board members of the then segment holding companies and other selected executives. Today<br />
the participants in the plan include the members of the business area management boards as well as<br />
management board members and selected executives of large Group companies. The MTI for this group of<br />
persons resulted in expense of €3.0 million in the reporting year (prior year: expense of €4.0 million).<br />
In addition, the 2009/10 discount share purchase plan for selected executives of the Group in Germany who<br />
are not beneficiaries of the MTI ended in the 2nd quarter of the reporting year. On expiration of the<br />
performance period, beneficiaries were offered the opportunity to purchase ThyssenKrupp shares up to a<br />
fixed euro amount at a discount, which was paid by the employer. The remaining amount was paid by the<br />
participants as their contribution. The discount amount depended on the (Group) TKVA over the<br />
performance period and came to 76%. The shares purchased under the program have a three-year lock-up<br />
period. The program resulted in an expense of €8.6 million (prior year: €0.9 million).
1.3 To our shareholders Corporate governance report report<br />
Supervisory Board compensation is is<br />
regulated by the Company’s Articles of of<br />
Association.<br />
The discount share purchase and MTI programs described will be replaced by the LTI in the future. The LTI<br />
employs a system comparable with the MTI. Under the LTI, too, stock rights are issued and their<br />
performance measured over a three-year period on the basis of TKVA; on expiration of the plan participants<br />
receive a cash payout equivalent to the value of the stock rights. The plan differs from the MTI in that the key<br />
data have been changed and the group of participants significantly expanded. In fiscal year 2010/2011 the<br />
LTI was awarded to only a few selected executives, the program has not yet been fully implemented. The<br />
resultant expenses amounted to €6.0 million.<br />
In addition it was decided to modify the structure of the variable compensation component for further<br />
selected executives in such a way that 20% of the bonus awarded for each fiscal year must now be<br />
converted into ThyssenKrupp AG stock rights and is only paid out in cash after the expiration of three fiscal<br />
years on the basis of the average ThyssenKrupp share price in the 4th quarter of the 3rd fiscal year. This will<br />
be implemented for the first time for the 2010/2011 fiscal year.<br />
Appropriate Supervisory Board compensation<br />
The compensation of the Supervisory Board, which is based on the duties and responsibility of the<br />
Supervisory Board members and on the business situation and performance of the Group, is regulated in<br />
§14 of the Articles of Association of ThyssenKrupp AG.<br />
In addition to reimbursement of their expenses and a meeting attendance fee of €500, Supervisory Board<br />
members receive compensation comprising three elements: fixed compensation of €50,000 and two<br />
performance-related elements. The first is a performance bonus of €300 for each €0.01 by which the<br />
dividend paid out to shareholders for the past fiscal year exceeds €0.10 per share. On top of this there is a<br />
component based on the long-term performance of the Company in the form of an annual compensation of<br />
€2,000 for each €100 million by which average earnings before taxes (EBT) in the last three fiscal years<br />
exceed €1 billion.<br />
The Chairman receives three times the above fixed compensation, performance bonus and long-term<br />
performance-based component, and the Vice Chairman double these amounts. In accordance with the<br />
German Corporate Governance Code, chairmanship and membership of the Supervisory Board committees<br />
are compensated separately. Supervisory Board members who only serve on the Supervisory Board for part<br />
of the fiscal year receive a proportionally reduced compensation amount. If a Supervisory Board member<br />
does not attend a meeting of the full Supervisory Board or a committee meeting, his/her compensation is<br />
reduced proportionally.<br />
On the basis of the proposed dividend, members of the Supervisory Board will receive total compensation,<br />
including meeting attendance fees, for the reporting year of €1.8 million (prior year: €1.8 million). The<br />
individual members will receive the amounts listed in the following table. As the average EBT of the last<br />
three fiscal years is below the threshold of €1 billion – as in the previous year – no payment will be made<br />
from the long-term compensation component for fiscal year 2010/2011.<br />
38
To our shareholders<br />
1.3 To our shareholders Corporate governance report<br />
Supervisory Board compensation in €<br />
Fixed<br />
compensation Bonus<br />
2009/2010 2010/2011<br />
Long-term<br />
component<br />
Total<br />
compensation 2)<br />
Fixed<br />
compensation Bonus<br />
Long-term<br />
component<br />
38 | 39<br />
Total<br />
compensation 2<br />
Dr. Gerhard Cromme, Chairman 1) 200,000 42,000 — 251,500 200,000 42,000 — 251,500<br />
Bertin Eichler, Vice Chairman 1) 150,000 31,500 — 190,000 150,000 31,500 — 191,000<br />
Theo Frielinghaus (until March 31, 2010) 1) 28,040 5,888 — 35,928 — — — —<br />
Markus Grolms (since October 14, 2009) 1) 52,909 11,111 — 66,520 62,500 13,125 — 79,125<br />
Susanne Herberger 1) 60,582 12,722 — 76,304 59,167 12,425 — 74,592<br />
Prof. Jürgen Hubbert (until January 21, 2010) 15,479 3,251 — 19,730 — — — —<br />
Bernd Kalwa 1) 62,500 13,125 — 79,125 62,500 13,125 — 79,125<br />
Prof. Dr. Hans-Peter Keitel (since January 21, 2010) 34,658 7,278 — 43,436 46,667 9,800 — 58,467<br />
Ernst-August Kiel (since April 12, 2010) 21,991 4,618 — 27,109 50,000 10,500 — 63,000<br />
Dr. Martin Kohlhaussen (until January 21, 2010) 1) 17,875 3,754 — 23,629 — — — —<br />
Dr. Heinz Kriwet (until January 21, 2010) 1) 16,678 3,502 — 21,680 — — — —<br />
Prof. Dr. Ulrich Lehner 1) 62,500 13,125 — 80,625 62,500 13,125 — 80,125<br />
Sabine Maaßen (since January 22, 2011) — — — — 34,521 7,249 — 43,270<br />
Prof. Dr. Bernhard Pellens 1) 71,164 14,945 — 91,609 75,000 15,750 — 95,750<br />
Peter Remmler 50,000 10,500 — 63,000 50,000 10,500 — 63,000<br />
Dr. Kersten v. Schenck 1) 57,084 11,987 — 71,571 59,167 12,425 — 74,592<br />
Peter Scherrer (until January 21, 2011) 50,000 10,500 — 63,000 15,479 3,251 — 19,730<br />
Thomas Schlenz 1) 87,500 18,375 — 113,375 87,500 18,375 — 114,375<br />
Dr. Henning Schulte-Noelle 1)<br />
(until January 21, 2011) 71,667 15,050 — 92,217 17,876 3,754 — 24.130<br />
Prof. Dr.-Ing. Ekkehard D. Schulz<br />
(since January 21, 2011) — — — — 38,353 8,054 — 47,907<br />
Wilhelm Segerath 1) 62,500 13,125 — 80,625 62,500 13,125 — 80,125<br />
Peer Steinbrück (since January 21, 2010) 1) 38,353 8,054 — 47,907 53,750 11,288 — 67,038<br />
Christian Streiff 50,000 10,500 — 63,000 50,000 10,500 — 63,000<br />
Jürgen R. Thumann 1) 55,331 11,620 — 69,451 71,164 14,945 — 92,109<br />
Prof. Dr. Beatrice Weder di Mauro<br />
(since January 21, 2010)<br />
32,347<br />
6,793 — 40,140 50,000 10,500 — 63,000<br />
Klaus Wiercimok 50,000 10,500 — 63,000 50,000 10,500 — 63,000<br />
Total 1,399,158 293,823 — 1,774,481 1,408,644 295,816 — 1,787,960<br />
1) Dr. Gerhard Cromme as Chairman of the Supervisory Board and of the Executive Committee, the Personnel Committee and the Strategy, Finance and Investment Committee and as member of the Audit<br />
Committee, Bertin Eichler as Vice Chairman of the Supervisory Board and member of the Executive Committee, the Personnel Committee, the Audit Committee and the Strategy, Finance and Investment<br />
Committee, Prof. Dr. Bernhard Pellens as Chairman of the Audit Committee, Dr. Henning Schulte-Noelle as member of the Executive Committee and the Personnel Committee (pro rata), Jürgen R. Thumann<br />
as member of the Executive Committee, the Personnel Committee and the Strategy, Finance and Investment Committee (pro rata), Thomas Schlenz as member of the Executive Committee, the Personnel<br />
Committee and the Audit Committee, Prof. Dr. Ulrich Lehner and Wilhelm Segerath as members of the Audit Committee, and Prof. Dr.-Ing. Ekkehard D. Schulz (pro rata) and Markus Grolms, Susanne Herberger,<br />
Bernd Kalwa, Dr. Kersten v. Schenck and Peer Steinbrück each as members of the Strategy, Finance and Investment Committee receve higher fixed and variable compensation.<br />
2) Total compensation also includes the meeting attendance fees paid to the members of the Supervisory Board. The members of the Supervisory Board received an attendance fee for each meeting of the Supervisory<br />
Board and its committees they attended in the amount of €500. Dr. Gerhard Cromme receved attendance fees of €9,500 (prior year: €9,500), Bertin Eichler €9,500 (prior year: €8,500), Markus Grolms €3,500<br />
(prior year: €2,500), Susanne Herberger €3,000 (prior year: €3,000), Bernd Kalwa €3,500 (prior year: €3,500), Prof. Dr. Hans-Peter Keitel €2,000 (prior year: €1,500), Ernst-August Kiel €2,500 (prior year: €500),<br />
Vorjahr: 1.500 €), Prof. Dr. Ulrich Lehner €4,500 (prior year: €5,000), Sabine Maaßen €1,500 (prior year: €0), Prof. Dr. Bernhard Pellens €5,000 (prior year: €5,500), Peter Remmler €2,500 (prior year: €2,500),<br />
Dr. Kersten v. Schenck €3,000 (prior year: €2,500), Peter Scherrer €1,000 (prior year: €2,500), Thomas Schlenz €8,500 (prior year: €7,500), Dr. Henning Schulte-Noelle €2,500 (prior year: €5,500),<br />
Prof. Dr.-Ing. Ekkehard D. Schulz €1,500 (prior year: €0), Wilhelm Segerath €4,500 (prior year: €5,000), Peer Steinbrück €2,000 (prior year: €1,500), Christian Streiff €2,500 (prior year: €2,500), Jürgen R. Thumann<br />
€6,000 (prior year: €2,500), Prof. Dr. Beatrice Weder di Mauro €2,500 (prior year: €1,000) and Klaus Wiercimok €2,500 (prior year: €2,500). In addition in the prior year Theo Frielinghaus received attendance fees of<br />
€2,000, Prof. Jürgen Hubbert €1,000, Dr. Martin Kohlhaussen €2,000 and Dr. Heinz Kriwet €1,500. Total attendance fees were paid in the amount of €83,500 (prior year: €81,500).<br />
The employee representatives who belong to trade unions have stated that they will transfer their compensation to the Hans-Böckler Foundation in accordance with the policies of the German Federation of Trade Unions.
1.3 To our shareholders Corporate governance report report<br />
No loans or advance payments were<br />
granted to members of the Supervisory<br />
No loans or advance payments were<br />
Board in the reporting year.<br />
granted to members of the Supervisory<br />
Board in the reporting year.<br />
Members of the Supervisory Board of ThyssenKrupp AG will additionally receive compensation of €89,750<br />
(prior year: €79,543) for supervisory board directorships at Group companies in fiscal year 2010/2011. The<br />
individual members of the Supervisory Board will receive the amounts shown in the following table:<br />
Compensation from supervisory board directorships within the Group in €<br />
2009/2010 2010/2011<br />
Theo Frielinghaus (until March 31, 2010) 3,819 —<br />
Susanne Herberger 16,500 16,250<br />
Bernd Kalwa 15,750 16,250<br />
Ernst-August Kiel (since April 12, 2010) 9,382 19,600<br />
Thomas Schlenz 19,732 21,150<br />
Wilhelm Segerath 14,360 16,500<br />
Total 79,543 89,750<br />
As in the previous year Supervisory Board members received no further compensation or benefits for<br />
personal services rendered, in particular advisory and mediatory services, with one exception. The law firm<br />
Clifford Chance, for which Supervisory Board member Dr. v. Schenck works as an of counsel, received a<br />
total of €82,364 (prior year: €70,702) from ThyssenKrupp companies for its consulting services. As in<br />
previous years, no loans or advance payments were granted to members of the Supervisory Board, nor were<br />
any guarantees or other commitments entered into in their favor.<br />
Related to the reporting year, former Supervisory Board members who left the Supervisory Board before<br />
October 01, 2010 will not receive any compensation from the long-term compensation component for the<br />
time they served on the Supervisory Board because – as in the prior year – average EBT in the last three<br />
fiscal years is below the threshold of €1 billion.<br />
40
To our shareholders<br />
1.4 1.4 To To our our shareholders ThyssenKrupp stock stock<br />
ThyssenKrupp stock<br />
Our stock was impacted by the turbulence on the world’s capital<br />
markets. After reaching a year high of €35.84 in June 2011, it<br />
closed at €18.55 at the end of September. Our investor relations<br />
activities in the reporting year focused on the further strategic<br />
development of the Group.<br />
Analyst recommendations for<br />
ThyssenKrupp stock<br />
at September 30, 2011<br />
in %<br />
70<br />
Buy<br />
10<br />
Sell<br />
20<br />
Hold<br />
Key data of ThyssenKrupp stock<br />
40 | 41<br />
2006/2007 2007/2008 2008/2009 2009/2010 2010/2011<br />
Capital stock million € 1,317 1,317 1,317 1,317 1,317<br />
Number of shares (total) million shares 514.5 514.5 514.5 514.5 514.5<br />
Stock exchange value end<br />
September million € 22,977 10,819 12,106 12,306 9,543<br />
Closing price end September € 44.66 21.03 23.53 23.92 18.55<br />
High € 46.14 46.63 25.05 28.07 35.84<br />
Low € 26.19 20.78 12.11 19.82 18.55<br />
Dividend € 1.30 1.30 0.30 0.45 0.45 1)<br />
Dividend € 1.30 1.30 0.30 0.45 0.45 1)<br />
Dividend total million € 635 603 139 209 232 1)<br />
Dividend total million € 635 603 139 209 232 1)<br />
Dividend yield % 2.9 6.2 1.3 1.9 2.4 1)<br />
Dividend yield % 2.9 6.2 1.3 1.9 2.4 1)<br />
Earnings per share € 4.30 4.59 (4.01) 1.77 (2.71)<br />
Number of shares<br />
(outstanding 2) Number of shares<br />
(outstanding ) million shares 488.8 477.8 463.5 464.0 476.2<br />
2) ) million shares 488.8 477.8 463.5 464.0 476.2<br />
Trading volume<br />
(daily average) million shares 3.8 4.3 4.8 3.4 3.2<br />
1) 2) Proposal Proposal to the Annual General Meeting weighted average<br />
Analyst interest at high level<br />
Over 30 analysts publish regular analyses of our company and report on our stock. At the end of the<br />
2010/2011 fiscal year their investment recommendations, which reflect the stock’s potential, were<br />
overwhelmingly positive.
1.4 To our shareholders ThyssenKrupp stock<br />
Stock performance impacted by financial crisis<br />
ThyssenKrupp’s stock performed well in the 1st quarter 2010/2011. Key factors in this were the strategic<br />
measures we implemented and the general economic situation, which also favored our business.<br />
Subsequently, however, the capital markets weakened due to rising raw material prices and the natural<br />
disaster in Japan. This trend shaped our share performance in the 2nd quarter.<br />
Performance of ThyssenKrupp stock relative to DAX and DJ STOXX, indexed,<br />
September 30, 2010 to September 30, 2011<br />
160<br />
140<br />
120<br />
100<br />
80<br />
60<br />
Oct<br />
2010<br />
Nov Dec Jan<br />
2011<br />
ThyssenKrupp stock DAX DJ Stoxx<br />
Feb Mar Apr May Jun Jul Aug Sept<br />
In the 3rd quarter the stock initially recovered its previous losses. In particular after the announcement of<br />
our strategic development plans in early May 2011 it surged to a reporting year high of €35.84 at the end<br />
of June. The 4th quarter was then dominated by the turbulence on the international financial markets.<br />
ThyssenKrupp’s stock lost all its gains and closed the fiscal year at €18.55, a low for the reporting year and<br />
down 22.5% from twelve months earlier.<br />
42
To our shareholders<br />
1.4 To our shareholders ThyssenKrupp stock<br />
Page 52<br />
Highs and lows of ThyssenKrupp stock in €<br />
October 01, 2010 to September 30, 2011<br />
36<br />
32<br />
28<br />
24<br />
20<br />
16<br />
27.12<br />
24.13<br />
Oct<br />
2010<br />
30.70<br />
26.35<br />
32.00 31.99<br />
30.07<br />
29.39<br />
Nov Dec Jan<br />
2011<br />
Monthly average High/low (closing prices)<br />
31.13<br />
29.47<br />
29.87<br />
26.54<br />
Feb Mar Apr May Jun Jul Aug Sept<br />
42 | 43<br />
Dividend proposal of €0.45 per share<br />
At the Annual General Meeting on January 20, 2012, the Executive Board and Supervisory Board will<br />
propose payment of a dividend of €0.45 per share for the 2010/2011 fiscal year. Based on the share price<br />
of €18.55 on September 30, 2011, the dividend yield is 2.4%. The payout ratio is 47.0% of the net income<br />
of ThyssenKrupp AG, which forms the legal basis for distribution.<br />
Further internationalization of shareholder structure<br />
ThyssenKrupp analyzes its shareholder structure twice a year, focusing in particular on the regional<br />
distribution of institutional investors. Among other things, these data form the basis for the planning of our<br />
roadshows and participation in conferences. At the end of September 2011, the number of institutional<br />
investors holding ThyssenKrupp shares was up significantly to 470 from 442 at the end of March 2011 and<br />
434 in the prior year. At the same time the shareholder base has become even more international.<br />
The most important region is now North America. Investors based there hold 15.3% of our capital stock.<br />
Investors from continental Europe (excluding Germany) hold 12.2% of the capital stock, with France (3.4%)<br />
and Norway (3.1%) the most important individual countries. 9.4% of the capital stock is held by investors in<br />
the United Kingdom and Ireland, and 9.2% by investors in Germany.<br />
The largest shareholder is the Alfried Krupp von Bohlen und Halbach Foundation, Essen, which holds<br />
25.33% of the Company’s capital stock. Private investors around the world own a roughly 10% share of<br />
ThyssenKrupp.<br />
Following the sale of treasury shares in July 2011 ,ThyssenKrupp AG no longer holds any treasury shares;<br />
details are provided in the section “Profile and Strategy”. As a result of this transaction, the free float<br />
increased to 74.67% of the capital stock.<br />
31.07<br />
28.55<br />
33.65<br />
29.84<br />
35.84<br />
31.96<br />
35.28<br />
30.85<br />
30.11<br />
20.84<br />
22.96<br />
18.55
1.4 To our shareholders ThyssenKrupp stock<br />
How to contact contact us, our financial calendar<br />
and other information can be be found at at the the<br />
end of the Annual Report or or online at at<br />
www.thyssenkrupp.com<br />
IR work dominated by Group strategy<br />
Dialogue between our investor relations team and the capital market was dominated by two themes in the<br />
reporting year: increased transparency as a consequence of the new organizational structure of the Group<br />
with eight business areas, and the plan for the further strategic development of the Group adopted in May<br />
2011.<br />
We mainly made use of traditional instruments such as roadshows and investor conferences to commence<br />
or deepen our dialogue with as many institutional investors as possible. These activities were centered on<br />
financial centers in Europe and the USA. As our shares are still often seen as a steel stock, in addition to<br />
investor conferences focusing on metals and mining we also took part in engineering and capital goods<br />
conferences. This helps us position the Group appropriately on the capital market.<br />
Field trips for investors and analysts to various Group locations rounded out our IR activities. These visits<br />
gave participants a far deeper insight into our operations and their high quality. A particular focus in the past<br />
fiscal year was our new steel processing site in Alabama. The analyst briefing we held in December 2010 as<br />
part of the plant opening met with a very positive response. A similar event was staged at our new steel mill<br />
in Brazil in October 2011.<br />
In the future, the Group’s operating activities will also be brought more to the fore at our Capital Markets<br />
Days. The business areas of the Technologies division will present themselves at the first such event in<br />
December 2011.<br />
We likewise made regular presentations on the Group to private investors at numerous events. They were<br />
also a key target group for the investor relations pages on our website. In addition, our telephone hotline<br />
was intensively used by private investors.<br />
44
Management report on the Group<br />
Management report<br />
on the Group<br />
The Group’s performance in the reporting year, our Strategic Way<br />
Forward and the main opportunities and risks we face going forward<br />
are the central topics of the management report on the Group. Information<br />
on the organizational structure of the Group, the performance<br />
of the business areas and the non-fi nancial performance indicators<br />
round out the picture of your Company.<br />
Management report on the Group<br />
2.1 Profi le and strategy 49 – 56<br />
— Capability profi le and organizational structure 49<br />
— The Group’s Strategic Way Forward 50<br />
— Corporate program impact 53<br />
— Value-based management 54<br />
2.2 Consolidated results of operations 57 – 70<br />
— Summarized assessment by the<br />
Executive Board of business performance<br />
and target achievement 57<br />
— General economic conditions 57<br />
— Business performance in the Group 60<br />
— Sales markets and marketing 66<br />
— Procurement of raw materials and energy 67<br />
2.3 Results of operations of the business areas 71 – 84<br />
— Steel Europe 71<br />
— Steel Americas 73<br />
— Materials Services 75<br />
— Elevator Technology 76<br />
— Plant Technology 78<br />
— Components Technology 79<br />
— Marine Systems 80<br />
— Stainless Global (discontinued operation) 82<br />
— Corporate at ThyssenKrupp AG 84<br />
2.4 Financial position 85 – 92<br />
— Capital expenditures 85<br />
— Net fi nancial debt 87<br />
— Analysis of the statement of cash fl ows 88<br />
— Central fi nancing and maintenance of liquidity 89<br />
— Analysis of the statement of fi nancial position 90<br />
— Assets not recognized and<br />
off -balance fi nancing instruments 92<br />
2.5 Non-fi nancial performance indicators 93 – 101<br />
— Sustainability 93<br />
— Innovations 94<br />
— Employees 96<br />
— Environment and climate 99<br />
— Corporate citizenship 101<br />
2.6 Subsequent events 101<br />
2.7 Expected developments and associated<br />
opportunities and risks 102 – 119<br />
— Economic outlook 102<br />
— Expected results of operations 104<br />
— Expected fi nancial and liquidity situation 106<br />
— Opportunity report 106<br />
— Risk report 108<br />
2.8 Legal information 120 – 124<br />
— Corporate governance declaration 120<br />
— Compensation report 120<br />
— Disclosure of takeover provisions 120
Automotive<br />
Aerospace<br />
The challenge<br />
of of mobility<br />
Material
Lightening the load<br />
The challenge of mobility: The number of cars around<br />
the world is constantly on the rise, so we need to slash<br />
the amount of resources needed to make and run them.<br />
Vehicle numbers<br />
worldwide (in millions/*forecast)<br />
37<br />
96<br />
411<br />
864<br />
1930 1955 1980 2005<br />
2,375<br />
* 2030
More mobility<br />
More and more<br />
traffi c<br />
More information on this subject can be<br />
found in the ThyssenKrupp Yearbook on<br />
pages 22 – 29.<br />
<strong>Engineering</strong><br />
Better means of transport<br />
Moving people<br />
more effi ciently
Management report on the Group<br />
2.1 Management Management Management report on the Group Profile and and strategy<br />
Profile and strategy<br />
ThyssenKrupp ThyssenKrupp ThyssenKrupp is responding to the ever-changing global markets<br />
with a sharper profile and focused strategy. strategy. strategy. Our engineering<br />
expertise is the key to the Group’s future technical and commercial<br />
success. Together with our customers we want to develop global<br />
growth opportunities in a sustainable way. way. way.<br />
Pages 202–222 202–222 202–222<br />
Pages 202–222<br />
Page Page 51 51 51<br />
Capability profile and organizational structure<br />
48 | 49<br />
Capability Capability Capability profile<br />
ThyssenKrupp is is is a diversified diversified diversified industrial group. For us, innovations innovations innovations and technical technical technical progress are are are key factors factors factors in<br />
managing managing managing global global global growth and the use of finite finite finite resources in a sustainable way. way. way. With With With our engineering engineering engineering expertise<br />
in in in the areas areas areas “Material”, “Mechanical” “Mechanical” “Mechanical” and and and “Plant” we we we enable our customers to compete successfully in in in the<br />
global market place. We offer them a broad broad broad range range range of capabilities allowing them them them to operate innovatively and<br />
utilize resources efficiently. efficiently. efficiently. Our capabilities extend from high-quality high-quality high-quality steels to technological goods goods goods such as<br />
elevators, escalators and complete industrial complexes, to advanced naval technology.<br />
Organizational and management structure<br />
The Group’s operations are organized in in in eight business areas each having several operating units – seven<br />
operating business areas plus Stainless Global as a discontinued operation. The business areas are are are<br />
bracketed bracketed bracketed together in in in two divisions – Materials and Technologies Technologies Technologies – which which which describe the Group’s strategic<br />
focus. focus. focus. The business areas and their Group companies operate independently on the the the market. Directly or<br />
indirectly, indirectly, indirectly, ThyssenKrupp has almost almost almost 780 companies companies companies and equity interests in around 80 countries. Details on<br />
our shareholdings are provided in the Notes. The largest of our more than 1,100 sites is Duisburg with<br />
16,700 16,700 16,700 employees, followed by Rio de Janeiro in Brazil Brazil Brazil with 5,200 employees.<br />
Organizational structure<br />
ThyssenKrupp Group<br />
Corporate headquarters<br />
ThyssenKrupp AG<br />
Business areas<br />
Materials division<br />
Steel<br />
Europe<br />
Steel<br />
Americas<br />
Materials<br />
Services<br />
* discontinued operation as of September 30, 2011<br />
Technologies division<br />
Elevator<br />
Technology<br />
Plant<br />
Technology<br />
Components<br />
Technology<br />
Marine<br />
Systems<br />
Discontinued<br />
operation<br />
Stainless<br />
Global*<br />
As part of the the the Strategic Strategic Strategic Way Forward, the Group intends to divest divest divest the operations of the Stainless Global<br />
business area – more more more on this in the section below. As of September September September 30, 2011, 2011, 2011, Stainless Global is classified<br />
as a a a discontinued operation under IFRS. Therefore, key figures for the reporting year year year are stated and
2.1 Management report on the Group Profile and and strategy<br />
commented upon for the whole Group and for the continuing operations; where not otherwise stated we<br />
report on the Group as a whole. However, forward-looking statements relate exclusively to the continuing<br />
operations.<br />
The strategic management of the Group is the responsibility of corporate headquarters at ThyssenKrupp AG.<br />
ThyssenKrupp AG was founded in 1999 as a stock corporation under German law and has dual domiciles in<br />
Duisburg and Essen. The headquarters are located in Essen in the ThyssenKrupp Quarter. The Executive<br />
Board of ThyssenKrupp AG sets the strategy for the Group’s development, directs the business areas and is<br />
responsible for central corporate functions. In addition to their own directorates, members of the Executive<br />
Board are responsible for specific world regions. Their duties also include executive development and talent<br />
management.<br />
The Group’s Strategic Way Forward<br />
Following the successful turnaround in fiscal year 2009/2010, we defined a new strategy for the Group in<br />
the reporting year. Market and customer focus, coupled with innovation and engineering expertise, form the<br />
framework for sustainable success.<br />
Global trends are our growth base<br />
Business opportunities for ThyssenKrupp<br />
Driver Demand (“more”)<br />
Business opportunities<br />
Demand (“better”)<br />
Constraints<br />
Demographic<br />
change<br />
Urbanization<br />
Globalization<br />
More consumer and<br />
capital goods<br />
More infrastructure<br />
and buildings<br />
More resource and<br />
energy consumption<br />
Resources<br />
Leading<br />
engineering<br />
expertise<br />
in<br />
Material<br />
Mechanical<br />
Plant<br />
Infrastructure<br />
Reduction in<br />
CO 2 emissions,<br />
renewable energies<br />
Efficient infrastructure<br />
and methods/<br />
processes<br />
Efficient resource<br />
and energy utilization,<br />
alternative energies<br />
The economic strength of the emerging countries, above all Brazil, India and China, is growing rapidly.<br />
Global trends such as demographic change, increasing urbanization and globalization of trade flows provide<br />
major impetus for steadily rising demand. The world needs “more” – whether it’s consumer and capital<br />
goods, infrastructure, energy or raw materials.<br />
50<br />
Climate<br />
change<br />
Finite<br />
resources<br />
Political framework<br />
conditions
IPO: Sale of a company to investors on<br />
the stock market.<br />
S IPO: p i n Sale - o ff : of Separation a company of to part investors of a company<br />
and on the distribution stock market. of its shares.<br />
Management report on the Group<br />
2.1 Management report on the Group Profile and strategy<br />
Spin-off: Separation of part of a<br />
company and distribution of its shares<br />
to the shareholders of the parent.<br />
50 | 51<br />
Rising demand is faced with constraints, above all the finite availability of resources and the need to protect<br />
our environment. Global climate change is leading to stricter rules for industry, requiring efficient use of<br />
resources and raw materials. So the world doesn’t just need “more”, above all it needs “better” solutions:<br />
better use of resources, more efficient infrastructure, greener production processes and more efficient<br />
consumer and industrial goods.<br />
This opens up significant opportunities for ThyssenKrupp. With our broad and leading engineering expertise<br />
in many areas we can meet demands for both “more” and “better” – in the industrialized countries and also<br />
in the emerging markets – and so create clear competitive advantages both for us and for our customers<br />
worldwide.<br />
Key points of the Strategic Way Forward<br />
Against this global background, on May 13, 2011 ThyssenKrupp AG decided on an integrated program for<br />
the further strategic development of the Group. The main aims of the Strategic Way Forward are to reduce<br />
the Group’s debt, enable sustainable growth, increase earning power, and create value. It involves focusing<br />
our portfolio and divesting businesses for which there are stronger strategic alternatives. It will strengthen<br />
our financial base and provide new flexibility to expand strategically promising businesses.<br />
The strategy is driven by a corporate culture based on transparency, responsibility and clear leadership. For<br />
us, transparency means measuring our actions against clear indicators. Responsibility means shaping a<br />
sustainable future for the Group. By leadership we mean defining clear strategic goals and creating the<br />
framework for implementing them successfully. Our aim is to rank among the best in the market in each of<br />
our businesses over the long term.<br />
First measures as part of the Strategic Way Forward have now been initiated or already completed:<br />
– In a move towards portfolio optimization the Group will divest the operations of the Stainless Global<br />
business area. The corporate, organizational and contractual conditions for the carve out of Stainless<br />
Global were established effective September 30, 2011: The new entity – called Inoxum – has a holding<br />
company structure with a functional board performing strategic tasks and directing the operating units.<br />
In what form the actual separation is subsequently carried out is being examined with an open mind. The<br />
options are an IPO, a spin-off or a sale. As a separate entity Inoxum will be able to develop its<br />
competitive position with greater flexibility in the future – also with a view to potential strategic<br />
partnerships.<br />
– The negotiations with the Abu Dhabi MAR group on the complete takeover of the civil shipbuilding<br />
activities and a joint venture in naval surface ship building were ended by mutual consent. The scope of<br />
the transaction is now restricted exclusively to the civil part of the former HDW-Gaarden with the transfer<br />
of around 180 employees and corresponding assets.<br />
Talks are currently being conducted on the sale of the civil operations of Blohm + Voss – the yacht<br />
building and repair and components businesses in Hamburg; Marine Systems will concentrate on military<br />
shipbuilding in the future. The restructuring of the shipyard site in Emden was completed at the beginning<br />
of the reporting year with the sale of ThyssenKrupp Fahrzeugtechnik.
2.1 Management report on the Group Profile Profi le and and strategy<br />
The sale of treasury stock in in July<br />
2011 resulted in a cash inflow infl ow<br />
of €1.6 billion.<br />
– We have found a best owner for the Xervon group in REMONDIS, a service company focused on water<br />
and recycling services. Xervon provides technical services for the erection and maintenance of industrial<br />
plants around the world and is therefore an excellent fit for the REMONDIS portfolio. The sale and<br />
purchase agreement was signed in the final quarter of the reporting year; the closing will follow after<br />
approval by the responsible merger authorities. The approval of the EU competition authority has already<br />
been received. Altrad S.A. of France purchased Xervon’s Spanish subsidiary back in October 2010. This<br />
took Materials Services a major step forward in restructuring its industrial services business.<br />
– The sale of the Metal Forming group to the Spanish automotive supplier Gestamp Automoción was<br />
completed in July 2011 after the approval of the EU competition authorities. The group, which<br />
manufactures high-quality chassis and body parts, was no longer part of the core business of Steel<br />
Europe. In addition it is planned to sell ThyssenKrupp Tailored Blanks.<br />
– Under the new strategic framework we will also combine the chassis operations of the Bilstein group and<br />
Presta Steering, and divest the spring and stabilizer business and the Brazilian Automotive System<br />
operation as part of a best-owner solution. The management structure for the new entity formed from<br />
Bilstein and Presta Steering has already been decided. The combination creates one of the world’s<br />
biggest chassis full-service providers with a global footprint. With its damping and steering expertise it<br />
will be better able to meet customer demands for modern chassis systems. We also plan to divest the US<br />
foundry group Waupaca.<br />
– In September and October 2011 Elevator Technology acquired all the operations of two US companies:<br />
General Elevator Sales and Services, Inc. in Florida, and United Elevator Company, Inc. in Pennsylvania.<br />
Both companies specialize in elevator service, maintenance and modernization and have been operating<br />
successfully on the American market for decades. This consolidates the already strong position of<br />
ThyssenKrupp Elevator in North America and sets us on course for further growth in this region. We<br />
strengthened our market position in Europe with further acquisitions in the Benelux countries and in<br />
Spain, Italy and France.<br />
– In a further step, ThyssenKrupp sold treasury shares equivalent to 9.6% of the capital stock at the<br />
beginning of July 2011. We sold 49,484,842 shares at a price of €32.95 per share, resulting in a cash<br />
inflow of €1.6 billion. The shares were placed mainly with German and international institutional investors<br />
in an accelerated bookbuilding. The transaction strengthened equity and reduced net financial debt.<br />
ThyssenKrupp AG now no longer holds any treasury shares.<br />
– The strategy is supported by a new Group mission statement. Over 1,300 employees from all business<br />
areas worked on its development – among other things in workshops in the USA, Canada, Brazil, Spain,<br />
China, Hong Kong, Dubai, India, South Africa and Germany. As a new “corporate constitution” the<br />
mission statement creates a common roof for all the Group’s employees. It requires and promotes more<br />
transparency, openness and teamwork in our operating culture. Highest standards and common values<br />
such as reliability, integrity and responsibility determine our actions. We are a materials and technology<br />
company and meet the challenges of the future with our customers.<br />
52
Management report on the Group<br />
2.1 Management report on the Group Profile and strategy<br />
A A name as a signal – impact includes the the<br />
words words “act” for action and “pact” in in the the<br />
sense sense of an alliance of knowledge and skills.<br />
skills.<br />
Corporate program impact<br />
52 | 53<br />
To implement the Strategic Way Forward with the active involvement of our employees, we launched the<br />
corporate program impact. impact has the aim of creating sustainable value in the Group. We want to<br />
achieve profitable growth in our businesses and markets while securing competitiveness, profitability and<br />
capital efficiency. For this, we have defined four initiatives, addressing the following key themes:<br />
– Customers & Markets<br />
Strengthening customer understanding, implementing market opportunities, developing regional and<br />
growth markets<br />
– People & Development<br />
Developing skills and potential, and using them optimally<br />
– Performance & Portfolio<br />
Improving efficiency and quality, optimizing the portfolio, increasing earning power<br />
– Innovation & Technology<br />
Expanding technological expertise, improving innovation management, strengthening competitiveness<br />
Corporate program impact<br />
Transparency<br />
Customers & Markets<br />
Market know-how<br />
Regional development & growth markets<br />
Customer and service focus<br />
Account management & cross-selling<br />
Focused IP strategy<br />
Leading technology positions<br />
New materials and products<br />
New innovation fi elds<br />
Innovative tools in engineering & service<br />
Innovation & Technology<br />
Leadership & Culture<br />
Sustainable value<br />
creation<br />
Performance & Portfolio<br />
Continuous benchmarking<br />
Cost and complexity reduction<br />
Improved capital effi ciency<br />
Process excellence<br />
Portfolio optimization<br />
Business opportunities<br />
for ThyssenKrupp:<br />
Diff erentiation with solutions<br />
People & Development<br />
Three enabling enabling themes support the initiatives and define the framework for our business actions. They are:<br />
– Transparency<br />
The management of the ThyssenKrupp ThyssenKrupp Group should be based on uniform performance indicators,<br />
understandable for all. This also applies to the impact program program as as a a whole: It is part of operational<br />
budget planning; progress is monitored monthly.<br />
Responsibility
2.1 Management report on the Group Profile and and strategy<br />
Calculation of<br />
ThyssenKrupp Value Added (TKVA)<br />
TKVA<br />
–<br />
EBIT<br />
Cost of<br />
capital<br />
–<br />
Sales<br />
Capital<br />
employed<br />
x<br />
Costs<br />
WACC<br />
– Responsibility<br />
Every employee is measured against the sustainable success of the company. This includes adherence to<br />
compliance rules.<br />
– Leadership and culture<br />
In a modern corporate culture managers see themselves as role models and multipliers. For example,<br />
internal communication at ThyssenKrupp today is much more intensive than in the past.<br />
impact replaces the previous corporate program ThyssenKrupp best. It retains proven methods, tools,<br />
templates and processes, and builds on successful ThyssenKrupp-best approaches. One example of this is<br />
continuous benchmarking. To make the effects of impact transparent the program is integrated into our<br />
financial planning and reporting systems.<br />
With the introduction of the new corporate program the first-ever impact award was presented. The award is<br />
recognition for the three best measures under the corporate program in a fiscal year. First place went to<br />
Elevator Technology for the “Supply Management Efficiency Program”. Second prize was won by Steel<br />
Europe for the measure “Energy cost reduction and increased energy efficiency”, and third prize went to a<br />
Materials Services measure called “Establishing a central warehouse network for engineering steel”.<br />
Value-based management<br />
We aim to systematically and continuously increase the value of the company through profitable growth and<br />
a focus on businesses with the best development opportunities. For this we use a value-based management<br />
system. Key elements of this management system are integrated controlling, value-based performance<br />
indicators, and value-increasing measures.<br />
Integrated controlling secures Groupwide transparency<br />
We use an integrated controlling system to manage the activities of all areas of the Group. It helps us<br />
identify and bridge operational and strategic gaps between actual and target performance. Our high-quality<br />
reporting and forecasting systems connect strategic and operational elements in real time. The performance<br />
indicators are also used to calculate the variable components of management compensation.<br />
ThyssenKrupp Value Added as a value-based performance indicator<br />
The central performance indicator for our value-based management system is ThyssenKrupp Value Added<br />
(TKVA), which measures the value created in a period at all levels of the Group. It is calculated as earnings<br />
before interest and taxes (EBIT) minus cost of capital. Cost of capital represents the expected return on<br />
equity and debt. The weighted average cost of capital (WACC) is calculated on a pre-tax basis and is made<br />
up of the weighted average cost of equity and debt as well as the interest rate for pension provisions. Capital<br />
employed is defined as invested assets plus net working capital; it is the amount of capital tied up in<br />
operations.<br />
54
Management report on the Group<br />
2.1 Management report on the Group Profile and strategy<br />
Page 56<br />
54 | 55<br />
Increasing value through growth, efficiency, capital employed<br />
TKVA can be increased using three levers: profitable growth, higher operating efficiency, and optimized<br />
capital employed. A major contribution to profitable growth and thus to the value of the company is made by<br />
investment projects that generate returns higher than their cost of capital. Higher operating efficiency and<br />
optimum capital employed are also aims of the new impact program. With it we will increase EBIT, reduce<br />
net working capital and so sustainably improve TKVA.<br />
The results of the analysis of the performance indicators feed directly into portfolio management. Group<br />
management decides which businesses are to be expanded to realize set TKVA targets, and which activities<br />
we should withdraw from in a timely way to protect value.<br />
Value-added impacted by impairment charges<br />
In calculating TKVA we applied the new definitions of EBIT and capital employed for the first time from<br />
2010/2011 and adjusted the prior-year figures.<br />
In the past fiscal year ThyssenKrupp generated highly negative value-added of €(2,962) million. This was<br />
caused by the high impairment charges in the Steel Americas and Stainless Global business areas, which<br />
weighed heavily on EBIT of the ThyssenKrupp Group. In addition, average capital employed increased yearon-year<br />
by €2,456 million in 2010/2011, mainly due to the major investments in the Steel Americas and<br />
Stainless Global business areas. The value-added figures of the other six business areas were strongly<br />
positive and in most business areas were considerably up from the prior year, mainly due to higher<br />
earnings. Details on the value-added ratios are shown in the table below.<br />
Components of ThyssenKrupp Value Added (TKVA)<br />
EBIT<br />
(million €)<br />
Capital<br />
employed<br />
(million €)<br />
2009/2010 2010/2011<br />
WACC<br />
(%)<br />
TKVA<br />
(million €)<br />
EBIT<br />
(milion €)<br />
Capital<br />
employed<br />
(million €)<br />
WACC<br />
(%)<br />
TKVA<br />
(million €)<br />
Change<br />
TKVA<br />
(million €)<br />
Group<br />
Thereof:<br />
1,346 20,767 8.5 (419) (988) 23,223 8.5 (2,962) (2,543)<br />
Steel Europe 731 5,370 9.0 248 1,133 5,822 9.0 609 361<br />
Steel Americas (600) 5,678 9.0 (1,111) (3,145) 7,416 9.0 (3,813) (2,702)<br />
Materials Services 463 3,179 8.5 193 478 3,430 8.5 186 (7)<br />
Elevator<br />
Technology 646 2,307 8.0 461 801 2,243 8.0 621 160<br />
Plant Technology 401 365 9.0 369 506 245 9.0 484 115<br />
Components<br />
Technology 252 2,647 9.0 14 543 2,796 9.0 291 277<br />
Marine Systems 145 1,174 9.0 39 213 1,334 9.0 94 55<br />
Stainless Global (57) 2,948 9.0 (323) (785) 3,356 9.0 (1,087) (764)<br />
The TKVA of Stainless Global in 2010/2011 includes an impairment charge of €510 million in accordance<br />
with IFRS 5. The TKVA of Materials Services in 2010/2011 includes an impairment charge of €48 million in<br />
accordance with IFRS 5.
2.1 Management report on the Group Profile and and strategy<br />
Details of the switch are explained on on<br />
pages pages 96-97 of the Annual Report<br />
2009/2010.<br />
Further development of value-based management<br />
In fiscal year 2010/2011 ThyssenKrupp switched its operational management from EBT to EBIT. EBIT is a<br />
key parameter affecting TKVA, so we now manage the Group based more closely on the performance factors<br />
that can be influenced by operational management. In addition, operational management and value<br />
management are now optimally interlinked.<br />
In connection with the introduction of EBIT-based management we modified the definitions of EBIT and<br />
capital employed, altering the classification of financial income/expense into operational and nonoperational<br />
components. EBIT contains only components of financial income/expense that are operational in<br />
nature. Interest income, interest expense and the great majority of other financial income/expense are nonoperational<br />
in character. These modifications also apply at business area level and take into account the fact<br />
that the receipt of advance payments, particularly in the business areas with long-term construction<br />
contracts, is an integral part of risk management – to avoid default risks on the customer side – and thus of<br />
operating business. To recognize these advance payments, and the interest and financing effects attainable<br />
with them, in our value management, the EBIT of the relevant business areas is increased by an imputed<br />
earnings contribution.<br />
56
Management report on the Group<br />
2.2 Management report on on the the Group Group Consolidated results results of operations of operations<br />
Consolidated results of<br />
operations<br />
ThyssenKrupp continued its upward trend in operating business in<br />
2010/2011. Orders and sales grew at double-digit rates. The<br />
market situation and above all our measures to improve our<br />
earnings structure had a positive effect – adjusted EBIT increased<br />
by €521 million to €1,762 million. However, high impairment<br />
charges resulted in negative EBIT.<br />
Summarized assessment by the Executive Board of<br />
business performance and target achievement<br />
56 57 | 57<br />
Good activity levels in sectors and regions important to us together with our internal efficiency and<br />
improvement programs were the basis for our continued operating performance in the reporting year.<br />
Orders, sales and adjusted EBIT grew at double-digit rates. Net financial debt fell to €3,578 million,<br />
compared with €3,780 million at the end of the prior year. At the same time we introduced an ambitious<br />
strategic development plan to improve the Group’s competitiveness and earning power in the future. Subject<br />
to the uncertainties regarding the economic outlook, we will continue to work on this in 2011/2012.<br />
The growth in adjusted EBIT underlines the improved earnings structure and increased earning power of our<br />
Group. This was offset by high impairment charges, in particular for the new steel mill in Brazil. The<br />
impairment charges totaled €2.9 billion, of which €2.1 billion at Steel Americas and €800 million at<br />
Stainless Global. As a result, reported EBIT was negative.<br />
General economic conditions<br />
Economic momentum slowed noticeably over the course of 2011. Global GDP growth of only 3.4% is<br />
expected in 2011, compared with 4.6% in 2010. The decline is attributable above all to the slowdown in the<br />
industrialized countries, while most emerging countries continue to show relatively solid expansion rates.<br />
Growth noticeably weaker in Europe and the USA<br />
In the euro zone GDP growth is expected to average 1.6% in 2011. While the pace of growth remained high<br />
at the beginning of the year as a result of strong business spending, it slowed sharply as the year<br />
progressed. The German economy showed appreciably stronger growth of 2.9% in 2011, mainly reflecting<br />
the good order situation in the industrial sector. However, consumer and business spending will have been<br />
impacted by the uncertainties on the financial markets in the latter part of the year.
2.2 Management report on on the Group Consolidated results of of operations<br />
BRIC stands for Brazil, Russia, India and<br />
China. India and China.<br />
In the USA the economy cooled noticeably. The continued difficult situation on the labor market, the still<br />
weak real estate sector, and the pressure to consolidate public-sector budgets impacted economic growth,<br />
which is expected to reach only 1.6% in 2011. Economic activity in Japan was severely depressed as a<br />
result of the natural disaster and its aftermath. Japan’s GDP is expected to contract by 0.5% in 2011.<br />
The BRIC countries mostly continued to record high growth in 2011. Although the global economic<br />
slowdown weighed on exports, Brazil and Russia are nevertheless expected to grow by 3.7%, India by 7.6%<br />
and China by 9.4% .<br />
Gross domestic product 2010, 2011*<br />
Real change versus previous year in %<br />
Euro zone<br />
Germany<br />
Russia<br />
Rest of Central/Eastern Europe<br />
USA<br />
Brazil<br />
Japan<br />
China<br />
India<br />
Middle East<br />
2010 2011 * Forecast<br />
World<br />
(0.5)<br />
1.7<br />
1.6<br />
1.6<br />
2.2<br />
9.4<br />
8.9<br />
Situation in the sectors mainly positive<br />
Flat carbon steel – After an exceptionally strong increase at the beginning of the year, growth in global<br />
steel demand slowed markedly. Nevertheless, world crude steel output is forecast to reach 1.5 billion tons<br />
for the first time in 2011, 7% more than in 2010. Above all China but also most of the other emerging<br />
nations significantly expanded their output and in some cases their exports. Steel production in the<br />
industrialized countries was likewise higher, with the main exception of Japan. With production levels high in<br />
the first nine months of 2011, the German steel industry expects production to be up year-on-year.<br />
In the first few months of 2011 the European flat carbon steel market was also robust. Demand from<br />
important customer groups increased. A strong cost-induced upward trend in prices stimulated demand for<br />
inventories. However, the momentum subsequently dropped sharply. The main reasons for this were<br />
uncertainty over the market outlook combined with the good supply situation and European steel producers’<br />
shorter delivery times. Order influx slowed, due in part to increased third-country imports. As a result, steel<br />
prices on the European spot markets slipped after reaching a two-year high in March/April 2011. The<br />
situation on the US market for flat carbon steel products was similar.<br />
2.9<br />
3.2<br />
3.0<br />
3.6<br />
4.0<br />
3.7<br />
3.7<br />
4.0<br />
3.4<br />
4.0<br />
4.6<br />
6.2<br />
7.5<br />
7.6<br />
10.3<br />
58
Management report on the Group<br />
2.2 Management report on the Group Consolidated results of operations<br />
58 | 59<br />
Flat stainless steel – Global demand for stainless steel flat products rose by an estimated 6% to<br />
17.5 million tons in 2011. The positive trend in orders reported by stainless producers in Europe in 2010<br />
continued in the first months of 2011. However, new orders were subsequently slowed by wide swings in<br />
raw material prices and growth in third-country imports. Base prices for stainless steel flat products in<br />
Germany, Europe and North America started rising in December 2010. At the same time, alloy surcharges<br />
increased as a result of higher nickel prices. From May 2011 highly volatile raw material prices resulted in<br />
falling alloy surcharges and eroding base prices. Chinese stainless steel prices also began falling in March,<br />
and in the final quarter base prices in North America likewise came under pressure. The markets for nickel<br />
alloys and titanium products improved further, with strong impetus from all customer groups and regions.<br />
Situation on important sales markets<br />
2010 2011*<br />
Demand for finished steel, million tons<br />
World 1,312 1,398<br />
Germany 36 39<br />
USA 80 89<br />
China<br />
Demand for stainless steel flat, '000 tons<br />
598 643<br />
World 16,536 17,506<br />
Germany 969 1,066<br />
USA 1,027 1,254<br />
China<br />
Vehicle production, million cars and light trucks<br />
6,162 6,438<br />
World 71.2 74.1<br />
Western Europe 14.5 15.0<br />
Germany 5.8 6.1<br />
USA 7.6 8.5<br />
Japan 9.2 7.4<br />
China 15.7 16.1<br />
Brazil<br />
Machinery production, real, in % versus prior year<br />
3.2 3.5<br />
Germany 9.4 15.0<br />
USA 9.5 13.0<br />
Japan 36.0 (2.0)<br />
China<br />
Construction output, real, in % versus prior year<br />
19.0 15.0<br />
Germany 0.2 3.6<br />
USA (6.7) 1.6<br />
China 17.4 10.4<br />
* Forecast
2.2 Management report on the Group Consolidated results of operations<br />
2.2 Management report on the Group Consolidated results of operations<br />
74 million vehicles are to to be produced<br />
worldwide in in 2011, up 4% from the year<br />
before before.<br />
Automotive – Global automotive production is expected to increase by 4% to more than 74 million cars and<br />
light trucks in 2011. In the USA, strong catch-up demand caused a sharp 11% rise in production. In China,<br />
government curbs restricted growth to just 3%. The other BRIC countries, however, are reporting high<br />
growth rates.<br />
According to current estimates Western Europe will produce 15.0 million cars and light trucks in 2011, 3%<br />
more than the year before. Most of this growth was attributable to auto manufacturers in Germany, whose<br />
production was up year-on-year by over 6% to 6.1 million units. They profited from growth in exports and<br />
higher new registrations. The market for heavy trucks in Germany was also positive.<br />
Machinery – In the machinery sector, rising capital spending virtually worldwide led to high growth rates in<br />
2011. Only in Japan is production expected to fall by 2% on account of the natural disaster and its<br />
aftermath. Production growth of 15% is forecast in China and 13% in the USA.<br />
The German machinery industry reported high order intake in 2011. Strong growth in domestic and foreign<br />
demand at the beginning of the year slowed slightly from the summer months. Overall a 15% rise in<br />
production is forecast for 2011. Capacity utilization is now back above the long-term average. The situation<br />
for the German plant engineering sector and for elevators and escalators also improved.<br />
Construction – The construction industry continued to show a very mixed regional picture in 2011.<br />
Emerging markets such as China, India and Brazil recorded higher growth. In the industrialized countries<br />
construction activity remained mainly weak. The situation on the US property market in particular remained<br />
difficult.<br />
The German construction industry was robust. Commercial and above all housing construction showed a<br />
positive trend; the situation in public-sector construction remained weaker. German construction output is<br />
expected to increase by 3.6% overall in 2011.<br />
Business performance in the Group<br />
ThyssenKrupp performed successfully in its operating business in the past fiscal year. Strong demand for<br />
our products and services led to an appreciable rise in orders and sales. In addition, our measures to<br />
improve our earnings structure took hold. Adjusted earnings before interest and taxes (adjusted EBIT)<br />
reached €1.8 billion – an increase of 42%.<br />
60
Management report on the Group<br />
2.2 Management report on the Group Consolidated results of operations<br />
Pages 49-51 49–51<br />
ThyssenKrupp in figures<br />
60 | 61<br />
2009/2010 2010/2011 Change in %<br />
Order intake million € 41,250 50,247 22<br />
Sales million € 42,621 49,092 15<br />
EBITDA million € 2,769 3,385 22<br />
EBIT million € 1,346 (988) – –<br />
EBIT margin % 3.2 (2.0) —<br />
Adjusted EBIT million € 1,241 1,762 42<br />
Adjusted EBIT margin % 2.9 3.6 —<br />
EBT million € 1,135 (1,578) – –<br />
Adjusted EBT million € 1,030 1,172 14<br />
Employees (Sept. 30) 177,346 180,050 2<br />
The corporate, organizational and contractual conditions for creating a separate Stainless Global were<br />
established effective September 30, 2011; the business area is therefore now shown as a discontinued<br />
operation. More details on this can be found in the section headed “Profile and strategy”.<br />
Strong rise in orders and sales<br />
Sales and in particular order intake increased steeply in 2010/2011. The Group’s order intake climbed yearon-year<br />
by 22% to €50.2 billion. All business areas contributed to this growth. Demand for carbon and<br />
stainless steel, automotive components and in naval shipbuilding was particularly strong. Based on<br />
continuing operations, order intake was 22% higher at €45.1 billion.<br />
Order intake by business area in million €<br />
2009/2010 2010/2011 Change in %<br />
Steel Europe 10,986 12,344 12<br />
Steel Americas 69 1,293 ++<br />
Materials Services 12,805 14,768 15<br />
Elevator Technology 5,099 5,281 4<br />
Plant Technology 3,859 4,475 16<br />
Components Technology 5,653 6,921 22<br />
Marine Systems 531 2,977 461<br />
Corporate 132 143 8<br />
Order intake of the business areas 39,134 48,202 23<br />
Consolidation (2,121) (3,084) —<br />
Order intake of continuing operations 37,013 45,118 22<br />
Stainless Global 5,121 6,045 18<br />
Consolidation (884) (916) —<br />
Group order intake 41,250 50,247 22
2.2 Management report on the Group Consolidated results of operations<br />
2.2 Management report on the Group Consolidated results of operations<br />
The Group’s Group’s sales increased by by 15%<br />
to €49 billion in 2010/2011.<br />
Pages 71-84 71–84<br />
The Group’s sales increased by 15% to €49.1 billion. Sales improved in all business areas and in some<br />
cases were significantly higher year-on-year. The main growth driver was business with materials and<br />
industrial components. Sales from continuing operations were 15% up from the comparable prior-year level<br />
at €43.4 billion.<br />
Sales by business area in million €<br />
2009/2010 2010/2011 Change in %<br />
Steel Europe 10,770 12,814 19<br />
Steel Americas 68 1,139 ++<br />
Materials Services 12,763 14,776 16<br />
Elevator Technology 5,188 5,253 1<br />
Plant Technology 3,931 4,004 2<br />
Components Technology 5,724 6,908 21<br />
Marine Systems 1,211 1,493 23<br />
Corporate 131 143 9<br />
Sales of the business areas 39,786 46,530 17<br />
Consolidation (2,075) (3,174) —<br />
Sales of continuing operations 37,711 43,356 15<br />
Stainless Global 5,901 6,739 14<br />
Consolidation (991) (1,003) —<br />
Group sales 42,621 49,092 15<br />
EBIT negative due to high impairment charges<br />
ThyssenKrupp achieved earnings before interest and taxes (EBIT) of €(988) million in 2010/2011, compared<br />
with €1,346 million the year before. This decrease was due to the €(1,071) million adjusted EBIT of the new<br />
steel plants of Steel Americas in Brazil and the USA, and to necessary impairment charges above all in the<br />
Steel Americas and Stainless Global business areas. More information on this is provided in the section<br />
“Results of operations of the business areas”.<br />
With the exception of Steel Americas and Stainless Global all business areas made positive income<br />
contributions. However, the EBIT of the other business areas of the Materials division (Steel Europe and<br />
Materials Services) could not offset the losses of Steel Americas and Stainless Global, so overall Materials<br />
generated negative EBIT of €2,319 million. In the Technologies division (Elevator Technology, Plant<br />
Technology, Components Technology, Marine Systems) EBIT came to €2,063 million. This was partly offset<br />
by Corporate costs and consolidation effects of €732 million. The Group’s EBIT margin fell from 3.2% the<br />
year before to (2.0)%.<br />
Based on continuing operations, EBIT deteriorated by €1,586 million to €(188) million, and EBIT margin<br />
from 3.7% to (0.4)%.<br />
62
Management report on the Group<br />
2.2 Management report on the Group Consolidated results of operations<br />
EBIT for the reporting year contains special<br />
items special of items €2,751 of million. €2,751 million.<br />
EBIT by business area in million €<br />
62 | 63<br />
2009/2010 2010/2011 Change<br />
Steel Europe 731 1,133 55<br />
Steel Americas (600) (3,145) – –<br />
Materials Services 463 478 3<br />
Elevator Technology 646 801 24<br />
Plant Technology 401 506 26<br />
Components Technology 252 543 115<br />
Marine Systems 145 213 47<br />
Corporate (291) (377) (30)<br />
EBIT of the business areas 1,747 152 (91)<br />
Consolidation (349) (340) —<br />
EBIT of continuing operations 1,398 (188) – –<br />
Stainless Global (57) (785) – –<br />
Consolidation 5 (15) —<br />
Group EBIT 1,346 (988) – –<br />
Adjusted EBIT up 42% to €1,762 million<br />
EBIT for the reporting year contains special items of €2,751 million. Adjusted EBIT therefore came to €1,762<br />
million compared with €1,241 million in the prior year. Adjusted EBIT from continuing operations was €469<br />
million higher at €1,762 million.<br />
An impairment test at Steel Americas resulted in an impairment charge of €2,075 million, mainly for<br />
property, plant and equipment and construction in progress, and to a lesser extent transfer taxes and<br />
inventories. Materials Services incurred disposal losses of €55 million from the sale of the Xervon group,<br />
while the prior-year earnings contained an €81 million disposal gain from the sale of the Industrial Services<br />
companies. Elevator Technology recognized positive special items of €160 million in the reporting year from<br />
the partial refund of a fine imposed by the EU Commission in 2007. Components Technology reopened the<br />
temporarily idled Etowah plant in Tennessee, USA in response to the good order situation; this resulted in an<br />
impairment reversal of €40 million. Corporate recognized a provision for litigation risks of €21 million in<br />
connection with arbitration court proceedings concerning a disposal carried out several years earlier. At<br />
Stainless Global the annual goodwill impairment test resulted in an impairment loss of €290 million. In<br />
connection with the planned carve-out of Stainless Global, a fair value adjustment of €510 million also<br />
became necessary.
2.2 Management report on the Group Consolidated results of operations<br />
2.2 Management report on the Group Consolidated results of operations<br />
Pages 54-56 54–56<br />
Adjusted EBIT in million €<br />
2009/2010 2010/2011 Change<br />
EBIT 1,346 (988) – –<br />
+/- Disposal losses/gains (212) 76 —<br />
+ Restructuring expense 46 0 —<br />
+ Impairment 3 2,834 —<br />
+ Other non-operating expense 58 0 —<br />
- Other non-operating income 0 (160) —<br />
Adjusted EBIT 1,241 1,762 42<br />
At the beginning of fiscal year 2010/2011 we switched our performance indicator from EBT to EBIT. More<br />
information is provided in the section “Value-based management”.<br />
Components of Group earnings<br />
At €43,356 million, net sales from continuing operations in 2010/2011 were up year-on-year by<br />
€5,645 million or 15%. The cost of sales increased at a faster rate by €6,968 million or 22%. The main<br />
causes, apart from higher materials expense due to the start of production of the new steel plants, the<br />
increase in business and raw material price rises, were the impairment charges on property, plant and<br />
equipment recorded at Steel Americas (€1,602 million), and write-downs of transfer taxes and inventories.<br />
Gross profit from continuing operations deteriorated as a result by 22% to €4,740 million, combined with a<br />
drop in gross margin from 16% to 11%.<br />
The €236 million increase in selling expenses was mainly caused by increased expenses for sales-related<br />
freight and insurance charges as well as the impairment charges affecting property, plant and equipment at<br />
the steel mill in Brazil. The €27 million rise in general and administrative expenses from continuing<br />
operations mainly reflects impairment charges on property, plant and equipment of Steel Americas.<br />
Other operating income from continuing operations increased by €105 million; this included €160 million<br />
from the partial refund of a fine imposed by the EU Commission in 2007 for antitrust infringements. The<br />
€106 million decrease in other operating expenses from continuing operations was attributable in particular<br />
to reduced expenses from provisions.<br />
The €250 million decrease in income from the disposal of consolidated companies attributable to continuing<br />
operations was mainly due to the absence of income from the disposal of ThyssenKrupp Industrieservice<br />
and ThyssenKrupp Safway contained in the prior year.<br />
The €331 million deterioration in financial income from continuing operations was mainly due to the<br />
€282 million reduced capitalization of borrowing costs with the progressive completion of the major projects<br />
in Brazil and the USA.<br />
With tax expense from continuing operations of €203 million in fiscal year 2010/2011, the effective tax<br />
charge of (27)% was mainly due to valuation allowances for deferred income taxes.<br />
64
Management report on the Group<br />
2.2 Management report on the Group Consolidated results of operations<br />
The HGB unappropriated income of of<br />
ThyssenKrupp AG is is the legal basis<br />
for the dividend.<br />
64 | 65<br />
After taking into account income taxes, the loss from continuing operations for the 2010/2011 fiscal year<br />
was €954 million, a deterioration of €1,974 million from the prior year.<br />
Including the after-tax loss of €829 million from the discontinued operations of the Stainless Global business<br />
area, the net loss for the reporting period was €1,783 million; in the prior year net income of €927 million<br />
was achieved.<br />
A net loss of €492 million was attributable to non-controlling interest, compared with a net profit of<br />
€103 million in the prior year. The deterioration of €595 million was mainly due to the negative earnings<br />
of ThyssenKrupp CSA.<br />
Related to the net income attributable to ThyssenKrupp AG shareholders, earnings per share decreased by<br />
€4.48 to €(2.71). Based on income from continuing operations, earnings per share deteriorated to €(0.97),<br />
down €2.94 from the year before.<br />
Unappropriated net income of ThyssenKrupp AG €517 million<br />
The dividend payment is based on the HGB unappropriated net income of ThyssenKrupp AG of €517 million;<br />
in the prior year it was €415 million. It comprises the HGB net income of ThyssenKrupp AG of €494 million<br />
(prior year €800 million) plus the income carried forward from the prior year of €23 million (prior year<br />
€15 million).<br />
The Executive Board and Supervisory Board propose to the Annual General Meeting the payment of a<br />
dividend of €0.45 (prior year €0.45) per share and the carryforward of the balance of €285 million.<br />
Therefore, of the €517 million unappropriated net income, a total of €232 million will be distributed to the<br />
shareholders. As the Company held no treasury shares at September 30, 2011, 514,489,044 shares are<br />
eligible for dividend payments. Should the Company hold treasury shares not eligible for dividend payment<br />
at the time of the Annual General Meeting, the proposal for the appropriation of net income will be adjusted<br />
accordingly.<br />
Number of employees increased<br />
In the wake of the improved business situation, the number of employees increased further. On<br />
September 30, 2011 the Group employed 180,050 people worldwide, 2,704 or 1.5% more than a year<br />
earlier. However, the headcount in Germany decreased by 1,950 or 2.7% to 69,122, which represents<br />
38.4% of the total workforce. By contrast, the number of employees outside Germany grew significantly – by<br />
4,654 or 4.4% to 110,928.
2.2 Management report on the Group Consolidated results of operations<br />
2.2 Management report on the Group Consolidated results of operations<br />
In the reporting reporting year the Americas<br />
accounted for 21% of of sales, and rising.<br />
Employees by region in %<br />
On September 30, 2011<br />
Germany<br />
Other EU<br />
The number of employees at continuing operations at September 30, 2011 was up by 2,449 or 1.5% to<br />
168,560. A large number of new jobs were created in the new steel making and processing plants in Brazil<br />
and the USA. The Materials Services, Elevator Technology and Components Technology business areas also<br />
recruited new employees, Steel Europe and Marine Systems reduced their workforces, mainly on account of<br />
restructuring measures and disposals.<br />
Sales markets and marketing<br />
The EU region remained the main sales market for ThyssenKrupp in 2010/2011 with a share of 62% of<br />
sales, of which more than half related to Germany (33 percentage points) and the other EU countries (29<br />
percentage points). Our customers in the Americas accounted for 21% of sales, with the USA our most<br />
important sales market there. While the Asia/Pacific region still accounted for a relatively low sales share of<br />
11%, its importance grows from year to year.<br />
Sales by region in million €<br />
18<br />
38<br />
2006/2007 2007/2008 2008/2009 2009/2010 2010/2011<br />
66<br />
Other countries<br />
Asia/Pacific<br />
Americas<br />
Change<br />
in %<br />
Germany 18,545 19,161 13,031 13,933 16,153 16<br />
Other EU 16,198 16,677 12,142 12,485 14,272 14<br />
Americas 10,218 9,706 7,858 8,266 10,476 27<br />
Asia/Pacific 4,146 4,852 4,341 5,013 5,618 12<br />
Other countries 2,616 3,030 3,191 2,924 2,573 (12)<br />
Total 51,723 53,426 40,563 42,621 49,092 15<br />
Marketing for international customers<br />
We sell most of our materials and technology products to industry. This is also reflected in our marketing. To<br />
meet the specific requirements of these customers, we provide intensive communications, technical<br />
information and individual advice. On our markets we aim to achieve quality leadership, and this involves a<br />
strong focus on services. The Group’s standard corporate design makes clear that our operating Group<br />
companies belong to ThyssenKrupp. However, in terms of marketing they operate independently within the<br />
Group strategy so that they can respond quickly to market changes and new customer requirements.<br />
26<br />
4<br />
14
Management report on the Group<br />
2.2 Management report on the Group Consolidated results of operations<br />
Sales by customer group in %<br />
2010/2011<br />
Procurement of raw materials and energy<br />
Materials expense by business area in million €<br />
2009/2010 2010/2011<br />
66 | 67<br />
Automotive 24 1<br />
Transit<br />
Energy and utilities<br />
Steel and related processing<br />
Packaging<br />
Trading<br />
18<br />
3<br />
3<br />
14<br />
67<br />
Construction<br />
Public sector<br />
Other customers<br />
<strong>Engineering</strong><br />
Change<br />
in %<br />
Steel Europe 6,811 8,532 25<br />
Steel Americas 116 1,009 770<br />
Materials Services 10,101 11,889 18<br />
Elevator Technology 1,687 1,688 0<br />
Plant Technology 2,396 2,344 (2)<br />
Components Technology 3,437 4,264 24<br />
Marine Systems 602 735 22<br />
Corporate 56 57 2<br />
Materials expense of business areas 25,206 30,518 21<br />
Consolidation (2,987) (3,150) —<br />
Materials expense of continuing operations 22,219 27,368 23<br />
Stainless Global 4,894 5,587 14<br />
Consolidation 0 (990) —<br />
Materials expense of Group 27,113 31,965 18<br />
With the increase in sales, materials expense also rose year-on-year by 18% to €32.0 billion. At the same<br />
time it increased as a percentage of sales by 1 percentage point to 65%. The chart below shows how this<br />
share varies in the individual business areas. In cooperation with the Group companies, our global<br />
purchasing again ensured that the supply of materials for our plants was secured without delivery<br />
bottlenecks in the reporting year. Despite higher raw material prices we were able to achieve sustainable<br />
savings.<br />
11<br />
10<br />
4<br />
12
2.2 Management report on the Group Consolidated results of operations<br />
2.2 Management report on the Group Consolidated results of operations<br />
Iron ore prices<br />
Spot prices, 62% FE, CFR China<br />
in US dollars, indexed, October 2008 = 100<br />
250<br />
200<br />
150<br />
100<br />
50<br />
FY<br />
2008/09<br />
FY<br />
2009/10<br />
FY<br />
2010/11<br />
Materials expense of business areas<br />
as % of sales<br />
Steel Europe<br />
Steel Americas<br />
Materials Services<br />
Elevator Technology<br />
Plant Technology<br />
Components Technology<br />
Marine Systems<br />
Stainless Global<br />
Electronic purchasing systems make our purchasing more efficient. In the reporting year we handled over<br />
10,000 requests for quotes on our e-procurement platform. Our catalogue ordering system is also<br />
successful at optimizing process costs: Almost 7,500 users worldwide have access to over 5.45 million<br />
articles. With our supplier management system we carried out 1,200 supplier projects worldwide.<br />
Demand for raw materials at record level<br />
In the reporting year ThyssenKrupp purchased approx. 20 million tons of iron ore. The main supplier country<br />
continued to be Brazil, followed by Canada and South Africa. High global demand and delivery delays<br />
caused by heavy tropical rainfall led to a steep rise in average spot market prices for ore fines (CFR China)<br />
up to spring 2011, which also pushed up quarterly prices. As the fiscal year progressed the situation eased<br />
little as ore demand remained high. Year-on-year the average spot market price was 32% higher.<br />
The price of coking coal also increased. High imports into China and supply interruptions after Australian<br />
coal mines were hit by floods resulted in significant prices increases on the global market. This also affected<br />
our coal purchases. Prices for coke from China were also higher.<br />
The recovery of the steel markets increased international demand for steel scrap, which pushed up prices.<br />
At €340 per ton, the average market price of grade 2 scrap was around 33% higher year-on-year.<br />
Reduced price swings for most alloying metals<br />
Intensive global demand caused a further increase in procurement prices for alloying metals in the reporting<br />
year. As the economy slowed in the 2nd half of the fiscal year corrections were made in some areas. Prices<br />
moved within a narrower range than in previous years.<br />
32<br />
49<br />
59<br />
62<br />
67<br />
75<br />
80<br />
83<br />
68
Management report on the Group<br />
2.2 Management report on the Group Consolidated results of operations<br />
Nickel prices<br />
London Metal Exchange<br />
in 1,000 US dollars/metric ton<br />
30<br />
25<br />
20<br />
15<br />
10<br />
Oct<br />
2009<br />
Sept<br />
2011<br />
Capesize ships are too large for for the the Suez<br />
and Panama Canals and therefore have to to<br />
sail round Cape Horn and the the Cape of of Good<br />
Hope. Good Hope.<br />
68 | 69<br />
For our Stainless Global business area the alloying metals nickel, ferrochromium and ferromolybdenum are<br />
of foremost importance – as primary raw materials and as components of stainless steel scrap. The monthly<br />
average price of nickel on the London Metal Exchange was between 20,392 and 28,252 US dollars per ton.<br />
For ferrochromium from South Africa the quarterly price increased initially to 1.35 US dollars per pound<br />
(around 0.45 kg) before slipping to 1.20 US dollars. Quarterly prices for ferromolybdenum fluctuated<br />
between 36.57 and 43.45 US dollars per kilogram.<br />
The price of zinc – used to coat carbon steel – fluctuated enormously and averaged around 2,400 US dollars<br />
per ton, 7% above the prior-year average.<br />
Prices for manufactured products mirror raw material prices<br />
For manufactured products strongly dependent on raw material prices – e.g. steel components for<br />
machinery – the prior-year trend with in some cases steeply climbing prices continued. This effect was<br />
particularly drastic for products containing rare earths, for example permanent magnets in drives and<br />
electric motors used in the elevator industry.<br />
The materials market moved in short-term cycles. After coming under considerable pressure at the<br />
beginning of the fiscal year, prices rose sharply up to the middle of the year and subsequently softened<br />
slightly. The main factors behind this trend were raw material costs and the euro/US dollar exchange-rate<br />
effect, which at times benefited imports from Asia. In this situation our trading operators made short-term<br />
arrangements and consolidated and optimized purchasing volumes in some cases on a cross-country basis.<br />
The plant construction procurement markets stabilized considerably. As many of our suppliers had a full<br />
workload, delivery times increased but supplies remained secure. There was only a slight increase in prices<br />
for capital goods.<br />
Rise in freight costs halted<br />
For the maritime transport of bulk goods, increased cargo space became available. This was particularly<br />
true of capesize ships, the bulk carriers generally used for the shipment of iron ore and coal. For container<br />
shipments, too, more than enough ships were available. This halted the rise in freight rates and in some<br />
cases led to reductions. However shipment times increased, with ships often reducing speed to save fuel.<br />
Road haulage freight space in Germany remained tight due to the absence of capacities taken out in the<br />
crisis. Freight rates were therefore higher in particular for shipments at short notice. Rail capacities were in<br />
similarly short supply.
2.2 Management report on the Group Consolidated results of operations<br />
2.2 Management report on the Group Consolidated results of operations<br />
Natural gas prices<br />
ThyssenKrupp in Germany<br />
Bochum off-take point<br />
in €, indexed, October 2009 = 100<br />
160<br />
140<br />
120<br />
100<br />
80<br />
Oct<br />
2009<br />
Sept<br />
2011<br />
The emission allowances allocated to to<br />
ThyssenKrupp in in calendar year 2010 were<br />
were enough.<br />
enough.<br />
Natural gas prices in Germany higher<br />
In Germany the price paid by ThyssenKrupp for natural gas increased by 25% year-on-year because under<br />
the applicable contracts it is pegged to the price of oil. For the following two fiscal years we have secured<br />
prices on attractive terms – in particular in comparison with prices on the futures market.<br />
The situation at our operations abroad is positive, with previously agreed fixed price contracts permitting<br />
significant savings against the current market price. In France our companies use liquid trading points in the<br />
Netherlands to achieve considerably improved terms and conditions. In Spain a new natural gas contract<br />
entered into effect in the 4th quarter 2010/2011 with prices 8% below the already favorable level of the<br />
previous contract. In the USA natural gas prices are far lower than in Europe. The development of previously<br />
unprofitable gas reserves created a surplus which cannot be sold on the global market for technical reasons.<br />
The price of natural gas for our new plant complex in Alabama is therefore well below half that paid by<br />
similar plants in Germany.<br />
Energy transition increases electricity costs in Germany<br />
Due to our increased output we had to purchase extra electricity at short notice in 2010/2011. We<br />
succeeded in reducing our average price in Germany even though electricity prices increased in the wake of<br />
the economic recovery. On the futures market, too, prices have advanced considerably since the nuclear exit<br />
began. Electricity prices in Germany are at the top end of the European scale – driven by politically imposed<br />
costs such as the levy to subsidize renewable energies, an electricity tax increase, the subsidization of heatand-power<br />
cogeneration, and rising network charges.<br />
The situation in France is different: Here the government-regulated industrial electricity tariff expired at the<br />
end of June 2011 and was replaced with a new instrument. By using this we saved over €1 million in the<br />
4th quarter of the reporting year alone. In Italy we were able to keep electricity costs below the local price<br />
level by purchasing some volumes at more favorable foreign wholesale terms.<br />
Emissions trading: Hedge for third trading period<br />
In accordance with the legal rules, ThyssenKrupp received emission allowances for 21,263,403 tons of CO2<br />
in calendar year 2010. As actual emissions were 21,246,047 tons, the allocated emission allowances were<br />
enough. We have already purchased EU emission allowances at attractive market prices as a hedge for the<br />
third trading period (2013-2020).<br />
70
Management report on the Group<br />
2.3 2.3 Management Management report on on on the Group Results of of operations of operations of of the of the the business areas<br />
areas<br />
Results of operations<br />
of the business areas<br />
The Group’s operations are organized in eight business areas. As at<br />
September 30, 2011 Stainless Global is classified as a discontinued<br />
operation. All business areas contributed to the rise in orders and<br />
sales in the reporting year, and apart from Steel Americas all<br />
continuing operations generated a positive EBIT contribution.<br />
Steel Steel Europe’s Europe’s sales sales increased increased by by by 19% 19% to to to<br />
almost almost €13 €13 billion billion in in in 2010/2011.<br />
2010/2011.<br />
Steel Europe<br />
Steel Europe in in figures<br />
70 71 | 71<br />
2009/2010 2010/2011 Change in in %<br />
Order intake million € € 10,986 12,344 12 12<br />
Sales million € € 10,770 12,814 19 19<br />
EBIT million € € 731 1,133 55 55<br />
EBIT margin % 6.8 8.8 —<br />
Adjusted EBIT million € € 731 1,133 55 55<br />
Adjusted EBIT margin % 6.8 8.8 —<br />
Employees (Sept. 30) 34,711 28,843 (17)<br />
The Steel Europe business area combines the Group’s flat carbon steel activities, mainly in in the European<br />
market. Its Its high-quality flat products are supplied to to customers in in the auto industry and other steel-using<br />
sectors. The range also includes products for attractive specialist markets such as as the packaging industry.<br />
Higher volumes and selling prices<br />
Steel Europe profited from a robust steel market over large parts of of 2010/2011. Order volumes at at<br />
12.5 million tons were 2% up from the already high prior-year level. However the extremely strong demand<br />
in in the 1st half of of the reporting year weakened from the spring, partly due to to the stock cycle. With prices<br />
higher due to to increased costs, the value of of orders received rose by by 12% to to €12.3 billion.<br />
Sales of of the business area increased by by 19% to to €12.8 billion. Shipments were 8% higher than the prior year<br />
at at 13.0 million tons, and selling prices were increased step by by step as as further rises in in raw material costs<br />
were passed through to to customers with a time lag. Thanks to to strong auto sector activity, shipments to to<br />
automotive customers expanded significantly. Prices under new contracts were adapted in in line with raw<br />
material costs. The business area likewise achieved higher volumes and prices with a large portion of of other<br />
industrial customers and steel service centers. Sales of of medium-wide strip, heavy plate and tailored blanks<br />
also grew strongly. Sales of of tinplate also increased. This was due to to higher selling prices; shipments have<br />
deteriorated recently. Selling prices for oriented electrical steel came under considerable pressure, but<br />
business in in non-oriented electrical steel was more positive.
2.3 Management report on on the Group Results of of operations of of the the business areas areas<br />
First slabs from the Brazilian steel mill mill<br />
supplemented production in in Duisburg.<br />
Steel Europe order intake Steel Europe EBIT<br />
in million €, quarter on quarter rate of change in million €, quarter on quarter rate of change<br />
Q1 2,500 Q1<br />
Q2 + 20% 2,999 Q2<br />
Q3 (10)% 2,706 Q3<br />
Q4 + 3% 2,781 Q4<br />
2009/2010<br />
2009/2010<br />
Q1 + 5% 2,929 Q1<br />
Q2 + 27% 3,721 Q2<br />
Q3 (19)% 3,006 Q3<br />
Q4 (11)% 2,688 Q4<br />
2010/2011<br />
2010/2011<br />
Good capacity utilization<br />
Steel Europe’s crude steel production including the share in investee company Hüttenwerke Krupp<br />
Mannesmann reached 13.2 million tons, level with the prior year. In addition, the new Brazilian mill of Steel<br />
Americas began supplying slabs to Germany from December 2010. Including contract rolling, we increased<br />
rolled steel production for customers by 4% to 14.1 million tons.<br />
The capacities of the core units were fully utilized up to mid-year 2011. The market slowdown due mainly to<br />
the inventory cycle led to lower operating levels in the steelmaking and hot rolling operations in the final<br />
fiscal quarter.<br />
Strong increase in EBIT<br />
The business area again significantly improved its earnings before interest and taxes (EBIT) in 2010/2011.<br />
Overall, EBIT rose from €731 million to €1,133 million. EBIT margin reached 8.8% compared with 6.8% in<br />
the prior year. Higher raw material costs were offset by positive price and volume effects. The ongoing<br />
programs to increase efficiency and reduce costs also contributed to the improved earnings.<br />
+ 52%<br />
+ 13%<br />
(11)%<br />
+ 34%<br />
+ 16%<br />
+ 7%<br />
(21)%<br />
72<br />
127<br />
193<br />
218<br />
193<br />
258<br />
300<br />
322<br />
253
Management report on the Group<br />
2.3 Management report on the Group Results of operations of the business areas<br />
Steel Americas Americas has started up up almost<br />
all its facilities.<br />
Steel Americas<br />
Steel Americas in figures<br />
72 | 73<br />
2009/2010 2010/2011 Change in %<br />
Order intake million € 69 1,293 ++<br />
Sales million € 68 1,139 ++<br />
EBIT million € (600) (3,145) – –<br />
EBIT margin % — — —<br />
Adjusted EBIT million € (600) (1,071) (79)<br />
Adjusted EBIT margin % — — —<br />
Employees (Sept. 30) 3,319 4,060 22<br />
With its steelmaking and processing plants in Brazil and the USA the Steel Americas business area is<br />
tapping into the North American market for premium flat steel products.<br />
Steel Americas order intake Steel Americas EBIT<br />
in million €, quarter on quarter rate of change in million €, quarter on quarter rate of change<br />
Q1 0 Q1<br />
Q2 —<br />
23 Q2<br />
Q3 + 4 % 24 Q3<br />
Q4 (8)% 22 Q4<br />
2009/2010<br />
Q1 + 282 % 84 Q1<br />
Q2 + 219 % 268 Q2<br />
Q3 + 88 % 504 Q3<br />
Q4 (13)% 437 Q4<br />
2010/2011<br />
2009/2010<br />
2010/2011<br />
(71)<br />
(79)<br />
(130)<br />
(320)<br />
(378)<br />
(319)<br />
(190)<br />
Operations begun<br />
The Steel Americas business area ramped up its plants and began operations in the past fiscal year. Almost<br />
all of the facilities are in operation. As the ramp-up progressed we continuously expanded and optimized the<br />
spectrum of premium flat steel products. The quality of our premium steel grades is meeting with a strong<br />
response from our North American customers. The customer base currently mainly comprises steel service<br />
centers, the appliance industry and the tube sector.<br />
Due to the ramp-up of production, orders and sales increased strongly in the course of 2010/2011. Order<br />
intake reached €1,293 million, sales €1,139 million. In total, 1.2 million tons of flat steel were sold on the<br />
North American market and first sales of hot dip galvanized sheet were also made.<br />
(11)%<br />
(65)%<br />
– –<br />
(18)%<br />
+ 16 %<br />
+ 40 %<br />
– –<br />
(2,258)
2.3 Management report on on the Group Results of of operations of of the the business areas areas<br />
The processing plant in in Alabama will will<br />
have an annual hot-rolled capacity of of<br />
over 5 million tons.<br />
Adjusted EBIT negative but lower quarter by quarter<br />
Adjusted EBIT came to €(1,071) million. This was mainly due to startup costs from the completion of the<br />
projects, the ramp-up of the facilities and the entry into the NAFTA market. In addition there were higher<br />
expenses for dealing with operating disruptions at the Brazilian steel mill, which mainly affected the coke<br />
plant. Increased raw material prices likewise impacted earnings.<br />
EBIT impacted by high impairment charges<br />
The persistent, higher-than-expected startup losses gave us cause to test the assets of Steel Americas for<br />
impairment. This test showed that impairment charges of €2,075 million had to be recorded. They mainly<br />
related to property, plant and equipment and construction in progress, and to a lesser extent to transfer<br />
taxes and inventories. The impairment charges amounted to roughly 25% of the relevant carrying amounts.<br />
This resulted in an income tax reduction of €233 million.<br />
The main reasons for the impairment charges were cost overruns in the construction of the mill in Brazil,<br />
which resulted in higher acquisition costs, and the delayed ramp-up, which led to significant and persistent<br />
startup losses. On top of this came the current and expected near-term relative strength of the Brazilian<br />
currency, which is weighing on the competitiveness of the Brazilian mill. In addition, the continued weakness<br />
of the sales markets in the USA and Europe had an effect, hampering market entry for Steel Americas’<br />
products. The increase in the weighted average cost of capital also had an impact.<br />
Steel mill in Brazil<br />
The new integrated iron and steel mill near Rio de Janeiro produced around 2.8 million tons of slabs for the<br />
US processing plant and Steel Europe in 2010/2011. The second blast furnace was fired up successfully;<br />
however, work on the coke plant is progressing with delays. The final coke oven battery is scheduled to go<br />
into operation in spring 2012. Total crude steel capacity is more than 5 million tons a year.<br />
In December 2010 the dumping of hot metal resulted in graphite dust emissions. We took measures to<br />
reduce the escape of free graphites into the air and capture them as far as possible. At no time was there<br />
any danger to the health of employees or residents. All emissions since the startup of the new steel mill<br />
have been well below the limits set by the Brazilian environmental authorities.<br />
During the ramp-up the mill is operating initially under a provisional license. Following the ramp-up we are<br />
confident of meeting all statutory requirements and obtaining a permanent operating license.<br />
Processing plant in the USA<br />
After a three-year construction period the new processing plant of Steel Americas in Calvert, Alabama, was<br />
officially opened on December 10, 2010. It will have a total hot-rolled capacity of over 5 million tons per<br />
year. Construction work for the hot and cold rolling mills was completed with the startup of the pickling line<br />
in November 2010. Three of the four hot dip galvanizing lines were also put into operation in the reporting<br />
year; the fourth and final line is expected to follow at the beginning of 2012.<br />
74
Management report on the Group<br />
2.3 Management report on the Group Results of operations of the business areas<br />
Materials Services<br />
Materials Services in figures<br />
74 | 75<br />
2009/2010 2010/2011 Change in %<br />
Order intake million € 12,805 14,768 15<br />
Sales million € 12,763 14,776 16<br />
EBIT million € 463 478 3<br />
EBIT margin % 3.6 3.2 —<br />
Adjusted EBIT million € 382 533 40<br />
Adjusted EBIT margin % 3.0 3.6 —<br />
Employees (Sept. 30) 33,856 36,568 8<br />
With 500 locations in over 40 countries the Materials Services business area specializes in materials<br />
distribution including technical services.<br />
Generally high demand – significant sales growth<br />
Materials Services increased its order intake by 15% to €14.8 billion in 2010/2011. Sales came to<br />
€14.8 billion, an increase of €2.0 billion or 16% from the prior year.<br />
Materials Services order intake Materials Services EBIT<br />
in million €, quarter on quarter rate of change in million €, quarter on quarter rate of change<br />
Q1 2,681 Q1<br />
Q2 + 14% 3,059 Q2<br />
Q3 + 21% 3,695 Q3<br />
Q4 (9)% 3,370 Q4<br />
2009/2010<br />
2009/2010<br />
Q1 (3)% 3,259 Q1<br />
Q2 + 20% 3,918 Q2<br />
Q3 + 1% 3,973 Q3<br />
Q4 (9)% 3,618 Q4<br />
2010/2011<br />
2010/2011<br />
The The metals metals warehousing and service service business in particular showed significant significant growth. Shipments increased<br />
year-on-year by by 18% to 5.6 million tons, reflecting high demand from from the engineering, automotive and other<br />
manufacturing sectors. This was true of Germany, Eastern Europe and several Western European countries,<br />
whereas demand in the countries of Southern Europe was much more subdued. The construction industry<br />
provided hardly hardly any stimulus. In North America the nonferrous metals business in particular particular profited from from<br />
the economic recovery. Despite Despite generally good demand, prices and margins came came under increasing<br />
pressure from from the the start of the the 2nd fiscal half.<br />
(47)%<br />
+ 132%<br />
(32)%<br />
(21)%<br />
+ 92%<br />
(9)%<br />
(46)%<br />
129<br />
68<br />
158<br />
108<br />
85<br />
163<br />
149<br />
81
2.3 Management report on on the Group Results of of operations of of the the business areas areas<br />
Materials Services achieved EBIT of of €478<br />
million, €478 million, an improvement an improvement on the on good the<br />
prior-year good prior-year figure.<br />
figure.<br />
Sales to the aerospace industry remained pleasing, but international direct-to-customer and project sales<br />
were again characterized by very slow demand, extremely fierce competition and numerous order deferrals.<br />
Raw materials sales of alloys, metals and coke/coal showed a mixed picture. Whereas the alloy business<br />
was largely steady, shipments and sales of metals decreased significantly. Demand and prices for coke and<br />
minerals were at a very high level over large parts of the fiscal year. Further large orders and new projects<br />
had a favorable impact on our steel mill services in Brazil, and capacity utilization in Germany was also<br />
significantly better than a year earlier.<br />
Adjusted EBIT improved by 40%<br />
The economic recovery and sustainable cost reductions in almost all areas are reflected in the business<br />
area’s earnings. Materials Services achieved EBIT of €478 million in 2010/2011, compared with<br />
€463 million in the prior year.<br />
Whereas the prior-year earnings included disposal gains of €81 million from the sale of the Industrial<br />
Services companies, the sale of the Xervon group led to disposal losses of €55 million in the reporting year.<br />
Adjusted EBIT improved significantly from €382 million by €151 million or 40% to €533 million; the adjusted<br />
EBIT margin increased from 3.0% to 3.6%.<br />
Elevator Technology<br />
Elevator Technology in figures<br />
2009/2010 2010/2011 Change in %<br />
Order intake million € 5,099 5,281 4<br />
Sales million € 5,188 5,253 1<br />
EBIT million € 646 801 24<br />
EBIT margin % 12.4 15.2 —<br />
Adjusted EBIT million € 646 641 (1)<br />
Adjusted EBIT margin % 12.4 12.2 —<br />
Employees (Sept. 30) 44,024 46,243 5<br />
The Elevator Technology business area supplies passenger and freight elevators, escalators and moving<br />
walks, passenger boarding bridges, stair and platform lifts as well as service for the entire product range.<br />
Over 900 locations worldwide form a tight-knit sales and service network that keeps us close to customers.<br />
Order intake and sales at high levels<br />
Elevator Technology stood up well in 2010/2011 and continued its positive performance. Compared with the<br />
prior year we improved order intake by 4% to €5.3 billion and sales by 1% to likewise €5.3 billion.<br />
76
Management report on the Group<br />
2.3 Management report on the Group Results of operations of the business areas<br />
China’s first TWIN elevators will transport<br />
hotel guests faster in in Dalian.<br />
Elevator Technology order intake Elevator Technology EBIT<br />
in million €, quarter on quarter rate of change in million €, quarter on quarter rate of change<br />
Q1 1,230 Q1<br />
Q2 (1)% 1,215 Q2<br />
Q3 + 14% 1,390 Q3<br />
Q4 (9)% 1,264 Q4<br />
2009/2010<br />
2009/2010<br />
Q1 + 3% 1,306 Q1<br />
Q2 + 4% 1,358 Q2<br />
Q3 (3)% 1,320 Q3<br />
Q4 (2)% 1,297 Q4<br />
2010/2011<br />
2010/2011<br />
76 | 77<br />
The upward trend in elevators was felt in both the new installation and service businesses. Pleasing growth<br />
was achieved in the Asian region in particular. The main growth driver in China was the new installation<br />
business, which profited from numerous new infrastructure projects. The Indian and Brazilian markets also<br />
continued to grow at a strong pace, while volumes in North America improved only slightly under the<br />
influence of the general economic situation in the USA. The European operations were steady. Demand for<br />
new installations in the Iberian peninsula was weaker. Through market-oriented measures we further<br />
increased service volumes and the number of maintenance units under contract in all important regions.<br />
Order volumes for escalators and passenger boarding bridges were significantly higher; both businesses<br />
recorded increasing demand, particularly from Asia, mainly due to dynamic growth in China. Orders for stair<br />
lifts and home elevators were unchanged from the prior year.<br />
Slight fall in earnings<br />
The business area generated EBIT of €801 million. The figure includes special items of €160 million<br />
because a fine imposed by the EU Commission in 2007 for anticompetitive practices was paid back in part.<br />
Excluding this special item, adjusted EBIT came to €641 million, and was therefore steady year-on-year. We<br />
achieved improved earnings above all in Brazil and Asia. EBIT margin rose from 12.4% to 15.2%; adjusted<br />
for the special item it came to 12.2%, compared with 12.4% in the prior year.<br />
(1)%<br />
(1)%<br />
(4)%<br />
+ 10%<br />
(14)%<br />
+ 3%<br />
+ 120%<br />
165<br />
163<br />
162<br />
156<br />
171<br />
147<br />
151<br />
332
2.3 Management report on on the Group Results of of operations of of the the business areas areas<br />
78% of Plant Technology’s new orders<br />
came from regions outside the EU EU in in<br />
2010/2011.<br />
Plant Technology<br />
Plant Technology in figures<br />
2009/2010 2010/2011 Change in %<br />
Order intake million € 3,859 4,475 16<br />
Sales million € 3,931 4,004 2<br />
EBIT million € 401 506 26<br />
EBIT margin % 10.2 12.6 —<br />
Adjusted EBIT million € 401 506 26<br />
Adjusted EBIT margin % 10.2 12.6 —<br />
Employees (Sept. 30) 12,972 13,478 4<br />
The product portfolio of Plant Technology includes chemical plants and refineries, equipment for the cement<br />
and minerals industries, equipment for the mining and extraction of raw materials, and production systems<br />
and assembly lines for the auto industry.<br />
Continuing good order situation<br />
The business area benefited from a favorable investment climate worldwide in the past fiscal year. Order<br />
intake increased by 16% to €4.5 billion. A major part in this pleasing performance was played by our plants<br />
for the cement, minerals and mining sectors and our production systems and assembly lines for the auto<br />
industry, where orders were in some cases more than 20% up from the prior year.<br />
Plant Technology is active globally. In 2010/2011 the most important regions outside Europe were Asia with<br />
28% of new orders, America with 22% and Africa with 16%. 22% of orders came from the European Union.<br />
Newly acquired projects include two coke plant orders for customers in South Korea and Germany. In<br />
addition we received orders for two coal handling plants in India and South Africa. Orders from customers in<br />
Mexico, China and Indonesia contributed to the pleasing performance in the cement, minerals and mining<br />
business. Some projects were delayed due to the political unrest in North Africa and the Middle East<br />
Plant Technology order intake Plant Technology EBIT<br />
in million €, quarter on quarter rate of change in million €, quarter on quarter rate of change<br />
Q1 1,324 Q1<br />
Q2 (38)% 824 Q2<br />
Q3 (3)% 800 Q3<br />
Q4 + 14% 911 Q4<br />
2009/2010<br />
2009/2010<br />
Q1 + 12% 1,016 Q1<br />
Q2 (12)% 896 Q2<br />
Q3 + 22% 1,097 Q3<br />
Q4 + 34% 1,466 Q4<br />
2010/2011<br />
2010/2011<br />
(12)%<br />
(8)%<br />
+ 13%<br />
+ 5%<br />
+ 30%<br />
(6)%<br />
(2)%<br />
78<br />
111<br />
98<br />
90<br />
102<br />
107<br />
139<br />
131<br />
129
Management report on the Group<br />
2.3 Management report on the Group Results of operations of the business areas<br />
All Components Technology plants<br />
supplying the auto industry had a a good<br />
workload in 2010/2011.<br />
78 | 79<br />
Sales in fiscal year 2010/2011 came to €4.0 billion, up 2% year-on-year. All sections of the business area<br />
had good utilization rates, in many cases operating at their capacity limit. Orders in hand of around<br />
€6.6 billion at September 30, 2011, mainly for long-term project business, secure both sales and capacity<br />
utilization for a period considerably in excess of one year.<br />
Earnings improved<br />
With EBIT of €506 million, Plant Technology exceeded its prior-year earnings by €105 million. This pleasing<br />
increase was mainly due to the billing of larger orders. EBIT margin at 12.6% was significantly higher than<br />
the prior-year 10.2%.<br />
Components Technology<br />
Components Technology in figures<br />
2009/2010 2010/2011 Change in %<br />
Order intake million € 5,653 6,921 22<br />
Sales million € 5,724 6,908 21<br />
EBIT million € 252 543 115<br />
EBIT margin % 4.4 7.9 —<br />
Adjusted EBIT million € 301 503 67<br />
Adjusted EBIT margin % 5.3 7.3 —<br />
Employees (Sept. 30) 29,144 31,270 7<br />
The Components Technology business area supplies a range of high-tech components for wind turbines,<br />
construction equipment and general engineering applications. In the auto sector our activities are focused<br />
on crankshafts, camshafts, steering systems and the assembly of axle modules.<br />
Strong rise in orders and sales<br />
Components Technology continued its good upward trend in 2010/2011. Order intake increased year-onyear<br />
by 22% to €6.9 billion. This was due partly to global growth in the auto industry, both for cars and<br />
trucks, and partly to a recovery in demand in general engineering and the wind energy sector. In the<br />
automotive sector the markets in China and Brazil in particular showed dynamic growth; the trend in the USA<br />
was also positive. The list of major orders received includes assembled camshafts and electromechanical<br />
steering systems, passive and active suspension systems, machined and forged crankshafts and brake<br />
components. All plants supplying the auto industry reported high capacity utilization. The construction<br />
equipment industry also continued to recover, with impetus coming mainly from China, India and Russia.<br />
Domestic business was likewise pleasing.<br />
Sales followed the trend in orders and reached €6.9 billion, up 21% from the prior year. We thus achieved<br />
our highest-ever order intake and sales in the reporting year.
2.3 Management report on on the Group Results of of operations of of the the business areas areas<br />
Components Technology order intake Components Technology EBIT<br />
in million €, quarter on quarter rate of change in million €, quarter on quarter rate of change<br />
Q1 1,169 Q1<br />
Q2 + 14% 1,337 Q2<br />
Q3 + 18% 1,584 Q3<br />
Q4 (1)% 1,563 Q4<br />
2009/2010<br />
2009/2010<br />
Q1 + 2% 1,602 Q1<br />
Q2 + 12% 1,795 Q2<br />
Q3 + 1% 1,811 Q3<br />
Q4 (5)% 1,713 Q4<br />
2010/2011<br />
Profit doubled<br />
Components Technology further strengthened its earnings in 2010/2011, achieving EBIT of €543 million,<br />
more than double the prior-year figure. The earnings include a €40 million impairment reversal at the US<br />
foundry group Waupaca. Due to the improved sales situation in the USA and numerous customer orders the<br />
Etowah plant in Tennessee, idled during the demand crisis, was reopened. Adjusted EBIT at €503 million<br />
also showed a significant increase from the prior year.<br />
Key factors in the substantial improvement in earnings were our good operating performance as well as our<br />
restructuring measures. These structural measures sustainably reduced cost levels and improved<br />
profitability. Compared with the prior year, EBIT margin increased from 4.4% to 7.9%.<br />
Marine Systems<br />
Marine Systems in figures<br />
2010/2011<br />
2009/2010 2010/2011 Change in %<br />
Order intake million € 531 2,977 461<br />
Sales million € 1,211 1,493 23<br />
EBIT million € 145 213 47<br />
EBIT margin % 12.0 14.3 —<br />
Adjusted EBIT million € 72 213 196<br />
Adjusted EBIT margin % 5.9 14.3 —<br />
Employees (Sept. 30) 5,488 5,295 (4)<br />
After the restructuring of the shipyards the Marine Systems business area will focus exclusively on naval<br />
shipbuilding in the future as part of the Group’s strategic development. In the reporting year we continued<br />
the ship repair and component manufacturing operations, which are classified as held for sale, and worked<br />
through yacht orders to a limited extent.<br />
+ 28%<br />
(10)%<br />
(15)%<br />
+ 127%<br />
(10)%<br />
+ 24%<br />
+ 14%<br />
80<br />
57<br />
73<br />
66<br />
56<br />
127<br />
114<br />
141<br />
161
Management report on the Group<br />
2.3 Management report on the Group Results of operations of the business areas<br />
Order intake in naval shipbuilding rose rose to to<br />
almost €3 billion in in the reporting year.<br />
80 | 81<br />
Higher order intake and sales<br />
Marine Systems increased its order intake significantly, from €531 million in the prior year to almost<br />
€3.0 billion in the reporting year. The biggest single project was the order placed by Turkey for six U 214<br />
submarine material packages worth around €2.2 billion. The order intake also includes €295 million from<br />
the contractual agreement with Greece.<br />
Sales increased year-on-year from €1.2 billion to €1.5 billion. At the beginning of the reporting year we<br />
handed over the second Class 209-PN submarine to the Portuguese Navy. In July 2011 this was followed by<br />
the first of two extensively modernized submarines for the Singapore Navy. The Hamburg shipyard began<br />
production of the Class F125 frigates for the German Navy. Technical difficulties with the propulsion systems<br />
have delayed the delivery of the Class K130 corvettes for the German Navy, which will now take place in<br />
mid-2012. The repair and components business, which is classified as held for sale, performed positively.<br />
Earnings improved<br />
EBIT improved from €145 million in the prior year to €213 million. The reasons for the pleasing increase<br />
were mainly positive one-time effects from the above-mentioned settlement with Greece and agreements<br />
with other customers. The lack of work in the civil shipbuilding operations had a negative impact. EBIT<br />
margin increased year-on-year from 12.0% to 14.3%. The adjusted EBIT of the prior year included nonoperating<br />
expense of €58 million as well as the deconsolidation effect of Hellenic Shipyards in Greece.<br />
Marine Systems order intake Marine Systems EBIT<br />
in million €, quarter on quarter rate of change in million €, quarter on quarter rate of change<br />
Q1 110 Q1<br />
Q2 + 26% 139 Q2<br />
Q3 (22)% 108 Q3<br />
Q4 + 61% 174 Q4<br />
2009/2010<br />
2009/2010<br />
Q1 + 145% 426 Q1<br />
Q2 (65)% 149 Q2<br />
Q3 ++ 2.155 Q3<br />
Q4 (89)% 247 Q4<br />
2010/2011<br />
2010/2011<br />
+ 13%<br />
(56)%<br />
++<br />
(55)%<br />
+ 83%<br />
(26)%<br />
(66)%<br />
16<br />
18<br />
8<br />
103<br />
46<br />
84<br />
62<br />
21
2.3 Management report on on the Group Results of of operations of of the the business areas areas<br />
Stainless Global achieved two-digit- two-digitgrowth<br />
in order intake and sales.<br />
Stainless Global (discontinued operation)<br />
Stainless Global in figures<br />
2009/2010 2010/2011 Change in %<br />
Order intake million € 5,121 6,045 18<br />
Sales million € 5,901 6,739 14<br />
EBIT million € (57) (785) – –<br />
EBIT margin % (1.0) (11.6) —<br />
Adjusted EBIT million € (57) 15 126<br />
Adjusted EBIT margin % (1.0) 0.2 —<br />
Employees (Sept. 30) 11,235 11,490 2<br />
The Stainless Global business area supplies premium-quality stainless steel flat products and highperformance<br />
materials such as nickel alloys and titanium.<br />
Orders and sales higher<br />
At Stainless Global, business was up from the prior year in the first months of 2010/2011. The value of new<br />
orders increased by 18% to €6.0 billion due to alloy prices; order volumes were 3% down from the prior year<br />
at 2.0 million tons. Whereas volumes decreased slightly in the stainless flat products business, demand for<br />
nickel alloys and titanium increased, which also noticeably increased their selling prices. 2.3 million tons of<br />
stainless flat products and 37,500 tons of high-performance materials were produced. It should be noted<br />
that the prices of high-performance materials are many times higher than those of stainless products.<br />
Overall shipments were 6% down from the prior year at 2.0 million tons. Market demand was noticeably<br />
weaker in the 2nd half of the year. Despite this, sales increased by 14% to around €6.7 billion due to higher<br />
alloy surcharges. Base prices were lower than a year earlier.<br />
Stainless Global order intake Stainless Global EBIT<br />
in million €, quarter on quarter rate of change in million €, quarter on quarter rate of change<br />
Q1 943 Q1<br />
Q2 + 65 % 1,560 Q2<br />
Q3 (16)% 1,317 Q3<br />
Q4 (1)% 1,301 Q4<br />
2009/2010<br />
Q1 + 14 % 1,483 Q1<br />
Q2 + 21 % 1,790 Q2<br />
Q3 (24)% 1,360 Q3<br />
Q4 + 4 % 1,412 Q4<br />
2010/2011<br />
2009/2010<br />
2010/2011<br />
– –<br />
++<br />
(94)%<br />
+ 40 %<br />
+ 743 %<br />
– –<br />
– –<br />
82<br />
(42)<br />
(101)<br />
81<br />
5<br />
7<br />
59<br />
0<br />
(851)
Management report on the Group<br />
2.3 Management report on the Group Results of operations of the business areas<br />
The new stainless steel mill in in the the USA<br />
began operations.<br />
82 | 83<br />
Adjusted EBIT positive<br />
Adjusted EBIT improved from €(57) million to €15 million, adjusted EBIT margin from (1.0)% to 0.2%.<br />
A favorable market situation at the beginning of the reporting year and the optimization of the product<br />
mix led to positive effects, in particular from the nickel alloy business. In addition, we further reduced costs.<br />
The EBIT figure includes €98 million in startup costs for the new stainless steel mill in the USA.<br />
Impairment charges weigh on EBIT<br />
After goodwill impairment of €290 million and a further fair value adjustment of €510 million, EBIT of<br />
Stainless Global came to €(785) million, compared with €(57) million in the prior year. EBIT margin<br />
decreased from (1.0)% to (11.6)%. The write-down to fair value made necessary by the intention to sell<br />
takes into account in particular the valuation discounts applied to stainless steel producers due to the<br />
structural problems in the market. The discounts also reflect the current sovereign debt crisis and the high<br />
risk aversion of investors. In the current environment, the valuations placed on stainless steel companies are<br />
comparatively low and vary over a range. We determined the fair value on the basis of internal calculations<br />
and estimates of market participants, and our valuation lies in the middle of the range.<br />
Stainless steel mill in the USA<br />
At the US site in Calvert the productivity and product quality of the units in phase 1 of the cold rolling mill<br />
commissioned last fiscal year improved further. The newly installed phase 2 units in the hot-rolled annealing<br />
and pickling line, the second cold rolling mill and the finishing line are now going into operation. In addition,<br />
the third cold rolling mill and the remaining parts of the finishing line are currently being installed.<br />
Construction work on the 1 million ton per year capacity melt shop is proceeding on schedule; it is due to<br />
start operation in December 2012. Until then the location will continue to be supplied with hot band and<br />
slabs from the European mills.<br />
Nirosta forward strategy<br />
To strengthen the competitiveness of the European stainless steel operations, the locations within the<br />
Nirosta plant network are being optimized. The relocation of production from Düsseldorf-Benrath to Krefeld<br />
is to be completed by the beginning of 2016. The investment volume is €244 million. The implementation of<br />
the first phase of the project began at the start of 2011, mainly involving the construction of a new<br />
annealing and pickling line and cold rolling mill.<br />
Business with external customers<br />
The order intake and sales of the business area also include business with customers within the<br />
ThyssenKrupp Group. The following figures were generated with customers outside the Group; as a result of<br />
the separation of the stainless steel operations, the corresponding Group figures are reduced by these<br />
amounts:<br />
2009/2010 2010/2011<br />
Change<br />
in %<br />
Order intake million € 4,609 5,411 17<br />
Sales million € 5,306 6,016 13
2.3 Management report on on the Group Results of of operations of of the the business areas areas<br />
Corporate at ThyssenKrupp AG<br />
Corporate comprises the Group’s head office including management of the business areas. It also includes<br />
the business services activities in the areas of finance, communications, IT and human resources, as well as<br />
non-operating real estate and inactive companies. Sales of services by Corporate companies to Group<br />
companies in the reporting period came to €143 million, up from €131 million a year earlier.<br />
Corporate’s earnings before interest and taxes came to €(377) million, a deterioration of €86 million from<br />
the prior year. The deterioration was mainly the result of higher administrative costs, particularly personnel<br />
and IT costs, and the valuation of mining provisions. Adjusted EBIT came to €(356) million; Corporate<br />
recognized a €21 million provision for litigation risks in connection with arbitration court proceeedings<br />
concerning a disposal carried out several years earlier.<br />
84
Management report on the Group<br />
2.4 2.4 Management Management report on on the Group Financial position<br />
position<br />
Financial position<br />
We are strengthening the company and its core business with<br />
customer-oriented investments, decreasing net debt and secured<br />
liquidity. Our statement of cash flows provides transparency about<br />
the sources and uses of our funds. The impact of these cash flows<br />
on the Group’s assets and liabilities is shown in the analysis of the<br />
statement of financial position.<br />
Pages 51-52<br />
50–51<br />
Steel Steel Europe Europe invested invested €410 €410 million million – – –<br />
mostly mostly on on maintenance maintenance and and environmental<br />
projects.<br />
environmental projects.<br />
Capital expenditures<br />
84 | 85<br />
85<br />
Capital expenditures at €2.8 billion<br />
In In fiscal year 2010/2011 ThyssenKrupp invested a total of of €2,771 million, 21% less than in in the prior year.<br />
€2,661 million was spent on property, plant and equipment and intangible assets. €110 million was used for<br />
the acquisition of of businesses and shareholdings as well as other financial assets; the main acquisitions are<br />
detailed in in the section “The Group’s Strategic Way Forward”.<br />
Excluding the major projects in in Brazil and the USA, capital expenditures totaled €1,247 million, compared<br />
with €1,188 million in in the prior year. Capital expenditures were €19 million lower than depreciation of of<br />
€1,266 million.<br />
Investment by business area in in million € €<br />
2009/2010 2010/2011 Change in in %<br />
Steel Europe 286 431 51<br />
Steel Americas 2,054 1,369 (33)<br />
Materials Services 188 136 (28)<br />
Elevator Technology 81 135 67<br />
Plant Technology 32 47 47<br />
Components Technology 288 361 25<br />
Marine Systems 8 14 75<br />
Corporate 268 36 (87)<br />
Consolidation (36) (24) —<br />
Investments of of continuing operations 3,169 2,505 (21)<br />
Stainless Global 344 266 (23)<br />
ThyssenKrupp Group 3,513 2,771 (21)<br />
Capital expenditures in in the business areas<br />
Steel Europe – The business area’s capital expenditures on property, plant and equipment and intangible<br />
assets reached €410 million, with depreciation at at €530 million. This was a significant increase from the low<br />
level of of the prior year, when we invested only €286 million due to to the economic crisis. The greater part of of<br />
our spending was for maintenance and environmental projects to to reduce emissions at at the Duisburg and<br />
Dortmund sites. Other investments related to to hot strip mill 2 in in Duisburg, where an efficient compact cooling<br />
system was installed for the production of of high-quality skelp. Work also started in in Duisburg on the<br />
modernization of of hot strip mill 1. A total of of roughly €300 million is is to to be invested in in the German hot strip<br />
mills by 2014/2015 under an overall program.
2.4 Management report on the Group Financial position<br />
Investments at the Gelsenkirchen site focused on promising, high-quality electrical steel grades; the third<br />
expansion phase has now begun. With demand for imported coal expected to rise, work commenced on<br />
extending the coal terminal at the port of Rotterdam.<br />
Steel Americas – Steel Americas spent €1,369 million with depreciation of €391 million. The main<br />
investments in Brazil were for the completion of coke battery B, the start-up of the second blast furnace and<br />
the second melt shop line, as well as pollution control measures. Capital expenditures at the US plant<br />
related primarily to the construction of a pickling line and four hot-dip galvanizing lines.<br />
Materials Services – Capital expenditures for property, plant and equipment and intangible assets<br />
amounted to €95 million at Materials Services, while depreciation came to €134 million. Investments were<br />
mainly used to maintain existing operations and expand our steel mill services in America and Europe.<br />
Elevator Technology – The business area spent €93 million on property, plant and equipment and<br />
intangible assets; depreciation was €74 million. In addition to replacement capital expenditure, Elevator<br />
Technology completed the new elevator plant in Madrid, optimized production in the USA and invested in<br />
customer-oriented IT solutions.<br />
Plant Technology – Capital expenditures of €44 million mainly went toward maintaining and expanding<br />
production capacities, as well as the use of new technologies. Depreciation came to €36 million. In the area<br />
of base chemicals, the business area acquired the high-temperature Winkler coal gasification process, which<br />
ideally complements the existing gasification processes. Also in the area of coal gasification, a joint venture<br />
was established with South Korea’s largest energy utility KEPCO. The joint company KEPCO-Uhde Inc. aims<br />
to promote the commercial use of PRENFLO-PSG technology for coal gasification. The investment in a<br />
multipurpose biotechnology plant to produce lactic acid marks our entry into the production of bioplastics. In<br />
addition, Plant Technology expanded its strategically important locations in China and India.<br />
Components Technology – Components Technology spent €361 million on property, plant and equipment<br />
and intangible assets, with depreciation at €285 million. The main investments were made in Europe, China,<br />
the USA, Brazil, and India. For example, camshaft production capacities were increased, and the production<br />
facilities for advanced electromechanical steering systems expanded. Work started on construction of a new<br />
crankshaft plant in the Chinese city of Nanjing: From October 2012 the plant will employ around 650 people<br />
and produce more than 360,000 truck crankshafts per year. In Chengdu, China, and in São Paulo, Brazil, we<br />
expanded our spring and stabilizer manufacturing operations. With the market for wind turbines also<br />
favorable, we continued our investment program for the production of slewing bearings.<br />
Marine Systems – With depreciation at €19 million, spending amounted to €14 million; this was mainly<br />
replacement capital expenditure.<br />
Stainless Global – The discontinued business area Stainless Global invested €266 million in property, plant<br />
and equipment and intangible assets in the reporting year; depreciation amounted to €175 million. The new<br />
integrated stainless mill at the Calvert site in the USA was officially opened on December 10, 2010. In the<br />
Nirosta group, a skin-pass mill was replaced at the Dillenburg cold rolling plant, while VDM expanded bar<br />
production capacities at its Reno/USA facility. Stainless Global continued to implement its fire protection<br />
programs. Beyond this, most capital expenditures were aimed at maintaining existing operations and<br />
upgrading individual equipment items.<br />
86
Management report on the Group<br />
2.4 Management report on the Group Financial position<br />
Page 52<br />
Page 52<br />
Net financial debt<br />
86 | 87<br />
In the reporting year, our net financial debt was once again dominated by our investments in Brazil and the<br />
USA. Our net working capital also increased as a result of significantly higher orders and inventories. Net<br />
financial debt stood at €3,578 million at the end of the fiscal year, €202 million lower than the figure on<br />
September 30, 2010. After reaching a high in the 2nd quarter 2010/2011, net financial debt fell<br />
significantly. The situation over the course of the year is shown in the graphic below.<br />
Progression of net financial debt 2010/2011<br />
in million €<br />
3,780<br />
5,814<br />
6,492 6,249<br />
A key factor in in the reduction of our net debt was the the sale of treasury shares shares in July July 2011, which which resulted in a<br />
cash inflow of around €1.6 billion. We report on this in more detail in the section “Profile and strategy”.<br />
There was a further inflow of €776 million from operating cash flow; €424 million came from minor<br />
disposals. The impact of individual factors on our net financial debt in 2010/2011 is shown in the following<br />
graphic:<br />
Net financial debt in million €<br />
Net financial<br />
debt<br />
Sept. 30,<br />
2010<br />
Gearing 36.4%<br />
3,578<br />
Sept. 30, 2010 Dec. 31, 2010 Mar. 31, 2011 June 30, 2011 Sept. 30, 2011<br />
Operating<br />
cash flows<br />
– total –<br />
(3,780) + 776<br />
Investments<br />
– total –<br />
Free cash flow: (1,571) – total –<br />
Divestments<br />
– total – Dividend<br />
ThyssenKrupp<br />
AG<br />
(2,771)* + 424** (209) + 1,631<br />
Sale of<br />
treasury<br />
shares Miscellaneous<br />
Net financial<br />
debt<br />
Sept. 30,<br />
2011<br />
* incl. cash and cash equivalents acquired For technical reasons in part not to scale<br />
** incl. cash and cash equivalents disposed of<br />
+ 351<br />
Gearing 34.5%<br />
(3,578)
2.4 Management report on the Group Financial position<br />
Analysis of the statement of cash flows<br />
The overall amounts taken into account in the statement of cash flows correspond to the item “Cash and<br />
cash equivalents” as reported in the statement of financial position, taking into account the cash and cash<br />
equivalents relating to the disposal groups including the discontinued operations. For the reporting period<br />
and the prior year, the discontinued operations comprise the activities of the Stainless Global business area.<br />
In fiscal year 2010/2011 there was an overall cash inflow from operating activities of €776 million,<br />
compared with €868 million in the prior year. The cash inflow of the continuing operations was level with the<br />
prior year at €1,012 million. A €413 million improvement in other assets/liabilities not related to investing or<br />
financing activities was partly offset by a net €346 million increase in funds tied up in inventories and trade<br />
receivables and payables. In the discontinued operations, the overall higher funds tied up in operating<br />
assets/liabilities in particular resulted in a €73 million reduction in operating cash flows to €(236) million.<br />
The overall cash outflow from investing activities was €612 million lower than a year earlier at<br />
€2,347 million. The €539 million reduction in the continuing operations was the result in particular of two<br />
offsetting effects: Capital expenditure for property, plant and equipment and intangible assets decreased by<br />
€670 million; this was partly offset by the €205 million reduction in proceeds from the disposal of<br />
consolidated companies. The discontinued operations reported a €73 million decrease in cash outflow from<br />
investing activities, mainly due to lower investment in property, plant and equipment.<br />
As in the prior year, the free cash flow of the continuing operations, i.e. the sum of operating cash flows and<br />
cash flows from investing activities, was negative. Compared with a year earlier, however, the negative free<br />
cash flow was €520 million lower at €(1,070) million. The free cash flow attributable to the discontinued<br />
operations was unchanged from the prior year. Overall, the negative free cash flow was €520 million lower<br />
than a year earlier at €(1,571) million.<br />
The cash inflow from financing activities attributable to the continuing operations improved year-on-year by<br />
€1,234 million to €989 million. The increase was mainly due to the sale of treasury shares in July 2011<br />
(€1,624 million) and a reduced cash outflow in connection with the financing of discontinued operations<br />
(€514 million). This was partly offset firstly by the €465 million decrease in proceeds to equity from noncontrolling<br />
interest; in the prior year, proceeds of €500 million were reported in connection with the increase<br />
in Vale S.A.’s shareholding in ThyssenKrupp CSA. Secondly there was a €301 million increase in<br />
repayments of financial debt; this included the €750 million repayment of a bond in fiscal year 2010/2011.<br />
Including the €37 million increase in cash inflow from financing activities to €538 million that was<br />
attributable to the discontinued operations and related in particular to the inclusion of the Stainless Global<br />
business area in the Group financing system, overall cash inflow from financing activities increased by<br />
€1,271 million to €1,527 million.<br />
88
Management report on the Group<br />
2.4 Management report on the Group Financial position<br />
Pages 171-173 171–173<br />
At the end of September 2011<br />
ThyssenKrupp had total a available cash and liquidity cash<br />
equivalents of €8.3 billion. of €8.3 billion.<br />
Change in cash and cash equivalents in million €<br />
Cash and cash<br />
equivalents<br />
Sept. 30, 2010<br />
– total –<br />
3,673<br />
Operating<br />
cash flows<br />
– total –<br />
Cash flows<br />
from investing<br />
activities<br />
– total –<br />
+ 776 (2,347)<br />
Cash flows<br />
from financing<br />
activities<br />
– total –<br />
Exchange rate<br />
changes<br />
+ 1,527 (61) 3,568<br />
Central financing and maintenance of liquidity<br />
Cash and cash<br />
equivalents<br />
Sept. 30, 2011<br />
– total –<br />
88 | 89<br />
For technical reasons in part not to scale<br />
The financing of the Group is managed centrally by ThyssenKrupp AG. It is based on a multi-year financial<br />
planning system and a monthly rolling liquidity planning system covering a planning period of up to one<br />
year. The cash inflows from our operating activities are our main source of liquidity. Our cash management<br />
systems allow Group companies to use surplus funds from other company units to cover their own financial<br />
requirements. This reduces the volume of external financing requirements and thus our interest expense.<br />
External financing requirements are covered by committed credit facilities in various currencies and with<br />
various terms. In addition we use money and equity market instruments as well as selected off-balance<br />
financing instruments such as factoring programs and operating leases. Information on the available credit<br />
facilities is provided in Note 17.<br />
Our centralized financing system enables us to project a uniform image to the capital markets. This<br />
strengthens our negotiating position vis-à-vis banks and other market participants and makes it easier for us<br />
to procure and invest capital on optimum terms.<br />
At September 30, 2011 ThyssenKrupp had €3.6 billion in cash and cash equivalents and €4.7 billion in<br />
available credit facilities. Together this provided available liquidity of €8.3 billion. Additional financing of up<br />
to €1.5 billion was available under a commercial paper program, which was unused at September 30, 2011.<br />
The financing and liquidity of our Group were secured at all times during the reporting year.
2.4 Management report on the Group Financial position<br />
Issuer ratings since 2001<br />
We have been rated by Moody’s and Standard & Poor’s since 2001 and by Fitch since 2003.<br />
ThyssenKrupp’s credit standing is currently rated by the agencies as follows:<br />
Long-term<br />
rating<br />
90<br />
Short-term<br />
rating Outlook<br />
Standard & Poor’s BB+ B stable<br />
Moody’s Baa3 Prime-3 stable<br />
Fitch BBB- F3 stable<br />
Experience shows that ratings upgrades lead to lower refinancing costs, while downgrades generally have a<br />
negative effect. Regaining investment grade status with Standard & Poor’s therefore remains an important<br />
goal.<br />
Analysis of the statement of financial position<br />
Compared with September 30, 2010, total assets decreased slightly by €109 million to €43,603 million.<br />
Compared with September 30, 2010, non-current assets decreased significantly by a total of €3,576 million.<br />
There was a €3,673 million reduction in property, plant and equipment. This decrease was mainly due to the<br />
reclassification of €2,394 million to assets held for sale/disposal due to the disposal of the Stainless Global<br />
business area initiated in fiscal year 2010/2011 (€2,269 million) and the sale of the Xervon group in the<br />
Materials Services business area initiated in August 2011 (€125 million); in addition, depreciation in the<br />
Steel Americas business area exceeded additions by €1,342 million, particularly as a result of the<br />
€1,685 million impairment charges recorded in this area. The €485 million decline in intangible assets was<br />
mainly due to goodwill impairment of €338 million as well as a €144 million increased reclassification to<br />
assets held for sale/disposal. The €253 million increase in other non-current non-financial assets was<br />
mainly due to the recognition of reimbursement rights in connection with non-income-based taxes. This was<br />
partly offset by a €350 million increase in deferred tax assets due mainly to losses outside Germany.<br />
Current assets increased in total by €3,467 million.<br />
Inventories stood at €8,105 million on September 30, 2011, down €157 million from the prior year.<br />
Increases resulting mainly from the good business situation in the reporting period and the ramp-up of<br />
production at the new steel plants in Brazil and the USA were offset in particular by decreases from a<br />
€1,890 million higher reclassification to assets held for sale/disposal. In addition, inventories at the Marine<br />
Systems business area declined due to the delivery of a submarine to the Greek Navy and there were writedowns<br />
of excess inventory held in the Steel Americas business area due to the ramp-up.
Management report on the Group<br />
2.4 Management report on the Group Financial position<br />
90 | 91<br />
At €5,059 million, trade accounts receivable were €823 million lower than on September 30, 2010.<br />
The decrease was mainly due to a €834 million higher reclassification to assets held for sale/disposal.<br />
The €107 million reduction in other current financial assets was mainly due to the accounting for derivatives.<br />
The €83 million decrease in other current non-financial assets related in particular to reimbursement rights<br />
in connection with non-income-based taxes, which were partly offset by higher advance payments in<br />
connection with the purchase of inventories.<br />
Current income tax assets were down by €181 million.<br />
Assets held for sale/disposal increased by €4,968 million to €5,762 million. Of this substantial increase,<br />
€4,625 million related to the disposal of the Stainless Global business area initiated in fiscal year<br />
2010/2011, and €451 million to the sale of the Xervon group in the Materials Services business area<br />
initiated in August 2011.<br />
Total equity stood at €10,382 million on September 30, 2011, almost unchanged from a year earlier. The<br />
net loss of €1,783 million in the reporting year as well as dividend payments (€252 million) and net<br />
unrealized losses from derivative financial instruments (€83 million after taxes) recognized in other<br />
comprehensive income resulted in a sharp decrease in total equity. This was partly offset by a<br />
€1,624 million increase in connection with the sale of treasury shares in July 2011. Further increases<br />
came from net actuarial gains from pensions and similar obligations (€388 million after taxes) recognized<br />
in other comprehensive income and net unrealized gains from foreign currency translation (€50 million).<br />
The €518 million decrease in non-controlling interest was mainly due to the negative earnings at<br />
ThyssenKrupp CSA.<br />
Non-current liabilities decreased in total by €820 million. This included a €1,146 million reduction in accrued<br />
pension and similar obligations, of which €548 million from updated interest rates for the revaluation of<br />
pension and healthcare obligations at September 30, 2011, and €245 million from payments to plan assets<br />
and plan closures; in addition, an increased reclassification to liabilities associated with assets held for<br />
sale/disposal resulted in a decrease of €232 million. Non-current financial debt increased by €337 million.<br />
Taking into account offsetting effects, current liabilities increased overall by €717 million.<br />
The €278 million decline in other current provisions related mainly to provisions for onerous contracts and<br />
provisions for restructuring measures. Current financial debt was €1,100 million lower mainly due to the<br />
repayment of a €750 million bond and a €399 million higher reclassification to liabilities associated with<br />
assets held for sale/disposal. The €604 million decrease in trade accounts payable was mainly due to the<br />
€1,392 million higher reclassification to liabilities associated with assets held for sale/disposal; this was<br />
partly offset by increases due to the good business situation in the reporting year. The €284 million decline<br />
in other current financial liabilities was partly due to a €215 million higher reclassification to liabilities<br />
associated with assets held for sale/disposal. Higher customer advance payments in connection with
2.4 Management report on on the Group Financial position<br />
Pages 174–176 174–176<br />
Pages 159–160 159–160<br />
construction orders were the main reason for the €426 million increase in other current non-financial<br />
liabilities. The €2,680 million increase in liabilities associated with assets held for sale/disposal included<br />
€2,470 million associated with the disposal of the Stainless Global business area initiated in fiscal year<br />
2010/2011 and €396 million associated with the sale of the Xervon group initiated in August 2011. This was<br />
partly offset by a €179 million adjustment of the disposal group due to the termination of negotiations to sell<br />
parts of the Marine Systems business area in fiscal 2010/2011.<br />
Assets not recognized and<br />
off-balance financing instruments<br />
In addition to the assets recognized in the balance sheet, the Group also uses non-recognized assets. These<br />
are mainly leased or rented assets (operating leases). More details on this can be found under Note 21.<br />
The main off-balance financing instruments we use are factoring programs. More details can be found under<br />
Note 10.<br />
One important intangible asset is the ThyssenKrupp brand, which strengthens the image of our Group<br />
companies on their markets and is therefore under constant further development. Our longstanding and<br />
trusting relationships with suppliers and customers are also of great value as they make us independent of<br />
sudden market fluctuations. Close cooperation with our business partners frequently enables us to get<br />
involved in their development projects at an early stage. Our Group’s recognized technological capabilities<br />
pay particular dividends in the international plant construction sector. Our managers and employees are<br />
another important asset. Their knowledge of technology, markets and partners make a key contribution to<br />
our good reputation and the value of the company.<br />
92
Management report on the Group<br />
2.5 Management report on on the the Group Non-financial performance indicators indicators<br />
Non-financial<br />
performance indicators<br />
Our performance is reflected not only in our financial results, but also<br />
in the sustainability of our actions. We develop efficient solutions that<br />
conserve resources and protect the climate and the environment. For<br />
this we need capable employees – so we place strong emphasis on<br />
training and development and health and safety.<br />
Pages Pages 49-56 49–56<br />
Pages 94-96<br />
94–96<br />
Pages 96-99<br />
96–99<br />
Pages 99-100<br />
99–100<br />
Page 101<br />
101<br />
Sustainability<br />
92 | 93<br />
For ThyssenKrupp, sustainability is a core business responsibility and a key driver of innovation. To ensure<br />
the company remains viable in the future, we work hard to constantly improve our economic, ecological and<br />
social performance. More information on our sustainability- and value-based strategy can be found in the<br />
section “Profile and strategy”. Sustainability and responsibility are firmly entrenched in our corporate culture<br />
and have long been part of our day-to-day practice. Sustainability management performs an important<br />
cross-cutting function in the Group, enabling us to utilize business opportunities and minimize risks. In<br />
the reporting year ThyssenKrupp AG underlined its commitment to sustainable development by joining the<br />
United Nations Global Compact (UNGC) initiative. We will work even more systematically to implement<br />
the ten principles of the UNGC and report on them transparently.<br />
In the following we report on our main sustainability activities in the areas of innovation, employees,<br />
environmental and climate protection, and corporate citizenship:<br />
– Our new corporate headquarters in Essen was awarded German Sustainable Building Council’s gold<br />
certificate.<br />
– In the reporting year, for example, our company presented innovative solutions for electric vehicles and<br />
the iwalk moving walk (more under “Innovations”).<br />
– We made further improvements to health and safety: In the last five fiscal years, the number of accidents<br />
in the Group fell by more than 17% (more under “Employees”).<br />
– With an adjusted figure of around 1.7 tons of CO2 CO2 per ton of crude steel produced, emissions from our<br />
steelmaking operations are well below the global average. We are further intensifying our Groupwide<br />
environmental and climate management activities – e.g. through the introduction of a new Group policy<br />
(more under “Environment and climate”).<br />
– ThyssenKrupp once again supported three regional heats of the “Jugend forscht” young scientists<br />
competition in 2011 (more under “Corporate citizenship”).
2.5 Management report on on the Group Non-financial performance indicators indicators<br />
Pages 53-54 53–54<br />
LubriTreat ® LubriTreat will significantly improve<br />
the forming behavior of galvanized steels<br />
in the future.<br />
® will significantly improve the<br />
forming behavior of galvanized steels in<br />
the future.<br />
Innovations<br />
Innovations and new technologies are a key element of the Group’s Strategic Way Forward and therefore<br />
also feature strongly in our corporate program ‘impact’; a detailed report on this is provided in the section<br />
“Profile and strategy”. We develop new materials, products and processes, identify and explore promising<br />
areas of innovation, and improve our technology position. We are also expanding our innovation<br />
management systems.<br />
Our 3,000 research and development employees demonstrate their strengths in the areas “Material“,<br />
“Mechanical” and “Plant”. Their outstanding engineering expertise enables us to develop cost- and<br />
resource-efficient solutions in response to global challenges such as rising consumption or sustainable<br />
infrastructure. The following examples represent a selection of the wide-ranging innovation activities of our<br />
Group companies.<br />
Electromobility: StreetScooter development partnership<br />
ThyssenKrupp is expanding its capabilities in the area of electromobility. In collaboration with research<br />
institutes and industrial partners we are jointly developing body and chassis solutions for the electric<br />
vehicles of the future. As part of a consortium of industrial partners and institutes of Aachen University of<br />
Technology we are working on the development of a low-cost electric city vehicle called the StreetScooter.<br />
ThyssenKrupp has developed and prototyped the floor assembly, which will accommodate the batteries for<br />
the electric vehicle. For the crash-relevant parts we use both high-strength lightweight steels and other<br />
materials combining high strength and high elongation. In the event of a collision, this allows impact energy<br />
to be absorbed effectively. A prototype of the StreetScooter was presented at the 2011 Frankfurt Motor<br />
Show.<br />
Eco-friendly material for vehicle construction<br />
We have developed a new material with a tensile strength of 1,000 megapascals. It is currently our<br />
strongest cold-formable steel and is particularly suitable for thin-walled, low-weight parts. Safety-relevant<br />
structural parts for automobile bodies can be made up to 20% thinner using this material. This reduces<br />
vehicle weight, saves energy and thus lowers CO2 emissions.<br />
New coatings for cost-efficient production<br />
In collaboration with a lubricant manufacturer, our surface specialists have developed LubriTreat ® , a new<br />
coating process that significantly improves the forming behavior of galvanized steels. Moreover, the new<br />
coating is free of heavy metals and allows nickel-free, eco-friendly processing. LubriTreat ® reduces friction<br />
during the forming process, resulting in lower die wear and reduced scrap rates. Good paint adhesion and<br />
optimum finishes are guaranteed. The product has been patented by both companies and is suitable for all<br />
hot-dip and electrolytically galvanized steel sheet materials.<br />
iwalk – new moving walk sets standards<br />
Our newly developed iwalk requires much less space than conventional moving walks. With the same<br />
outside dimensions, the passenger area is wider and provides greater space and comfort. The significantly<br />
lower pit depth also greatly reduces the amount of civil work required. The iwalk can even be installed on<br />
an existing floor without the need for any additional construction measures. Thanks to the new<br />
modular design, individual segments can be added or removed as required in the shortest possible time,<br />
94
Management report on the Group<br />
2.5 Management report on the Group Non-financial performance indicators<br />
The “cylinder head” project won<br />
second prize on the 2011 ThyssenKrupp<br />
Innovation Contest.<br />
94 | 95<br />
and it is even possible to move the entire installation to a new location. The iwalk is particularly suitable for<br />
metro stations, railway stations, airports and exhibition centers – both as new installations and to upgrade<br />
existing systems. In addition the iwalk can be equipped with a new energy saving system which optimizes<br />
power consumption depending on passenger numbers without reducing operating speed. The new moving<br />
walk was awarded first prize in the 2011 ThyssenKrupp Innovation Contest.<br />
Cylinder head cover with integrated camshafts<br />
Second prize in this year’s Innovation Contest went to the development team behind a new cylinder head<br />
module with integrated camshafts. Our engineers and technicians used the proven Presta joining process for<br />
assembled camshafts to produce a complete cylinder head cover with integrated camshafts. This allows us<br />
to supply customers with a ready-to-install module rather than just individual camshafts. Modular designs<br />
with integrated camshafts were previously unavailable on the market. We have already received the first<br />
production order. As well as reducing costs for cylinder head machining, our solution is also easier to install.<br />
Integrating the individual, finish-machined camshaft parts in the cylinder head cover makes it possible to<br />
dispense with bearing caps. This results in improved hydrodynamics, and antifriction bearings can be<br />
integrated simply and without deformation.<br />
Bio-based plastics made from succinic acid<br />
In order to make sustainable use of resources we need to explore new ways of utilizing renewable raw<br />
materials. Since 2006 we have been developing biotechnology processes to produce plastics from<br />
renewable raw materials. One focus of the chemical industry has been the use of succinic acid as a raw<br />
material for bio-based plastics. In collaboration with a US company we have now developed a production<br />
process for this. Following successful trials on a pilot plant in Mexico, the world’s first industrial-scale<br />
biotechnology succinic acid plant is now being built in Louisiana/USA. Start-up is scheduled for late 2012.<br />
Increasingly efficient gearless conveyor systems<br />
With demands on conveyor systems for open pit mines rising all the time, conventional gear units are<br />
reaching their limits. Ever greater mining depths and increasing volumes call for longer, steeper and more<br />
powerful belt conveyors. For one of our customers we have now developed a gearless drive station for a<br />
6.5 km conveyor system. ThyssenKrupp is the world’s only supplier of conveyors with such high-power<br />
direct drives. They offer great dependability, low-cost maintenance and high energy efficiency. In future<br />
development projects we will standardize the drive stations, modularize them and further optimize their<br />
design.<br />
More than €500 million for research and development<br />
In 2010/2011 we spent €524 million on product, process and service innovations. Of this, research and<br />
development costs of €188 million were expensed immediately, €39 million was amortization of<br />
development costs capitalized in previous years, and €297 million was for order-related development costs.<br />
Expenditure for research and development was thus 19% higher than a year earlier, with particular increases<br />
in order-related development in the areas of “Mechanical” and “Plant”.
2.5 Management report on on the Group Non-financial performance indicators indicators<br />
The Group’s workforce grew outside<br />
Germany in 2010/2011 and declined<br />
slightly in Germany.<br />
Reporting in prior years related to the costs of basic research and development comprising non-capitalized<br />
research and development costs and capitalized development costs. With immediate effect we will report<br />
only on expenditure recognized in the reporting period, i.e. the non-capitalized research and development<br />
costs including amortization of capitalized development costs as well as order-related development costs.<br />
The prior-year comparatives for order-related development costs have been adjusted. Expenditure for<br />
technical quality assurance is no longer included.<br />
Research and development expenditure in million €<br />
2009/2010 2010/2011<br />
96<br />
Change<br />
in %<br />
Non-capitalized research and development costs 191 188 (2)<br />
Amortization of capitalized development costs 33 39 18<br />
Order-related development costs* 218 297 36<br />
Total 442 524 19<br />
* Part of cost of sales without offsetting grants/subsidies<br />
Employees<br />
We have outstanding employees, and we do a lot to make sure it stays that way: Intensive apprenticeship<br />
training, continuing development in all areas of the Group, high standards of health and safety, targeted<br />
support for young managers, greater diversity and internationality – including at management level.<br />
Our workforce grew in the reporting year. On September 30, 2011 ThyssenKrupp employed 180,050 people<br />
worldwide, a year-on-year increase of 2,704 or 1.5%. All the growth took place outside Germany, where the<br />
headcount rose by 4.4% to 110,928. By contrast, employee numbers in Germany fell by 2.7% to 69,122.<br />
The expansion of the new steel making and processing mills in Brazil and the USA in particular created a<br />
large number of new jobs.<br />
Employees by business area (Sept. 30)<br />
2007 2008 2009 2010 2011<br />
Change<br />
in %<br />
Steel Europe 37,749 38,692 36,416 34,711 28,843 (16.9)<br />
Steel Americas 397 1,158 1,659 3,319 4,060 22.3<br />
Materials Services 44,251 47,703 44,316 33,856 36,568 8.0<br />
Elevator Technology 39,501 42,992 42,698 44,024 46,243 5.0<br />
Plant Technology 13,102 13,433 13,043 12,972 13,478 3.9<br />
Components Technology 32,805 32,312 27,973 29,144 31,270 7.3<br />
Marine Systems 8,778 8,288 7,770 5,488 5,295 (3.5)<br />
Corporate 2,585 2,584 1,865 2,597 2,803 7.9<br />
Employees of continuing operations 179,168 187,162 175,740 166,111 168,560 1.5<br />
Stainless Global 12,182 12,212 11,755 11,235 11,490 2.3<br />
Group employees 191,350 199,374 187,495 177,346 180,050 1.5
Management report on the Group<br />
2.5 Management report on the Group Non-financial performance indicators<br />
Personnel expense<br />
in million €<br />
9,169<br />
2006/<br />
2007<br />
9,637 9,654<br />
2007/<br />
2008<br />
2008/<br />
2009<br />
8,772<br />
2009/<br />
2010<br />
Accidents at work<br />
according to international definition<br />
per 1 million hours worked<br />
14.6<br />
2007/<br />
2008<br />
11.4<br />
2008/<br />
2009<br />
10.2<br />
2009/<br />
2010<br />
2010/<br />
2011<br />
8.5<br />
9,014<br />
2010/<br />
2011<br />
Employees by region (Sept. 30)<br />
2007 2008 2009 2010 2011<br />
96 | 97<br />
Change<br />
in %<br />
Germany 84,999 85,097 81,229 71,072 69,122 (2.7)<br />
Other EU 41,522 42,503 38,252 35,491 31,762 (10.5)<br />
Americas 44,228 47,561 42,897 42,417 47,086 11.0<br />
Asia/Pacific 14,890 17,881 18,481 21,544 24,742 14.8<br />
Other countries 5,711 6,332 6,636 6,822 7,338 7.6<br />
World 191,350 199,374 187,495 177,346 180,050 1.5<br />
At €9.0 billion, personnel expense in 2010/2011 was 2.8% higher than the year before. The graphic on the<br />
left shows our personnel expense over the past five years.<br />
Apprenticeship training<br />
In Germany ThyssenKrupp is training 4,239 apprentices in more than 55 occupations, most of them<br />
industrial or technical. 1,312 young people started an apprenticeship with ThyssenKrupp in 2011. 170 fulltime<br />
trainers and numerous training officers provide high-quality, practical training which resulted in 92% of<br />
apprentices passing their final exams in the reporting year.<br />
In addition to traditional apprentice training, integrated degree programs are now well established at<br />
ThyssenKrupp. More than 70 such programs are currently available to our apprentices. We have also been<br />
running the TOPSIM business management game for 20 years, in which several teams of apprentices take<br />
over the management of a virtual company. The game enables them to acquire and strengthen a business<br />
mindset and social skills.<br />
Health and safety a priority<br />
Our Groupwide “zero accidents” initiative is aimed at making working in our production operations and<br />
offices even safer – and it is paying dividends. The accident rate in the reporting year fell by 17% compared<br />
with the prior year to 8.5 accidents per 1 million hours worked. Accidents have decreased by 42% over the<br />
past four years.<br />
We provided management training for the first time in China in 2010/2011; a similar program is now being<br />
prepared for Brazil. A new health and safety management manual provides valuable information on how<br />
Group companies can provide even better protection from accidents for their employees and systematically<br />
develop their health and safety programs.<br />
In the future we intend to integrate our global health and safety activities more closely. To this end, standard<br />
international healthcare structures and processes are being developed at several centers of competence<br />
under the coordination of corporate headquarters. One example is the bowel cancer screening campaign,<br />
which took place simultaneously at all German locations for the first time in 2011. Around 14,000<br />
employees took part.
2.5 Management report on on the Group Non-financial performance indicators indicators<br />
We have maintained and expanded our<br />
partnerships with selected universities for for<br />
many years.<br />
Successful graduate recruitment<br />
More and more, it is important to have a presence at universities so as to attract talented graduates. We<br />
present ourselves as an attractive employer and establish contacts with students at an early stage. We have<br />
maintained close relationships for many years with seven German universities in Aachen, Berlin, Bochum,<br />
Dortmund, Dresden, Freiberg and Hamburg-Harburg, and also with universities in China and Russia. In<br />
addition we have activities at other institutes and higher education establishments such as the Karlsruhe<br />
Institute of Technology, and Südwestfalen and Dortmund technical universities, for example through support<br />
groups and business management games.<br />
Our entry programs are tailored to the specific needs of the different target groups. The best of our interns<br />
are included in our “Next Generation” intern retention program. They attend selected events to acquaint<br />
themselves better with ThyssenKrupp and are then supported systematically when starting their career in<br />
the Group. For graduates with an interest in research, the doctoral student program “Your Innovation”<br />
provides an opportunity to be involved in work on the latest technologies in the Group. In addition to our<br />
engineering graduate programs, a program for business graduate trainees called “Create (y)our future” was<br />
also launched in the reporting year.<br />
Nowadays, the internet is the most important medium for gathering information and submitting job<br />
applications, so our careers portal is a very important way of addressing interested candidates and good<br />
applicants. The Swedish consultancy Potentialpark ranked ThyssenKrupp’s careers website the best in<br />
Germany in 2011. Our portal provides up-to-date information in an attractive design with numerous<br />
multimedia elements; navigation has been optimized to make it easier for young people to gain an overview<br />
of our Group. One important success factor is the systematic link to the application process.<br />
Management development<br />
We regard developing our employees and executives as a key management task. We have already reported<br />
many times on the PerspActive process, in which we systematically assess our managers and conduct<br />
targeted development interviews. This process is now firmly established and is paying dividends: Last year<br />
we were able to fill more than 90% of vacancies at the level below business area management boards with<br />
internal candidates.<br />
In the reporting year we also started to introduce Groupwide programs for managers with potential for<br />
positions in the three highest levels below the business area management boards. The aim of these modular<br />
development programs is to increase transparency into management talent in the Group and develop it more<br />
effectively. It also enables managers to network across business areas, regions and functional areas.<br />
The Talent Brokerage system launched just over a year ago has proven successful. It is directed at<br />
executives throughout the Group at the third management level below the business area management<br />
boards as well as those with the potential to fill such positions. Standard Groupwide development centers<br />
also help identify high potentials in Germany and abroad.<br />
98
Management report on the Group<br />
2.5 Management report on the Group Non-financial performance indicators<br />
STEM subjects are Science, Technology,<br />
<strong>Engineering</strong> and Mathematics Mathematics.<br />
98 | 99<br />
Higher participation in Academy programs<br />
Founded in 2006, the ThyssenKrupp Academy is now an established place of teaching, learning and internal<br />
networking for the Group’s top managers. More than 100 programs were available in 2010/2011, and the<br />
number of participants doubled from the prior year. Both the reach and penetration of our programs among<br />
the 2,000 top executives have increased significantly. Alongside the development of management<br />
competencies, this year saw a focus on strategic change and business transformation. The new programs to<br />
prepare our managers for a move up the career ladder were also well attended.<br />
Diversity as a goal of personnel policy<br />
The project ‘diversity@thyssenkrupp’ was launched in fall 2011 to promote diversity in all areas of the<br />
Group, focusing on gender, internationality, capabilities and experience. The aim of the project is to<br />
gradually and sustainably increase diversity within the workforce as a whole and especially at higher<br />
management levels throughout the Group. The new program integrates existing initiatives and HR tools and<br />
promotes a common understanding of diversity. The aim is to increase the proportion of women in our nonpay-scale<br />
managerial staff in Germany from the present level of 7.6% to 15% by the end of 2020. This<br />
target is based on the percentage of women in our overall workforce.<br />
As a technology company, ThyssenKrupp is very interested in recruiting female engineers to specialist and<br />
management positions. We are particularly looking to attract students of the so-called STEM subjects. For<br />
this reason we support the Femtec university career center for women in Berlin and give female engineering<br />
students the opportunity to contact us directly and find out more about our technology company.<br />
In order to help balance family and work commitments we are currently building a child daycare center on<br />
our campus in Essen. From August 2012 we will offer full-day places to over 100 children aged from four<br />
months to six years to support parents working at ThyssenKrupp. Our daycare center “Miniapolis” will<br />
nurture children’s natural curiosity and joy of discovery, in particular in the areas of science and technology.<br />
Environment and climate<br />
The Executive Board has identified responsible environmental and climate protection as an important<br />
corporate objective. To implement this goal we have further expanded our Groupwide environmental and<br />
climate management system. In addition our international environmental and climate protection activities<br />
will be coordinated by corporate headquarters in the future.<br />
Our environmental and climate management system defines uniform requirements to be met by our Group<br />
companies around the world, improves internal reporting, and promotes Groupwide knowledge sharing. The<br />
Group’s environmental and climate protection experts meet up regularly. In addition current developments,<br />
best practices, and environmental and climate legislation are discussed at regional meetings.
2.5 Management report on on the Group Non-financial performance indicators indicators<br />
Ongoing expenditure on<br />
environmental protection<br />
2010/2011<br />
in %<br />
42<br />
Water<br />
protection<br />
35<br />
Air<br />
pollution<br />
control<br />
36<br />
3<br />
Noise<br />
control/<br />
nature<br />
conservation<br />
20<br />
Recycling<br />
The Group companies have environmental management systems tailored to their specific requirements.<br />
Those companies whose production has a major environmental and climate impact generally already have<br />
environmental management systems certified to the international ISO 14001 or a comparable standard.<br />
Continuous improvements are made in the areas of waste and recycling, air, noise, energy and climate, soil,<br />
water and nature to ensure responsible environmental protection at our locations. In the reporting year<br />
priority was given to measures to increase resource and energy efficiency.<br />
Environmental and climate protection expenditures higher<br />
We spent €352 million on new environmental protection facilities in the reporting year, while operating costs<br />
totaled €539 million. In the prior year these figures were €238 million and €532 million respectively. The<br />
start-up of Steel Americas’ new plants in Brazil and the USA was one of the main reasons for the increase in<br />
spending. We employ state-of-the-art technology at these plants to meet our high environmental standards.<br />
Ongoing expenditure on environmental protection in million €<br />
2006/2007 2007/2008 2008/2009 2009/2010 2010/2011<br />
100<br />
Change<br />
in %<br />
Air pollution control 183 182 162 191 188 (2)<br />
Water protection 204 201 195 226 224 (1)<br />
Noise control/nature conservation 24 16 13 19 18 (5)<br />
Recycling 109 112 84 96 109 14<br />
Total 520 511 454 532 539 1<br />
High energy efficiency<br />
Climate protection and energy efficiency are established components of our Group strategy. Our engineering<br />
capabilities enable our customers to use innovative products to save energy and conserve resources.<br />
Our steelmaking operations utilize the most advanced technologies available and have lowered CO2<br />
emissions significantly. The sophisticated energy management systems in place at our steel mills in<br />
Duisburg create an energy network that substantially cuts emissions, for example by utilizing byproduct<br />
gases from steel production, as well as waste heat and steam. The use of reducing agents in our blast<br />
furnaces in Duisburg is already close to the chemical-technical optimum. With an adjusted figure of around<br />
1.7 tons of CO2 per ton of crude steel, ThyssenKrupp is well below the international steel industry average.<br />
In addition, the energy saving program introduced at our German steel sites in 2009 has identified further<br />
savings potential of almost 350,000 tons of CO2 and around €59 million per year which is gradually being<br />
exploited. We are working to create a similar energy network in Brazil.
Management report on the Group<br />
2.5/2.6 Management report on the Group Non-financial performance indicators/Subsequent events events<br />
Corporate citizenship<br />
100 | 101<br />
ThyssenKrupp supports the people in the communities in which we operate. We help create a positive<br />
environment and promote education and enthusiasm for technology especially among the younger<br />
generation – all this is a matter of course for us and creates value for both company and society. In line with<br />
our long-standing traditions, we regard ourselves as an active corporate citizen and support initiatives<br />
around the world through donations, sponsorships and other means.<br />
Long-term and trusting partnerships are central to our successful cooperation with various groups in society.<br />
This includes numerous longstanding major projects such as the “Discovering Future Technology” initiative,<br />
cooperation with the “Jugend forscht” young scientists’ competition and membership of the “Initiativkreis<br />
Ruhr”. In 2010/2011 we once again staged regional heats of “Jugend forscht” in Dortmund and Duisburg<br />
and acted as a partner to the regional heat in the Saarland area. We also organize donation appeals in<br />
response to major natural disasters or other emergency situations – this reporting year in East Africa, for<br />
example – to allow our employees and companies to provide united support.<br />
Subsequent events<br />
There were no reportable events.
2.7 Management report on the Group Expected developments and and associated opportunities and and risks risks<br />
Expected developments<br />
and associated opportunities<br />
and risks<br />
ThyssenKrupp enters the new fiscal year with confidence. Although the<br />
economic environment is growing increasingly difficult and is marked<br />
by great uncertainties, we aim to maintain sales from continuing<br />
operations at the prior-year level in 2011/2012. We will continue to<br />
drive forward the Group’s strategic development.<br />
Turbulence on the financial markets will<br />
will again again impact impact the the real real economy economy in 2012.<br />
in 2012.<br />
Economic outlook<br />
Economic forecasts subject to great uncertainties<br />
Expectations for the economy as a whole and the individual sectors in 2012 are marked by great<br />
uncertainties. For the industrialized countries in particular, the risk of a further slowdown has increased. The<br />
main reasons for this are the turbulence on the financial markets and the consequences of the sovereign<br />
debt crisis. On the other hand, despite now noticeable signs of weakening most emerging countries are still<br />
showing relatively solid growth, which limits the risk of a global recession.<br />
Gross domestic product 2011*, 2012*<br />
Real change compared to previous year in %<br />
Euro zone<br />
Germany<br />
Russia<br />
Rest of Central/Eastern Europe<br />
2011 2012 * Forecast<br />
USA<br />
Brazil<br />
Japan<br />
China<br />
India<br />
Middle East<br />
World<br />
(0.5)<br />
0.5<br />
1.0<br />
1.6<br />
1.6<br />
2.0<br />
2.5<br />
2.9<br />
3.7<br />
3.9<br />
3.2<br />
3.0<br />
3.4<br />
3.3<br />
3.7<br />
3.9<br />
5.3<br />
6.2<br />
8.1<br />
7.6<br />
7.7<br />
9.4<br />
102
Management report on the Group<br />
2.7 Management report on the Group Expected developments and associated opportunities and risks<br />
The global global automotive market will will continue<br />
to continue show moderate to show moderate growth in 2012. growth in<br />
2012.<br />
102 | 103<br />
For 2012 we expect global economic growth to remain at roughly the same level as the previous year. The<br />
emerging countries should expand by just under 6% altogether, the industrialized countries by only around<br />
1.5%. For 2013 we anticipate a similar pattern.<br />
In the euro zone GDP is expected to grow by only 0.5% in 2012, hampered by the pressure to consolidate<br />
public budgets and cautious capital investment. For Germany we expect an increase of 1.0% - driven mainly<br />
by consumer and business spending.<br />
In the USA economic growth could pick up slightly to 2.0% in 2012. It is not yet possible to assess what<br />
effects any further government stimulus programs may have. In Japan the catch-up process after the<br />
natural disaster will lead to an expansion of 2.5%.<br />
The emerging markets will remain the growth driver of the global economy in 2012. GDP growth of 8.1% is<br />
forecast for China. The other BRIC countries, too, are expected to show solid growth rates.<br />
Industrial sectors mainly with growth<br />
Flat carbon steel – The global steel market will remain on an upward trend in 2012. However, Europe and<br />
NAFTA are expected to show little if any growth in steel consumption against the background of slowing<br />
economic momentum. The main impetus will again come from the emerging markets in Asia, Latin America<br />
and the Middle East. In particular in China there are no signs that the demand growth will slow to any<br />
notable extent. With capacities in China and other emerging countries still increasing, steel production will<br />
continue to expand, so the situation on the raw materials markets is unlikely to ease significantly in 2012.<br />
The costs for input materials in steel production will therefore remain generally high. Global finished steel<br />
demand will rise by 5% in 2012; this corresponds to crude steel production of around 1.6 billion metric tons.<br />
Steel demand in Germany will at most be only slightly higher year-on-year at 40 million metric tons.<br />
Automotive – The international auto market will remain on a moderate growth track in 2012. Worldwide<br />
production of cars and light trucks is expected to increase by around 4% year-on-year to 77.4 million. In the<br />
USA and Japan catch-up demand will trigger above-average expansion rates of 6% and 19%, respectively.<br />
In China government curbs will restrict growth to just below 6%. Very subdued growth of only 2% is forecast<br />
for the Western European auto industry. Production in Germany will probably stagnate at the level of 2011.<br />
Machinery – The machinery sector will not maintain its very high rate of expansion in 2012, with capital<br />
spending in several countries subdued. Growth could slow to 6% in the USA, and is also expected to soften<br />
slightly in China to 13%. By contrast, production in Japan is expected to be 8% higher after the decline in<br />
the prior year. In Germany, a moderate increase of 3% on the back of still high order backlogs is forecast,<br />
which means German production will remain high. The German plant engineering sector also has a good<br />
workload for 2012.
2.7 Management report on the Group Expected developments and and associated opportunities and and risks risks<br />
Implementing the Strategic Way Forward<br />
and improving our financial situation are are<br />
our main goals for 2011/2012.<br />
Important sales markets<br />
Demand for finished steel, million t<br />
104<br />
2011* 2012*<br />
World 1,398 1,474<br />
Germany 39 40<br />
USA 89 94<br />
China 643 682<br />
Vehicle production, million cars and light trucks<br />
World 74.1 77.4<br />
Western Europe 15.0 15.3<br />
Germany 6.1 6.1<br />
USA 8.5 9.0<br />
Japan 7.4 8.8<br />
China 16.1 17.0<br />
Brazil 3.5 3.8<br />
Machinery production, real, in % versus prior year<br />
Germany 15.0 3.0<br />
USA 13.0 6.0<br />
Japan (2.0) 8.0<br />
China 15.0 13.0<br />
Construction output, real, in % versus prior year<br />
Germany 3.6 1.7<br />
USA 1.6 3.1<br />
China 10.4 9.9<br />
* Forecast<br />
Construction – Construction activity will continue to show regional differences in 2012. In Western Europe<br />
little more than stagnation is expected, while the prospects for some Central and Eastern European countries<br />
remain brighter. After the deep slump of previous years, the US construction sector could make a slight<br />
recovery with growth of around 3%. Construction activity in India and China will remain strong, with growth<br />
rates of 8% and 10%, respectively.<br />
Expected results of operations<br />
As already reported, effective September 30, 2011 the legal, organizational and contractual conditions were<br />
created for the separation of the Stainless Global business area; it is thus now classified as a discontinued<br />
operation. The following forecast therefore relates exclusively to the Group’s continuing operations, which no<br />
longer include Stainless Global.<br />
Sales and earnings – In fiscal 2011/2012 priority will continue to be given to the implementation of the<br />
Group’s Strategic Way Forward. This integrated strategy encompassing portfolio optimization, change<br />
management and a strong focus on performance is aimed at improving the Group’s financial situation and<br />
increasing our strategic latitude. The corporate program impact is the central platform for this.
Management report on the Group<br />
2.7 Management report on the Group Expected developments and associated opportunities and risks<br />
104 | 105<br />
Our business performance in 2011/2012 will be characterized to a very large extent by the possible impact<br />
of the financial crisis on our core markets in Europe and the NAFTA region, the scope of which cannot be<br />
reliably assessed at this time. The Group takes these uncertain parameters into account in its outlook.<br />
Our expectations for sales and earnings from continuing operations (adjusted EBIT) compared with the prior<br />
year are currently as follows:<br />
In the event of stagnation in our core markets we expect the Group’s sales to remain at the prior-year level<br />
provided there are no major dislocations on the raw materials markets.<br />
Earnings from the Materials business units should improve as a result of the ramp-up at Steel Americas; this<br />
will be partly offset by the absence of prior-year earnings effects from raw material-driven price increases at<br />
Steel Europe and Materials Services. At our less cyclical Technologies businesses Elevator Technology, Plant<br />
Technology and Marine Systems, earnings should be stable; however at Marine Systems the positive<br />
nonrecurring effects of the prior year will not be repeated. At Components Technology there could be a slight<br />
decline in capacity utilization.<br />
In the event of a slight downturn in our core markets we expect sales and earnings to slip, but after-tax<br />
income from continuing operations should remain positive.<br />
Our goal in the 2011/2012 fiscal year continues to be to reduce complexity in the Group, cut costs, and<br />
improve cash generation on a sustainable basis. In addition we will strive to lower our net financial debt.<br />
In the 2012/2013 fiscal year we will work on the structural improvement of the Group and rigorously<br />
implement our integrated strategic development plan. This may include among other things measures to<br />
achieve sustainable cost reductions or to optimize the portfolio.<br />
Provided the economic effects of the sovereign debt crisis do not extend into our 2012/2013 fiscal year, we<br />
expect our sales to increase with the general growth in the economy. Offsetting effects could result from<br />
portfolio measures. Rising sales and structural improvements should have a correspondingly positive impact<br />
on earnings. Further upside potential should come from operating improvements at Steel Americas. We will<br />
continue to strive to reduce our net financial debt.<br />
Dividend – We will maintain our policy of dividend continuity and continue to pay an appropriate dividend.<br />
Employees – Based on our current plans, we will maintain our workforce level and also recruit additional<br />
employees in individual regions and business areas. This does not include future portfolio measures.<br />
To meet our long-term requirements for skilled employees, we will further expand our personnel programs.<br />
In particular our training offering for young people will remain at its usual high level.<br />
Research and development – Innovations and new technologies are a key element of the corporate<br />
program impact. We therefore aim to increase research and development efforts in all areas of the Group.
2.7 Management report on the Group Expected developments and and associated opportunities and and risks risks<br />
The Group’s Group’s financing financing and liquidity will will<br />
remain on a solid basis in in 2011/2012.<br />
Alongside numerous customer-related development projects, the focus will increasingly be on basic<br />
research and development work.<br />
Procurement – Materials expense is expected to amount to around 60% of sales. We expect to continue to<br />
avoid delivery bottlenecks in the future by strengthening our long-standing supplier relationships and further<br />
optimizing our international purchasing operations.<br />
Energy – Energy supplies to our worldwide plants are secured. In Germany we have already agreed prices<br />
and volumes to secure a high portion of our electricity and natural gas requirements; compared with the<br />
past fiscal year we will significantly improve our cost position.<br />
Environmental protection – In the new fiscal year we expect the amounts we spend on ongoing<br />
environmental protection to be comparable with 2010/2011. The greater part of this will again relate to air<br />
pollution control and water protection measures. Capital expenditure is expected to decrease slightly<br />
because in 2010/2011 some of the expenditure resulted from the completion of the facilities in Brazil and<br />
the USA.<br />
Expected financial and liquidity situation<br />
Despite the problems on the European financial markets and the associated difficult conditions, our<br />
financing and liquidity will remain on a solid basis in fiscal 2011/2012. Net financial debt is likely to vary<br />
significantly in the course of the year. With our major projects – the new steel mill in Brazil and the new<br />
production and sales location in the USA – and the capacity optimization program at the Duisburg location<br />
all in the ramp-up phase, capital spending is back below the level of the prior years and is expected to<br />
remain at this level in 2012/2013.<br />
Opportunity report<br />
Identifying opportunities in market and technology trends and incorporating them into the Group’s strategy<br />
going forward is a key element of our Groupwide strategic dialogue. The business areas carry out SWOT<br />
analyses to identify the relevant strengths, weaknesses, opportunities and threats for their operating units.<br />
An opportunity reporting system is being developed that will feed into the business areas’ standard monthly<br />
reports. The management of our opportunities is a task shared by all the Group’s decision makers – from<br />
the Executive Board of ThyssenKrupp AG to the business area management boards and managements of<br />
the Group companies through to the project leaders with responsibility for markets.<br />
Strategic opportunities for the Group<br />
The global growth areas of demographic change, urbanization and globalization offer wide-ranging<br />
opportunities for ThyssenKrupp. With our high-quality products, sophisticated innovations and efficient<br />
production sites we see good opportunities for growth particularly in the international markets, in which we<br />
position ourselves as a premium supplier.<br />
106
Management report on the Group<br />
2.7 Management report on the Group Expected developments and associated opportunities and risks<br />
Pages 108–119<br />
Pages 50–54<br />
106 | 107<br />
In pursuing our Strategic Way Forward, we will use our leading engineering expertise in the application areas<br />
“Materials”, “Mechanical” and “Plant” and expand our business in the growth markets of the world, for<br />
example Asia. However if the global economy were to weaken, it would take us longer to utilize these<br />
opportunities. The associated risks are addressed in the risk report.<br />
In parallel with our strategic growth we will evolve our organizational structure and further improve our<br />
internal structures and processes. The corporate program impact will increase the Group’s efficiency and<br />
reduce costs. Together with business area-specific programs this will contribute to the sustainable success<br />
of the Group. Detailed information on our corporate strategy including impact is provided in the section<br />
“Strategic Way Forward”.<br />
Operating opportunities of the continuing business areas<br />
Steel Europe – The increasing urbanization and mobility of societies and the modernization of the energy<br />
infrastructure offer a wide range of opportunities for the use of high-quality steel products. Steel Europe’s<br />
portfolio of products and services is already geared to this. In addition, the business area is further<br />
optimizing its cooperation with Steel Americas. With the extensive program of measures “Steel in Transition<br />
– Managing the Triangle” the implementation of the transatlantic steel strategy is being driven forward in<br />
close cooperation with Steel Europe. Key points of contact here are in knowledge transfer and joint raw<br />
materials purchasing. The main aim of the program is to transfer Steel Europe’s successful premium<br />
business model to the North American Market and to build a global supply chain network for slabs in the<br />
Brazil-USA-Europe triangle.<br />
Steel Americas – Improving production and logistics processes, in particular through the “Steel in<br />
Transition” program, and enhancing market penetration are the approaches identified for Steel Americas.<br />
Continuous market monitoring, global key account management and intensive technical customer support<br />
should help us utilize new market and sales opportunities. Our attractive product mix and service portfolio<br />
can open up promising prospects for accessing the North American market. As major US steel users<br />
increasingly set up new plants in the south of the USA, this could expand our customer base.<br />
Materials Services – As producers and fabricators continue to concentrate increasingly on their core<br />
activities, services from Materials Services will gain further in importance. Our advantages lie in our strong<br />
customer focus, specific knowledge of markets and sectors, global connections and wide-ranging project<br />
management expertise.<br />
Elevator Technology – The Elevator Technology business area has been a leading player on the world<br />
market for elevators, escalators, moving walks, passenger boarding bridges and stair and platform lifts for<br />
many years. This market will continue to offer potential for growth and profit in the future. To tap into this we<br />
are further expanding our range of products – for standard installations, customized solutions as well as<br />
service and modernization packages. Key to this is our tight-knit sales and service network with more than<br />
900 locations around the globe.
2.7 Management report on the Group Expected developments and and associated opportunities and and risks risks<br />
We continue to consider the risks to to the<br />
the Group Group contained and and manageable.<br />
Plant Technology – We see good opportunities for growth in Plant Technology thanks to our mastery of<br />
complete process chains and our long experience in dealing with process-related tasks. In addition,<br />
constant innovations are strengthening our technology portfolio. One example is heat recovery and waste<br />
recycling in cement production, which allows major reductions in costs and emissions. There are good<br />
opportunities for cost-efficient and environmentally friendly plants especially in the emerging countries.<br />
Components Technology – The auto components business of our Components Technology business area<br />
can profit from drivers’ growing environmental awareness: Our components for low-emission engines and<br />
weight-optimized parts reduce vehicle CO2 emissions.<br />
Marine Systems – We see opportunities for moderate growth in our target markets for conventional<br />
submarines and surface naval vessels. Further focusing on our core products will help the business area<br />
profitably expand its remaining operations.<br />
Performance-related opportunities in costs and quality<br />
In addition to the increasing use of electronic purchasing systems, new production processes offer major<br />
performance-related opportunities, above all for gaining cost and quality advantages. In the steel area a<br />
new coating technique improves the forming behavior of galvanized sheet. Our production process for<br />
succinic acid as a feedstock for biobased plastics opens up new ways of utilizing renewable resources. In the<br />
area of marketing we are optimizing relationships with our customers and maintaining our worldwide<br />
network of branches.<br />
Risk report<br />
In the past fiscal year the Group’s standardized risk management system again played a major role in<br />
increasing the transparency of the risk situation at ThyssenKrupp and enhancing our ability to identify,<br />
evaluate and control risks. From the present perspective all risks are contained and manageable. The future<br />
existence of the Company is secured.<br />
Risk policy embedded in corporate strategy<br />
Binding throughout the Group, the risk principles at ThyssenKrupp are based on our corporate strategy. Our<br />
risk management system is targeted at safeguarding existing assets and sustainably increasing the value of<br />
the Company; it therefore fulfills a core business function. To achieve an appropriate increase in value, we<br />
make optimum use of opportunities while consciously and responsibly taking business risks in our core<br />
processes and managing these actively. As part of our efficient risk management, other risks are<br />
transferred, reduced or completely prevented. Overall the Group can extensively cover all risks taken.<br />
The Group Policy Statement on Risk Management documents the framework conditions and responsibilities<br />
for orderly and forward-looking risk management and is binding for all employees. Groupwide codes of<br />
conduct such as the Group’s compliance standards and the prohibition of speculative transactions also form<br />
part of the risk principles. Regular control measures and numerous training programs help communicate the<br />
importance of the requirements to all employees.<br />
108
Management report on the Group<br />
2.7 Management report on the Group Expected developments and associated opportunities and risks<br />
Reporting<br />
Reporting is<br />
is is based<br />
based on<br />
on on § § 315<br />
315 315 subs.<br />
subs. 2 2 no.<br />
no. no. 5 5<br />
German<br />
German GAAP<br />
GAAP (HGB).<br />
(HGB).<br />
108 | 109<br />
Risk management system established throughout the Group<br />
Alongside the risk principles, the Group Policy Statement on Risk Management includes other binding<br />
standards for the risk management process. In various reporting elements we communicate information on<br />
operating and strategic risks in a standardized process which permits the identification, assessment, control<br />
and monitoring of risks. Because it is integrated in the Group’s corporate controlling department, risk<br />
management is also closely interlinked with planning and other reporting processes. Risk maps for all Group<br />
entities are prepared with the help of a web-based reporting tool in which Group companies report on the<br />
status of their risk situation using tiered threshold values, identify risk management measures and update<br />
the early warning indicators for assessing risks.<br />
Risk management<br />
ThyssenKrupp Group<br />
Group management<br />
Compliance/<br />
risk coordination Processes<br />
Operations management<br />
Executive Board<br />
• Establishment of risk<br />
principles and policies<br />
• Focus on material risks<br />
Risk Committee<br />
• Risk monitoring<br />
• Risk management<br />
Corporate Center<br />
Controlling & Risk<br />
• Definition of Group<br />
standards<br />
• Risk reporting<br />
• Integrated with controlling/<br />
risk management in<br />
business areas<br />
Business Areas<br />
• Identification, reporting<br />
and forecasting of<br />
opportunities and risks,<br />
in particular changes in<br />
material risks<br />
Each business area updates its assessment of the opportunities and risks in the current fiscal year on a<br />
monthly basis and provides information on any changes to material risks in the risk map. The material risks<br />
– clearly defined at Group level on the basis of probability of occurrence and loss amounts - are discussed in<br />
the Risk Committee and then communicated in a systematic and transparent report to the Executive Board<br />
and the Supervisory Board Audit Committee.<br />
This standardized and transparent risk management system was introduced by the Executive Board of<br />
ThyssenKrupp AG for the entire Group and has proven itself to be efficient. In addition, ad hoc risks and<br />
losses incurred are communicated directly to the risk management officers outside the normal reporting<br />
channels.<br />
To ensure the efficient monitoring of the risk management system, Corporate Center Internal Auditing carries<br />
out regular audits worldwide. Their findings help us further improve the way risks are managed throughout<br />
the Group. In addition we continuously optimize the tools and methods for registering and managing risks so<br />
as to enhance the quality of the information generated and further strengthen the interlinking of internal<br />
processes.<br />
Key features of the internal control and risk management system<br />
with regard to the Group accounting process<br />
Our internal control system, defined as the entire body of coordinated principles, processes and measures<br />
applied in the Company to ensure business and control objectives are achieved, is continuously optimized to<br />
guarantee the security and efficiency of business management, the reliability of financial reporting, and<br />
compliance with laws and policies.
2.7 Management report on the Group Expected developments and and associated opportunities and and risks risks<br />
Pages 106–108<br />
Pages 106–108<br />
For the accounting process at ThyssenKrupp this means that implemented controls adequately ensure that<br />
despite any risks the consolidated financial statements comply with the requirements. Various integrated<br />
and independent supervision measures are in place to help achieve this aim.<br />
Our consolidated financial statements are prepared on the basis of a standard accounting policy which is<br />
regularly updated and made available to all relevant employees via an internal internet platform. A specially<br />
developed consolidation tool based on standard software is used, which ensures a uniform procedure and<br />
minimizes the risk of false statements in the Group’s financial accounting and external reporting.<br />
Financial reporting is organized in clearly defined sub-processes. Clear-cut responsibilities in line with the<br />
principle of segregating functions and the dual-control principle reduce the risk of fraudulent conduct.<br />
As the department responsible for the preparation of the consolidated financial statements, Corporate<br />
Center Accounting and Financial Reporting issues the decentralized units with binding standards for content<br />
and scheduling so as to safeguard the consistency of accounting practices in the Group and minimize scope<br />
for discretion in connection with the recognition, measurement and statement of assets and liabilities.<br />
In some cases individual decentralized units use the Group’s shared service centers to prepare their local<br />
financial statements. Service center employees and all other employees involved in the accounting process<br />
undergo regular training and receive support.<br />
We control and monitor the relevant IT systems used in the consolidation process on a centralized basis and<br />
perform regular system backups to reduce the risk of data loss and system failure. Automatic controls and<br />
manual checks by experienced employees as well as custom authorizations and access controls are part of<br />
a security system designed to protect finance systems against misuse.<br />
Corporate Center Internal Auditing is also involved in the overall process in that it regularly checks the<br />
efficiency of the internal control and risk management system in the accounting processes.<br />
The overall package of processes, systems and controls provides sufficient guarantee that the Group<br />
accounting process is carried out reliably and in compliance with IFRS, German GAAP (HGB) and other<br />
standards and laws of relevance to accounting.<br />
Utilizing opportunities and simultaneously managing risks<br />
When we see and wish to utilize appropriate opportunities in connection with our strategic decisions, we take<br />
risks responsibly in compliance with the requirements of the risk principles and make the necessary<br />
provision to cover risks. Details of how we systematically identify, evaluate, manage and control<br />
opportunities are presented in our opportunity report.<br />
110
Management report on the Group<br />
2.7 Management report on the Group Expected developments and associated opportunities and risks<br />
110 | 111<br />
Risk transfer by central service provider<br />
As central service provider, ThyssenKrupp Risk and Insurance Services again handled the Groupwide<br />
transfer of risks to insurers in 2010/2011. The scope and structure of insurance cover is determined on the<br />
basis of risk assessments in which insurable risks at the Group companies are identified, evaluated and<br />
reduced or removed through asset-specific protection plans. Depending on the Group’s risk-bearing ability,<br />
we agree appropriate deductibles for individual classes of insurance.<br />
To keep risk prevention at a sustainable and appropriately high level, binding standards are in place for all<br />
Group companies. These standards were developed by experts from all areas of the Group under the<br />
leadership of ThyssenKrupp Risk and Insurance Services and are updated on an ongoing basis. Internal and<br />
external auditors regularly check compliance with these standards.<br />
To limit the risk of insurer insolvency, we spread the risk over numerous insurers taking into account the<br />
ratings given to these insurers by recognized agencies.<br />
Financial risks<br />
Central responsibilities of ThyssenKrupp AG as parent company include the coordination and management<br />
of financial requirements within the Group and securing the financial independence of the Company as a<br />
whole. To this end we optimize Group financing and limit the financial risks. Risks in the individual financial<br />
risk areas are minimized through an ongoing process of monitoring and intensive controls.<br />
Credit risk (default risk): We enter into financial instrument transactions in the financing area only with<br />
counterparties who have a very high credit standing and/or are covered by a deposit guarantee fund.<br />
Transactions are concluded only within specified counterparty risk limits. Outstanding receivables and<br />
default risks in connection with supplies and services are constantly monitored by the Group companies; in<br />
some cases they are additionally insured under commercial credit policies. The credit standing of key<br />
account customers is monitored particularly closely.<br />
Liquidity risk: To secure the solvency and financial flexibility of the Group at all times, we maintain longterm<br />
credit facilities and cash funds on the basis of a multi-year financial planning system and a liquidity<br />
planning system on a rolling monthly basis. The cash pooling system and external financings are<br />
concentrated mainly on ThyssenKrupp AG and specific financing companies. We use the cash pooling<br />
system to allocate resources to Group companies internally according to requirements.<br />
Market risk: Various measures are used to mitigate or eliminate the risk of fluctuations in the fair values or<br />
future cash flows from non-derivative or derivative financial instruments due to market changes. These<br />
mainly include off-exchange-traded foreign currency forward contracts, interest-rate swaps, interestrate/foreign<br />
currency derivatives and commodity forward contracts with banks and commercial partners. To<br />
hedge against commodity price risks we also use exchange-traded futures. The use of derivative financial<br />
instruments is extensively monitored, with checks being carried out on the basis of policies in the framework<br />
of regular reporting.
2.7 Management report on the Group Expected developments and and associated opportunities and and risks risks<br />
We hedge all foreign currency positions<br />
at the time of their inception.<br />
We hedge all foreign currency positions at<br />
the time of their inception.<br />
Pages 116–119<br />
Pages 116–119<br />
Currency risk: To contain the risks of our numerous payment flows in different currencies – in particular in<br />
US dollars – we have developed Groupwide policies for foreign currency management. All companies of the<br />
Group are required to hedge foreign currency positions at the time of their inception; companies based in the<br />
euro zone hedge via our central clearing office. Translation risks arising from the conversion of foreign<br />
currency positions are generally not hedged.<br />
Interest rate risk: To cover our capital requirements, we procured funds on the international money and<br />
capital markets in different currencies and with various maturities. The resulting financial liabilities and our<br />
financial investments are partially exposed to risks from changing interest rates. To manage these risks,<br />
regular interest rate risk analyses are prepared, the results of which feed into our risk management system.<br />
Order risks<br />
Cost overruns and/or schedule delays can occur in the handling of major orders. We counter these risks by<br />
deploying experienced project managers and continuously improving our management instruments. We<br />
select our customers carefully and minimize the risk of default by collecting progress payments.<br />
Sales risks<br />
As a global industrial group, ThyssenKrupp is dependent on the international economic situation. Especially<br />
in the currently weakening global economy, we closely monitor economic trends in our sales regions in order<br />
to minimize the market risks. If necessary we have a package of measures at our disposal, for example an<br />
immediate adjustment of our capacities.<br />
Our international presence in different sectors and our widely differentiated product and customer structure<br />
make us largely independent of regional crises on our sales markets. Our effective receivables management<br />
system counters the risk of bad debt and continuously monitors the credit rating of our customers. More<br />
details on sales risks are provided in the section headed “Specific risks for our operations”.<br />
Risks associated with business relationships with customers in countries with trade restrictions<br />
Due to our global organization, ThyssenKrupp has business relationships in countries subject to trade<br />
restrictions. In 2010 the Federal Republic of Germany, the EU and the USA, acting on the basis of UN<br />
Resolution 1929, expanded existing trade restrictions on the Islamic Republic of Iran to include the<br />
petroleum sector, and added further individuals and a number of banks to the sanctions lists to prohibit<br />
business with them. Violations of the tightened trade restrictions are subject to severe penalties and could<br />
damage ThyssenKrupp’s reputation. We have always complied scrupulously with export control regulations<br />
and in particular trade restrictions. In addition, the Executive Board of ThyssenKrupp AG ordered a review of<br />
the business activities with Iranian customers in existence before the tighter trade restrictions came into<br />
effect to establish whether they comply with the new laws. In September 2010 it was decided that<br />
ThyssenKrupp will not enter into any new transactions with Iranian customers. This measure significantly<br />
reduces the risk of a potential violation of trade restrictions. In addition, an Elevator investment in Iran has<br />
been sold.<br />
112
Management report on the Group<br />
2.7 Management report on the Group Expected developments and associated opportunities and risks<br />
Pages 177-185 177–185<br />
The effectiveness of of our compliance<br />
program was audited by by KPMG in in 2011;<br />
more information on compliance and and<br />
KPMG's KPMG‘s report can be be found on on the the internet<br />
at internet www.thyssenkrupp.com/en/konzern/<br />
at www.thyssenkrupp.com/en/<br />
compliance.html<br />
konzern/ compliance.html<br />
112 | 113<br />
Procurement risks<br />
Depending on the market situation, prices for raw materials and energy can fluctuate significantly. We<br />
safeguard our competitiveness by adjusting purchasing prices and securing alternative procurement<br />
sources. The geographical distribution of orders makes us less vulnerable to regional supply bottlenecks. To<br />
hedge against raw material price swings, in particular for nickel and copper, we also use derivative financial<br />
instruments – mainly commodity forward transactions. The use of these instruments is subject to strict<br />
rules. Details of these risk areas are provided in the Notes.<br />
The energy transition in Germany will permanently increase the price of electricity with the rise in the share<br />
of renewable energies and the associated need to expand the electricity grids. On top of this there are costintensive<br />
regulatory requirements for the electricity and gas networks of our major production locations. To<br />
counter the risk of rising energy prices we pursue a structured energy procurement policy. Furthermore all<br />
business areas are further increasing their efforts to save energy and recycle waste so as to prevent<br />
greenhouse emissions and conserve natural resources.<br />
Risks associated with acquisitions, disposals and restructurings<br />
Active portfolio management is a key element of our corporate development. We constantly monitor and if<br />
necessary make provision in the balance sheet for risks associated with the disposal or acquisition of<br />
companies, business activities and real estate and with restructurings.<br />
Legal risks associated with third-party claims<br />
Claims can result in legal risks. In the associated legal proceedings ThyssenKrupp is represented by its own<br />
experienced corporate counsel, if necessary with the additional support of external attorneys. We minimize<br />
claims for damages under product liability law through the high quality of our products.<br />
When contractual partners assert claims against ThyssenKrupp under plant construction, supply and service<br />
contracts, we examine the individual claims carefully and make provision where payment obligations are<br />
considered likely.<br />
Our strict compliance program reduces the risk of antitrust violations and corruption at all levels of the<br />
Group. In the Compliance Commitment the Executive Board of ThyssenKrupp AG states that antitrust<br />
violations and corruption are not tolerated in the Group. We monitor and regularly update our supplementary<br />
policies and publications as well as our internal compliance organization.<br />
We have separated the legal counsel service from compliance in terms of organization and staff. Within<br />
compliance the advisory function was also segregated from general principles and compliance<br />
investigations. In May 2011 we resolved further measures which will be implemented in the framework of a<br />
multi-year program. These measures include an increase in the number of employees in the compliance<br />
organization, namely by appointing regional compliance officers in selected regions.<br />
We appointed KPMG AG to audit our compliance program to auditing standard 980 of the Institute of Public<br />
Auditors in Germany (Institut der Wirtschaftsprüfer e.V.) for the period April to September 2011. The audit<br />
covered the structure, implementation and in particular the effectiveness of our compliance program, and<br />
was therefore the most extensive audit possible under IDW PS 980. Due to the special rules applying in the<br />
USA, the subsidiaries in this country were not part of the audit. KPMG confirmed that the compliance<br />
management system at ThyssenKrupp AG is appropriately implemented and was effective in the period<br />
reviewed. Insofar as recommendations for compliance work were made on the basis of the audit findings,<br />
their implementation is being examined.
2.7 Management report on the Group Expected developments and and associated opportunities and and risks risks<br />
Pages 174-176 174–176<br />
Pages 99–100. 99–100<br />
In extensive training programs and an interactive compliance e-learning program, we inform our employees<br />
about compliance requirements, infringement risks and potential sanctions. In 2010/2011 more than 3,500<br />
employees worldwide took part in classroom training sessions. To supplement the compliance training<br />
program, we have introduced a Groupwide interactive e-learning program comprising modules on<br />
competition law and combating corruption, which is available in eleven languages. The second cycle of the<br />
e-learning program which started in August 2008 is aimed at refreshing the knowledge of employees who<br />
have taken part previously and for the first time training employees outside Europe. Since the launch of the<br />
second cycle, 25,600 employees worldwide have completed online training courses on competition law and<br />
anti-corruption policies.<br />
A report on pending litigation and claims for damages can be found in the Notes.<br />
Regulatory risks<br />
Our business operations are in some cases closely dependent on the legal framework at national or<br />
European level. Developments such as changes to competition rules in individual sections of the markets<br />
can involve risks for us and lead to higher costs or other disadvantages. To contain these risks we maintain<br />
close working contact with the relevant institutions to prevent distortion of competition.<br />
Based on model calculations, we will face substantial costs for emission allowances in the third trading<br />
period of the EU Emissions Trading Scheme from 2013 to 2020. As an energy-intensive industrial and<br />
services group we face earnings risks if we are unable in the competitive international market to pass on to<br />
our customers all or any of the additional costs. ThyssenKrupp participates both directly and via industry<br />
associations in the discussion process on politically desired energy price surcharges.<br />
Environmental risks<br />
Due to the production processes in our industrial plants, we are exposed to process-related risks that can<br />
lead to air and water pollution. ThyssenKrupp continuously invests in sustainable environmental protection<br />
in our production operations so as to conserve resources and minimize environmental impact over the long<br />
term. Many Group companies have established certified environmental management systems which reduce<br />
the risk of environmental damage.<br />
Some of our real estate no longer used for operations is subject to risks from past pollution and mining<br />
subsidence which we contain with preventive measures and scheduled remediation work. Our real estate<br />
area recognizes adequate provisions for this every fiscal year.<br />
Risks associated with information security<br />
We continually review our information technologies to ensure the secure handling of IT-based business<br />
processes and reduce risks. If necessary, the systems are updated and protected even more effectively.<br />
Further, measures are in place to maximize information security awareness and provide the necessary<br />
technical support for all employees. The IT-based integration of business processes is subject to the<br />
condition that the risks involved for our Group companies and business partners are minimized. In the<br />
reporting year we therefore again carried out extensive measures to further improve our security standards<br />
and our information security management system.<br />
114
Management report on the Group<br />
2.7 Management report on the Group Expected developments and associated opportunities and risks<br />
Pages 96–99.<br />
Pages 96–99<br />
Pages 102-104<br />
Pages 102–104<br />
114 | 115<br />
Various business processes and data centers attained security certification which documents the standard<br />
achieved for our customers. In the new ThyssenKrupp Quarter in Essen we raised the standard of security<br />
significantly: By incorporating state-of-the-art technologies from the planning stage we were able to achieve<br />
an appropriate level of protection. Regular tests are carried out – in some cases with external support – to<br />
check whether our IT infrastructure is vulnerable to hacking. If necessary increased protection is introduced<br />
immediately. In addition we have established a Groupwide program to guarantee segregation of duties in<br />
ERP (Enterprise Resource Planning) systems in accordance with the principle of dual control. This minimizes<br />
risks for numerous business processes at authorization level.<br />
Together with the Group’s data protection officer, our experts ensure that personal data are processed only<br />
in accordance with the rules of the German Data Protection Act. All these measures allow us to continue to<br />
protect the Group’s business data as well as the privacy of our business associates and employees through<br />
preventive action and to respond appropriately to potential new risks.<br />
Risks associated with pensions and healthcare obligations<br />
The fund assets used to finance pension liabilities are exposed to capital market risks. To minimize these<br />
risks, the individual investment forms are selected and weighted on the basis of studies by independent<br />
experts. The aim is to adjust the investments to ensure that the associated pension liabilities are<br />
permanently fulfilled in respect of the current and future income from the investments. Pension obligations<br />
are subject to risks from increased life expectancies of beneficiaries and from obligations to adjust pension<br />
amounts on a regular basis. In addition, the cost of healthcare obligations in the USA may increase.<br />
Furthermore, in some countries there is a risk of significantly higher payments having to be made to finance<br />
pension plans in the future due to stricter statutory requirements. In individual cases, the premature<br />
cancellation of a pension plan may necessitate an additional allocation.<br />
Personnel risks<br />
Our staff and managers with their commitment to ThyssenKrupp are of central importance to our success.<br />
To find key personnel to fill vacancies and avoid losing competent employees, we position ourselves as an<br />
attractive employer and promote the long-term retention of employees in the Group. We offer executives an<br />
ongoing management development program, career prospects and attractive incentives, while our staff<br />
receive targeted mentoring. We inform interested young people about career opportunities at ThyssenKrupp<br />
from an early stage and support apprentices as they start work. Our cooperation with key universities and<br />
early contacts with talented students also help us secure the young people we need for our workforces.<br />
General economic risks<br />
We expect further growth of the global economy in 2012. However, our forecasts are subject to great<br />
uncertainties. For the industrialized countries there is a risk of a further slowdown in the economy, in<br />
particular on account of the debt crisis in some countries and the associated turbulence on the financial<br />
markets. If growth in the emerging countries fails to match expectations, the risk of a global economic<br />
downturn will increase. This would impact demand on the markets important to us.
2.7 Management report on the Group Expected developments and and associated opportunities and and risks risks<br />
The “Steel in Transition” program helps<br />
Steel Americas contain risks.<br />
The “Steel in Transition” program helps<br />
Steel Americas contain risks.<br />
Specific risks for our operations<br />
Steel Europe – Risks going forward for the business area include in particular risks on the sales and<br />
procurement markets as well as risks from exchange-rate fluctuations and emissions trading. If the<br />
economic situation deteriorates, the risk of customer insolvencies increases. High capacity utilization<br />
increases the risk of production losses.<br />
To contain the risk of cyclical demand fluctuations, the business area optimizes its costs in all areas, adjusts<br />
production promptly, and concentrates on high-end market segments subject to lower cyclicality. To mitigate<br />
the risk of customer insolvencies, Steel Europe monitors the situation intensively and uses all the options<br />
available to safeguard deliveries, for example through commercial credit insurance facilities or adjusted<br />
payment conditions. Quality and supply risks are minimized through the ongoing optimization of our value<br />
chains.<br />
A business and technical risk controlling system for property insurance is an integral component of the risk<br />
management process. Additional investment and maintenance budgets are available to further optimize fire<br />
prevention. The risks of other business interruptions are reduced by ongoing preventive maintenance,<br />
modernization and investment. In the event of business interruptions, business continuity plans are in place<br />
which specify measures for remedying damages.<br />
Steel Americas – Alongside risks on the sales and procurement markets and risks from exchange rate<br />
fluctuations, the risks in this business area include risks in connection with the ramp-up and operation of<br />
facilities and production operations.<br />
At the two major Steel Americas plants in Brazil and the USA, delays or quality problems could still occur in<br />
the further course of the ramp-up. However, thanks to intensive controls and tight risk management as well<br />
as regular risk meetings and reports, all material risks are immediately identified and suitable<br />
countermeasures initiated.<br />
Our efficient claims management system ensures that all claims of our contractual partners are properly<br />
handled and managed. ThyssenKrupp is involved in legal, arbitrational and out-of-court disputes in<br />
connection with the construction of the melt shop and coke plant in Brazil which could lead to compensation<br />
payments.<br />
Operating risks which may occur in connection with the ongoing ramp-up are minimized by tailored and<br />
coordinated ramp-up periods, the careful selection and training of new employees, and the use of know-how<br />
from the Steel Europe business area.<br />
In close cooperation with the Steel Europe business area – in the joint “Steel in Transition” program – Steel<br />
Americas is working to contain the price and volume risks in the procurement of raw materials and the<br />
implementation of the premium strategy. This involves for example the transfer of best practice knowledge<br />
and the use of synergy effects. Both these measures also reduce cost risks from consumption variances as<br />
well as risks in the winning of target customers and the corresponding certification processes. At the same<br />
time price and sales risks are reduced by expanding the customer base and accessing premium market<br />
segments. In addition we are adapting the startup of the final units and the slab and coil production<br />
operations in line with the economic situation.<br />
116
Management report on the Group<br />
2.7 Management report on the Group Expected developments and associated opportunities and risks<br />
By improving customer retention,<br />
Elevator Technology lessens the the<br />
risk of losing maintenance units.<br />
116 | 117<br />
To counter the risks of currency effects such as an increase in the value of the Brazilian Real, which would<br />
negatively impact the competitiveness of our plant near Rio de Janeiro, we have introduced a wide range of<br />
measures to both expand sales in Brazilian currency and reduce the share of costs incurred in Brazilian<br />
currency.<br />
Materials Services – The business area counters the risks associated with providing materials services for<br />
customers throughout the world with a wide range of measures. Inventories are optimized by systematic<br />
improvements to net working capital management. Cost-reduction measures help increase efficiency and<br />
cost-effectiveness. These measures are supported by continuously improved logistics and efficient<br />
management tools.<br />
Cyclical risks are countered by our worldwide presence, broad customer base and high degree of<br />
diversification. The resultant wide spread of risks also applies to bad debt risks, which are additionally<br />
limited by the use of hedging instruments.<br />
Together with other companies in the sector, the Materials Services company ThyssenKrupp GfT Gleistechnik<br />
GmbH is involved in investigations by the Federal Cartel Office into anticompetitive agreements in sections of<br />
the rail business. The responsible public prosecutor’s office is carrying out investigations into several former<br />
employees. The official and internal investigations continue. Risks exist with regard to a possible fine and<br />
potential claims for damages from customers. With the support of external lawyers, we are working<br />
intensively on further clarifying the matter and are cooperating with the authorities. The necessary personnel<br />
actions have been taken. We wrote to our main customers and informed them that antitrust infringements<br />
had occurred. Extensive further measures have been and will be taken to contain the risks in connection with<br />
the incident.<br />
Elevator Technology – The risk situation of Elevator Technology is mainly determined by two factors: the<br />
different areas of business and the international reach of the business activities.<br />
In the service and modernization business we have implemented customer retention strategies to lessen the<br />
risk of losing maintenance units. Continuous efficiency-enhancement programs help offset rising personnel<br />
and procurement costs where these cannot be passed on in full to customers.<br />
The new installations business is exposed to cyclical risks due to its close links with the construction sector.<br />
However, longer project lead times in this business mean that downturns can be identified in good time to<br />
take countermeasures, e.g. capacity cutbacks. In addition, targeted project management measures help<br />
contain risks in the processing of major projects.<br />
Thanks to the regional distribution of our business activities, many of the risks are balanced because the<br />
markets in which Elevator Technology operates are in different growth phases. Exchange-rate risks are<br />
hedged as far as possible with corresponding financial instruments and are additionally mitigated by settling<br />
sales and costs congruently.
2.7 Management report on the Group Expected developments and and associated opportunities and and risks risks<br />
The restructuring restructuring of of Marine Systems<br />
helped reduce risks in in the the business area.<br />
In the event of an economic slowdown, the risk potential on all markets can be expected to increase. On the<br />
one hand there are risks of bad debt and project deferrals if customers find access to financial resources<br />
restricted. On the other hand competition is likely to grow more intense, leading to further price pressure.<br />
Elevator Technology manages these risks with professional project management and extensive customer<br />
credit screening. Customer retention management, high service quality and efficiency programs additionally<br />
help contain the risk of increasing price pressure.<br />
Plant Technology – Political developments in key sales regions such as North Africa and the Middle East as<br />
well as fluctuating raw materials prices can influence the project situation. In addition, financing problems<br />
for customers continue to exist which could lead to project deferrals or cancellations. We counter specific<br />
risks from large long-term contracts and technically complex orders – above all through results-oriented<br />
project and claims management, intensive project controls and intensified project management.<br />
Owing to continued investment restraint in some markets and the emergence of above all Asian competitors,<br />
prices and conditions are subject to fiercer competition on the global markets. This could impact margins on<br />
future projects.<br />
Components Technology – To lessen the risk of dependency on individual markets, the business area is<br />
expanding its customer base and strengthening its international presence, especially in Asia. In the wind<br />
energy sector there are risks of order deferrals or cancellations as a result of lending restraint. At the same<br />
time prices are coming under increasing pressure as a result of the fierce competition. This price pressure is<br />
also evident in the automotive components business. To counter the associated risks Components<br />
Technology has initiated extensive cost-reduction and productivity-enhancement programs.<br />
These risks on the sales markets are accompanied by a significant risk on the procurement markets if<br />
steeply rising material prices cannot be passed on fully or without delay to customers. We are countering<br />
this risk by framing customer contracts accordingly.<br />
Further general risks in the business area relate to the impact of changes in exchange rates. In addition,<br />
technological innovations and improvements can weigh on earnings. On top of this there are potential risks<br />
from unexpected yield and quality problems and the associated warranty obligations. The business area<br />
uses production and quality assurance systems to avoid or limit such risks as far as possible.<br />
Marine Systems – The measures carried out in the prior year to restructure the business area were driven<br />
further forward in the reporting year, leading to a further reduction in the associated risks. With the delivery<br />
of the megayacht “Eclipse”, the risks from the yacht-building business are essentially limited to the handling<br />
of warranty claims and any remaining points. Current risk scenarios encompass among other things the<br />
political developments in key customer countries in the Middle East and North Africa. In addition, there<br />
remains a capacity utilization risk at the Hamburg and Kiel locations should the planned disposal of our civil<br />
shipbuilding operations fail.<br />
118
Management report on the Group<br />
2.7 Management report on the Group Expected developments and associated opportunities and risks<br />
118 | 119<br />
Stainless Global – In addition to the usual cyclical risks and fluctuating raw material prices, the stainless<br />
operations mainly face risks associated with the existing overcapacities in Europe as well as import and price<br />
pressure from Asia. Stainless has numerous measures in place to counter these market risks. For example it<br />
is further strengthening the value chain towards the higher-margin end-customer business, intensifying<br />
customer relationships, expanding custom services and improving its quality and delivery performance.<br />
These measures are supported by newly developed applications for stainless steels and nickel alloys,<br />
innovative products made from these materials, and modern, cost-saving process technologies. Significant<br />
production cutbacks, administrative cost savings and further cost-reduction and efficiency-enhancement<br />
measures will additionally strengthen the business area’s position.<br />
The construction of the stainless steel plant in Calvert/USA is proceeding in line with the revised schedule.<br />
Intensive project controls and regular reporting ensure detailed risk assessments; all risks are identified and<br />
communicated.<br />
In a difficult financial environment there is a risk that the carve-out of the stainless operations, as intended<br />
under the strategic development plan, will result in lower disposal gains than originally planned. To minimize<br />
this risk we are continuously monitoring the market environment and pursuing several options, including an<br />
IPO, a spin-off, and a sale. In particular in view of the current volatility of the capital markets, it cannot be<br />
ruled out that further fair value adjustments may be necessary in connection with the carve out of the<br />
business area.<br />
No threat to existence of Group<br />
The overall risk situation at ThyssenKrupp continues to be manageable. Our continuous risk management<br />
activities with tailored risk control in all business operations play a key role in this. The existence of the<br />
Group is secured.
2.8 Management report on on the the Group Legal Legal information<br />
Legal information<br />
The following section mainly contains information and explanations<br />
in accordance with Art. 315 par. 4 of the German Commercial Code<br />
(HGB). This information relates to company law structures and other<br />
legal relationships; it is intended to provide a better overview of the<br />
Company and any barriers to takeover.<br />
www.thyssenkrupp.com<br />
www.thyssenkrupp.com<br />
Pages 33–40<br />
Pages 33–40<br />
Corporate governance declaration<br />
The corporate governance statement issued in accordance with Art. 289a HGB is published on our website<br />
at http://www.thyssenkrupp.com/en/investor/unternehmensfuehrung.html. It contains a description of<br />
how the Executive Board and Supervisory Board operate, the declaration of conformity in accordance with<br />
Art. 161 Stock Corporation Act (AktG) and information on key corporate governance practices.<br />
Compensation report<br />
The compensation report is included in the corporate governance report and forms part of the management<br />
report on the Group.<br />
Disclosure of takeover provisions<br />
The following information, valid September 30, 2011, is presented in accordance with Art. 315 par. 4 of the<br />
German Commercial Code (HGB).<br />
Composition of capital stock<br />
The capital stock of ThyssenKrupp AG remains unchanged at €1,317,091,952.64 and consists of<br />
514,489,044 no-par value bearer shares. Each share carries the same rights and grants one vote at the<br />
Annual General Meeting.<br />
Shareholdings exceeding 10% of the voting rights<br />
There is one direct shareholding in the Company which exceeds 10% of the voting rights: The Alfried Krupp<br />
von Bohlen und Halbach Foundation, Essen has informed us that effective September 30, 2011 it holds<br />
around 25.33% of the voting rights of ThyssenKrupp AG.<br />
120
Management report on the Group<br />
2.8 Management report on the Group Legal information<br />
120 | 121<br />
Appointment and dismissal of Executive Board members, amendments to the Articles of Association<br />
The appointment and dismissal of members of the Executive Board of ThyssenKrupp AG is subject to Arts<br />
84, 85 German Stock Corporation Act (AktG) and Art. 31 Codetermination Act (MitbestG) in conjunction with<br />
Art. 6 of the Articles of Association. Amendments to the Articles of Association are subject to the approval of<br />
the Annual General Meeting with a majority of at least three quarters of the capital stock represented; Arts<br />
179 ff. AktG apply. Under Art. 11 par. 9 of the Articles of Association, the Supervisory Board is authorized to<br />
resolve amendments to the Articles of Association which relate only to their wording. The Supervisory Board<br />
is also authorized to amend Art. 5 of the Articles of Association (Capital Stock and Shares) depending on the<br />
use of authorized capital. If the authorized capital has not been used or has been only partly used by<br />
January 18, 2012, the Supervisory Board may also amend the wording of Art. 5.<br />
Authorization of the Executive Board to issue shares<br />
Under Art. 5 par. 5 of the Articles of Association, the Executive Board is authorized, with the approval of the<br />
Supervisory Board, to increase the Company’s capital stock on one or more occasions on or before January<br />
18, 2012 by up to €500 million by issuing up to 195,312,500 new no-par value bearer shares in exchange<br />
for cash and/or contributions in kind (authorized capital).<br />
It may exclude shareholders’ subscription rights with the approval of the Supervisory Board in the following<br />
cases:<br />
– for fractional amounts occurring as a result of the subscription ratio;<br />
– to grant subscription rights for new shares to the holders of conversion and/or option rights or conversion<br />
obligations outstanding at the time the authorized capital is utilized in respect of convertible bonds and/or<br />
options already issued or to be issued in the future by the Company or its subsidiaries to the extent to<br />
which they would be eligible as shareholders after exercising the conversion and/or option rights or after<br />
fulfillment of the conversion obligations;<br />
– if the issue price of the new shares is not significantly lower than the stock market price of shares already<br />
quoted on the stock market at the time the final issue price is determined and the shares issued do not<br />
exceed altogether 10% of the capital stock either at the time this authorization becomes effective or at<br />
the time it is exercised;<br />
– in the event of capital increases in exchange for contributions in kind.<br />
The sale of treasury shares shall be counted against the 10% capital limit insofar as it takes place during the<br />
term of this authorization to the exclusion of subscription rights pursuant to Art. 186 par. 3 sentence 4 AktG.<br />
Shares issued to service bonds with conversion and/or option rights and conversion obligations shall<br />
likewise be counted against the 10% capital limit insofar as the bonds are issued during the term of this<br />
authorization to the exclusion of subscription rights analogously applying Art. 186 par. 3 sentence 4 AktG.<br />
The Executive Board is authorized, with the approval of the Supervisory Board, to determine the further<br />
content and the terms and conditions of the share issue.
2.8 Management report on on the the Group Legal Legal information<br />
ThyssenKrupp AG is authorized until<br />
January 2015 to repurchase treasury<br />
shares up to 10% of the capital stock.<br />
The repurchased repurchased treasury shares can can be be<br />
used for all legally permissible purposes.<br />
Authorization of the Executive Board to repurchase stock<br />
By resolution of the Annual General Meeting of January 21, 2010 the Company was authorized until January<br />
20, 2015 to repurchase treasury shares up to a total of 10% of the capital stock at the time of the resolution<br />
of €1,317,091,952.64. The authorization may be exercised in whole or in installments, once or several<br />
times, in pursuit of one or several purposes by the Company or by third parties for the account of the<br />
Company. At the discretion of the Executive Board, the buy-back may be effected on the open market or by<br />
means of a public offer or a public invitation to tender or by means of equity derivatives (put or call options<br />
or a combination of both). The countervalue per share paid by the Company (excluding incidental costs) may<br />
not be more than 5% higher or lower than the price determined on the day of trading by the opening auction<br />
in the XETRA trading system (or a comparable successor system).<br />
If the shares are repurchased by means of a public offer or invitation to tender, the purchase price or the<br />
limits of the price range per share (excluding incidental costs) may not be more than 10% higher or lower<br />
than the average closing price in the XETRA trading system (or a comparable successor system) on the<br />
three trading days before the date of the public announcement of the offer or invitation to tender.<br />
If, after announcement of a public offer or invitation to tender, the relevant price is subject to significant<br />
changes, the offer or invitation may be amended. In this case the price is based on the average price over<br />
the three days of trading before the public announcement of an amendment. The public offer or invitation to<br />
tender may specify further conditions. If the offer is over-subscribed or, in the case of an invitation to tender,<br />
not all of several equal offers can be accepted, they must be accepted on a quota basis. Priority may be<br />
given to small lots of up to 100 shares per shareholder.<br />
If the shares are repurchased by means of equity derivatives, the options may only be honored with shares<br />
purchased under observance of the principle of equal treatment. The term of the options must end on<br />
January 20, 2015 at the latest. Each purchase of treasury shares by means of equity derivatives is limited to<br />
a maximum of 5% of the capital stock of the Company at the time of the resolution by the Annual General<br />
Meeting. Any right of shareholders to conclude such option transactions with the Company shall be<br />
excluded, applying Art. 186 par. 3 sentence 4 AktG.<br />
The Executive Board is authorized to use the repurchased shares for all legally permissible purposes. In<br />
particular it may cancel the shares, sell them by means other than on the open market or by offer to<br />
shareholders or sell them in exchange for a contribution in kind, use them to discharge conversion rights in<br />
respect of convertible bonds issued by the Company or the Company’s subsidiaries, and issue them to<br />
employees of the Company and affiliated companies as well as members of the management boards of<br />
affiliated companies to satisfy rights or obligations to acquire Company shares granted to the<br />
aforementioned group of people. The Supervisory Board is authorized to use the repurchased stock to<br />
satisfy rights or obligations to acquire Company shares granted to members of the Executive Board of the<br />
Company. In the latter five cases, the shareholders’ subscription rights are excluded. The Supervisory Board<br />
may determine that measures of the Executive Board regarding the purchase and use of treasury shares<br />
under this authorization are subject to its approval.<br />
122
Management report on the Group<br />
2.8 Management report on the Group Legal information<br />
122 | 123<br />
By resolution of the Annual General Meeting of January 23, 2009, the Executive Board was authorized up to<br />
January 22, 2014 to carry out the following measures with the approval of the Supervisory Board:<br />
– to issue bearer bonds in the total par value of up to €2 billion and to grant the bond holders the right to<br />
convert the bonds into a total of up to 50 million no-par-value bearer shares of ThyssenKrupp AG with an<br />
arithmetical share in the Company’s capital stock of up to €128 million (convertible bonds);<br />
– to exclude the shareholders’ subscription rights to convertible bonds if this is necessary (1) for fractional<br />
amounts occurring as a result of the subscription ratio, (2) insofar as the convertible bonds are issued<br />
against cash payment and the issue price for the convertible bonds is not significantly lower than the<br />
theoretical fair value calculated according to recognized financial calculation methods, or (3) to grant<br />
holders of conversion rights from previous bond issues subscription rights in the amount to which they<br />
would be entitled upon exercising their conversion rights. The conversion price for treasury shares must<br />
not be lower than 80% of the average closing price in the XETRA trading system over the three days of<br />
trading before the date of the public announcement of the offer or acceptance of a tender. The Executive<br />
Board determines the conditions for conversion bonds.<br />
Key agreements subject to conditions<br />
ThyssenKrupp AG is party to the following agreements that contain certain conditions in the event of a<br />
change of control as a result of a takeover bid:<br />
– The Company has concluded an agreement with a banking consortium on a committed credit facility in<br />
the amount of €2.5 billion. This agreement can be terminated with immediate effect and outstanding<br />
loans declared due if the Company becomes a subsidiary of another legal entity or natural person and<br />
this is requested by a group of banks representing more than 50% of the credit facility. Outstanding loans<br />
would then have to be repaid immediately; the credit facility would no longer be available for new loans.<br />
– The Company has concluded an agreement with the European Investment Bank, Luxembourg, for a<br />
promotional loan in the amount of €210 million. This agreement can be terminated with immediate effect<br />
if one or several entities (excluding the Alfried Krupp von Bohlen und Halbach Foundation) acting in<br />
concert gain indirect or direct control of the Company (change of control). Control is understood to mean<br />
the right to direct the management and policies of the Company through ownership of voting capital, by<br />
contract or otherwise. In the event of termination due to change of control, the loan must be repaid at a<br />
date set by the European Investment Bank, but no earlier than 30 days after termination.<br />
– In fiscal year 2008/2009 the Company issued a bond in the amount of €1 billion. It is also guarantor of<br />
further bonds issued in 2008/2009 by its subsidiary ThyssenKrupp Finance Nederland B.V. in the total<br />
amount of €2 billion. A change of control, i.e. the acquisition by a third party of more than 50% of the<br />
capital stock or more than 50% of the voting shares of ThyssenKrupp AG, may under certain conditions<br />
lead to early redemption of the bonds including interest.
2.8 Management report on on the the Group Legal Legal information<br />
The Company is party to a shareholders’ agreement in respect of Atlas Elektronik GmbH (joint venture)<br />
under which the co-shareholder EADS Deutschland GmbH has a call option on specific assets and liabilities<br />
of the joint venture at fair value in the event that a competitor of the joint venture or of the co-shareholder<br />
directly or indirectly acquires a controlling interest in the Company. If the call option is exercised,<br />
ThyssenKrupp Technologies AG (today operating under the name ThyssenKrupp Technologies Beteiligungen<br />
GmbH) is entitled to purchase all the co-shareholder’s shares in the joint venture at fair value plus 5%<br />
premium. If the call option is not exercised, the co-shareholder has a put option in respect of the shares in<br />
the joint venture at the specified purchase price conditions.<br />
124
Consolidated<br />
fi nancial statements<br />
The 2010/2011 consolidated fi nancial statements provide a comprehensive<br />
overview of the Group’s fi nancial position and results of operations.<br />
In them you will fi nd a host of details about our performance in the<br />
reporting year.<br />
Consolidated fi nancial statements<br />
3.1 Consolidated statement of fi nancial position 129<br />
3.2 Consolidated statement of income 130<br />
3.3 Consolidated statement of<br />
comprehensive income 131<br />
3.4 Consolidated statement of changes in equity 132<br />
3.5 Consolidated statement of cash fl ows 133<br />
3.6 Notes to the consolidated fi nancial statements 134<br />
01 Summary of signifi cant accounting policies 134<br />
02 Acquisitions and disposals 147<br />
03 Disposal groups and single assets<br />
held for sale 149<br />
Notes to the consolidated statement of<br />
fi nancial position<br />
04 Intangible assets 153<br />
05 Property, plant and equipment 156<br />
06 Investment property 158<br />
07 Investments accounted for using the<br />
equity method 158<br />
08 Operating lease as lessor 159<br />
09 Inventories 159<br />
10 Trade accounts receivable 159<br />
11 Other fi nancial assets 160<br />
12 Other non-fi nancial assets 161<br />
13 Total Equity 161<br />
14 Share-based compensation 163<br />
15 Accrued pension and similar obligations 165<br />
16 Other provisions 170<br />
17 Financial debt 171<br />
18 Trade accounts payable 173<br />
Consolidated fi nancial statements<br />
19 Other fi nancial liabilities 173<br />
20 Other non-fi nancial liabilities 174<br />
21 Contingencies and commitments 174<br />
22 Financial instruments 177<br />
23 Related parties 186<br />
24 Segment reporting 187<br />
25 Accounting estimates and judgements 192<br />
Notes to the consolidated statement of income<br />
26 Net sales 194<br />
27 Other operating income 194<br />
28 Other operating expenses 194<br />
29 Government grants 194<br />
30 Financial income/(expense), net 194<br />
31 Income taxes 195<br />
32 Earnings per share 197<br />
33 Additional disclosures on the consolidated<br />
statement of income 199<br />
Notes to the consolidated statement<br />
of cash fl ows<br />
34 Additional information on the<br />
consolidated statement of cash fl ows 199<br />
Subsequent events<br />
35 Subsequent events 199<br />
Other information<br />
36 Declarations of conformity with the German<br />
Corporate Governance Code in accordance<br />
with Art. 161 of the German Stock Corporation<br />
Act (AktG) 199<br />
37 Application of exemption clauses 200<br />
38 List of the Group’s subsidiaries and<br />
equity interests 202<br />
Auditors’ report 223<br />
Responsibility statement 224
Construction<br />
Energy<br />
The challenge<br />
of urbanization<br />
Mechanical
Using space better<br />
The challenge of urbanization: Multi-million population<br />
cities place huge demands on their infrastructure, which<br />
can only be improved further using new technical solutions.<br />
Share of the population<br />
in cities (in percent/*forecast)<br />
37<br />
46<br />
1975 2000<br />
57<br />
* 2025<br />
69<br />
* 2050
More urbanization<br />
Cities are becoming<br />
denser<br />
More information on this subject can be<br />
found in the ThyssenKrupp Yearbook on<br />
pages 40 – 47.<br />
<strong>Engineering</strong><br />
Better infrastructure<br />
Using<br />
space better
3.1 Consolidated financial statements Consolidated statement of financial of financial position position<br />
Consolidated financial statements<br />
128 | 129<br />
ThyssenKrupp AG<br />
Consolidated statement of financial position<br />
Assets million €<br />
Sept. 30, Sept. 30,<br />
Note<br />
2010<br />
2011<br />
Intangible assets 04 4,651 4,166<br />
Property, plant and equipment 05, 29 16,322 12,649<br />
Investment property 06 337 301<br />
Investments accounted for using the equity method 07 522 593<br />
Other financial assets 11 127 71<br />
Other non-financial assets 12 200 453<br />
Deferred tax assets 31 590 940<br />
Total non-current assets 22,749 19,173<br />
Inventories 09 8,262 8,105<br />
Trade accounts receivable 10 5,882 5,059<br />
Other financial assets 11 685 578<br />
Other non-financial assets 12 1,646 1,563<br />
Current income tax assets 315 134<br />
Cash and cash equivalents 3,380 3,230<br />
Assets held for sale 03 793 5,761<br />
Total current assets 20,963 24,430<br />
Total assets 43,712 43,603<br />
Equity and liabilities million €<br />
Sept. 30, Sept. 30,<br />
Note<br />
2010<br />
2011<br />
Capital stock 1,317 1,317<br />
Additional paid in capital 4,684 4,684<br />
Retained earnings 3,703 2,833<br />
Cumulative other comprehensive income<br />
thereof relating to disposal groups/discontinued operations<br />
(Sept. 30, 2010: 0; Sept. 30, 2011: (19))<br />
192 178<br />
Treasury stock (1,396) 0<br />
Equity attributable to ThyssenKrupp AG's stockholders 8,500 9,012<br />
Non-controlling interest 1,888 1,370<br />
Total equity 13 10,388 10,382<br />
Accrued pension and similar obligations 15 8,086 6,940<br />
Other provisions 16 829 648<br />
Deferred tax liabilities 31 139 324<br />
Financial debt 17 6,157 6,494<br />
Other financial liabilities 19 0 1<br />
Other non-financial liabilities 20 23 7<br />
Total non-current liabilities 15,234 14,414<br />
Other provisions 16 1,778 1,500<br />
Current income tax liabilities 532 409<br />
Financial debt 17 1,278 178<br />
Trade accounts payable 18 5,411 4,807<br />
Other financial liabilities 19 1,641 1,357<br />
Other non-financial liabilities 20 6,906 7,332<br />
Liabilities associated with assets held for sale 03 544 3,224<br />
Total current liabilities 18,090 18,807<br />
Total liabilities 33,324 33,221<br />
Total equity and liabilities 43,712 43,603<br />
See accompanying notes to the consolidated financial statements.
3.2 Consolidated financial statements Consolidated statement of of income income<br />
ThyssenKrupp AG<br />
Consolidated statement of income<br />
million €, earnings per share in €<br />
Year ended Year ended<br />
Sept. 30, Sept. 30,<br />
Note 2010*<br />
2011<br />
Net sales 24, 26 37,711 43,356<br />
Cost of sales 04, 05 (31,648) (38,616)<br />
Gross margin 6,063 4,740<br />
Selling expenses (2,529) (2,765)<br />
General and administrative expenses (2,131) (2,158)<br />
Other operating income 27 401 506<br />
Other operating expenses 04, 28 (686) (580)<br />
Gain/(loss) on the disposal of subsidiaries, net 223 (27)<br />
Income/(loss) from operations 1,341 (284)<br />
Income from companies accounted for using the equity method 56 71<br />
Interest income 347 306<br />
Interest expense (643) (880)<br />
Other financial income/(expense), net 104 36<br />
Financial income/(expense), net 30 (136) (467)<br />
Income/(loss) from continuing operations before income taxes 1,205 (751)<br />
Income tax (expense)/income 31 (185) (203)<br />
Income/(loss) from continuing operations (net of tax) 1,020 (954)<br />
Discontinued operations (net of tax) 03 (93) (829)<br />
Net income/(loss) 927 (1,783)<br />
Thereof:<br />
ThyssenKrupp AG's stockholders 824 (1,291)<br />
Non-controlling interest 103 (492)<br />
Net income/(loss) 927 (1,783)<br />
Basic and diluted earnings per share based on 32<br />
Income/(loss) from continuing operations (attributable to ThyssenKrupp AG's stockholders) 1.97 (0.97)<br />
Net income/(loss) (attributable to ThyssenKrupp AG's stockholders) 1.77 (2.71)<br />
* Prior year figures have been adjusted (see Note 3).<br />
See accompanying notes to the consolidated financial statements.<br />
130
Consolidated financial statements<br />
3.3 3.3 Consolidated financial statements Consolidated statement of comprehensive income<br />
131<br />
Consolidated financial statements Consolidated statement of comprehensive income 130 | 131<br />
ThyssenKrupp AG<br />
Consolidated statement<br />
of comprehensive income<br />
million €<br />
Year ended<br />
Sept. 30,<br />
2010<br />
Year ended<br />
Sept. 30,<br />
2011<br />
Net income/(loss)<br />
Foreign currency translation adjustment<br />
927 (1,783)<br />
Change in unrealized gains/(losses), net 469 67<br />
Net realized (gains)/losses 14 (17)<br />
Net unrealized gains/(losses)<br />
Unrealized gains/(losses) from available-for-sale financial assets<br />
483 50<br />
Change in unrealized gains/(losses), net 0 (4)<br />
Net realized (gains)/losses 0 0<br />
Tax effect 1 0<br />
Net unrealized gains/(losses)<br />
Actuarial gains/(losses) from pensions and similar obligations<br />
1 (4)<br />
Change in actuarial gains/(losses), net (866) 538<br />
Tax effect 219 (150)<br />
Net actuarial gains/(losses) from pensions and similar obligations<br />
Gains/(losses) resulting from asset ceiling<br />
(647) 388<br />
Change in gains/(losses), net (60) 24<br />
Tax effect 15 (7)<br />
Net gains/(losses) resulting from asset ceiling<br />
Unrealized (losses)/gains on derivative financial instruments<br />
(45) 17<br />
Change in unrealized gains/(losses), net 100 (12)<br />
Net realized (gains)/losses (35) (91)<br />
Tax effect (20) 20<br />
Net unrealized gains/(losses) 45 (83)<br />
Share of unrealized gains/(losses) of investments accounted for using the equity-method 6 7<br />
Other comprehensive income (157) 375<br />
Total comprehensive income 770 (1,408)<br />
Attributable to:<br />
ThyssenKrupp AG's stockholders 615 (913)<br />
Non-controlling interest 155 (495)<br />
Cumulative actuarial gains/(losses) from pensions and similar obligations as of year-end (1,501) (846)<br />
See accompanying notes to the consolidated financial statements.
3.4 Consolidated financial statements Consolidated statement of of changes in equity in equity<br />
ThyssenKrupp AG<br />
Consolidated statement of changes in equity<br />
million € (except number of shares)<br />
Number of<br />
shares<br />
outstanding<br />
Capital<br />
stock<br />
Additional<br />
paid<br />
in capital<br />
Retained<br />
earnings<br />
Equity attributable to ThyssenKrupp AG's stockholders<br />
Foreign<br />
currency<br />
translation<br />
adjustment<br />
Cumulative other comprehensive income<br />
Availablefor-sale<br />
financial<br />
assets<br />
Derivative<br />
financial<br />
instruments<br />
Share of<br />
investments<br />
accounted<br />
for using<br />
the equity<br />
method<br />
Treasury<br />
stock Total<br />
Noncontrolling<br />
interest<br />
Balance as of<br />
Sept. 30, 2009 463,473,492 1,317 4,684 3,643 (329) 5 33 (5) (1,421) 7,927 1,769 9,696<br />
Net income 824 824 103 927<br />
Other<br />
comprehensive<br />
income (697) 456 0 17 15 (209) 52 (157)<br />
Total<br />
comprehensive<br />
income 127 456 0 17 15 615 155 770<br />
Profit attributable<br />
to non-controlling<br />
interest 0 (44) (44)<br />
Dividend payment (139) (139) 0 (139)<br />
Treasury stock sold<br />
Tax effects on<br />
income and expense<br />
directly recognized<br />
920,845 (7) 28 21 0 21<br />
in equity<br />
Share-based<br />
3 (3) 0 0 0<br />
compensation (7) (7) 0 (7)<br />
Other changes 83 83 8 91<br />
Balance as of<br />
Sept. 30, 2010 464,394,337 1,317 4,684 3,703 127 5 50 10 (1,396) 8,500 1,888 10,388<br />
Net loss (1,291) (1,291) (492) (1,783)<br />
Other<br />
comprehensive<br />
income 392 43 (3) (72) 18 378 (3) 375<br />
Total<br />
comprehensive<br />
income (899) 43 (3) (72) 18 (913) (495) (1,408)<br />
Profit attributable<br />
to non-controlling<br />
interest 0 (43) (43)<br />
Dividend payment (209) (209) 0 (209)<br />
Treasury stock sold<br />
Tax effects on income<br />
and expense directly<br />
50,094,707 93 1,549 1,642 0 1,642<br />
recognized in equity<br />
Share-based<br />
153 (153) 0 0 0<br />
compensation 0 0 0 0<br />
Other changes (8) (8) 20 12<br />
Balance as of<br />
Sept. 30, 2011 514,489,044 1,317 4,684 2,833 170 2 (22) 28 0 9,012 1,370 10,382<br />
See accompanying notes to the consolidated financial statements.<br />
132<br />
Total<br />
equity
Consolidated financial statements<br />
3.5 Consolidated financial statements Consolidated statement of of cash cash flows flows 132 | 133<br />
133<br />
ThyssenKrupp AG<br />
Consolidated statement of cash flows<br />
million €<br />
Year ended<br />
Sept. 30,<br />
2010<br />
Year ended<br />
Sept. 30,<br />
2011<br />
Net income/(loss) 927 (1,783)<br />
Adjustments to reconcile net income/(loss) to operating cash flows:<br />
Discontinued operations (net of tax) 93 829<br />
Deferred income taxes, net 139 (304)<br />
Depreciation, amortization and impairment of non-current assets 1,286 3,501<br />
Reversals of impairment losses of non-current assets (9) (60)<br />
(Income)/loss from companies accounted for using the equity method, net of dividends received (52) (63)<br />
(Gain)/loss on disposal of non-current assets (223) 7<br />
Changes in assets and liabilities, net of effects of acquisitions and divestitures:<br />
- inventories (1,028) (1,668)<br />
- trade accounts receivable (651) (127)<br />
- accrued pension and similar obligations (290) (350)<br />
- other provisions (238) (230)<br />
- trade accounts payable 991 761<br />
- other assets/liabilities not related to investing or financing activities 86 499<br />
Operating cash flows - continuing operations 1,031 1,012<br />
Operating cash flows - discontinued operations (163) (236)<br />
Operating cash flows - total 868 776<br />
Purchase of investments accounted for using the equity method and non-current financial assets (52) (27)<br />
Expenditures for acquisitions of consolidated companies net of cash acquired (51) (83)<br />
Capital expenditures for property, plant and equipment (inclusive of advance payments) and investment property (2,960) (2,319)<br />
Capital expenditures for intangible assets (inclusive of advance payments) (105) (76)<br />
Proceeds from disposals of investments accounted for using the equity method and non-current financial assets 3 15<br />
Proceeds from disposals of previously consolidated companies net of cash disposed 472 267<br />
Proceeds from disposals of property, plant and equipment and investment property 69 133<br />
Proceeds from disposals of intangible assets 3 8<br />
Cash flows from investing activities - continuing operations (2,621) (2,082)<br />
Cash flows from investing activities - discontinued operations (338) (265)<br />
Cash flows from investing activities - total (2,959) (2,347)<br />
Repayment of bonds 0 (750)<br />
Proceeds from liabilities to financial institutions 649 1,881<br />
Repayments of liabilities to financial institutions (790) (1,569)<br />
Proceeds from notes payable and other loans 13 200<br />
Decrease in bills of exchange (3) (6)<br />
Decrease in current securities 190 2<br />
Proceeds from non-controlling interest to equity 500 35<br />
Proceeds from treasury shares sold 8 1,631<br />
Payment of ThyssenKrupp AG dividend (139) (209)<br />
Profit attributable to non-controlling interest (44) (43)<br />
Expenditures for acquisitions of shares of already consolidated companies (12) (8)<br />
Financing of discontinued operations (1,068) (554)<br />
Other financing activities 451 379<br />
Cash flows from financing activities - continuing operations (245) 989<br />
Cash flows from financing activities - discontinued operations 501 538<br />
Cash flows from financing activities - total 256 1,527<br />
Net decrease in cash and cash equivalents - total (1,835) (44)<br />
Effect of exchange rate changes on cash and cash equivalents 133 (61)<br />
Cash and cash equivalents at beginning of year 5,375 3,673<br />
Cash and cash equivalents at end of year - total 3,673 3,568<br />
[thereof cash and cash equivalents within the disposal groups] [293] [273]<br />
[thereof cash and cash equivalents within the discontinued operations] [28] [65]<br />
Additional information regarding cash flows from interest, dividends and income taxes<br />
which are included in operating cash flows of continuing operations:<br />
Interest received 225 180<br />
Interest paid (523) (554)<br />
Dividends received 14 23<br />
Income taxes paid (289) (429)<br />
See Note 34 to the consolidated financial statements.
3.6 Consolidated financial statements Notes Notes to to the the consolidated financial financial statements<br />
ThyssenKrupp AG<br />
Notes to the consolidated financial statements<br />
Corporate Information<br />
ThyssenKrupp Aktiengesellschaft (“ThyssenKrupp AG” or “Company”)<br />
is a publicly traded corporation domiciled in Duisburg and Essen in<br />
Germany. The consolidated financial statements of ThyssenKrupp AG<br />
and its subsidiaries, collectively the “Group”, for the year ended<br />
September 30, 2011, were authorized for issuance in accordance with<br />
a resolution of the Executive Board on November 29, 2011.<br />
Statement of compliance<br />
Applying Art. 315a of the German Commercial Code (HGB), the<br />
Group’s consolidated financial statements have been prepared in<br />
accordance with International Financial Reporting Standards (IFRS) and<br />
its interpretations of the International Accounting Standards Board<br />
(IASB) effective within the EU in accordance with the Regulation No.<br />
1606/2002 of the European Parliament and the Council concerning the<br />
use of International Accounting Standards.<br />
01 Summary of significant accounting policies<br />
The consolidated financial statements have been prepared on a<br />
historical cost basis, except for certain financial instruments that are<br />
stated at fair value. The consolidated financial statements are<br />
presented in Euros since this is the currency in which the majority of<br />
the Group’s transactions are denominated, with all amounts rounded to<br />
the nearest million except when otherwise indicated; this may result in<br />
differences compared to the unrounded figures.<br />
Consolidation<br />
The Group’s consolidated financial statements include the accounts of<br />
ThyssenKrupp AG and all significant entities which are directly or<br />
indirectly controlled by ThyssenKrupp AG. Control is achieved where<br />
ThyssenKrupp AG possesses more than half of the voting rights of a<br />
company or has in another way the power to govern the financial and<br />
operating policies of an entity so as to obtain benefits from its<br />
activities. In assessing control, potential voting rights that presently are<br />
exercisable or convertible are taken into account. The financial<br />
statements of subsidiaries are included in the consolidated financial<br />
statements from the date that control commences until the date that<br />
control ceases. On acquisition, the identifiable assets, liabilities and<br />
contingent liabilities of a subsidiary are measured at their fair values at<br />
the date of acquisition. The interest of minority shareholders is stated<br />
at the minority’s proportion of the fair values of the identifiable assets,<br />
liabilities and contingent liabilities recognized.<br />
All significant intercompany transactions and balances between Group<br />
entities are eliminated on consolidation.<br />
Included in the Group consolidated financial statements are 181<br />
(2009/2010: 201) domestic and 485 (2009/2010: 513) foreigncontrolled<br />
entities that are consolidated. During the fiscal year<br />
2010/2011, 16 entities were consolidated for the first time. During the<br />
same period, the scope of consolidation was reduced by 64 entities of<br />
which 42 resulted from the internal merging of Group entities.<br />
21 (2009/2010: 25) controlled subsidiaries are not consolidated<br />
because their combined influence on the Group’s net assets, financial<br />
position and results of operations is not material. Their net sales<br />
amount to 0.02%, their income/(loss) before tax amounts to 0.06%<br />
and their total equity amounts to 0.03% of the Group’s respective<br />
balances inclusive of discontinued operations. These non-consolidated<br />
subsidiaries are measured at fair value or at cost when the fair value of<br />
unlisted equity instruments cannot be reliably measured; they are<br />
presented under the “Other financial assets, non-current” line item.<br />
Investments in associates are accounted for using the equity method<br />
of accounting. An associate is an entity over which the Group is in a<br />
position to exercise significant influence, but not control, through<br />
participation in the financial and operating policies. Significant<br />
influence is presumed when the Group holds 20% or more of the voting<br />
rights (“Associated Companies”). Where a Group entity transacts with<br />
an associate of the Group, unrealized profits and losses are eliminated<br />
to the extent of the Group’s interest in the relevant associate.<br />
The Group reports its interests in jointly-controlled entities (Joint<br />
Ventures) using the equity method of accounting. Where the Group<br />
transacts with its jointly-controlled entities, unrealized profits and<br />
losses are eliminated to the extent of the Group’s interest in the joint<br />
venture.<br />
The Group has 12 (2009/2010: 12) Associated Companies and 21<br />
(2009/2010: 19) Joint Ventures that are accounted for using the equity<br />
method of accounting. Another 21 (2009/2010: 22) Associated<br />
Companies are measured at fair value or at cost when the fair value of<br />
unlisted equity instruments cannot be reliably measured because their<br />
combined influence on the Group’s net assets, financial position and<br />
results of operations is not material.; they are presented under the<br />
“Other financial assets, non-current” line item. The income before tax<br />
of the immaterial Associated Companies amounts to 0.45% and<br />
theirtotal equity to 0.11% of the Group’s respective balances inclusive<br />
of discontinued operations.<br />
134
3.6 Consolidated financial statements Notes to the consolidated financial statements<br />
A complete listing of the Group’s subsidiaries and equity interests is<br />
presented in Note 38.<br />
Goodwill arising on consolidation represents the excess of the cost of<br />
acquisition over the Group’s interest in the fair value of the identifiable<br />
assets, liabilities and contingent liabilities of a subsidiary, associate or<br />
jointly-controlled entity at the date of acquisition. Goodwill is<br />
recognized as an asset and is tested for impairment annually, or on<br />
such other occasions that events or changes in circumstances indicate<br />
that it might be impaired.<br />
Goodwill arising on the acquisition of an associate or a jointlycontrolled<br />
entity is included within the carrying amount of the associate<br />
or the jointly-controlled entity, respectively. Goodwill arising on the<br />
acquisition of subsidiaries is presented separately in the balance sheet.<br />
On disposal of a subsidiary, associate or jointly-controlled entity, the<br />
attributable amount of goodwill is included in the determination of the<br />
profit or loss on disposal.<br />
Foreign currency translation<br />
The functional and reporting currency of ThyssenKrupp AG and its<br />
relevant European subsidiaries is the Euro (€). Transactions<br />
denominated in foreign currencies are initially recorded at the rates of<br />
exchange prevailing on the dates of the transactions. Monetary assets<br />
and liabilities denominated in such currencies are retranslated at the<br />
rates prevailing on the balance sheet date. Profits and losses arising<br />
on exchange are included in the net profit or loss for the period.<br />
Financial statements of the foreign subsidiaries included in the Group<br />
consolidated financial statements where the functional currency is<br />
other than the Euro are translated using their functional currency which<br />
is generally the respective local currency. The translation is performed<br />
using the current rate method, in which balance sheet amounts are<br />
translated to the reporting currency using the rates of exchange<br />
prevailing on the balance sheet date, while income statement amounts<br />
are translated using the period’s average exchange rates. Net<br />
exchange gains or losses resulting from the translation of foreign<br />
financial statements are accumulated and included in equity. Such<br />
translation differences are recognized as income or as expenses in the<br />
period in which the operation is disposed of.<br />
Consolidated financial statements<br />
134 | 135<br />
Companies that manage their sales, purchases, and financing<br />
substantially not in their local currency use the currency of their<br />
primary economic environment as their functional currency. Using the<br />
functional currency in these cases involves translating non-monetary<br />
items such as non-current assets, including scheduled depreciation,<br />
and equity to the functional currency using the average exchange rates<br />
of the respective year of addition. All other balance sheet line items are<br />
translated using the exchange rate as of the balance sheet date and all<br />
other income statement line items are translated using the period’s<br />
average exchange rates. The resulting translation differences are<br />
included in the consolidated statement of income as “Other operating<br />
income or expenses”. Thereafter, the functional currency financial<br />
statements are translated into the reporting currency using the current<br />
rate method.<br />
The exchange rates of those currencies significant to the Group have<br />
developed as follows:<br />
Currencies<br />
Exchange rate as of<br />
(Basis €1)<br />
Sept. 30,<br />
2010<br />
Sept. 30,<br />
2011<br />
Annual average exchange rate<br />
for the year ended<br />
Sept. 30,<br />
2010<br />
Sept. 30,<br />
2011<br />
US Dollar 1.37 1.35 1.36 1.40<br />
Brazilian Real<br />
Chinese<br />
2.32 2.51 2.40 2.30<br />
Renminbi Yuan 9.13 8.61 9.25 9.12<br />
Intangible assets<br />
Intangible assets with finite useful lives are capitalized at cost and<br />
amortized on a straight-line basis generally over a period of 3 to 15<br />
years, depending on their estimated useful lives. Technology resulting<br />
from the acquisition of Howaldtswerke-Deutsche Werft (HDW) is<br />
amortized over a period of 40 years. Useful lives are examined on an<br />
annual basis and adjusted when applicable on a prospective basis.<br />
The amortization expense of intangible assets is primarily included in<br />
the “cost of sales” line item in the consolidated statement of income.
3.6 Consolidated financial statements Notes to the consolidated financial statements<br />
3.6 Consolidated financial statements Notes to the consolidated financial statements<br />
Goodwill is stated at cost and tested for impairment annually or on<br />
such other occasions that events or changes in circumstances indicate<br />
that it might be impaired. Goodwill impairment losses are included in<br />
other operating expenses.<br />
Property, plant and equipment<br />
Fixtures and equipment are stated at cost less accumulated<br />
depreciation. Capitalized production costs for self constructed assets<br />
include costs of material, direct labour, and allocable material and<br />
manufacturing overhead. Borrowing costs directly attributable to the<br />
production of assets that necessarily take a substantial period of time<br />
to get ready for their intended use, are added to the cost of those<br />
assets, until such time as the assets are substantially ready for their<br />
intended use. Administrative costs are capitalized only if such costs are<br />
directly related to production. Maintenance and repair costs (day-today<br />
servicing) are expensed as incurred. The Group recognizes in the<br />
carrying amount of an item of property, plant and equipment the cost<br />
of replacing parts and major inspection of such an item if it is probable<br />
that the future economic benefits embodied within the item will flow to<br />
the Group and the cost of the item can be measured reliably. Where<br />
fixtures and equipment comprise of significant parts having different<br />
useful lives those parts are accounted for as separate units and<br />
depreciated accordingly.<br />
Fixtures and equipment are depreciated using the straight-line method.<br />
Upon sale or retirement, the acquisition or production cost and related<br />
accumulated depreciation are removed from the balance sheet and<br />
any gain or loss is included in the consolidated statement of income.<br />
The following useful lives are used as a basis for calculating<br />
depreciation:<br />
Useful lives of property, plant and equipment<br />
Buildings (incl. investment property) 10 to 50 years<br />
Building and land improvements 15 to 25 years<br />
Technical machinery and equipment 8 to 25 years<br />
Factory and office equipment 3 to 10 years<br />
Investment property<br />
Investment property consists of investments in land and buildings that<br />
are held to earn rental income or for capital appreciation, rather than<br />
for use in the production or supply of goods or services or for<br />
administrative purposes or sale in the ordinary course of business.<br />
Investment property is stated at cost less accumulated depreciation.<br />
The fair value of the Group’s investment property is stated in Note 06.<br />
Impairment<br />
At each balance sheet date, the Group reviews the carrying amounts of<br />
its intangible assets, property, plant and equipment and investment<br />
property to determine whether there is any indication that those assets<br />
have suffered an impairment loss. If any such indication exists, the<br />
recoverable amount of the asset is estimated in order to determine the<br />
extent of the impairment loss (if any). The recoverable amount is the<br />
greater of the fair value less cost to sell and the value in use. In<br />
assessing the value in use, the estimated future cash flows are<br />
discounted to their present value using a pre-tax discount rate that<br />
reflects current market conditions. Where it is not possible to estimate<br />
the recoverable amount of an individual asset, the Group estimates the<br />
recoverable amount of the Cash Generating Unit to which the asset<br />
belongs.<br />
Goodwill arising on acquisition is allocated to the Cash Generating<br />
Units that are expected to benefit from the synergies of the acquisition.<br />
Those groups of Cash Generating Units represent the lowest level<br />
within the Group at which goodwill is monitored for internal<br />
management purposes. The recoverable amount of the Cash<br />
Generating Unit that carries a goodwill is tested for impairment<br />
annually as of September 30, or on such other occasions that events<br />
or changes in circumstances indicate that it might be impaired. For<br />
more details refer to Note 04.<br />
If the recoverable amount of an asset is estimated to be less than its<br />
carrying amount, the carrying amount of the asset is reduced to its<br />
recoverable amount. Impairment losses are recognized as an expense<br />
immediately.<br />
In case of impairment losses related to Cash Generating Units that<br />
carry a goodwill the carrying amount of any goodwill allocated to the<br />
Cash Generating Unit is reduced first. If the amount of impairment<br />
losses exceeds the carrying amount of goodwill, the difference is<br />
generally allocated proportionally to the remaining non-current assets<br />
of the Cash Generating Unit to reduce their carrying amounts<br />
accordingly.<br />
136
3.6 Consolidated financial statements Notes to the consolidated financial statements<br />
Where an impairment loss subsequently reverses, the carrying amount<br />
of the asset (Cash Generating Unit) is increased to the revised estimate<br />
of its recoverable amount. The revised amount cannot exceed the<br />
carrying amount that would have been determined had no impairment<br />
loss been recognized for the asset (Cash Generating Unit) in prior<br />
years. A reversal of an impairment loss is recognized as income<br />
immediately. However, impairment losses of goodwill may not be<br />
reversed.<br />
Leases<br />
Leases are classified as either finance or operating. Lease transactions<br />
whereby the Group is the lessee and bears substantially all the risks<br />
and rewards incidental to ownership of an asset are accounted for as a<br />
finance lease. Accordingly, the Group capitalizes the leased asset at<br />
the lower of the fair value or the present value of the minimum lease<br />
payments and subsequently depreciates the leased asset over the<br />
shorter of the lease term and its useful life. In addition, the Group<br />
records a corresponding lease obligation on the balance sheet which is<br />
subsequently settled and carried forward using the effective interest<br />
method. All other lease agreements entered into by the Group, as a<br />
lessee, are accounted for as operating leases whereby the lease<br />
payments are expensed on a straight-line basis.<br />
Lease transactions whereby the Group is the lessor and transfers<br />
substantially all of the benefits and risks incident to the ownership of<br />
property, are accounted for as a sale and financing of the leased asset.<br />
The Group recognizes a receivable at an amount equal to the net<br />
investment in the lease and includes interest income in the<br />
consolidated income statement. All other lease agreements entered<br />
into by the Group, as a lessor, are accounted for as operating leases<br />
whereby the leased asset remains on the Group’s balance sheet and is<br />
depreciated. Scheduled lease payments are recognized in income on a<br />
straight-line basis over the lease term.<br />
Inventories<br />
Inventories are stated at the lower of acquisition/manufacturing cost or<br />
net realizable value. Net realizable value is the estimated selling price<br />
in the ordinary course of business less estimated costs of completion<br />
and selling costs. In general, inventories are valued using the average<br />
cost method. Manufacturing cost includes direct material, labor and<br />
allocable material and manufacturing overhead based on normal<br />
operating capacity.<br />
Consolidated financial statements<br />
136 | 137<br />
Financial instruments<br />
A financial instrument is any contract that at the same time gives rise<br />
to a financial asset of one entity and a financial liability or equity<br />
instrument of another entity. Financial instruments are recognized as<br />
soon as ThyssenKrupp becomes a contracting party to the financial<br />
instrument. In cases where trade date and settlement date do not<br />
coincide, the settlement date is used for initial recognition or<br />
derecognition. Financial instruments stated as financial assets or<br />
financial liabilities are generally not offset; they are only offset when a<br />
legal right to set-off exists at that time and settlement on a net basis is<br />
intended.<br />
Determining fair value<br />
The fair value of financial instruments is generally equal to the amount<br />
the Group would receive or pay if it exchanged or settled the financial<br />
instruments on the balance sheet date. If available, quoted market<br />
prices are used for financial instruments, especially for those<br />
categorized as available-for-sale financial assets. Otherwise, fair<br />
values are calculated based on the market conditions prevailing on the<br />
balance sheet date – interest rates, exchange rates, commodity prices<br />
– using middle rates or prices. In doing so, fair values are calculated<br />
using common methods, such as the option pricing models for<br />
currency and interest rate options or the discounted cash flow method<br />
for interest rate swaps. The fair values of some derivatives are based<br />
on external valuations by our financial partners.<br />
Financial assets<br />
In particular, financial assets include trade accounts receivable, cash<br />
and cash equivalents, derivative financial assets, as well as equity<br />
instruments and bonds held. Financial assets are initially recognized at<br />
fair value. This includes any transaction costs directly attributable to<br />
the acquisition of financial assets, which are not carried at fair value<br />
through profit or loss in future periods. The fair values recognized on<br />
the balance sheet usually reflect the market prices of the financial<br />
assets.<br />
Trade accounts receivable and other current receivables<br />
Receivables are accounted for at amortized cost less valuation<br />
allowances.
3.6 Consolidated financial statements Notes to the consolidated financial statements<br />
3.6 Consolidated financial statements Notes to the consolidated financial statements<br />
Impairments in the form of individual allowances for doubtful accounts<br />
adequately consider default risk. When there is objective evidence of<br />
default, the receivable concerned is derecognized. Receivables that are<br />
immaterial, and receivables of similar default risk, are grouped<br />
together and tested collectively for impairment based on past<br />
experience. Partially, impairments are accounted for using separate<br />
allowance accounts. Whether default risk is recognized by means of an<br />
allowance account or a direct derecognition of the receivable depends<br />
on the probability of default and the reliability of its estimation.<br />
Receivables that do not bear interest or bear below market interest<br />
rates and have an expected term of more than one year are discounted<br />
with the discount subsequently amortized to interest income over the<br />
term of the receivable.<br />
The Group sells undivided interests in certain trade accounts and notes<br />
receivable both on an ongoing and one-time basis to special purpose<br />
entities, which are not required to be consolidated, or to other lending<br />
institutions. Financial assets sold under these arrangements are<br />
excluded from accounts receivable in the Group’s balance sheet at the<br />
time of sale if it is assured that the cash flows related to those<br />
receivables will be passed through to the acquirer and substantially all<br />
risks and rewards have been transferred. If substantially all risks and<br />
rewards have neither been transferred nor retained, financial assets<br />
are excluded from the books at the time of the sale if it is assured that<br />
the cash flows of the receivables will be passed through to the acquirer<br />
and the acquirer has gained control over the receivables. If<br />
substantially all risks and rewards have been retained financial assets<br />
remain in the Group’s balance sheet as collateral for borrowings.<br />
Cash and cash equivalents<br />
Cash and cash equivalents include cash on hand and demand deposits<br />
as well as financial assets that are readily convertible to cash and<br />
which are only subject to an insignificant risk of change in value, they<br />
are measured at amortized cost.<br />
Financial assets held for trading<br />
Derivatives that are not part of an effective hedge accounting in<br />
accordance with IAS 39 must be assigned to this category when the<br />
fair value is positive as of measurement date. Gains or losses resulting<br />
from changes in fair value are recognized in profit or loss.<br />
Available-for-sale financial assets<br />
Available-for-sale financial assets are those non-derivative financial<br />
assets not assigned to any of the above categories (trade accounts<br />
receivable and other current receivables, cash and cash equivalents,<br />
and financial assets held for trading). This category includes primarily<br />
equity and debt instruments which are in general measured at fair<br />
value. Gains or losses resulting from the measurement of available-forsale<br />
financial assets are recognized directly in equity, with the<br />
exception of impairment losses and foreign currency conversion<br />
effects. On disposal of these financial assets, a cumulative gain or loss<br />
recognized directly in equity until then is recognized in profit or loss of<br />
the respective period. When the fair value of unlisted equity<br />
instruments cannot be reliably measured, they are measured at cost.<br />
Financial assets measured at fair value through profit or loss<br />
The Group does not use the option to categorize financial assets at fair<br />
value through profit or loss when initially recognized.<br />
Impairment of financial assets<br />
At each balance sheet date, an assessment is made of whether there<br />
is any objective evidence that the carrying amounts of financial assets<br />
not carried at fair value through profit or loss are impaired. Objective<br />
evidence includes, for example, considerable financial difficulty of the<br />
debtor obligor, disappearance of an active market, and significant<br />
changes in the technological, market, economic or legal environment.<br />
A significant or prolonged decline in the fair value of an equity<br />
instrument is an objective evidence of impairment.<br />
The impairment loss on a financial asset carried at amortized cost is<br />
measured as the difference between the asset’s carrying amount and<br />
the present value of estimated future cash flows discounted at the<br />
financial asset’s original effective interest rate. An impairment loss is<br />
recognized in profit or loss.<br />
138
3.6 Consolidated financial statements Notes to the consolidated financial statements<br />
If in a subsequent period, the amount of the impairment loss<br />
decreases and the decrease can be related objectively to an event<br />
occurring after the impairment was recognized, the previously<br />
recognized impairment loss is reversed through profit or loss.<br />
If the decrease in fair value of an available-for-sale financial asset was<br />
previously recognized directly in equity, such loss is transferred from<br />
equity to profit or loss as soon as an objective evidence of an<br />
impairment loss exists. The amount of the impairment represents the<br />
difference between historical cost (less any redemption and<br />
amortization) and the current fair value less any impairment loss on<br />
that financial asset previously recognized in profit or loss. Impairment<br />
losses on equity instruments classified as available-for-sale and<br />
recognized in the income statement are not reversed through profit or<br />
loss, but rather through equity. The amount of any reversal of any<br />
write-down of debt instruments, which objectively occurred after the<br />
impairment was recognized, is recognized in profit or loss.<br />
Financial liabilities<br />
Financial liabilities are liabilities that must be settled in cash or other<br />
financial assets. These especially include trade accounts payable,<br />
derivative financial liabilities and components of financial debt, mainly<br />
bonds and other securitized liabilities, liabilities to financial institutions<br />
and finance lease liabilities. Financial liabilities are initially carried at<br />
fair value. This includes any transaction costs directly attributable to<br />
the acquisition of financial liabilities, which are not carried at fair value<br />
through profit or loss in future periods.<br />
Trade accounts payable and other non-derivative financial<br />
liabilities<br />
Trade accounts payable and other non-derivative financial liabilities are<br />
in general measured at amortized cost using the effective interest<br />
method. Finance charges, including premiums payable on redemption<br />
or settlement, are periodically accrued and increase the liabilities’<br />
carrying amounts unless they have already been settled in the period<br />
in which they were incurred.<br />
Consolidated financial statements<br />
138 | 139<br />
Financial liabilities carried at fair value through profit or loss<br />
The Group does not use the option to categorize financial liabilities at<br />
fair value through profit or loss when initially recognized.<br />
Financial liabilities held for trading<br />
Derivatives that are not part of an effective hedge accounting in<br />
accordance with IAS 39 must be classified as “held for trading” and<br />
thus carried at fair value through profit or loss. In the event of negative<br />
fair values, such derivatives are recognized as “financial liabilities held<br />
for trading”.<br />
Derivative financial instruments<br />
The Group generally uses derivative financial instruments to hedge its<br />
exposure to foreign currency exchange rate, interest rate and<br />
commodity price risks arising from operational, financing and<br />
investment activities. Derivatives are used generally to hedge existing<br />
or anticipated underlying transactions. Such derivatives and so-called<br />
“embedded derivatives”, which are an integral part of a non-derivative<br />
host contract and must be accounted for separately, are measured<br />
initially and subsequently at fair value through profit or loss. Gains or<br />
losses due to fluctuations in fair value are recognized immediately in<br />
profit or loss.<br />
If derivatives are used to hedge the exposure to variability in cash<br />
flows and to hedge balance sheet items, the hedging relationship<br />
qualifies for hedge accounting under IAS 39 if certain conditions are<br />
met. This can reduce volatility in the income statement. There are three<br />
types of hedging relationships: fair value hedge, cash flow hedge and<br />
hedge of a net investment in a foreign operation.<br />
In a fair value hedge, which is a hedge of the exposure to changes in<br />
fair value of a recognized asset or liability or an unrecognized firm<br />
commitment, the hedging instrument is stated at fair value and any<br />
changes in fair value are immediately recognized in profit or loss.<br />
Changes in fair value of a hedged asset, liability or firm commitment,<br />
which are attributable to a particular hedged risk, are also recognized
3.6 Consolidated financial statements Notes to the consolidated financial statements<br />
3.6 Consolidated financial statements Notes to the consolidated financial statements<br />
in profit or loss. Given a perfect hedge, changes in fair value of the<br />
underlying and hedging transactions are almost entirely offset. If the<br />
asset or liability is measured at amortized cost according to general<br />
accounting guidelines, its carrying amount must be adjusted for the<br />
cumulative changes in fair value resulting from the hedged risk.<br />
However, if the hedged item (e.g. available-for-sale security) is<br />
recognized at fair value without influencing the income statement in<br />
accordance with the general accounting guidelines, changes in fair<br />
value resulting from the hedged risk are recognized in profit or loss,<br />
contrary to the general guidelines.<br />
A cash flow hedge is a hedge of the exposure to variability in cash<br />
flows associated with a recognized asset or liability, a highly probable<br />
forecast transaction, or foreign currency risk of a firm commitment.<br />
The effective portion of the fluctuations in fair value is immediately<br />
recognized in equity. The effective portion is reclassified from equity to<br />
profit or loss in the same period during which the hedged underlying<br />
transaction affects profit or loss. If a hedge subsequently results in the<br />
recognition of a non-financial asset (e.g. property, plant and<br />
equipment or inventories), then the fluctuations in fair value that were<br />
recognized in equity affect the value of the non-financial asset. When<br />
measuring the effectiveness between the underlying hedged<br />
transaction and the hedging instrument the remaining ineffective<br />
portion of the hedge and adjustments due to interest rate changes are<br />
immediately recognized in the consolidated statement of income. In the<br />
case of currency risks, the effectiveness of the hedging relationship is<br />
established by including changes in value due to spot rate changes as<br />
a hedged risk and excluding the interest component.<br />
When the hedging instrument expires or is sold, terminated or<br />
exercised, or the hedging relationship is discontinued, but the forecast<br />
underlying transaction is still expected to occur, the cumulative gain or<br />
loss on the hedging instrument that has been recognized in equity<br />
remains separately in equity until the forecast transaction occurs. It is<br />
recognized in profit or loss as detailed above when the transaction<br />
affects the income statement. If the hedged forecast transaction is no<br />
longer expected to occur, any related cumulative unrealized gain or<br />
loss recognized in equity is recognized immediately in the consolidated<br />
statement of income.<br />
The Group mainly uses cash flow hedges to hedge its exposure to<br />
changes in foreign currency rates, interest rates and commodity<br />
prices. In addition, the Group carries out hedging in accordance with<br />
the basic principles of risk management under which existing risks are<br />
hedged economically, but the hedges do not comply with the strict<br />
hedge accounting requirements under IAS 39. The Group does not use<br />
hedge accounting for foreign currency derivatives that have been<br />
concluded to hedge foreign currency risks arising from monetary<br />
balance sheet items. Thus, the effects from the foreign currency<br />
conversion of balance sheet items recognized in profit or loss are offset<br />
against the fluctuations in fair value of derivatives, which are also<br />
recognized in profit or loss.<br />
Currently, the Group does not apply hedging of a net investment in a<br />
foreign operation.<br />
More information about financial instruments is provided in Note 22.<br />
Deferred income taxes<br />
Deferred tax is accounted for using the balance sheet liability method<br />
in respect of temporary differences between the carrying amount of<br />
assets and liabilities in the financial statements and the corresponding<br />
tax basis used in the computation of taxable profit as well as for<br />
unused tax losses or credits. In principle, deferred tax liabilities are<br />
recognized for all taxable temporary differences and deferred tax<br />
assets are recognized to the extent that it is probable that taxable<br />
profits will be available against which deductible temporary differences<br />
can be utilized. Deferred tax assets and liabilities are also recognized<br />
on temporary differences arising from business combinations except to<br />
the extent they arise from goodwill that is not taken into account for tax<br />
purposes.<br />
Deferred taxes are calculated at the enacted or substantially enacted<br />
tax rates that are expected to apply when the asset or liability is<br />
settled. Deferred tax is charged or credited to the income statement,<br />
except when it relates to items credited or charged directly to equity, in<br />
which case the deferred tax is also recognized directly in equity.<br />
140
3.6 Consolidated financial statements Notes to the consolidated financial statements<br />
Cumulative other comprehensive income<br />
The equity line item “Cumulative other comprehensive income”<br />
includes changes in the equity of the Group that were not recognized in<br />
the consolidated statement of income of the period, except those<br />
resulting from investments by owners and distributions to owners.<br />
Cumulative other comprehensive income includes foreign currency<br />
translation adjustments, unrealized holding gains and losses on<br />
available-for-sale financial assets and on derivative financial<br />
instruments as well as the share of the other comprehensive income of<br />
associates and joint ventures accounted for using the equity method.<br />
Actuarial gains and losses are reported in retained earnings in the<br />
period that they are recognized as other comprehensive income.<br />
Accrued pension and similar obligations<br />
The Group’s net obligation for defined benefit and other postretirement<br />
benefit plans have been calculated for each plan using the projected<br />
unit credit method as of the balance sheet date. A quarterly valuation<br />
of pensions and health care obligations is performed on the basis of<br />
updated interest rates and fair values of plan assets.<br />
All actuarial gains and losses as of October 01, 2004, the date of<br />
transition to IFRS, were recognized in equity. Actuarial gains and<br />
losses that arise subsequent to October 01, 2004, as well as gains and<br />
losses resulting from asset ceiling are recognized directly in equity and<br />
presented in the statement of comprehensive income.<br />
As far as the fair value of plan assets related to pensions or similar<br />
obligations exceeds the corresponding obligation, the recognition of an<br />
asset in respect to such surplus is limited. As far as in connection with<br />
plan assets minimum funding requirements related to past service<br />
exist, an additional liability may need to be recognized in case the<br />
economic benefit of a surplus – already taking into account the<br />
contributions to be made in respect of the minimum funding<br />
requirements – is limited. The limit is determined by unrecognized past<br />
service costs and the present value of any future refunds from the plan<br />
or reductions in future contributions to the plan (asset ceiling).<br />
Consolidated financial statements<br />
140 | 141<br />
Service cost for pensions and other postretirement obligations are<br />
recognized as an expense in income from operations, while interest<br />
cost and the expected return on plan assets recognized as components<br />
of net periodic pension cost are included in net financial<br />
income/(expense) in the Group’s consolidated statement of income.<br />
When benefits of a plan are improved, the portion of the increased<br />
benefit relating to past service is recognized as an expense in income<br />
from operations on a straight-line basis over the average period until<br />
the benefits become vested. To the extent that the benefits vest<br />
immediately, the expense is recognized immediately.<br />
The Group’s obligations for contributions to defined contribution plans<br />
are recognized as expense in income from operations as incurred.<br />
The Group also maintains multi-employer plans. In principle, these<br />
multi-employer plans contain defined benefit plans as well as defined<br />
contribution plans. With respect to defined benefit multi-employer<br />
plans these are accounted for in the same way as any other defined<br />
benefit plan in case the required information is available. Otherwise<br />
these plans are accounted for as defined contribution plans.<br />
Provisions<br />
Provisions are recognized when the Group has a present obligation as<br />
a result of a past event which will result in a probable outflow of<br />
economic benefits that can be reasonably estimated. The amount<br />
recognized represents best estimate of the settlement amount of the<br />
present obligation as of the balance sheet date. Expected<br />
reimbursements of third parties are not offset but recorded as a<br />
separate asset if it is virtually certain that the reimbursements will be<br />
received. Where the effect of the time value of money is material,<br />
provisions are discounted using a market rate.<br />
A provision for warranties is recognized when the underlying products<br />
or services are sold. The provision is based on historical warranty data<br />
and a weighting of all possible outcomes against their associated<br />
probabilities.
3.6 Consolidated financial statements Notes to the consolidated financial statements<br />
3.6 Consolidated financial statements Notes to the consolidated financial statements<br />
Provisions for restructuring costs are recognized when the Group has a<br />
detailed formal plan for the restructuring and has notified the affected<br />
parties.<br />
A provision for onerous contracts is recognized when the expected<br />
benefits to be derived by the Group from a contract are lower than the<br />
unavoidable cost of meeting its obligations under the contract.<br />
Share-based compensation<br />
The Group has management incentive plans which grant stock rights to<br />
executive and senior employees. The fair value of these rights is<br />
calculated on the date of grant and recognized as an expense on a<br />
straight-line basis over the vesting period with a corresponding<br />
increase in provisions. Furthermore a portion of the variable<br />
compensation is granted as share appreciation rights to the Executive<br />
Board members of ThyssenKrupp AG and additional selected executive<br />
employees. For both types of compensation, the provision is<br />
remeasured at each balance sheet date and at settlement date. Any<br />
changes in the fair value of the provision are recognized as part of<br />
income from operations.<br />
The Group set up an Employee Share Purchase Program for selected<br />
executive employees that grants purchase of shares at a discount.<br />
Services received are recognized on a straight-line basis based on the<br />
estimated discount with regard to the shares during the period from<br />
the offer of the Employee Share Purchase Program until the grant date<br />
which is the date when the employees accept the offer.<br />
See also information provided in Note 14.<br />
Revenue recognition<br />
Revenue from the sale of goods is recognized when the significant<br />
risks and rewards of ownership have been transferred to the buyer and<br />
the amount of revenue can be measured reliably. Revenue from<br />
services is recognized when services are rendered. No revenue is<br />
recognized if there are significant uncertainties regarding recovery of<br />
the consideration due or the possible return of goods. Revenue is<br />
recognized net of applicable provisions for discounts and allowances.<br />
Construction contract revenue and expense are accounted for using<br />
the percentage-of-completion method, which recognizes revenue as<br />
performance of the contract progresses. The contract progress is<br />
determined based on the percentage of costs incurred to date to total<br />
estimated cost for each contract after giving effect to the most recent<br />
estimates of total cost. If the construction takes a substantial period of<br />
time, contract costs also include borrowing costs that are directly<br />
attributable.<br />
Contracts where the Group provides engineering services are also<br />
accounted for like construction contracts. Construction contracts under<br />
the percentage-of-completion method are measured at construction<br />
cost plus profits earned based on the percentage of the contract<br />
completed. Revenues net of advance payments received are<br />
recognized as trade accounts receivable in the balance sheet.<br />
Variations in contract work, claims and incentive payments are<br />
included to the extent that it is probable that they will result in revenue<br />
which can be measured reliably.<br />
Where the income of a construction contract cannot be estimated<br />
reliably, contract revenue that is probable to be recovered is recognized<br />
to the extent of contract costs incurred. Contract costs are recognized<br />
as expenses in the period in which they are incurred.<br />
Where it is probable that total contract costs will exceed total contract<br />
revenue, the expected loss is recognized as an expense immediately.<br />
Revenues from contracts with multiple element arrangements, such as<br />
those including both goods and services, are recognized as each<br />
element is earned based on objective evidence of the relative fair value<br />
of each element.<br />
Interest income is accrued on a time basis by reference to the principal<br />
outstanding and at the interest rate applicable. Dividend income from<br />
investments is recognized when the shareholders’ rights to receive<br />
payment have been established.<br />
142
3.6 Consolidated financial statements Notes to the consolidated financial statements<br />
Government grants<br />
Government grants are recognized only if there is reasonable<br />
assurance that the associated conditions will be met and the grants will<br />
be received. Grants related to assets are reported as a reduction of<br />
cost of the assets concerned with a corresponding reduction of<br />
depreciation and amortization in subsequent periods. Grants related to<br />
income are stated as other operating income in the periods in which<br />
the expenses intended to be compensated by the grant are recognized.<br />
Research and development costs<br />
Research costs are expensed as incurred.<br />
Development costs, whereby research findings are applied to a plan or<br />
design for the production of new or substantially improved products<br />
and processes, are capitalized if the product or process is technically<br />
and commercially feasible, there is a market for the output of the<br />
intangible asset, the attributable expenditure can be measured reliably,<br />
and the Group has sufficient resources to complete development.<br />
Other development costs are expensed as incurred. Capitalized<br />
development costs of completed projects are stated at cost less<br />
accumulated amortization. Costs include direct costs of material, direct<br />
labour, and allocable material and manufacturing overhead. Borrowing<br />
costs directly attributable to a production of assets that necessarily<br />
takes a substantial period of time to get the assets ready for their<br />
intended use, are included in the cost of those assets until the assets<br />
are ready for their intended use. Administrative costs are capitalized<br />
only if such costs are directly related to production. Capitalized<br />
development costs of projects not yet completed are reviewed for<br />
impairment annually or more frequently when an indicator of<br />
impairment arises during the reporting year.<br />
Earnings per share<br />
Basic earnings per share amounts are calculated by dividing net<br />
income/(loss) attributable to ThyssenKrupp AG’s shareholders by the<br />
weighted average number of shares outstanding. Shares sold during<br />
the period and shares reacquired during the period are weighted for<br />
the portion of the period that they were outstanding. There were no<br />
dilutive securities in the periods presented.<br />
Consolidated financial statements<br />
142 | 143<br />
Segment reporting<br />
In accordance with the so-called management approach, segment<br />
reporting of the ThyssenKrupp Group is based on the internal<br />
organizational and reporting structure. The data used to determine the<br />
internal key figures are derived from the IFRS consolidated financial<br />
statements.<br />
Single assets held for sale, disposal groups and discontinued<br />
operations<br />
A single non-current asset is classified as held for sale if its carrying<br />
amount will be recovered principally through a sale transaction rather<br />
than through continuing use. The Group reports assets and liabilities<br />
as a disposal group, that will be disposed of by sale or otherwise in a<br />
single transaction, which collectively meet the held for sale criteria as<br />
specified in IFRS 5 “Non-current Assets Held for Sale and Discontinued<br />
Operations”. The Group reports the assets and liabilities of a disposal<br />
group separately in the balance sheet line item “assets held for<br />
sale/disposal” and “liabilities associated with assets held for<br />
sale/disposal”, respectively. Unless a disposal group qualifies for<br />
discontinued operations reporting, the revenues and expenses of the<br />
disposal group remain within continuing operations until the date of<br />
disposal. The Group reports the results of a disposal group that also<br />
qualifies as a component of the Group as discontinued operations if it<br />
represents a separate major line of business or geographical area of<br />
operations. The Group reports the results of discontinued operations in<br />
the period in which they occur separately within the consolidated<br />
statement of income as “discontinued operations (net of tax)”. All prior<br />
period consolidated statements of income are adjusted to report the<br />
results of the component within discontinued operations. In the<br />
consolidated statement of cash flows the cash flows resulting from<br />
discontinued operations are presented separately from cash flows<br />
resulting from continuing operations; prior year presentation has been<br />
adjusted accordingly. In order to present the proportion of income/loss<br />
attributable to discontinued operations, net sales and expenses arising<br />
from intercompany transactions are eliminated provided that these<br />
transactions will not continue after the disposal of the discontinued<br />
operations.
3.6 Consolidated financial statements Notes to the consolidated financial statements<br />
3.6 Consolidated financial statements Notes to the consolidated financial statements<br />
On initial classification as held for sale, non-current assets are<br />
recognized at the lower of the carrying amount and fair value less costs<br />
to sell and depreciation and amortization ceases. A disposal group is<br />
initially measured in line with the respective IFRS standards to<br />
determine the carrying amount of the disposal group which is then<br />
compared to the fair value less costs to sell of the group in order to<br />
recognize the group at the lower of both amounts. Impairment losses<br />
on initial classification as held for sale are included in profit or loss, as<br />
are gains and losses on subsequent remeasurement, but not in excess<br />
of the cumulative impairment loss.<br />
Financial statement classification<br />
Certain line items in the consolidated statement of income and on the<br />
consolidated balance sheet have been combined. These items are<br />
disclosed separately in the Notes to the consolidated financial<br />
statements. Certain reclassifications have been made to the prior year<br />
presentation to conform to that of the current year.<br />
In general the Group classifies assets and liabilities as current when<br />
they are expected to be realized or settled within twelve months after<br />
the balance sheet date. Group companies that have operating cycles<br />
longer than twelve months classify assets and liabilities as current if<br />
they are expected to be realized within the company’s normal<br />
operating cycle.<br />
Use of estimates<br />
The preparation of the Group consolidated financial statements<br />
requires Management to make judgements, estimates and<br />
assumptions that affect the application of policies and reported<br />
amounts of assets and liabilities, income and expenses. Actual results<br />
may differ from these estimates.<br />
The estimates and underlying assumptions are reviewed on an<br />
ongoing basis. Revisions to accounting estimates are recognized in the<br />
period in which the estimate is revised if the revision affects only that<br />
period, or in the period of the revision and future periods if the revision<br />
affects both current and future periods.<br />
Accounting estimates and judgements made by Management in the<br />
application of IFRS that have a significant effect on the consolidated<br />
financial statements are presented in Note 25.<br />
Recently adopted accounting standards<br />
In fiscal year 2010/2011, ThyssenKrupp adopted the following<br />
standards, interpretations and amendments to already existing<br />
standards:<br />
In October 2009 the IASB issued an amendment to IAS 32 “Financial<br />
Instruments: Presentation”. The amendment addresses the accounting<br />
for rights, options and warrants issues that are denominated in a<br />
currency other than the functional currency of the issuer. The<br />
amendment is compulsory for fiscal years beginning on or after<br />
February 01, 2010. The adoption of the amended standard did not<br />
have a material impact on the Group’s consolidated financial<br />
statements.<br />
In June 2009 the IASB issued an amendment to IFRS 2 “Share-based<br />
Payment – Group Cash-settled Share-based Payment Transactions”<br />
that clarify the accounting for Group cash-settled share-based payment<br />
transactions in the individual financial statements of the subsidiary.<br />
Furthermore the amendment to IFRS 2 incorporates guidance<br />
previously included in IFRIC 8 “Scope of IFRS 2” and IFRIC 11 “IFRS 2<br />
– Group and Treasury Share Transactions”. The application of the<br />
amended standard is compulsory for fiscal years beginning on or after<br />
January 01, 2010. The adoption of the amended standard did not<br />
have a material impact on the Group’s consolidated financial<br />
statements.<br />
In November 2008 the IFRIC issued IFRIC 17 “Distributions of Noncash<br />
Assets to Owners”. The interpretation addresses the accounting<br />
of distributions of assets other than cash to its owners. IFRIC 17 is<br />
compulsory for fiscal years beginning after October 31, 2009. The<br />
adoption of the interpretation did not have a material impact on the<br />
Group’s consolidated financial statements.<br />
In January 2009 the IFRIC issued IFRIC 18 “Transfers of Assets from<br />
Customers”. IFRIC 18 clarifies the requirements of IFRSs for<br />
agreements in which an entity receives from a customer an item of<br />
property, plant and equipment that the entity must then either use to<br />
connect the customer to a network or to provide the customer with<br />
ongoing access to a supply of goods or services. The interpretation is<br />
compulsory for fiscal years beginning after October 31, 2009. The<br />
adoption of the interpretation did not have a material impact on the<br />
Group’s consolidated financial statements.<br />
144
3.6 Consolidated financial statements Notes to the consolidated financial statements<br />
In November 2009 the IFRIC issued IFRIC 19 “Extinguishing Financial<br />
Liabilities with Equity Instruments”. The interpretation clarifies the<br />
requirements of IFRS when an entity renegotiates the terms of a<br />
financial liability with its creditor and the creditor agrees to accept the<br />
entity’s shares or other equity instruments to settle the financial liability<br />
fully or partially. The application of the interpretation is compulsory for<br />
fiscal years beginning on or after July 01, 2010. The adoption of the<br />
interpretation did not have a material impact on the Group’s<br />
consolidated financial statements.<br />
In April 2009 the IASB issued the second omnibus standard<br />
“Improvements to IFRSs” as part of its annual improvement process<br />
project. This standard slightly adjusts ten existing standards and two<br />
interpretations by fifteen amendments. Unless otherwise specified, the<br />
amendments are effective for fiscal years beginning on or after<br />
January 01, 2010. The adoption of the amended standards and<br />
interpretations did not have a material impact on the Group’s<br />
consolidated financial statements.<br />
Recently issued accounting standards<br />
In fiscal year 2010/2011, the following standards, interpretations and<br />
amendments have been issued which still must be endorsed by the EU<br />
before they can be adopted:<br />
In December 2010 the IASB issued an amendment to IAS 12 “Income<br />
Taxes”. Under IAS 12, the measurement of deferred taxes depends on<br />
whether the carrying amount of an asset is recovered through use or<br />
sale. Such assessment is often difficult, in particular when the asset is<br />
measured using the fair value model in IAS 40 for investment property.<br />
The amendment introduces a presumption that in general an<br />
investment property is recovered through sale. The application of the<br />
amended standard is compulsory for fiscal years beginning on or after<br />
January 01, 2012, while earlier application is permitted. Currently,<br />
Management does not expect the adoption of the amended standards<br />
– if endorsed by the EU in the current version – to have an impact on<br />
the Group’s consolidated financial statements because currently<br />
investment property is accounted for at cost less accumulated<br />
depreciation.<br />
Consolidated financial statements<br />
144 | 145<br />
In May 2011 the IASB issued three new standards dealing with various<br />
aspects of interests in entities: IFRS 10 “Consolidated Financial<br />
Statements”, IFRS 11 “Joint Arrangements” and IFRS 12 “Disclosure<br />
of Interests in Other Entities”. At the same time it issued amended<br />
versions of IAS 27 “Separate Financial Statements” (2011) and IAS 28<br />
“Investments in Associates and Joint Ventures” (2011).<br />
IFRS 10 introduces a single definition for the concept of control for all<br />
entities, thus creating a standard basis for determining whether a<br />
parent-subsidiary relationship exists and should be included in the<br />
scope of consolidation. The standard contains comprehensive<br />
guidance for determining whether control exists. It completely replaces<br />
SIC-12 “Consolidation – Special Purpose Entities” and partly replaces<br />
IAS 27 “Consolidated and Separate Financial Statements”.<br />
IFRS 11 prescribes the accounting for circumstances in which an entity<br />
exercises joint control of a joint venture or joint operation. The new<br />
standard replaces IAS 31 “Interests in Joint Ventures” and SIC-13<br />
“Jointly Controlled Entities – Non-Monetary Contributions by<br />
Venturers”.<br />
IFRS 12 combines in one standard all disclosure requirements for<br />
interests in other entities, including interests in subsidiaries,<br />
associates, joint arrangements and structured entities. The new<br />
standard replaces the previous disclosure requirements in IAS 27<br />
“Consolidated and Separate Financial Statements”, IAS 28<br />
“Investments in Associates”, IAS 31 “Interests in Joint Ventures” and<br />
SIC-12 “Consolidation – Special Purpose Entities”.<br />
The amended IAS 27 now focuses solely on accounting and disclosure<br />
requirements for investments in subsidiaries, joint ventures and<br />
associates when separate financial statements according to IFRS are<br />
presented.<br />
The amended IAS 28 prescribes the accounting for investments in<br />
associates and sets out the requirements for the application of the<br />
equity method when accounting for investments in associates and joint<br />
ventures.
3.6 Consolidated financial statements Notes to the consolidated financial statements<br />
3.6 Consolidated financial statements Notes to the consolidated financial statements<br />
The new and amended standards are applicable for fiscal years<br />
beginning on or after January 01, 2013. Earlier application is<br />
permitted, but as well as disclosing the fact it has adopted early, an<br />
entity must early-adopt each of IFRS 10, IFRS 11, IFRS 12, IAS 27<br />
(2011) and IAS 28 (2011) at the same time. An exception to this<br />
requirement exists for IFRS 12; its disclosure requirements may be<br />
early-adopted either in full or in part. Currently, Management is not<br />
able to finally assess the impacts of the adoption of IFRS 10, 11 and<br />
12 – if endorsed by the EU in the current version.<br />
In May 2011 the IASB issued the new standard IFRS 13 “Fair Value<br />
Measurement”. IFRS 13 contains a definition of fair value and rules on<br />
how to determine it if other IFRS standards require fair value<br />
measurement; the standard itself does not prescribe in which cases<br />
fair value is to be used. With the exception of the standards explicitly<br />
excluded in IFRS 13, IFRS 13 defines standard disclosure requirements<br />
for all assets and liabilities that are measured at fair value and for all<br />
assets and liabilities for which disclosure of fair value in the notes to<br />
the consolidated financial statements is required; in particular it widens<br />
the disclosure requirements for non-financial assets. The new standard<br />
is compulsory for fiscal years beginning on or after January 01, 2013<br />
and shall be applied prospectively; earlier application is permitted. In<br />
the first year of application comparative information is not required.<br />
Currently, Management expects that the adoption of the new standard<br />
– if endorsed by the EU in the current version – will result in additional<br />
disclosures.<br />
In June 2011 the IASB issued amendments to IAS 1 “Presentation of<br />
Financial Statements” under the title “Presentation of Items of Other<br />
Comprehensive Income”. The amendments require a classification of<br />
items presented in other comprehensive income into items that might<br />
subsequently be reclassified to the income statement and items that<br />
will not. The amendments to IAS 1 are compulsory for fiscal years<br />
beginning on or after July 01, 2012; earlier application is permitted.<br />
Currently, Management does not expect the adoption of the<br />
amendments – if endorsed by the EU in the current version – to have a<br />
material impact on the Group’s consolidated financial statements.<br />
In June 2011 the IASB issued amendments to IAS 19 “Employee<br />
Benefits”. The amendments mainly concern the elimination of deferred<br />
recognition of actuarial gains and losses (corridor method) in favour of<br />
immediate recognition in other comprehensive income in equity, the<br />
presentation of changes to net liabilities/assets under defined benefit<br />
pension plans, and the recognition of a net interest expense or income<br />
resulting from net liabilities or assets of a pension plan. Furthermore<br />
additional disclosure regarding the characteristics of pension plans and<br />
the associated risks for the entity is required. The amendments to IAS<br />
19 are compulsory for fiscal years beginning on or after January 01,<br />
2013; earlier application is permitted. Currently, Management is not<br />
able to finally assess the impacts of the adoption of the amendments<br />
to IAS 19 – if endorsed by the EU in the current version. The adoption<br />
of the amended standard will result in additional disclosures.<br />
In October 2011 the IASB issued the IFRIC interpretion 20 “Stripping<br />
Costs in the Production Phase of a Surface Mine”. The interpretation<br />
regulates the accounting for stripping costs in the production phase of<br />
a surface mine. The interpretation clarifies under which conditions an<br />
asset must be recognized for the relating stripping measures and how<br />
initial and subsequent measurement of this asset has to be<br />
determined. The interpretation is compulsory for fiscal years beginning<br />
on or after January 01, 2013; earlier application is permitted.<br />
Currently, Management does not expect the adoption of the<br />
interpretation – if endorsed by the EU in the current version – to have<br />
an impact on the Group’s consolidated financial statements.<br />
146
3.6 Consolidated financial statements Notes to the consolidated financial statements<br />
02 Acquisitions and disposals<br />
Year ended September 30, 2011<br />
In the year ended September 30, 2011 the Group acquired companies<br />
that are, on an individual basis, immaterial. Based on the values as of<br />
the acquisition date, these acquisitions affected in total the Group’s<br />
consolidated financial statements as presented below:<br />
million €<br />
Goodwill<br />
Year ended<br />
Sept. 30,<br />
2011<br />
32<br />
Other intangible assets 25<br />
Property, plant and equipment 1<br />
Trade accounts receivable 2<br />
Other current non-financial assets 1<br />
Total assets acquired 61<br />
Deferred tax liabilities 1<br />
Other current provisions 1<br />
Trade accounts payable 1<br />
Other current non-financial liabilities 1<br />
Total liabilities assumed 4<br />
Net assets acquired 57<br />
Non-controlling interest 0<br />
Purchase prices 57<br />
thereof: paid in cash and cash equivalents 47<br />
In addition, in the year ended September 30, 2011 the Group sold the<br />
Spanish ThyssenKrupp Xervon S.A. in the Materials Services business<br />
area and the Iranian company ThyssenKrupp Assanbar PJSC in the<br />
Elevator Technology business area as part of the portfolio optimization.<br />
Both companies were classified as disposal groups as of September<br />
30, 2010 because the disposals had been initiated; consummation<br />
took place in October 2010 and in September 2011, respectively.<br />
These two disposals, the disposal of the Metal Forming Group without<br />
the Chinese activities as well as the disposals of companies that were,<br />
on an individual basis, immaterial, affected in total the Group’s<br />
consolidated financial statements as presented below based on the<br />
values as of the disposal date:<br />
Consolidated financial statements<br />
146 | 147<br />
million €<br />
Goodwill<br />
Year ended<br />
Sept. 30,<br />
2011<br />
2<br />
Other intangible assets 3<br />
Property, plant and equipment 244<br />
Other non-current non-financial assets 2<br />
Deferred tax assets 9<br />
Inventories 141<br />
Trade accounts receivable 204<br />
Other current financial assets 9<br />
Other current non-financial assets 48<br />
Cash and cash equivalents 45<br />
Total assets disposed of 707<br />
Accrued pension and similar obligations 57<br />
Other non-current provisions 6<br />
Deferred tax liabilities 11<br />
Other current provisions 31<br />
Current income tax liablilities 2<br />
Current financial debt 160<br />
Trade accounts payable 156<br />
Other current financial liabilities 17<br />
Other current non-financial liabilities 102<br />
Total liabilities disposed of 542<br />
Net assets disposed of 165<br />
Cumulative other comprehensive income 20<br />
Non-controlling interest 0<br />
Gain/(loss) resulting from the disposals (8)<br />
Selling prices 177<br />
thereof: received in cash and cash equivalents 156
3.6 Consolidated financial statements Notes to the consolidated financial statements<br />
3.6 Consolidated financial statements Notes to the consolidated financial statements<br />
Year ended September 30, 2010<br />
In the year ended September 30, 2010 the Group acquired companies<br />
that are, on an individual basis, immaterial. Based on the values as of<br />
the acquisition date, these acquisitions affected in total the Group’s<br />
consolidated financial statements as presented below:<br />
million €<br />
Goodwill<br />
Year ended<br />
Sept. 30,<br />
2010<br />
10<br />
Other intangible assets 5<br />
Property, plant and equipment 16<br />
Deferred tax assets 1<br />
Inventories 6<br />
Trade accounts receivable 10<br />
Cash and cash equivalents 3<br />
Total assets acquired 51<br />
Deferred tax liabilities 1<br />
Other current provisions 1<br />
Current financial debt 19<br />
Trade accounts payable 6<br />
Other current non-financial liabilities 3<br />
Total liabilities assumed 30<br />
Net assets acquired 21<br />
Non-controlling interest 1<br />
Purchase prices 20<br />
thereof: paid in cash and cash equivalents 13<br />
thereof: paid in equity instruments 7<br />
In addition, in the year ended September 30, 2010 the Group sold<br />
ThyssenKrupp Industrieservice and ThyssenKrupp Safway of the<br />
Materials Services business area as part of the portfolio optimization.<br />
Both businesses were classified as disposal groups as of September<br />
30, 2009 because the disposals had been initiated; consummation<br />
took place end of November 2009 and mid of December 2009,<br />
respectively. These two disposals, the disposal of HSY as well as the<br />
disposals of companies that were, on an individual basis, immaterial,<br />
affected in total the Group’s consolidated financial statements as<br />
presented below based on the values as of the disposal date:<br />
million €<br />
Goodwill<br />
Year ended<br />
Sept. 30,<br />
2010<br />
97<br />
Other intangible assets 5<br />
Property, plant and equipment 173<br />
Investments accounted for using the equity method 1<br />
Other non-current financial assets 3<br />
Deferred tax assets 2<br />
Inventories 32<br />
Trade accounts receivable 179<br />
Other current financial assets 10<br />
Other current non-financial assets 20<br />
Current income tax assets 6<br />
Cash and cash equivalents 6<br />
Total assets disposed of 534<br />
Accrued pension and similar obligations 54<br />
Other non-current provisions 23<br />
Deferred tax liabilities 27<br />
Non-current financial debt 2<br />
Other current provisions 45<br />
Current income tax liablilities 15<br />
Current financial debt 45<br />
Trade accounts payable 35<br />
Other current financial liabilities 142<br />
Other current non-financial liabilities 71<br />
Total liabilities disposed of 459<br />
Net assets disposed of 75<br />
Cumulative other comprehensive income 13<br />
Non-controlling interest 1<br />
Gain/(loss) resulting from the disposals 223<br />
Selling prices 310<br />
thereof: received in cash and cash equivalents 310<br />
148
3.6 Consolidated financial statements Notes to the consolidated financial statements<br />
03 Discontinued operations, disposal groups and single assets<br />
held for sale<br />
As part of the portfolio optimization program and of the decision about<br />
the concept for the further strategic development in May 2011, in fiscal<br />
year 2010/2011 as well as in fiscal year 2009/2010 the Group has<br />
initiated the sale and the disposal of several businesses. With one<br />
exception these transactions have not met the requirements of IFRS 5<br />
for a presentation as a discontinued operation. Therefore, revenues<br />
and expenses will continue to be presented as income from continuing<br />
operations until the date of the disposal. Only the initiated disposal of<br />
the entire Stainless Global business area met the criteria for a<br />
presentation as a discontinued operation as of September 30, 2011.<br />
Therefore, all revenues and expenses of this business area will be<br />
presented in the consolidated statement of income in the line item<br />
“Discontinued operations (net of tax)”. The prior year presentation has<br />
been adjusted accordingly. For entities for which the disposal has not<br />
been completed as of September 30 of the respective fiscal year, the<br />
assets and liabilities of the disposal group and of the discontinued<br />
operation have been disclosed separately in the consolidated balance<br />
sheet as of September 30 of this fiscal year as “assets held for<br />
sale/disposal” and “liabilities associated with assets held for<br />
sale/disposal”.<br />
Year ended September 30, 2011<br />
In April 2010 the disposal of parts of the Marine Systems business<br />
area has been initiated as part of the portfolio optimization program.<br />
The transaction comprises the disposal of Blohm + Voss Shipyards<br />
GmbH, operating in shipbuilding in particular of premium-segment<br />
yachts, and of Blohm + Voss Repair GmbH and Blohm + Voss<br />
Industries GmbH, both engaged in ship repairing and the<br />
manufacturing of components. Additionally, the construction capacities<br />
for civil ship construction of former HDW Gaarden are part of the<br />
disposal group. In the year ended September 30, 2011, the civil part of<br />
former HDW Gaarden has been disposed of. Due to the termination of<br />
the negotiations with the Abu Dhabi MAR Group on the complete<br />
takeover of the civil shipbuilding activities and a joint venture in naval<br />
surface ship building, as of June 30, 2011, assets held for sale of<br />
€133 million and liabilities associated with assets held for sale of €145<br />
million have been reclassified to the corresponding balance sheet<br />
Consolidated financial statements<br />
148 | 149<br />
positions. As of September 30, 2011, the sale of the civil operations of<br />
Blohm + Voss is still part of the disposal group - this is the yacht<br />
building and repair and components businesses in Hamburg. The<br />
assets and liabilities of the disposal group as of September 30, 2011<br />
are presented in the following table:<br />
million €<br />
Goodwill<br />
Sept. 30,<br />
2011<br />
180<br />
Other intangible assets 11<br />
Property, plant and equipment 54<br />
Deferred tax assets 3<br />
Inventories 45<br />
Trade accounts receivable 102<br />
Other current financial assets 3<br />
Other current non-financial assets 3<br />
Cash and cash equivalents 219<br />
Assets held for sale 620<br />
Accrued pension and similar obligations 45<br />
Other non-current provisions 6<br />
Other non-current financial liabilities 3<br />
Other current provisions 14<br />
Current income tax liabilities 5<br />
Current financial debt 80<br />
Trade accounts payable 30<br />
Other current financial liabilities 3<br />
Other current non-financial liabilities 139<br />
Liabilities associated with assets held for sale 325<br />
End of April 2011 the Group initiated the disposal of the Metal Forming<br />
Group in the Steel Europe business area. The group produces highquality<br />
chassis and body components in Germany, France, the UK,<br />
Spain, Poland, Turkey and China. After the approval by the European<br />
cartel authorities the sale to the Spanish Gestamp Automoción S.L.<br />
has been consummated in July 2011 with the exemption of the<br />
Chinese activities. In the context with the outstanding sale of the<br />
Chinese activities an impairment loss of €13 million on property, plant<br />
and equipment resulting from the write-down of the assets to fair value<br />
less costs to sell were recorded in cost of sales. The assets and<br />
liabilities of the Chinese activities which are still part of the disposal<br />
group as of September 30, 2011 are presented in the following table:
3.6 Consolidated financial statements Notes to the consolidated financial statements<br />
3.6 Consolidated financial statements Notes to the consolidated financial statements<br />
million €<br />
Sept. 30,<br />
2011<br />
Property, plant and equipment 11<br />
Other non-financial assets 2<br />
Deferred tax assets 1<br />
Inventories 9<br />
Trade accounts receivable 23<br />
Other current non-financial assets 4<br />
Cash and cash equivalents 15<br />
Assets held for sale 65<br />
Current financial debt 15<br />
Trade accounts payable 6<br />
Other current non-financial liabilities 10<br />
Liabilities associated with assets held for sale 31<br />
In August 2011, the Group initiated the disposal of the Xervon Group in<br />
the Materials Services business area. Xervon is one of the world’s<br />
leading providers of technical services for industrial plant construction<br />
and maintenance. In the context of the initiated disposal an impairment<br />
loss of €48 million on goodwill was recognized in other operating<br />
expenses resulting from the write-down of the assets to fair value less<br />
costs to sell. The assets and liabilities of the disposal as of September<br />
30, 2011 are presented in the following table:<br />
million €<br />
Goodwill<br />
Sept. 30,<br />
2011<br />
16<br />
Other intangible assets 3<br />
Property, plant and equipment 125<br />
Deferred tax assets 2<br />
Inventories 94<br />
Trade accounts receivable 153<br />
Other current financial assets 2<br />
Other current non-financial assets 17<br />
Cash and cash equivalents 39<br />
Assets held for sale 451<br />
Accrued pension and similar obligations 41<br />
Other non-current provisions 4<br />
Deferred tax liabilities 7<br />
Non-current financial debt 1<br />
Other current provisions 34<br />
Current income tax liabilities 4<br />
Current financial debt 167<br />
Trade accounts payable 60<br />
Other current financial liabilities 3<br />
Other current non-financial liabilities 76<br />
Liabilities associated with assets held for sale 397<br />
Discontinued operations: Stainless Global business area<br />
As part of its program for the further strategic development with the<br />
cornerstones to reduce the Group’s debt, enable sustainable growth,<br />
create value and increase earning power, in May 2011 the Group<br />
decided to focuse the portfolio and to divest businesses for which there<br />
are stronger strategic alternatives.<br />
Therefore as one measure, effective September 30, 2011, the<br />
corporate, organizational and contractual conditions for creating a<br />
separate Stainless Global and consequently the conditions for the<br />
presentation as a discontinued operation were established. The<br />
intended separation shall be carried out as an IPO, a spin-off or a sale<br />
and shall happen within 18 months after the resolution.<br />
As of September 30, 2011, the results of the Stainless Global business<br />
area that classifies as a discontinued operation are as follows:<br />
million €<br />
Year ended<br />
Sept. 30,<br />
2010<br />
150<br />
Year ended<br />
Sept. 30,<br />
2011<br />
Net sales 5,306 6,016<br />
Other income 15 16<br />
Expenses<br />
Ordinary income/(loss) from discontinued operations<br />
(5,391) (6,349)<br />
(before taxes) (70) (317)<br />
Income tax (expense)/income<br />
Ordinary income/(loss) from discontinued operations<br />
(23) (2)<br />
(net of tax)<br />
Gain/(loss) recognized on measurement adjustments<br />
(93) (319)<br />
of discontinued operations (before taxes) — (510)<br />
Income tax (expense)/income<br />
Gain/(loss) recognized on measurement adjustments<br />
— —<br />
of discontinued operations (net of tax) 0 (510)<br />
Discontinued operations (net of tax)<br />
thereof:<br />
(93) (829)<br />
ThyssenKrupp AG's stockholders (92) (829)<br />
Non-controlling interest (1) 0<br />
The measurement of discontinued operations at fair value less cost to<br />
sell based on internal calculations and market observations resulted in<br />
an impairment loss of €510 million. Thereof, €45 million applied to<br />
goodwill. The remaining impairment loss was allocated to property,<br />
plant and equipment.
3.6 Consolidated financial statements Notes to the consolidated financial statements<br />
The assets and liabilities of the discontinued operations as of<br />
September 30, 2011 are presented in the following table:<br />
million €<br />
Sept. 30,<br />
2011<br />
Other intangible assets 20<br />
Property, plant and equipment 1,805<br />
Investment property 12<br />
Investments accounted for using the equity method 15<br />
Other financial assets 2<br />
Other non-financial assets 3<br />
Deferred tax assets 110<br />
Inventories 1,801<br />
Trade accounts receivable 631<br />
Other current financial assets 59<br />
Other current non-financial assets 87<br />
Current income tax assets 15<br />
Cash and cash equivalents 65<br />
Assets held for disposal 4,625<br />
Accrued pension and similar obligations 271<br />
Other non-current provisions 104<br />
Deferred tax liabilities 118<br />
Non-current financial debt 61<br />
Other non-current non-financial liabilities 1<br />
Other current provisions 48<br />
Current income tax liabilities 9<br />
Current financial debt 156<br />
Trade accounts payable 1,356<br />
Other current financial liabilities 212<br />
Other current non-financial liabilities 135<br />
Liabilities associated with assets held for disposal 2,471<br />
Year ended September 30, 2010<br />
In April 2010 the disposal of parts of the Marine Systems business<br />
area has been initiated as part of the portfolio optimization program.<br />
The transaction comprises on the one hand of the disposals of the<br />
Blohm + Voss Naval GmbH in the context of the formation of a 50:50<br />
joint venture for the design and program management of naval vessels<br />
and on the other hand of the 100% disposal of Blohm + Voss<br />
Shipyards GmbH, operating in shipbuilding in particular of premiumsegment<br />
yachts, and of an 80% stake in each of Blohm + Voss Repair<br />
GmbH and Blohm + Voss Industries GmbH, both engaged in ship<br />
repairing and the manufacturing of components. Additionally, the<br />
construction capacities for civil ship construction of former HDW<br />
Consolidated financial statements<br />
150 | 151<br />
Gaarden will be disposed of. In the context of the initiated disposal an<br />
impairment loss of €6 million on property, plant and equipment<br />
resulting from the write-down of the assets to fair value less costs to<br />
sell were recorded in cost of sales. With regard to the amounts that will<br />
be finally deconsolidated after the consummation of the transaction,<br />
the amounts presented in the following table as of September 30,<br />
2010, are only preliminary:<br />
million €<br />
Goodwill<br />
Sept. 30,<br />
2010<br />
120<br />
Other intangible assets 11<br />
Property, plant and equipment 51<br />
Other non-current financial assets 7<br />
Deferred tax assets 10<br />
Inventories 48<br />
Trade accounts receivable 58<br />
Other current financial assets 24<br />
Other current non-financial assets 69<br />
Cash and cash equivalents 288<br />
Assets held for sale 686<br />
Accrued pension and similar obligations 125<br />
Other non-current provisions 7<br />
Deferred tax liabilities 29<br />
Other non-current financial liabilities 4<br />
Other current provisions 51<br />
Current income tax liabilities 4<br />
Current financial debt 12<br />
Trade accounts payable 55<br />
Other current financial liabilities 2<br />
Other current non-financial liabilities 216<br />
Liabilities associated with assets held for sale 505<br />
End of September 2010, the Group initiated in Spain the disposal of<br />
the ThyssenKrupp Xervon S. A in the Materials Services business area.<br />
The company provides industrial services with insulation and<br />
scaffolding. In the context of the initiated disposal an impairment loss<br />
of €2 million on goodwill was recognized in other operating expenses<br />
and an impairment loss of €1 million on property, plant and equipment<br />
was recognized in cost of sales, both resulting from the write-down of<br />
the assets to fair value less costs to sell. The assets and liabilities of<br />
the disposal as of September 30, 2010 are presented in the following<br />
table:
3.6 Consolidated financial statements Notes to the consolidated financial statements<br />
3.6 Consolidated financial statements Notes to the consolidated financial statements<br />
million €<br />
Sept. 30,<br />
2010<br />
Property, plant and equipment 1<br />
Deferred tax assets 1<br />
Trade accounts receivable 8<br />
Cash and cash equivalents 1<br />
Assets held for sale 11<br />
Deferred tax liabilities 1<br />
Other current provisions 1<br />
Current financial debt 6<br />
Trade accounts payable 1<br />
Other current non-financial liabilities 1<br />
Liabilities associated with assets held for sale 10<br />
The transaction has been consummated.<br />
End of September 2010, the Group initiated the disposal of the Iranian<br />
company ThyssenKrupp Assanbar PJSC in the Elevator Technology<br />
business area. The company produces elevators as well as installs and<br />
maintains elevators and escalators. In the context of the initiated<br />
disposal an impairment loss of €3 million on goodwill was recognized<br />
in other operating expenses and impairment losses of €1 million on<br />
other intangible asses and of €1 million on property, plant and<br />
equipment were recognized in cost of sales, each resulting from the<br />
write-down of the assets to fair value less costs to sell. The assets and<br />
liabilities of the disposal as of September 30, 2010 are presented in<br />
the following table:<br />
million €<br />
Deferred tax assets<br />
Sept. 30,<br />
2010<br />
1<br />
Inventories 11<br />
Trade accounts receivable 9<br />
Other current non-financial assets 4<br />
Cash and cash equivalents 4<br />
Assets held for sale 29<br />
Non-current financial debt 7<br />
Other current provisions. 1<br />
Current income tax liabilities 1<br />
Current financial debt 1<br />
Trade accounts payable 4<br />
Other current non-financial liabilities 15<br />
Liabilities associated with assets held for sale 29<br />
The transaction has been consummated.<br />
In addition to the assets attributable to the disposal group the line item<br />
“assets held for sale“ includes property, plant and equipment of €67<br />
million held for sale in the Steel Americas business area.<br />
152
3.6 Consolidated financial statements Notes to the consolidated financial statements<br />
Consolidated financial statements<br />
Notes to the consolidated statement of financial position<br />
04 Intangible assets<br />
Changes in the Group’s intangible assets were as follows:<br />
million €<br />
Gross amounts<br />
Franchises,<br />
trademarks<br />
and similar<br />
rights and<br />
values as well<br />
as licenses<br />
thereto<br />
Development<br />
costs,<br />
internally<br />
developed<br />
software and<br />
website Goodwill Total<br />
152 | 153<br />
Additional<br />
information:<br />
Presentation<br />
of disposal<br />
groups,<br />
discontinued<br />
operations<br />
Balance as of Sept. 30, 2009 1,349 488 4,593 6,430 145<br />
Currency differences 34 30 162 226 8<br />
Acquisitions/divestitures of businesses (5) (6) 49 38 (154)<br />
Additions 32 60 3 95 1<br />
Transfers 25 6 0 31 0<br />
Disposals (24) (15) 0 (39) 0<br />
Reclassification due to the presentation as assets held for sale (30) (1) (125) (156) 156<br />
Balance as of Sept. 30, 2010 1,381 562 4,682 6,625 156<br />
Currency differences 3 23 0 26 0<br />
Acquisitions/divestitures of businesses 9 (9) (37) (37) (5)<br />
Additions 47 19 9 75 0<br />
Transfers 20 4 0 24 0<br />
Disposals (22) (11) 0 (33) 0<br />
Reclassification due to the presentation as assets held for sale/disposal (115) (31) (698) (844) 844<br />
Balance as of Sept. 30, 2011 1,323 557 3,956 5,836 995<br />
Accumulated amortization and impairment losses<br />
Balance as of Sept. 30, 2009 743 254 791 1,788 42<br />
Currency differences 19 10 28 57 2<br />
Acquisitions/divestitures of businesses (9) (6) 55 40 (44)<br />
Amortization expense 97 37 0 134 0<br />
Impairment losses 3 5 5 13 0<br />
Reversals of impairment losses 0 0 - 0 0<br />
Transfers 0 0 0 0 0<br />
Disposals (22) (11) 0 (33) 0<br />
Reclassification due to the presentation as assets held for sale (19) (1) (5) (25) 25<br />
Balance as of Sept. 30, 2010 812 288 874 1,974 25<br />
Currency differences 0 10 6 16 0<br />
Acquisitions/divestitures of businesses (5) (7) (63) (75) (5)<br />
Amortization expense 96 42 0 138 0<br />
Impairment losses 3 3 290 296 0<br />
Reversals of impairment losses 0 (1) - (1) 0<br />
Transfers 1 0 0 1 0<br />
Disposals (20) (7) 0 (27) 0<br />
Reclassification due to the presentation as assets held for sale/disposal (100) (23) (529) (652) 652<br />
Balance as of Sept. 30, 2011 787 305 578 1,670 672<br />
Net amounts<br />
as of Sept. 30, 2009 606 234 3,802 4,642 103<br />
as of Sept. 30, 2010 569 274 3,808 4,651 131<br />
as of Sept. 30, 2011 536 252 3,378 4,166 323
3.6 Consolidated financial statements Notes Notes to to the the consolidated financial financial statements<br />
Impairment of goodwill<br />
Goodwill impairment losses are included in other operating expenses.<br />
Based on business expectations in 2009/2010 the annual impairment<br />
test did not indicate that goodwill might be impaired because the<br />
recoverable amounts of all cash generating units (CGUs) exceeded the<br />
respective carrying amounts.<br />
In the annual impairment test in 2010/2011, a more negative<br />
assessment of the economic situation and the connected surrounding<br />
conditions indicated that goodwill of the CGUs of the Stainless Global<br />
business area has to be impaired in the amount of €290 million<br />
because the recoverable amounts of the respective CGU were less than<br />
the respective carrying amounts. In the ThyssenKrupp Nirosta CGU<br />
which is a producer of stainless flat products, the impairment loss<br />
amounted to €166 million. The determination of the recoverable<br />
amount was derived from the value in use based on a discount rate of<br />
8.1%. Moreover, in the ThyssenKrupp Mexinox CGU which is bundling<br />
the Mexico business of stainless flat products, an impairment loss of<br />
€72 million had to be recognized. The determination of the recoverable<br />
amount was derived from the value in use based on a discount rate of<br />
9.3%. In the ThyssenKrupp Acciai Speciali Terni CGU which is also a<br />
producer of stainless flat products, the impairment loss amounted to<br />
€39 million. The determination of the recoverable amount was derived<br />
from the value in use based on a discount rate of 9.9%. The remaining<br />
impairment loss almost solely applies to the ThyssenKrupp Stainless<br />
International CGU. Additional adjustments are disclosed in Note 03.<br />
Impairment of other intangible assets<br />
Impairment losses of intangible assets other than goodwill are included<br />
in cost of sales.<br />
In 2009/2010 the Components Technology business area impaired in<br />
the Presta Steering and Camshafts operating units capitalized<br />
development costs of €5 million because the recognition criteria of IAS<br />
38 were no longer met.<br />
Goodwill<br />
Goodwill (excluding goodwill of equity method investments) has been<br />
allocated to cash generating units within all business areas. The<br />
recoverable amount of each cash generating unit is determined based<br />
on a value in use calculation using after-tax cash flow projections<br />
based on bottom-up prepared financial budgets approved by<br />
ThyssenKrupp AG’s management covering a four-year period. The<br />
budgeted last year is generally used to determine the cash flows<br />
beyond the budgeted period. No growth rate is taken into account to<br />
extrapolate the budgeted last year. The weighted average cost of<br />
capital discount rate is based on a risk-free interest rate of 3.25% and<br />
a market risk premium of 5%. Moreover for each CGU an individual<br />
beta derived from the relevant peer group, a debt capital spread and<br />
an individual capital structure is used. In addition CGU specific tax<br />
rates are used. The following after-tax discount rate ranges have been<br />
applied to the cash flow projections by business area:<br />
%<br />
154<br />
After tax discount rate ranges<br />
Year ended<br />
Sept. 30,<br />
2010<br />
Year ended<br />
Sept. 30,<br />
2011<br />
Steel Europe 9.4 8.1<br />
Materials Services 8.1 – 9.2 7.0 – 9.0<br />
Elevator Technolgy 8.7 7.8<br />
Plant Technology 8.8 – 10.6 7.7 – 9.0<br />
Components Technology 6.6 – 8.7 7.7 – 8.0<br />
Marine Systems 7.1 6.3<br />
Stainless Global 8.6 – 10.0 7.7 – 9.9<br />
Corporate 7.5 6.6
3.6 Consolidated financial statements Notes to the consolidated financial statements<br />
The values in use for the CGUs are determined based on both historical<br />
data and expected forecast market performance. The values assigned<br />
to the key assumptions are generally consistent with external<br />
information sources.<br />
Significant goodwill<br />
CGU<br />
(Business Area)<br />
Steel Europe<br />
(Steel Europe)<br />
Americas<br />
(Elevator Technology)<br />
Uhde<br />
(Plant Technology)<br />
Marine Systems<br />
(Marine Systems)<br />
Carrying<br />
amount of<br />
goodwill<br />
allocated to<br />
CGU<br />
(million €)<br />
314<br />
832<br />
236<br />
1,040<br />
Proportion of<br />
total goodwill<br />
(in %)<br />
9%<br />
25%<br />
7%<br />
31%<br />
Consolidated financial statements<br />
154 | 155<br />
31 CGUs were identified in the ThyssenKrupp Group, of which 25<br />
report goodwill. Total goodwill, e.g. including goodwill of disposal<br />
groups and discontinued operations, amounts to €3,378 million as of<br />
September 30, 2011. 72% of this goodwill relates to the CGUs Steel<br />
Europe, Americas, Uhde and Marine Systems, as shown in the<br />
following table:<br />
Description of key assumptions of<br />
budgeting Procedure used to determine key assumptions<br />
- Selling prices<br />
- Procurement prices<br />
- Business cycles<br />
- Procurement prices<br />
- Exchange rates and interest rates<br />
- Market growth rates<br />
- Business cycles<br />
- Market growth rates<br />
Internal estimates of sales and purchasing departments concerned and<br />
consideration of economic assumptions set by ThyssenKrupp AG and external<br />
market studies<br />
Consideration of economic assumptions set by ThyssenKrupp AG and external<br />
market studies<br />
Consideration of economic assumptions set by ThyssenKrupp AG and external<br />
market studies as well as deduction of future demand and propensity to invest<br />
from the current development of end-product prices<br />
Naval shipbuilding: Consideration of long-term budget plans of potential<br />
customers and if appropriate concrete negotiations with customers, tightened<br />
competitive situation and at the same time decreased budgets of the customer<br />
countries<br />
The annual impairment test resulted in an impairment in the CGUs of the Stainless Global business area because the recoverable amount was<br />
less than the respective carrying amount of the CGU.<br />
The change in the carrying amount of goodwill (excluding goodwill of investments accounted for using the equity method) is as follows:<br />
million €<br />
Steel<br />
Europe<br />
Steel<br />
Americas<br />
Materials<br />
Services<br />
Elevator<br />
Technology<br />
Plant<br />
Technology<br />
Components<br />
Technology<br />
Marine<br />
Systems<br />
Stainless<br />
Global Corporate Total*<br />
Balance as of<br />
Sept. 30, 2009 313 0 383 1,196 297 224 1,043 331 15 3,802<br />
Currency differences 1 0 21 82 8 14 1 6 0 133<br />
Acquisitions/(divestitures) 0 0 (15) 5 5 0 0 0 0 (5)<br />
Additions<br />
Reclassification due<br />
to the presentation<br />
0 0 0 1 2 0 0 0 0 3<br />
as assets held for sale 0 0 0 0 0 0 (120) 0 0 (120)<br />
Impairment<br />
Balance as of<br />
0 0 (2) (3) 0 0 0 0 0 (5)<br />
Sept. 30, 2010 314 0 387 1,281 312 238 924 337 15 3,808<br />
Currency differences (1) 0 (4) 0 (2) 4 (1) (2) 0 (6)<br />
Acquisitions/(divestitures) 0 0 5 22 0 0 (1) 0 0 26<br />
Additions<br />
Reclassification due to<br />
the presentation as<br />
0 0 0 9 0 0 0 0 0 9<br />
assets held for sale/ disposal 0 0 (64) 0 0 0 (60) (45) 0 (169)<br />
Impairment<br />
Balance as of<br />
0 0 0 0 0 0 0 (290) 0 (290)<br />
Sept. 30, 2011 313 0 324 1,312 310 242 862 0 15 3,378<br />
* excluding goodwill of investments accounted for using the equity method
3.6 Consolidated financial statements Notes Notes to to the the consolidated financial financial statements<br />
05 Property, plant and equipment<br />
Changes in the Group’s property, plant and equipment were as follows:<br />
million €<br />
Land,<br />
leasehold<br />
rights and<br />
buildings<br />
including<br />
buildings on<br />
third-party<br />
land<br />
Technical<br />
machinery<br />
and<br />
equipment<br />
Other<br />
equipment,<br />
factory<br />
and office<br />
equipment<br />
Assets<br />
under<br />
finance<br />
lease<br />
Assets<br />
under<br />
operating<br />
lease<br />
Construction<br />
in progress Total<br />
156<br />
Additional<br />
information:<br />
Presentation<br />
of disposal<br />
groups,<br />
discontinued<br />
operations<br />
Gross amounts<br />
Balance as of Sept. 30, 2009 5,451 16,366 2,259 227 13 6,057 30,373 324<br />
Currency differences 78 227 55 3 0 114 477 22<br />
Acquisitions/divestitures of businesses (211) (57) (34) 0 0 (6) (308) (348)<br />
Additions 483 1,290 190 12 0 1,424 3,399 5<br />
Transfers 363 3,804 9 4 0 (3,901) 279 0<br />
Disposals<br />
Reclassification due to the presentation<br />
(94) (354) (174) (11) 0 (9) (642) (3)<br />
as assets held for sale (133) (202) (42) 0 0 (73) (450) 377<br />
Balance as of Sept. 30, 2010 5,937 21,074 2,263 235 13 3,606 33,128 377<br />
Currency differences 45 189 0 0 0 (21) 213 0<br />
Acquisitions/divestitures of businesses (105) (581) (36) (30) 0 (6) (758) (14)<br />
Additions 115 490 226 24 0 1,044 1,899 4<br />
Transfers 906 2,344 51 0 0 (3,162) 139 0<br />
Disposals<br />
Reclassification due to the presentation<br />
(58) (215) (104) (27) (3) 3 (404) (4)<br />
as assets held for sale/disposal (743) (2,736) (446) (42) 0 (508) (4,475) 4,475<br />
Balance as of Sept. 30, 2011 6,097 20,565 1,954 160 10 956 29,742 4,838<br />
Accumulated depreciation<br />
and impairment losses<br />
Balance as of Sept. 30, 2009 2,908 11,893 1,634 136 2 7 16,580 151<br />
Currency differences 24 147 30 1 0 0 202 9<br />
Acquisitions/divestitures of businesses (221) (65) (25) 0 0 (5) (316) (158)<br />
Depreciation expense 141 871 194 19 1 0 1,226 0<br />
Impairment losses 8 34 4 0 0 6 52 0<br />
Reversals of impairment losses (6) 0 0 (3) 0 0 (9) 0<br />
Transfers (9) 17 (23) 1 0 0 (14) 0<br />
Disposals<br />
Reclassification due to the presentation<br />
(73) (343) (158) (10) 0 0 (584) (2)<br />
as assets held for sale (108) (182) (35) 0 0 (6) (331) 325<br />
Balance as of Sept. 30, 2010 2,664 12,372 1,621 144 3 2 16,806 325<br />
Currency differences 15 74 0 0 0 3 92 0<br />
Acquisitions/divestitures of businesses (43) (422) (62) (26) 0 0 (553) (13)<br />
Depreciation expense 187 1,132 199 17 0 0 1,535 1<br />
Impairment losses 251 1,334 21 0 0 100 1,706 0<br />
Reversals of impairment losses (2) (57) 0 0 0 0 (59) 0<br />
Transfers (7) 6 (3) 0 0 0 (4) 0<br />
Disposals<br />
Reclassification due to the presentation<br />
(45) (202) (92) (19) (2) 0 (360) (4)<br />
as assets held for sale/disposal (251) (1,525) (272) (22) 0 0 (2,070) 2,070<br />
Balance as of Sept. 30, 2011 2,769 12,712 1,412 94 1 105 17,093 2,379<br />
Net amounts<br />
as of Sept. 30, 2009 2,543 4,473 625 91 11 6,050 13,793 173<br />
as of Sept. 30, 2010 3,273 8,702 642 91 10 3,604 16,322 52<br />
as of Sept. 30, 2011 3,328 7,853 542 66 9 851 12,649 2,459
3.6 Consolidated financial statements Notes to the consolidated financial statements<br />
Impairment losses of property, plant and equipment are for the most<br />
part included in cost of sales and to a minor extent in selling and<br />
administrative expenses.<br />
In 2009/2010 given the demand situation in the Components<br />
Technology business area, in the Forging group and Bilstein group<br />
operating units impairment losses of €32 million were recorded. €2<br />
million of the total impairment relates to land and buildings, €29<br />
million to technical machinery and equipment and €1 million to other<br />
equipment. The recoverable amounts used to calculate the impairment<br />
losses correspond in each case to the values in use. A discount rate of<br />
11.6% and 13.1%, respectively was used to calculate the values in<br />
use.<br />
In 2010/2011 impairment losses of €1,685 million were recorded in<br />
the Steel Americas business area. €237 million of the total impairment<br />
relates to buildings, €1,321 million to technical machinery and<br />
equipment and €100 million to construction in progress. Reasons for<br />
the impairment losses are increased acquisition costs caused by cost<br />
overruns on the construction of the Brazilian plant, significant<br />
prolonged losses due to the delayed ramp-up, the strength of the<br />
million €<br />
Consolidated financial statements<br />
156 | 157<br />
Brazilian real affecting the competitive position of the Brazilian plant<br />
both now and in the near future as well as the slower recovery and<br />
renewed weakness of markets in the USA and Europe; also the<br />
increase of the weighted average cost of capital was a strain. The<br />
recoverable amounts used to calculate the impairment losses<br />
correspond in each case to the values in use. A discount rate of 10.5%<br />
was used to calculate the values in use.<br />
In the Steel Americas business area the carrying amounts of property,<br />
plant and equipment in the amount of €6,259 million are also in the<br />
following fiscal year exposed to valuation risks; these are in particular<br />
the parameters of the capital markets as well as the expectation of the<br />
long-term development of the exchange rate and the assessment of<br />
the ability to achieve the operational aims in terms of cost efficiency<br />
and market entrance.<br />
Property, plant and equipment include leased buildings, technical<br />
machinery and equipment and other equipment that have been<br />
capitalized, where the terms of the lease require the Group, as lessee,<br />
to assume substantially all of the benefits and risks of use of the<br />
leased asset (finance lease).<br />
Gross amounts<br />
Sept. 30,<br />
2010<br />
Sept. 30,<br />
2011<br />
Accumulated depreciation and<br />
impairment losses Net amounts<br />
Land, leasehold rights and buildings including buildings on third-party land 99 73 46 34 53 39<br />
Technical machinery and equipment 89 52 66 37 23 15<br />
Other equipment, factory and office equipment 47 35 32 23 15 12<br />
Assets under finance lease 235 160 144 94 91 66<br />
Sept. 30,<br />
2010<br />
Property, plant and equipment have been pledged as security for financial payables of €5 million (2010: €100 million).<br />
Sept. 30,<br />
2011<br />
Sept. 30,<br />
2010<br />
Sept. 30,<br />
2011
3.6 Consolidated financial statements Notes Notes to to the the consolidated financial financial statements<br />
06 Investment property<br />
Changes in the Group’s investment property were as follows:<br />
million €<br />
Gross amounts<br />
158<br />
2010 2011<br />
Balance as of Sept. 30, 2009 and Sept. 30, 2010, respectively 493 511<br />
Currency differences 0 0<br />
Acquisitions/divestitures of businesses 0 3<br />
Additions 1 0<br />
Transfers 28 9<br />
Disposals (11) (44)<br />
Reclassification due to the presentation as assets held for sale/disposal 0 (22)<br />
Balance as of Sept. 30, 2010 and 2011, respectively 511 457<br />
Accumulated depreciation and impairment losses<br />
Balance as of Sept. 30, 2009 and Sept. 30, 2010, respectively 152 174<br />
Currency differences 0 0<br />
Acquisitions/divestitures of businesses 0 2<br />
Depreciation expense 1 2<br />
Impairment losses 10 8<br />
Reversals of impairment losses 0 0<br />
Transfers 14 2<br />
Disposals (3) (22)<br />
Reclassification due to the presentation as assets held for sale/disposal 0 (10)<br />
Balance as of Sept. 30, 2010 and 2011, respectively 174 156<br />
Net amounts<br />
as of Sept. 30, 2009 341<br />
Balance as of Sep. 30, 2010 and 2011, respectively 337 301<br />
The fair value of the Group’s investment property is determined using<br />
various internationally accepted valuation methods such as the gross<br />
rental method, discounted cash flow method, asset value method and<br />
comparison to current market prices of similar real estate. Investment<br />
property located in Germany is primarily determined based on<br />
internally prepared valuations using the gross rental method which is<br />
regulated in Germany by the “Verordnung über Grundsätze für die<br />
Ermittlung der Verkehrswerte von Grundstücken – WertV”. Investment<br />
property located outside Germany is generally determined by external<br />
appraisers.<br />
As of September 30, 2011, the total fair value of the Group’s<br />
investment property is €380 million (2010: €423 million) of which €14<br />
million (2010: €25 million) are based on valuations of external<br />
appraisers.<br />
Additions which are disclosed in the gross amounts include<br />
subsequent expenditure of €0.2 million (2010: €0.1 million).<br />
The lease of investment property resulted in rental income of €17<br />
million (2009/2010: €18 million) and direct operating expense of €9<br />
million (2009/2010: €9 million). Direct operating expense of €8 million<br />
(2009/2010: €14 million) resulted from investment property that does<br />
not generate rental income.<br />
07 Investments accounted for using the equity method<br />
Investments in associates<br />
As of September 30, 2011, the carrying amount of investments in<br />
associates accounted for using the equity method is €71 million (2010:<br />
€58 million). The income of investments in associates accounted for<br />
using the equity method is €(5) million (2009/2010: €(4) million).
3.6 Consolidated financial statements Notes to the consolidated financial statements<br />
Summarized financial information of associates accounted for using<br />
the equity method is presented in the table below. The information<br />
given represents 100% and not the Group’s interest in the associates:<br />
million €<br />
Sept. 30,<br />
2010<br />
Sept. 30,<br />
2011<br />
Total assets 759 908<br />
Total liabilities 572 696<br />
Year ended<br />
Sept. 30,<br />
2010<br />
Year ended<br />
Sept. 30,<br />
2011<br />
Net sales 578 759<br />
Net loss (12) (13)<br />
In 2010/2011, there was no unrecognized share of losses of an<br />
associate accounted for using the equity method (2009/2010: €222<br />
thousand). There were also no cumulative unrecognized losses<br />
(2009/2010: €224 thousand).<br />
Joint ventures<br />
The following table shows the summarized financial information of the<br />
Group’s joint ventures. The information given represents the Group’s<br />
interest in the joint ventures:<br />
million €<br />
Sept. 30,<br />
2010<br />
Sept. 30,<br />
2011<br />
Current assets 698 844<br />
Non-current assets 430 397<br />
Current liabilities 399 481<br />
Non-current liabilities 339 304<br />
Year ended<br />
Sept. 30,<br />
2010<br />
Year ended<br />
Sept. 30,<br />
2011<br />
Net sales 1,431 2,022<br />
Net income 40 67<br />
The associates and joint ventures are included in the list of the Group’s<br />
subsidiaries and equity interests investments which is presented in<br />
Note 38.<br />
08 Operating lease as lessor<br />
The Group is the lessor of various commercial real estates under<br />
operating lease agreements.<br />
Consolidated financial statements<br />
158 | 159<br />
As of September 30, the future minimum lease payments to be<br />
received on non-cancellable operating leases are as follows:<br />
million €<br />
Sept. 30,<br />
2010<br />
Sept. 30,<br />
2011<br />
Not later than one year 24 20<br />
Between one and five years 31 34<br />
Later than five years 24 20<br />
Total 79 74<br />
The amounts reflected as future minimum lease payments do not<br />
contain any contingent rentals. No contingent rentals have been<br />
recognized in the consolidated statements of income in 2010/2011<br />
and in 2009/2010, respectively.<br />
09 Inventories<br />
million €<br />
Sept. 30,<br />
2010<br />
Sept. 30,<br />
2011<br />
Raw materials 2,057 2,266<br />
Supplies 500 616<br />
Work in process 2,349 1,623<br />
Finished products, merchandise 3,356 3,600<br />
Total 8,262 8,105<br />
Inventories of €17 million (2010: €14 million) have a remaining term of<br />
more than 1 year. Inventories of €38,616 million (2010: €36,259<br />
million) are recognized as an expense during the period. Included in<br />
cost of sales are write-downs of inventories of €232 million (2010:<br />
€109 million). Thereof €173 million relates to the write-down of excess<br />
inventory caused by the ramp-up in the Steel Americas business area.<br />
10 Trade accounts receivable<br />
million €<br />
Sept. 30,<br />
2010<br />
Sept. 30,<br />
2011<br />
Receivables from sales of goods and services<br />
Amounts due from customers<br />
5,267 4,263<br />
for construction work 615 796<br />
Total 5,882 5,059<br />
Receivables from the sales of goods and services in the amount of<br />
€722 million (2010: €732 million) have a remaining term of more than<br />
1 year. As of September 30, 2011 cumulative impairment losses of<br />
€280 million (2010: €491 million) are recognized for doubtful<br />
accounts.
3.6 Consolidated financial statements Notes Notes to to the the consolidated financial financial statements<br />
As of the reporting date trade accounts receivable were as follows:<br />
million €<br />
Carrying<br />
amount thereof: thereof: not impaired but past due as of balance sheet date thereof:<br />
Trade<br />
accounts<br />
receivable<br />
neither<br />
impaired nor<br />
past due as<br />
of balance<br />
sheet date<br />
past due<br />
up to 30 days<br />
past due<br />
31 to 60 days<br />
past due<br />
61 to 90 days<br />
past due<br />
91 to 180<br />
days<br />
past due<br />
181 to 360<br />
days<br />
past due<br />
more than<br />
360 days<br />
160<br />
impaired<br />
as of balance<br />
sheet date<br />
Sept. 30, 2010 5,882 4,975 364 110 65 105 55 47 161<br />
Sept. 30, 2011 5,059 4,238 324 96 63 98 56 48 136<br />
Amounts due from customers for construction work are calculated as<br />
follows:<br />
million €<br />
Sept. 30,<br />
2010<br />
Sept. 30,<br />
2011<br />
Contract costs incurred and<br />
recognized contract profits<br />
(less recognized losses) 2,374 3,252<br />
Less advance payments received (1,759) (2,456)<br />
Total 615 796<br />
Advanced payments received are collateralized by assets of €395<br />
million (2010: €177 million). Sales from construction contracts of<br />
€6,682 million were recognized in the period (2009/2010: €6,101<br />
million).<br />
11 Other financial assets<br />
million €<br />
The Group primarily sells credit insured trade accounts receivable<br />
under existing programs on a revolving basis as well as under one-time<br />
transactions.<br />
The amount of receivables sold and derecognized from the balance<br />
sheet as of September 30, 2011, was €89 million (2010: €341<br />
million), resulting in net proceeds in the amount of €88 million<br />
(2009/2010: €339 million). In some cases, when the Group sells<br />
receivables it retains rights and immaterial obligations; these retained<br />
interests mainly consist of servicing as well as providing limited cash<br />
reserve accounts. The recognized assets and provided guarantees<br />
which serve as a cash reserve account amounted to €3 million (2010:<br />
€16 million) as of September 30, 2011.<br />
Sept. 30, 2010 Sept. 30, 2011<br />
current non-current current non-current<br />
Loans and receivables 350 56 353 17<br />
Available-for-sale financial assets 9 71 6 54<br />
Derivatives that do not qualify for hedge accounting (Financial assets held for trading) 172 — 137 —<br />
Derivatives that qualify for hedge accounting 154 — 82 —<br />
Total 685 127 578 71<br />
Other financial assets in the amount of €107 million (2010: €157 million) have a remaining term of more than 1 year. As of September 30, 2011<br />
cumulative impairments amount to €18 million (2010: €41 million) regarding current other financial assets and €50 million (2010: €44 million)<br />
regarding non-current other financial assets.
3.6 Consolidated financial statements Notes to the consolidated financial statements<br />
As of the reporting date other financial assets were as follows:<br />
million €<br />
Consolidated financial statements<br />
160 | 161<br />
Carrying<br />
amount thereof: thereof: not impaired but past due as of balance sheet date thereof:<br />
Other<br />
financial<br />
assets<br />
neither<br />
impaired<br />
nor past due<br />
as of balance<br />
sheet date<br />
past due<br />
up to 30 days<br />
past due<br />
31 to 60 days<br />
past due<br />
61 to 90 days<br />
past due<br />
91 to 180<br />
days<br />
past due<br />
181 to 360<br />
days<br />
past due<br />
more than<br />
360 days<br />
impaired<br />
as of<br />
balance<br />
sheet date<br />
Sept. 30, 2010 812 757 5 2 0 1 1 2 44<br />
Sept. 30, 2011 649 600 3 1 1 1 1 7 35<br />
12 Other non-financial assets<br />
million €<br />
Sept. 30, 2010 Sept. 30, 2011<br />
current non-current current non-current<br />
Advance payments on intangible assets — 20 — 29<br />
Advance payments on property, plant and equipment — 180 — 178<br />
Advance payments to suppliers of inventories 556 — 797 —<br />
Other advance payments and prepayments 204 — 192 —<br />
Reimbursement rights 94 — 88 —<br />
Others 792 — 486 246<br />
Total 1,646 200 1,563 453<br />
Other non-financial assets in the amount of €556 million (2010: €235 million) have a remaining term of more than 1 year. As of September 30,<br />
2011 cumulative impairments amount to €29 million (2010: €23 million) regarding current other non-financial assets and €224 million (2010: €3<br />
million) regarding non-current other non-financial assets. Impairments regarding non-current other non-financial assets mainly relate to the Steel<br />
Americas business area.<br />
13 Total Equity<br />
€2 million, €7 million and €10 million of the balance of cumulative<br />
other comprehensive income result from associates as of Sept. 30,<br />
2009, Sept. 30, 2010 and Sept. 30, 2011, respectively. €3 million<br />
(2009/2010: €5 million) of the changes of cumulative other<br />
comprehensive income result from associates.<br />
The following table shows the changes of the foreign currency<br />
translation adjustment which is part of cumulative other<br />
comprehensive income:<br />
million €<br />
Foreign<br />
currency<br />
translation<br />
adjustment<br />
Balance as of Sept. 30, 2009 (333)<br />
Change in unrealized gains/(losses), net 457<br />
Net realized (gains)/losses 14<br />
Balance as of Sept. 30, 2010 138<br />
Change in unrealized gains/(losses), net 70<br />
Net realized (gains)/losses (17)<br />
Balance as of Sept. 30, 2011 191
3.6 Consolidated financial statements Notes Notes to to the the consolidated financial financial statements<br />
Capital stock<br />
The capital stock of ThyssenKrupp AG consists of 514,489,044 no-par<br />
bearer shares of stock, all of which have been issued and are fully<br />
paid, with 514,489,044 outstanding as of September 30, 2011 and<br />
464,394,337 outstanding as of September 30, 2010, respectively.<br />
Each share of common stock has a stated value of €2.56.<br />
All shares grant the same rights. The stockholders are entitled to<br />
receive dividends as declared and are entitled to one vote per share at<br />
the stockholders’ meetings.<br />
Additional paid in capital<br />
Additional paid in capital include the effects of the business<br />
combination of Thyssen and Krupp as well as premiums resulting from<br />
capital increases at subsidiaries with non-controlling interest.<br />
Retained earnings<br />
Retained earnings include prior years’ undistributed consolidated<br />
income. In addition, actuarial gains and losses are included in this<br />
balance sheet item.<br />
Treasury stock<br />
On the basis of the authorization granted by the Annual General<br />
Meeting on January 18, 2008, the Executive Board of ThyssenKrupp<br />
AG resolved on January 31, 2008, to acquire up to approximately 3%<br />
of the current capital stock issued. In the period from February 01,<br />
2008 to March 07, 2008, ThyssenKrupp AG purchased a total of<br />
14,791,100 treasury shares, representing approximately 2.9% of the<br />
capital stock, at an average price of €35.34. This represents a total<br />
amount of €523 million. In addition, based on the authorization of the<br />
Annual General Meeting, the Executive Board resolved on July 14,<br />
2008, to acquire up to approximately 2.0% of the capital stock issued.<br />
In the period from July 15, 2008 to August 13, 2008, ThyssenKrupp<br />
AG purchased a total of 10,500,000 treasury shares, representing<br />
approximately 2.0% of the capital stock, at an average price of €33.98.<br />
This represents a total amount of €357 million.<br />
In the context of the settlement of the Group’s Share Purchase Program<br />
of fiscal year 2007/2008, as of December 02, 2009, 350,924 treasury<br />
shares were sold to the beneficiaries of the first tranche and as of<br />
March 04, 2010, 40,793 treasury shares were sold to the beneficiaries<br />
of the second tranche at a price of €24.62 per share. Another 529,128<br />
treasury shares were sold at a price of €22.09 per share in the context<br />
of the German employee share purchase program. In addition in the<br />
context of the settlement of the Group’s Share Purchase Program of<br />
fiscal year 2009/2010, as of February 02, 2011, 209,770 treasury<br />
shares were sold to the beneficiaries using a price of €29.59 per share.<br />
Another 400,095 treasury shares were sold at a price of €29.46 per<br />
share in the context of the German employee share purchase program<br />
as of May 06, 2011. All prices stated before represent the basis for the<br />
discounted selling price.<br />
To reduce net financial debt as part of the Group’s strategic<br />
development, on July 06, 2011 the Executive Board of ThyssenKrupp<br />
AG resolved to sell the 49,484,842 treasury shares; this corresponds<br />
to 9.6% of the capital stock. The shares were sold in an accelerated<br />
bookbuilding process at a price of €32.95 per share to mainly German<br />
and international institutional investors on July 07, 2011, leading to a<br />
cash inflow of approximately €1.6 million; the related transaction costs<br />
of €7 million are accounted for as a deduction from equity.<br />
The presented sales of the treasury sales are based on the<br />
authorizations of the Annual General Meeting of January 23, 2009 and<br />
January 21, 2010, respectively, resulting in the fact that ThyssenKrupp<br />
AG does not any longer hold treasury shares as of September 30,<br />
2011.<br />
Management of capital<br />
As of September 30, 2011, the equity ratio reached 23.8% (2010:<br />
23.8%). Among the ThyssenKrupp Group’s most important financial<br />
goals are a sustainable appreciation of entity value and ensuring<br />
solvency at all times. Creating sufficient liquidity reserves is therefore<br />
of great importance. These objectives are achieved by implementing<br />
various capital cost reduction and capital structure optimization<br />
measures as well as effective risk management.<br />
The ThyssenKrupp Group’s financial risks are assessed on the basis of<br />
ratings by rating agencies:<br />
Lang-term-<br />
rating<br />
162<br />
Short-term<br />
rating Outlook<br />
Standard & Poor’s BB+ B stable<br />
Moody’s Baa3 Prime-3 stable<br />
Fitch BBB- F3 stable
3.6 Consolidated financial statements Notes to the consolidated financial statements<br />
At Moody’s and Fitch ThyssenKrupp’s rating has investment grade<br />
status. After ThyssenKrupp had been lowered to BB+ by the rating<br />
agency Standard & Poor’s, to regain the investment grade status is a<br />
major target of ThyssenKrupp. For the financing of the ThyssenKrupp<br />
Group, an investment grade rating in the “BBB” range leads to an<br />
optimum of capital costs. Moreover, it basically ensures access to a<br />
broad base of investors. Capital management at ThyssenKrupp is<br />
based on debt ratios published by rating agencies, which calculate<br />
cash-flow-to-debt ratios periodically. ThyssenKrupp is not subject to<br />
statutory capital requirements.<br />
Authorizations<br />
According to Art. 5 Para. 5 of the Articles of Association of<br />
ThyssenKrupp AG, the Executive Board is authorized, with the approval<br />
of the Supervisory Board, to increase the capital stock on one or more<br />
occasions on or before January 18, 2012, by up to €500 million by<br />
issuing up to 195,312,500 new no-par shares in exchange for cash<br />
and/or contributions in kind (Authorized Capital).<br />
By resolution of the Annual General Meeting on January 23, 2009, the<br />
Executive Board is authorized, subject to the approval of the<br />
Supervisory Board, to issue bearer bonds with a total par value up to<br />
€2 billion and to grant the bond holders the right to convert the bonds<br />
into a total of up to €50 million bearer shares of ThyssenKrupp with an<br />
arithmetical share in the Company’s capital stock of up to €128 million<br />
(convertible bonds). The authorization is valid until January 22, 2014.<br />
In addition, by resolution of the Annual General Meeting on January<br />
21, 2010, ThyssenKrupp is authorized through January 20, 2015, to<br />
purchase treasury stock for certain defined purposes up to a total of<br />
10% of the capital stock at the time of the resolution. Treasury stock<br />
can also be purchased by using equity derivatives (put or call options<br />
or a combination of both).<br />
Dividend proposal<br />
The Executive Board and Supervisory Board have agreed to propose to<br />
the Annual General Meeting a dividend in the amount of €0.45 per<br />
share entitled to dividend to be distributed from unappropriated net<br />
income of the stand-alone entity ThyssenKrupp AG for fiscal year<br />
2010/2011 as determined in conformity with the principles of the<br />
German Commercial Code (HGB). This would result in a dividend<br />
payout of €232 million in total. For fiscal year 2009/2010 a dividend of<br />
€0,45 (2008/2009: €0.30) had been paid.<br />
Consolidated financial statements<br />
14 Share-based compensation<br />
162 | 163<br />
Management incentive plans<br />
In 2003, ThyssenKrupp implemented a performance based mid-term<br />
incentive plan (MTI) which issues stock rights to eligible participants.<br />
All Executive Board members of ThyssenKrupp AG are eligible to<br />
participate. Starting with the second installment which was issued in<br />
2004, the group of beneficiaries was expanded to include the former<br />
segment lead companies as well as several other selected executive<br />
employees. As of fiscal year 2010/2011 the previous MTI continues<br />
with modified parameters as long-term incentive plan LTI. Besides the<br />
Executive Board members of ThyssenKrupp AG and of the business<br />
areas, management board members and additional selected<br />
executives are plan participants. As of September 30, 2011, 501,607<br />
stock rights were issued in the 7th installment and 355,937 stock<br />
rights in the 8th installment of the MTI and 718,710 stock rights in the<br />
1st installment of the LTI.<br />
The number of stock rights issued will be adjusted at the end of each<br />
performance period based on the average economic value added (EVA)<br />
over the three-year performance period, beginning October 01 of the<br />
year the stock rights were granted, compared to the average EVA over<br />
the previous three fiscal year period. At the end of the performance<br />
period the stock rights will be settled in cash based on the average<br />
price of ThyssenKrupp stock during the three month period<br />
immediately following the performance period.<br />
To determine the fair value of the stock rights used to calculate the prorata<br />
liability as of the balance sheet date forward prices of the<br />
ThyssenKrupp stock are calculated taking into account partial caps<br />
starting in the 3rd installment. The forward calculation is carried out for<br />
predefined periods (averaging periods) taking into account the<br />
ThyssenKrupp stock price and the Euro interest rate curve as of the<br />
balance sheet date and the dividends assumed to be paid until the<br />
maturity of the stock rights. The following assumptions were used for<br />
the determination of the fair values as of September 30, 2010 and as<br />
of September 30, 2011, respectively:
3.6 Consolidated financial statements Notes Notes to to the the consolidated financial financial statements<br />
Year ended Sept. 30, 2010<br />
6th installment MTI 7th installment MTI 8th installment MTI<br />
Maturity Dec. 31, 2010 Dec. 31, 2011 Dec. 31, 2012<br />
Averaging period Oct. 01 to Dec. 31, 2010 Oct. 01 to Dec. 31, 2011 Oct. 01 to Dec. 31, 2012<br />
ThyssenKrupp stock price as of balance sheet date €23.92 €23.92 €23.92<br />
€0.45 on Jan. 24, 2011<br />
Assumed dividend payment(s) per stock until maturity — €0.45 on Jan. 24, 2011 €0.50 on Jan. 23, 2012<br />
Average dividend yield — 1.71% 1.91%<br />
Average interest rate (averaging period) 0.76% 1.32% 1.52%<br />
Fair value as of Sept. 30, 2010<br />
- without caps €23.89 €23.42 €22.92<br />
- with caps €23.89 €23.42 €22.92<br />
Year ended Sept. 30, 2011<br />
7th installment MTI 8th installment MTI 1st installment LTI<br />
Maturity Dec. 31, 2011 Dec. 31, 2012 Dec. 31, 2013<br />
Averaging period Oct. 01 to Dec. 31, 2011 Oct. 01 to Dec. 31, 2012 Oct. 01 to Dec. 31, 2013<br />
ThyssenKrupp stock price as of balance sheet date €18.55 €18.55 €18.55<br />
€0.45 on Jan. 23, 2012<br />
Assumed dividend payment(s) per stock until maturity — €0.45 on Jan. 23, 2012 €0.45 on Jan. 21, 2013<br />
Average dividend yield — 2.21% 2.34%<br />
Average interest rate (averaging period) 1.26% 1.57% 1.52%<br />
Fair value as of Sept. 30, 2011<br />
- without caps €18.50 €18.07 €17.62<br />
- with caps €18.50 €18.07 €17.62<br />
In the 2nd quarter of 2010/2011, the 6th installment of the MTI expired<br />
without any payment due to the decline of the average ThyssenKrupp<br />
EVA over the three-year performance period compared to the average<br />
ThyssenKrupp EVA over the previous three fiscal year period. In the<br />
2nd quarter of 2009/2010, also the 5th installment of the mid-term<br />
incentive plan expired without any payment due to a downtrend of<br />
ThyssenKrupp EVA. In total, the Group recorded an expense of €10.5<br />
million from the incentive plans in 2010/2011 (2009/2010: €4.4<br />
million); thereof €0.4 million (2009/2010: €0.2 million) are presented<br />
in income/(loss) of discontinued operations. The liability arising from<br />
the MTI and LTI amounts to €14.9 million as of September 30, 2011<br />
(2010: €4.4 million).<br />
In February 2006, the Group implemented a Share Purchase Program<br />
for selected executive employees who are not beneficiaries of the midterm<br />
incentive plan. Under the Program the beneficiaries are entitled to<br />
purchase up to a fixed amount ThyssenKrupp shares at a discount. In<br />
March 2008 it was decided to renew the Program for fiscal year<br />
2007/2008. Under the Program, again selected executive employees<br />
are entitled to purchase up to a fixed amount ThyssenKrupp shares at<br />
a discount. The realization of the new Program was postponed until the<br />
fiscal year 2009/2010. After the first tranche of the Group’s Share<br />
Purchase Program of fiscal year 2007/2008 had been settled in<br />
December 2009, the second tranche of the Group’s Share Purchase<br />
Program was settled in March 2010. The Group recorded<br />
compensation expense from the Program of €0.9 million in 2009/2010<br />
of which € 0.1 million are presented in income/(loss) of discontinued<br />
operations. In September 2010 the renewal of the Program for fiscal<br />
year 2009/2010 was decided and in February 2011 it was settled. It<br />
resulted in compensation expense of €8.6 million of which 0.4 million<br />
are presented in income/(loss) of discontinued operations. As of<br />
September 30, 2011 and 2010, respectively, no obligation exists from<br />
the Program.<br />
In September 2010 the structure of the variable compensation for<br />
members of the Executive Board of ThyssenKrupp AG was modified.<br />
25% of the performance bonus granted for each fiscal year will now be<br />
converted into ThyssenKrupp AG stock rights to be paid out after a<br />
three-year lock-up period. The number of stock rights is calculated by<br />
dividing 25% of the performance bonus by the average ThyssenKrupp<br />
share price in the 4th quarter of the fiscal year for which the<br />
performance bonus is granted. After expiration of three fiscal years, the<br />
164
3.6 Consolidated financial statements Notes to the consolidated financial statements<br />
payout amount is calculated by multiplying the number of stock rights<br />
by the average ThyssenKrupp share price in the 4th quarter of the 3rd<br />
fiscal year. In addition, for each stock right the dividend amount which<br />
would have been paid for these three fiscal years is also paid out.<br />
Insofar as the Executive Board members of ThyssenKrupp AG are<br />
granted an additional bonus alongside the performance bonus, as in<br />
2009/2010 and 2010/2011, respectively, 55% of this additional bonus<br />
will also be converted into stock rights and treated in accordance with<br />
the performance bonus model. In the 3rd quarter ended June 30,<br />
2011, the structure of the variable compensation for additional<br />
executive employees was modified. 20% of the performance bonus<br />
granted for the respective fiscal year will be obligatorily converted into<br />
ThyssenKrupp AG stock rights to be paid out after the expiration of<br />
three fiscal years based on the average ThyssenKrupp share price in<br />
the 4th quarter of the 3rd fiscal year. The Group recorded expenses of<br />
€3 million (2009/2010: €3 million) associated with this compensation<br />
component; the resultant obligation as of September 30, 2011<br />
amounts to €6 million (2010: 3).<br />
Employee share purchase program<br />
In the 3rd quarter of 2010/2011, the Group primarily offered eligible<br />
members of its domestic workforce the right to purchase up to €270 in<br />
ThyssenKrupp shares at a 50% discount as part of an employee share<br />
purchase program. The program resulted in the Group recording<br />
compensation expense of €6.1 million (2009/2010: €6.1 million);<br />
thereof €0.5 million (2009/2010: €0.5 million are presented in<br />
income/(loss) of discontinued operations.<br />
Consolidated financial statements<br />
15 Accrued pension and similar obligations<br />
million €<br />
Sept. 30,<br />
2010<br />
164 | 165<br />
Sept. 30,<br />
2011<br />
Accrued pension liability 6,669 6,007<br />
Accrued postretirement obligations other than pensions 1,257 1,080<br />
Other accrued pension-related obligations<br />
Reclassification due to the presentation as liabilities<br />
285 210<br />
associated with assets held for sale/disposal (125) (357)<br />
Total 8,086 6,940<br />
Accrued pension and similar obligations in the amount of €6,455<br />
million (2010: €7,455 million) have a remaining term of more than<br />
1 year.<br />
Accrued pension liability<br />
The Group maintains defined benefit pension plans and defined<br />
contribution plans that cover the majority of the employees in<br />
Germany, the USA and Great Britain. In some other countries, eligible<br />
employees receive benefits in accordance with the respective local<br />
requirements. The obligations resulting from defined benefit pensions<br />
plans in Canada as of September 30, 2010 were transferred to<br />
insurance companies in 2010/2011.<br />
In Germany, benefits generally take the form of pension payments that<br />
are indexed to inflation. Benefits for some senior staff are based on<br />
years of service and salary during a reference period, which is<br />
generally three years prior to retirement. Other employees receive<br />
benefits based on years of service. In addition, ThyssenKrupp offers<br />
certain German employees the opportunity to participate in a defined<br />
benefit program which allows for the deferral of compensation which<br />
earns interest at a rate of 6.00% per year.<br />
In the USA, hourly paid employees receive benefits based on years of<br />
service. Salaried employee benefits are typically based on years of<br />
service and salary history. In Great Britain, employee benefits are<br />
based on years of service and an employee’s final salary before<br />
retirement.
3.6 Consolidated financial statements Notes Notes to to the the consolidated financial financial statements<br />
Changes in defined benefit obligations and plan assets<br />
The reconciliation of the changes in the defined benefit obligations and the fair value of plan assets are as follows:<br />
million €<br />
Change in defined benefit obligations (DBO):<br />
Sept. 30, 2010 Sept. 30, 2011<br />
Germany<br />
Outside<br />
Germany Germany<br />
DBO at beginning of fiscal year 5,712 2,042 6,308 2,356<br />
Service cost 69 31 90 35<br />
Interest cost 287 111 249 102<br />
Participant contributions 0 9 0 10<br />
Past service cost 2 13 0 1<br />
Actuarial (gains)/losses 672 164 (539) (15)<br />
Acquisitions/(divestitures) (16) (34) (40) (4)<br />
Curtailments and settlements 0 (1) 0 (273)<br />
Currency differences 0 158 0 40<br />
Benefit payments (418) (151) (415) (151)<br />
Others 0 14 0 0<br />
DBO at end of fiscal year 6,308 2,356 5,653 2,101<br />
Change in plan assets:<br />
Fair value of plan assets at beginning of fiscal year 179 1,513 213 1,840<br />
Expected return on plan assets 13 106 13 111<br />
Actuarial gains/(losses) (6) 66 (18) (71)<br />
Acquisitions/(divestitures) (4) 0 (4) (3)<br />
Employer contributions 31 140 0 130<br />
Participant contributions 0 9 0 10<br />
Settlements 0 0 0 (318)<br />
Currency differences 0 123 0 33<br />
Benefit payments 0 (130) (12) (138)<br />
Others 0 13 0 0<br />
Fair value of plan assets at end of fiscal year 213 1,840 192 1,594<br />
As of the balance sheet date, defined benefit obligations related to<br />
plans that are wholly unfunded amount to €5,351 million (2010:<br />
€6,023 million) and defined benefit obligations that relate to plans that<br />
are wholly or partly funded amount to €2,403 million (2010: €2,641<br />
million).<br />
Actual return which amounts to €35 million (2010: €179 million) is<br />
calculated as the total of expected return on plan assets and actuarial<br />
gains and losses, respectively.<br />
Funded status and net amount recognized<br />
The following represents the funded status of these plans resulting<br />
from the difference of defined benefit obligations and fair value of plan<br />
assets including a reconciliation to the net amount recognized:<br />
million €<br />
Sept. 30, 2010 Sept. 30, 2011<br />
Germany<br />
Outside<br />
Germany Germany<br />
166<br />
Outside<br />
Germany<br />
Outside<br />
Germany<br />
Funded status at end<br />
of fiscal year<br />
Unrecognized past<br />
(6,095) (516) (5,461) (507)<br />
service cost<br />
Not recognized as an<br />
asset due to asset<br />
0 5 0 4<br />
ceiling 0 (62) 0 (37)<br />
Net amount recognized (6,095) (573) (5,461) (540)<br />
Amounts recognized in<br />
the consolidated balance<br />
sheets consist of:<br />
Other non-financial<br />
assets<br />
Accrued pension<br />
0 1 0 6<br />
liability (6,095) (574) (5,461) (546)<br />
Net amount recognized (6,095) (573) (5,461) (540)
3.6 Consolidated financial statements Notes to the consolidated financial statements<br />
Net periodic pension cost<br />
The net periodic pension cost for the defined benefit plans were as follows:<br />
million €<br />
Consolidated financial statements<br />
166 | 167<br />
Year ended Sept. 30, 2010 Year ended Sept. 30, 2011<br />
Outside<br />
Outside<br />
Germany Germany Germany Germany<br />
Service cost 69 31 90 35<br />
Interest cost 287 111 249 102<br />
Expected return on plan assets (13) (106) (13) (111)<br />
Past service cost 2 7 0 1<br />
Settlement and curtailment loss/(gain) 0 (1) 0 45<br />
Net periodic pension cost 345 42 326 72<br />
The above presented net periodic pension cost for defined benefit<br />
plans in the amount of €326 million (2009/2010: €345 million) in<br />
Germany and of €72 million (2009/2010: €42 million) outside<br />
Germany include €17 million (2009/2010: €17 million) and €1 million<br />
(2009/2010: €2 million), respectively, attributable to discontinued<br />
operations. These costs are presented in income/(loss) from<br />
discontinued operations in the consolidated statement of income.<br />
Assumptions<br />
The assumptions for discount rates and the rates of compensation<br />
increase on which the calculation of the obligations are based were<br />
derived in accordance with standard principles and established for<br />
The Group applied the following weighted average assumptions to determine benefit obligations:<br />
%<br />
each country as a function of their respective economic conditions.<br />
Discount rates are generally determined based on market yields of high<br />
quality corporate bonds in the respective countries with terms<br />
corresponding to the estimated terms of the post-employment benefit<br />
obligations. The expected return on plan assets is determined based<br />
on detailed studies conducted by the plans’ third party investment and<br />
actuarial advisors. The studies take into consideration the long-term<br />
historical returns and the future estimates of long-term investment<br />
returns based on the target asset allocation.<br />
Sept. 30, 2010 Sept. 30, 2011<br />
Outside<br />
Germany Germany<br />
Outside<br />
Germany<br />
Germany<br />
Weighted-average assumptions:<br />
Discount rate 4.10 4.47 5.00 4.41<br />
Expected return on plan assets 6.00 6.73 6.00 6.07<br />
Rate of compensation increase 2.50 1.86 2.50 2.16<br />
Plan assets<br />
In the Group, the majority of reported plan assets associated with the<br />
funded pension plans are located in the USA, Great Britain and to a<br />
lesser extent in Germany and some other European countries. The<br />
Group invests in diversified portfolios consisting of an array of asset<br />
classes that attempt to maximize returns while minimizing volatility. The<br />
asset classes include national and international stocks, fixed income<br />
government and non-government securities and real estate. Plan<br />
assets do not include any direct investments in ThyssenKrupp debt<br />
securities, equity securities or real estate.
3.6 Consolidated financial statements Notes Notes to to the the consolidated financial financial statements<br />
The Group uses professional investment managers to invest plan<br />
assets based on specific investment guidelines developed by the<br />
plans’ Investment Committees. The Investment Committees consist of<br />
senior financial management especially from treasury and other<br />
appropriate executives. The Investment Committees meet regularly to<br />
approve the target asset allocations, and review the risks and<br />
performance of the major pension funds and approve the selection and<br />
retention of external managers.<br />
The Group’s target portfolio structure has been developed based on<br />
asset-liability studies that were performed for the major pension funds<br />
within the Group.<br />
The pension plan asset allocation and target allocation are as follows:<br />
Plan assets as of<br />
Sept. 30,<br />
2010<br />
Sept. 30,<br />
2011<br />
Target<br />
allocation<br />
Sept. 30,<br />
2012<br />
Equity securities 35% 36% 30-45%<br />
Debt securities 56% 55% 45-60%<br />
Real estate/other 9% 9% 0-10%<br />
Total 100% 100%<br />
In general, the Group’s funding policy is to contribute amounts to the<br />
plans sufficient to meet the minimum statutory funding requirements<br />
relevant in the country in which the plan is located. In the USA, certain<br />
plans require minimum funding based on collective bargaining<br />
agreements. The Group may from time to time make additional<br />
contributions at its own discretion. ThyssenKrupp’s expected<br />
contribution in fiscal year 2011/2012 is €101 million related to its<br />
funded plans, all of which is expected to be as cash contributions.<br />
Pension benefit payments<br />
In fiscal year 2010/2011, pension benefit payments to the Group’s<br />
German and Non-German plans were €415 million (2009/2010: €418<br />
million) and €151 million (2009/2010: €151 million) respectively. The<br />
estimated future pension benefits to be paid by the Group’s defined<br />
benefit pension plans are as follows:<br />
million €<br />
Multi-year overview<br />
Amounts recognized for the current and the previous periods for defined benefit pension plans are as follows:<br />
million €<br />
Germany<br />
Outside<br />
Germany<br />
(for fiscal year)<br />
2011/2012 443 116<br />
2012/2013 427 116<br />
2013/2014 423 117<br />
2014/2015 421 120<br />
2015/2016 420 124<br />
2016/2017-2020/2021 1,993 628<br />
Total 4,127 1,221<br />
Present value of defined benefit obligation 7,931 6,938 7,754 8,664 7,754<br />
Fair value of plan assets 2,077 1,724 1,692 2,053 1,786<br />
Surplus/(deficit) in the plans (5,854) (5,214) (6,062) (6,611) (5,968)<br />
Experience adjustments on plan liabilities (89) (47) 25 65 (1)<br />
Experience adjustments on plan assets 44 (345) (23) 60 (89)<br />
Defined Contribution Plans<br />
The Group also maintains domestic and foreign defined contribution<br />
plans. Amounts contributed by the Group under such plans are based<br />
upon percentage of the employees’ salary or the amount of<br />
contributions made by the employees. The total cost of pension plans<br />
accounted for as defined contribution plans in the current fiscal year<br />
Sept. 30,<br />
2007<br />
Sept. 30,<br />
2008<br />
Sept. 30,<br />
2009<br />
Sept. 30,<br />
2010<br />
168<br />
Sept. 30,<br />
2011<br />
was €111 million (2009/2010: €119 million). Thereof, €73 million<br />
(2009/2010: €78 million) were related to multi-employer plans. In<br />
addition, contributions paid to public/state pension insurance<br />
institutions amounted to €666 million (2009/2010: €603 million).
3.6 Consolidated financial statements Notes to the consolidated financial statements<br />
Accrued postretirement obligations other than pensions<br />
The Group provides certain postretirement health care and life<br />
insurance benefits to retired employees in the USA who meet certain<br />
minimum requirements regarding age and length of service. The plans<br />
primarily relate to the retained assets and liabilities of ThyssenKrupp<br />
Budd. The plans existing in Canada were settled in cash in fiscal year<br />
2010/2011.<br />
In December 2003, the US government signed into law the Medicare<br />
Prescription Drug, Improvement and Modernization Act. This law<br />
provides for a federal subsidy to sponsors of retiree health care benefit<br />
plans that provide benefit that is at least actuarially equivalent to the<br />
benefit established by the law. The Group accounts for these federal<br />
subsidies as reimbursement rights in accordance with IAS 19.<br />
Changes in accumulated postretirement benefit obligations and<br />
reimbursement rights<br />
The changes in accumulated postretirement benefit obligations and<br />
reimbursement rights are as follows:<br />
million €<br />
Sept. 30,<br />
2010<br />
USA/Canada<br />
Sept. 30,<br />
2011<br />
USA/Canada<br />
Change in accumulated postretirement benefit<br />
obligation:<br />
Accumulated postretirement benefit obligation at<br />
beginning of fiscal year 1,040 1,188<br />
Service cost 6 7<br />
Interest cost 58 54<br />
Past service cost (52) 0<br />
Actuarial (gains)/losses 102 (83)<br />
Curtailments and settlements 0 (115)<br />
Currency differences 81 12<br />
Benefit payments<br />
Accumulated postretirement benefit obligation at end of<br />
(47) (46)<br />
fiscal year 1,188 1,017<br />
Change in reimbursement rights relating to<br />
postretirement benefits:<br />
Fair value of reimbursement rights at beginning of fiscal<br />
year 76 94<br />
Expected return on reimbursement rights 5 4<br />
Actuarial gains/(losses) 12 (9)<br />
Currency differences 6 1<br />
Benefit payments (5) (2)<br />
Fair value of reimbursement rights at end of fiscal year 94 88<br />
Consolidated financial statements<br />
168 | 169<br />
Funded status and net amount recognized<br />
The following represents the funded status of these plans including the<br />
reconciliation to the net amount recognized:<br />
million €<br />
Sept. 30,<br />
2010<br />
USA/Canada<br />
Sept. 30,<br />
2011<br />
USA/Canada<br />
Funded status at end of fiscal year (1,188) (1,017)<br />
Unrecognized past service cost<br />
Net amount recognized for postretirement obligations<br />
(69) (63)<br />
other than pensions (1,257) (1,080)<br />
Net periodic postretirement benefit cost<br />
The net periodic postretirement benefit cost for health care obligations<br />
is as follows:<br />
million €<br />
Year ended<br />
Sept. 30,<br />
2010<br />
USA/Canada<br />
Year ended<br />
Sept. 30,<br />
2011<br />
USA/Canada<br />
Service cost 6 7<br />
Interest cost 58 54<br />
Expected return on reimbursement rights (5) (4)<br />
Past service cost (21) (6)<br />
Settlement and curtailment loss/(gain) 0 (90)<br />
Net periodic postretirement benefit cost 38 (39)<br />
Assumptions<br />
The determination of the accumulated postretirement benefit<br />
obligations is based on the following weighted average assumptions:<br />
%<br />
Sept. 30,<br />
2010<br />
USA/Canada<br />
Sept. 30,<br />
2011<br />
USA/Canada<br />
Weighted-average assumptions:<br />
Discount rate 4.77 4.75<br />
Health care cost trend rate for the following year<br />
Ultimate health care cost trend rate<br />
9.78 9.62<br />
(expected in 2032) 5.00 5.00
3.6 Consolidated financial statements Notes Notes to to the the consolidated financial financial statements<br />
The effects of a one-percentage-point increase or decrease in the<br />
assumed health care cost trend rates are as follows:<br />
million €<br />
one-percentage-point<br />
Increase Decrease<br />
Effect on service and interest cost components 8 (6)<br />
Effect on postretirement benefit obligation 139 (114)<br />
16 Other provisions<br />
million €<br />
Product<br />
warranties<br />
and product<br />
defects<br />
Other<br />
contractual<br />
costs<br />
Employee<br />
compensation<br />
and benefit<br />
costs<br />
Restructurings<br />
Multi-year overview<br />
Amounts recognized for the current and the previous period for<br />
postretirement obligations other than pensions are as follows:<br />
million €<br />
Sept. 30,<br />
2007<br />
Sept. 30,<br />
2008<br />
Sept. 30,<br />
2009<br />
Sept. 30,<br />
2010<br />
170<br />
Sept. 30,<br />
2011<br />
Present value<br />
of defined benefit<br />
obligation<br />
Fair value of<br />
reimbursement<br />
893 1,013 1,040 1,188 1,017<br />
rights 67 83 76 94 88<br />
Surplus/(deficit)<br />
Experience<br />
adjustments on<br />
(893) (1,013) (1,040) (1,188) (1,017)<br />
plan liabilities<br />
Experience<br />
adjustments on<br />
reimbursement<br />
13 (41) (1) 11 9<br />
rights 0 0 1 1 (2)<br />
Other accrued pension related obligations<br />
In particular German companies have obligations resulting from partial<br />
retirement agreements. Under these agreements, employees work<br />
additional time prior to retirement, which is subsequently paid for in<br />
installments after retirement. For these obligations, accruals in the<br />
amount of €150 million (2010: €209 million) were recognized in<br />
accordance with IAS 19 “Employee Benefits”.<br />
Decommissioning<br />
obligations<br />
Environmental<br />
obligations<br />
Litigation<br />
risks<br />
Other<br />
obligations Total<br />
Additional<br />
information:<br />
Presentation<br />
of disposal<br />
groups,<br />
discontinued<br />
operations<br />
Balance as of<br />
Sept. 30, 2010 452 268 557 425 212 32 169 492 2,607 60<br />
Currency differences<br />
Acquisitions/<br />
0 (1) (3) 0 0 0 (4) 1 (7) 0<br />
(divestitures) 21 (84) 1 (24) 1 0 5 4 (76) (7)<br />
Additions 144 96 283 16 16 4 46 378 983 3<br />
Accretion 1 6 6 4 21 1 1 3 43 0<br />
Amounts utilized (62) (85) (263) (134) (8) (8) (31) (139) (730) (1)<br />
Reversals<br />
Reclassification due to<br />
the presentation as<br />
liabilities associated<br />
with assets held for<br />
(72) (70) (37) (86) (36) (3) (66) (147) (517) 0<br />
sale/disposal<br />
Balance as of<br />
(9) (20) (46) (45) (14) (4) 24 (41) (155) 155<br />
Sept. 30, 2011 475 110 498 156 192 22 144 551 2,148 210
3.6 Consolidated financial statements Notes to the consolidated financial statements<br />
As of September 30, 2011, €1,500 million (2010: €1,778 million) of<br />
the total of other provisions are current, while €648 million (2010:<br />
€829 million) are non-current. Provisions of €625 million (2010: €613<br />
million) have a remaining term of more than 1 year.<br />
Product warranties and product defects represent the Group’s<br />
responsibility for the proper functioning of the goods sold (product<br />
warranty) as well as the obligation that arise from the use of the<br />
products sold (product defect).<br />
Provisions for other contractual costs represent pending losses from<br />
uncompleted contracts.<br />
Provisions for employee compensation and benefit costs primarily<br />
represent employment anniversary bonuses and obligations for the<br />
management incentive plans, while social plan and related costs<br />
pertaining to personnel related structural measures are reflected in the<br />
provision for restructuring activities. Pension related obligations for<br />
partial retirement agreements and early retirement programs, partly<br />
resulting from restructurings, are part of the provision for pensions and<br />
similar obligations.<br />
The provision for restructurings consists of provisions for employee<br />
termination benefits and exit costs which have been established by<br />
operating divisions for costs incurred in connection with activities which<br />
do not generate any future economic benefits for the Group. With the<br />
exception of Steel Americas restructurings are being carried out in all<br />
business areas. The reversals of restructuring provisions in the fiscal<br />
year in the amount of €86 million result from adjustments to the<br />
planned restructuring measures due to the finalization of details of the<br />
measures during their implementation and to alternative courses of<br />
action arising in the fiscal year.<br />
The provision for decommissioning obligations mainly consists of<br />
obligations associated with mining activities and recultivating landfills.<br />
Obligations associated with mining activities and recultivating landfills<br />
are generally handled over long periods of time, in some cases more<br />
than 30 years. The technical parameters are very complex. As a result,<br />
uncertainty exists with regard to the timing and concrete amount of the<br />
expenses.<br />
Provisions for environmental obligations refer primarily to rehabilitating<br />
contaminated sites, redevelopment and water protection measures.<br />
Consolidated financial statements<br />
17 Financial debt<br />
Carrying amounts in million €<br />
Sept. 30,<br />
2010<br />
170 | 171<br />
Sept. 30,<br />
2011<br />
Bonds 3,736 3,738<br />
Notes payable 479 779<br />
Liabilities to financial institutions 1,846 1,891<br />
Finance lease liabilities 64 50<br />
Other loans 32 36<br />
Non-current financial debt 6,157 6,494<br />
Bonds 749 0<br />
Liabilities to financial institutions 376 135<br />
Acceptance payables 18 13<br />
Finance lease liabilities 23 18<br />
Other loans 112 12<br />
Current financial debt 1,278 178<br />
Financial debt 7,435 6,672<br />
Current financial debt includes financial debt with a remaining term up<br />
to one year, while the non-current financial debt has a remaining term<br />
of more than one year.<br />
Financial debt in the amount of €5 million (2010: €100 million) is<br />
collateralized by real estate.<br />
As of September 30, 2011, the financial debt reflects a total discount<br />
in the amount of €18 million (2010: €24 million), which is offset by a<br />
total premium in the amount of €5 million (2010: €8 million).<br />
Amortization of discounts and premiums of financial debt is included in<br />
“financial income/(expense), net”.<br />
In the context of the presentation of disposal groups and discontinued<br />
operations financial debt of €480 million (2010: €26 million) were<br />
reclassified to the balance sheet line item “liabilities associated with<br />
assets held for sale/disposal”.
3.6 Consolidated financial statements Notes to the consolidated financial statements<br />
Bonds, Notes payable<br />
Carrying<br />
amount<br />
in million €<br />
Sept. 30,<br />
2010<br />
Carrying<br />
amount<br />
in million €<br />
Sept. 30,<br />
2011<br />
Notional<br />
amount<br />
in million €<br />
Sept. 30,<br />
2011<br />
Interest<br />
rate in %<br />
Fair value<br />
in million €<br />
Sept. 30,<br />
2011<br />
ThyssenKrupp Finance Nederland B.V. bond (€1,000 million) 2009/2013 1,006 1,004 1,000 6.750 1,048 02/25/2013<br />
ThyssenKrupp Finance Nederland B.V. bond (€1,000 million) 2009/2016 990 992 1,000 8.500 1,110 02/25/2016<br />
ThyssenKrupp AG bond (€750 million) 2004/2011 749 — — 5.000 — 03/29/2011<br />
ThyssenKrupp AG bond (€1,000 million) 2009/2014 991 993 1,000 8.000 1,073 06/18/2014<br />
ThyssenKrupp AG bond (€750 million) 2005/2015 749 749 750 4.375 760 03/18/2015<br />
ThyssenKrupp AG note loan (€100 million) 2008/2013 100 100 100 5.150 105 04/15/2013<br />
ThyssenKrupp AG note loan (€150 million) 2008/2013 149 150 150 5.300 158 04/25/2013<br />
ThyssenKrupp AG note loan (€150 million) 2008/2014 150 150 150 5.375 159 05/21/2014<br />
ThyssenKrupp AG note loan (€80 million) 2008/2016 80 80 80 5.710 84 09/15/2016<br />
ThyssenKrupp AG note loan (€50 million) 2011/2016 — 50 50 4.750 52 03/11/2016<br />
ThyssenKrupp AG note loan (€150 million) 2011/2016 — 150 150 4.900 157 03/11/2016<br />
ThyssenKrupp AG note loan (€50 million) 2011/2016 — 50 50 4.750 52 03/29/2016<br />
ThyssenKrupp AG note loan (€50 million) 2011/2016 — 49 50 4.750 48 04/12/2016<br />
Total 4,964 4,517 4,530 4,806<br />
ThyssenKrupp AG has assumed the unconditional and irrevocable<br />
guarantee for the payments pursuant to the terms and conditions of<br />
the bond of ThyssenKrupp Finance Nederland B.V.<br />
Liabilities to financial institutions, Other loans<br />
Carrying<br />
amount<br />
in million €<br />
Sept. 30,<br />
2010<br />
Carrying<br />
amount<br />
in million €<br />
Sept. 30,<br />
2011<br />
Maturity<br />
Date<br />
As of September 30, 2011, the financing structure of liabilities to<br />
financial institutions and other loans comprise the following:<br />
Amount<br />
thereof<br />
in Euro<br />
Weighted<br />
average<br />
interest<br />
rate %<br />
Sept. 30,<br />
2011<br />
Amount<br />
thereof<br />
in USD<br />
Weighted<br />
average<br />
interest<br />
rate %<br />
Sept. 30,<br />
2011<br />
Amount<br />
thereof<br />
in other<br />
currencies<br />
Fair value<br />
in million €<br />
Sept. 30,<br />
2011<br />
Bilateral credits<br />
(at variable interest rates) — — — — — — — —<br />
Other credits at variable interest rates 1,236 973 25 2.06 279 1.50 669 973<br />
Credits at fixed interest rates 1,130 1,101 775 5.71 18 2.20 308 1,137<br />
Total 2,366 2,074 800 5.60 297 1.54 977 2,110<br />
As of September 30, 2011, ThyssenKrupp has available a €2.5 billion<br />
syndicated joint credit multi-currency-facility agreement. The<br />
agreement was fixed in July 2005 and has a term until July 01, 2014.<br />
The facility agreement was not utilized as of the balance sheet date.<br />
Another component of financial debt are revolving credit agreements<br />
with banking institutions whereby ThyssenKrupp AG, ThyssenKrupp<br />
Finance USA, Inc. or ThyssenKrupp Finance Nederland B.V. can<br />
borrow in Euros, U.S. dollars or in British pounds Sterling up to €2.2<br />
billion. Of these facilities, 61% have a remaining term of more than 5<br />
years and 39% a remaining term of up to 5 years. As of September 30,<br />
2011, no cash loans were outstanding.<br />
In total the Group has available unused, committed credit lines<br />
amounting to €4.7 billion. The ten biggest banks together hold a share<br />
of 52%.<br />
The Group’s Commercial Paper Program also provides up to €1.5<br />
billion in additional financing. As of September 30, 2011, the program<br />
was also not used.
Consolidated financial statements<br />
As of the balance sheet date the future minimum lease payments reconcile to their present value (= finance lease liability) as follows:<br />
million €<br />
Sept. 30, 2010 Sept. 30, 2011<br />
Future<br />
minimum<br />
lease<br />
payments Interest<br />
Present<br />
value<br />
(finance<br />
lease<br />
liabilities)<br />
Future<br />
minimum<br />
lease<br />
payments Interest<br />
172 | 173<br />
Present<br />
value<br />
(finance<br />
lease<br />
liabilities)<br />
Not later than one year 29 6 23 23 5 18<br />
Between one and five years 58 13 45 41 12 29<br />
Later than five years 24 5 19 28 7 21<br />
Total 111 24 87 92 24 68<br />
Maturity of financial debt is as follows:<br />
million €<br />
(for fiscal year)<br />
Total<br />
financial<br />
debt<br />
thereof:<br />
Liabilities<br />
to financial<br />
institutions<br />
2011/2012 178 135<br />
2012/2013 1,933 649<br />
2013/2014 1,708 545<br />
2014/2015 955 196<br />
2015/2016 1,468 93<br />
thereafter 430 408<br />
Total 6,672 2,026<br />
18 Trade accounts payable<br />
Trade accounts payable in the amount of €18 million (2010: €45 million) have a remaining term of more than 1 year.<br />
19 Other financial liabilities<br />
million €<br />
Sept. 30, 2010 Sept. 30, 2011<br />
current non-current current non-current<br />
Financial liabilities measured at amortized cost 1,437 0 979 1<br />
Derivatives that do not qualify for hedge accounting 137 — 282 —<br />
Derivatives that qualify for hedge accounting 67 — 96 —<br />
Total 1,641 0 1,357 1<br />
Other financial liabilities amounting to €1 million (2010: €2 million) have a remaining term of more than 1 year.
3.6 Consolidated financial statements Notes to the consolidated financial statements<br />
20 Other non-financial liabilities<br />
million €<br />
Sept. 30, 2010 Sept. 30, 2011<br />
current non-current current non-current<br />
Amounts due to customers for construction work 3,112 — 3,795 —<br />
Advance payments 1,049 — 1,159 —<br />
Selling and buying market related liabilities 798 — 815 —<br />
Liabilities due to put options 13 — 19 —<br />
Liabilities to the employees 793 — 778 —<br />
Liabilities for social security 93 — 100 —<br />
Deferred income 49 — 26 —<br />
Tax liabilities (without income taxes) 329 — 293 —<br />
Other 670 23 347 7<br />
Total 6,906 23 7,332 7<br />
Other non-financial liabilities amounting to €440 million (2010: €347 million) have a remaining term of more than 1 year.<br />
Amounts due to customers for construction work are calculated as follows:<br />
million €<br />
Contract costs incurred and recognized<br />
contract profits (less recognized losses) 7,086 7,307<br />
Less advance payments received (10,198) (11,102)<br />
Total (3,112) (3,795)<br />
21 Contingencies and commitments<br />
Contingencies<br />
ThyssenKrupp AG as well as, in individual cases, its subsidiaries have issued or have had guarantees issued in favour of customers or lenders.<br />
The following table shows obligations under guarantees where the principal debtor is not a consolidated Group company.<br />
million €<br />
Sept. 30,<br />
2010<br />
Maximum potential amount<br />
of future payments as of Provision as of<br />
Advance payment bonds 201 320 1 1<br />
Performance bonds 82 106 1 1<br />
Third party credit guarantee 40 45 0 0<br />
Residual value guarantees 45 60 1 2<br />
Other guarantees 45 31 0 0<br />
Total 413 562 3 4<br />
Sept. 30,<br />
2010<br />
Sept. 30,<br />
2011<br />
Sept. 30,<br />
2010<br />
Sept. 30,<br />
2011<br />
Sept. 30,<br />
2011
Guarantees include contingent liabilities of associates of €6 million<br />
(2010: €0 million) and contingent liabilities of joint ventures of €355<br />
million (2010: €235 million) of.<br />
The terms of these guarantees depend on the type of guarantee and<br />
may range from three months to ten years (e.g. rental payment<br />
guarantees).<br />
The basis for possible payments under the guarantees is always the<br />
non-performance of the principal debtor under a contractual<br />
agreement, e.g. late delivery, delivery of non-conforming goods under<br />
a contract, non-performance with respect to the warranted quality or<br />
default under a loan agreement.<br />
All guarantees are issued by or issued by instruction of ThyssenKrupp<br />
AG or subsidiaries upon request of the principal debtor obligated by the<br />
underlying contractual relationship and are subject to recourse<br />
provisions in case of default. Is such a principal debtor is a company<br />
owned fully or partially by a foreign third party, such third party is<br />
generally requested to provide additional collateral in a corresponding<br />
amount.<br />
ThyssenKrupp bears joint and several liability as a member of certain<br />
civil law partnerships, ordinary partnerships and consortiums.<br />
Former stockholders of Thyssen and of Krupp have petitioned per Art.<br />
305 UmwG (Reorganization Act) for a judicial review of the share<br />
exchange ratios used in the merger of Thyssen AG and Fried. Krupp AG<br />
Hoesch-Krupp to form ThyssenKrupp AG. The proceedings are pending<br />
with the Düsseldorf Regional Court. Should a ruling be made in favour<br />
of the petitioners, the Court would require settlement to be made via an<br />
additional cash payment plus interest. The additional payment also<br />
would be required to be made to all affected stockholders, even if they<br />
were not petitioners in the judicial proceedings. However, the Group<br />
expects no such payments to become due as the exchange ratios were<br />
duly determined, negotiated between unrelated parties and audited<br />
and confirmed by the auditor that has been appointed by court, and<br />
differ only insignificantly from the value ratio determined by the expert<br />
appointed by the Düsseldorf Regional Court.<br />
Consolidated financial statements<br />
174 | 175<br />
As a result of the integration of Thyssen Industrie AG into Thyssen AG,<br />
the Group is defendant to court proceedings from minority stockholders<br />
of Thyssen Industrie AG to examine the appropriateness of the merger<br />
consideration received. The expert appointed by Dortmund district<br />
court determined a slightly different exchange ratio. The Company<br />
continues to assume that there will be no subsequent payment to<br />
former stockholders of Thyssen Industrie AG. However, if the court<br />
rules that the consideration offered was inappropriate, the increased<br />
consideration will be granted to all outside stockholders by an<br />
additional cash payment.<br />
In 2007 the EU Commission imposed a fine totaling €480 million on<br />
ThyssenKrupp AG, ThyssenKrupp Elevator AG and ThyssenKrupp’s<br />
elevator companies. The companies were accused of involvement in<br />
anti-competitive agreements relating to elevators and escalators at<br />
national level in the Benelux countries and Germany. ThyssenKrupp<br />
appealed against the EU Commission’s decision. In its judgment of<br />
July 13, 2011 the European Court of First Instance reduced the fine by<br />
around €160 million to €320 million. In the Court’s opinion, the<br />
Commission had incorrectly regarded the established anti-trust<br />
violations as repeat offenses. This had caused the Commission to<br />
increase the fine by 50%.<br />
In connection with these anti-trust violations, claims for damages have<br />
been filed against companies of the Elevator Technology business<br />
area. The validity of these claims is being examined.<br />
From May 2011, the offices of Group company ThyssenKrupp GfT<br />
Gleistechnik GmbH and other companies in the rail industry were<br />
searched by the German Federal Cartel Office and the Bochum public<br />
prosecution office. The searches were in connection with the allegation<br />
that several employees of ThyssenKrupp GfT Gleistechnik GmbH were<br />
involved in anti-competitive agreements in relation to deliveries to<br />
Deutsche Bahn AG and other customers in the so-called “private<br />
market”. During the internal investigations into the matter begun<br />
directly with the searches, several employees admitted their<br />
involvement in such agreements. ThyssenKrupp GfT Gleistechnik<br />
GmbH is cooperating fully with the Federal Cartel Office and the public<br />
prosecution office. ThyssenKrupp does not tolerate anti-trust
3.6 Consolidated financial statements Notes to the consolidated financial statements<br />
3.6 Consolidated financial statements Notes to the consolidated financial statements<br />
violations. It is not yet possible at the reporting date to estimate the<br />
amount of any fine. As well as a fine by the Federal Cartel Office, it<br />
must be expected that customers may file claims for damages.<br />
Concrete claims for damages have not yet been filed.<br />
In addition ThyssenKrupp is involved in pending and threatened<br />
litigation in connection with the purchase and sale of certain<br />
companies, which may lead to partial repayment of purchase price or<br />
to the payment of damages. In addition, damage claims may be<br />
payable to contractual partners, customers, consortium partners and<br />
subcontractors under performance contracts. Some of these claims<br />
have proven unfounded, have been ended by settlement or expired<br />
under the statute of limitations. A number of these proceedings are still<br />
pending. However, at present ThyssenKrupp does not expect pending<br />
lawsuits not explained separately in this section to have a major<br />
negative impact on the financial position.<br />
Commitments and other contingencies<br />
The Group is the lessee to property, plant and equipment classified as<br />
operating leases. Rental expense amounting to €329 million<br />
(2009/2010: €312 million) resulting from rental contracts, long-term<br />
leases and leasing contracts classified as operating leases was<br />
incurred in fiscal 2010/2011. It comprises as follows:<br />
million €<br />
Year ended<br />
Sept. 30,<br />
2010<br />
Year ended<br />
Sept. 30,<br />
2011<br />
Minimum rental payments 310 329<br />
Contingent rental payments 2 0<br />
less income from sublease agreements 0 0<br />
Total 312 329<br />
The future minimum rental payments, excluding accrued interest from<br />
such non-cancellable contracts that have an initial or remaining term of<br />
more than one year as of the balance sheet date are (at face amounts):<br />
million €<br />
Sept. 30,<br />
2010<br />
Sept. 30,<br />
2011<br />
Not later than one year 228 226<br />
Between one and five years 523 526<br />
Later than five years 315 234<br />
Total 1,066 986<br />
The future minimum rental income from non-cancelable sublease<br />
contracts amounting to €2 million (2009/2010: €2 million) is not<br />
included in the total of future minimum rental payments.<br />
The commitment to enter into investment projects amounts to €922<br />
million (2010: €1,276 million) as of September 30, 2011 and relates<br />
mainly to property, plant and equipment of the Steel Europe, Steel<br />
Americas, Stainless Global and Components Technology business<br />
areas.<br />
Payment commitments and obligations to make further contributions to<br />
corporations and cooperative associations exist in the total amount of<br />
€3 million (2010: €3 million). In addition, other financial commitments<br />
exist in the amount of €5,033 million (2010: €3,931 million), primarily<br />
from the commitments to purchase coking coal, coal and lime under<br />
long term supply contracts and obligations under ship-charter<br />
contracts in the Steel Europe and Steel Americas business areas as<br />
well as purchasing commitments resulting from the Group’s electricity<br />
and gas supply contracts. In addition, in the Steel Europe and Steel<br />
Americas business areas long term iron ore and iron ore pellets supply<br />
contracts exist which will result in purchasing commitments over a<br />
period of up to 13 years. Due to the high volatility of iron ore prices, the<br />
measurement of the complete purchasing commitments is based on<br />
the iron ore price as of the current balance sheet date resulting in<br />
purchasing commitments of €28,425 million in total.<br />
Based on the risk bearing ability of the Group or the Group companies,<br />
there exist adequate deductibles in the various classes of insurance.<br />
One or more damages at these units could noticeably impact the<br />
Group’s net assets, financial position and results of operations.<br />
176
22 Financial instruments<br />
Consolidated financial statements<br />
176 | 177<br />
The following table shows financial assets and liabilities by measurement categories and classes. Finance lease receivables and liabilities, and<br />
derivatives that qualify for hedge accounting are also included although they are not part of any IAS 39 measurement category.<br />
million €<br />
Carrying<br />
amount on<br />
balance<br />
sheet<br />
Sept. 30,<br />
2010<br />
(Amortized)<br />
cost<br />
Measurement in accordance<br />
with IAS 39<br />
Fair value<br />
recognized<br />
in profit<br />
or loss<br />
Fair value<br />
recognized<br />
in equity<br />
Measurement<br />
in accordance<br />
with IAS 17<br />
Amortized<br />
cost<br />
Trade accounts receivable, net (excluding finance lease) 5,877 5,877 5,877<br />
Loans and receivables 5,877 5,877<br />
Finance lease receivables 5 5 5<br />
Other financial assets 812 467 176 169 812<br />
Loans and receivables 406 406<br />
Fair value<br />
Sept. 30,<br />
2010<br />
Available-for-sale financial assets 61 19 80<br />
Derivatives that do not qualify for hedge accounting<br />
(Financial assets held for trading) 172 172<br />
Derivatives that qualify for hedge accounting 4 150 154<br />
Cash and cash equivalents 3,380 3,380 3,380<br />
Loans and receivables 3,380 3,380<br />
Total of financial assets 10,074<br />
thereof by measurement categories of IAS 39:<br />
Loans and receivables 9,663 9,663 9,663<br />
Available-for-sale financial assets 80 61 19 80<br />
Derivatives that do not qualify for hedge accounting<br />
(Financial assets held for trading) 172 172 172<br />
Financial debt (excluding finance lease) 7,348 7,348 7,862<br />
Financial liabilities measured at amortized cost 7,348 7,862<br />
Finance lease liabilities 87 87 87<br />
Trade accounts payable 5,411 5,411 5,411<br />
Financial liabilities measured at amortized cost 5,411 5,411<br />
Other financial liabilities 1,641 1,437 138 66 1,641<br />
Financial liabilities measured at amortized cost 1,437 1,437<br />
Derivatives that do not qualify for hedge accounting<br />
(Financial liabilities held for trading) 137 137<br />
Derivatives that qualify for hedge accounting 1 66 67<br />
Total of financial liabilities 14,487<br />
thereof by measurement categories of IAS 39:<br />
Financial liabilities measured at amortized cost 14,196 14,196 14,710<br />
Derivatives that do not qualify for hedge accounting<br />
(Financial liabilities held for trading) 137 137 137
3.6 Consolidated financial statements Notes to the consolidated financial statements<br />
3.6 Consolidated financial statements Notes to the consolidated financial statements<br />
million €<br />
Carrying<br />
amount on<br />
balance<br />
sheet<br />
Sept. 30,<br />
2011<br />
(Amortized)<br />
cost<br />
Measurement in accordance<br />
with IAS 39<br />
Fair value<br />
recognized<br />
in profit<br />
or loss<br />
Fair value<br />
recognized<br />
in equity<br />
Measurement<br />
in accordance<br />
with IAS 17<br />
Amortized<br />
cost<br />
Trade accounts receivable, net (excluding finance lease) 5,055 5,055 5,055<br />
Loans and receivables 5,055 5,055<br />
Finance lease receivables 4 4 4<br />
Other financial assets 649 417 137 95 649<br />
Loans and receivables 370 370<br />
178<br />
Fair value<br />
Sept. 30,<br />
2011<br />
Available-for-sale financial assets 47 13 60<br />
Derivatives that do not qualify for hedge accounting<br />
(Financial assets held for trading) 137 137<br />
Derivatives that qualify for hedge accounting 0 82 82<br />
Cash and cash equivalents 3,230 3,230 3,230<br />
Loans and receivables 3,230 3,230<br />
Total of financial assets 8,938<br />
thereof by measurement categories of IAS 39:<br />
Loans and receivables 8,655 8,655 8,655<br />
Available-for-sale financial assets 60 47 13 60<br />
Derivatives that do not qualify for hedge accounting<br />
(Financial assets held for trading) 137 137 137<br />
Financial debt (excluding finance lease) 6,604 6,604 6,929<br />
Financial liabilities measured at amortized cost 6,604 6,929<br />
Finance lease liabilities 68 68 68<br />
Trade accounts payable 4,807 4,807 4,807<br />
Financial liabilities measured at amortized cost 4,807 4,807<br />
Other financial liabilities 1,358 980 282 96 1,358<br />
Financial liabilities measured at amortized cost 980 980<br />
Derivatives that do not qualify for hedge accounting<br />
(Financial liabilities held for trading) 282 282<br />
Derivatives that qualify for hedge accounting 0 96 96<br />
Total of financial liabilities 12,837<br />
thereof by measurement categories of IAS 39:<br />
Financial liabilities measured at amortized cost 12,391 12,391 12,716<br />
Derivatives that do not qualify for hedge accounting<br />
(Financial liabilities held for trading) 282 282 282<br />
The carrying amounts of trade accounts receivable, other current<br />
receivables as well as cash and cash equivalents equal their fair<br />
values. The fair value of fixed rate loans equals the present value of<br />
expected cash flows which are discounted on the basis of interest rates<br />
prevailing on the balance sheet date.<br />
Available-for-sale financial assets primarily include equity and debt<br />
instruments. They are in general measured at fair value, which is<br />
based to the extent available on market prices as of the balance sheet<br />
date. When no quoted market prices in an active market are available<br />
and the fair value cannot be reliably measured, available-for-sale<br />
financial assets are measured at cost.<br />
The fair value of foreign currency forward transactions is determined<br />
on the basis of the middle spot exchange rate applicable as of the<br />
balance sheet date, and taking account of forward premiums or<br />
discounts arising for the respective remaining contract term compared<br />
to the contracted forward exchange rate. Common methods for<br />
calculating option prices are used for foreign currency options. The fair<br />
value of an option is influenced not only by the remaining term of an<br />
option, but also by other factors, such as current amount and volatility<br />
of the underlying exchange or base rate.
Interest rate swaps and cross currency swaps are measured at fair<br />
value by discounting expected cash flows on the basis of market<br />
interest rates applicable for the remaining contract term. In the case of<br />
cross currency swaps, the exchange rates for each foreign currency, in<br />
which cash flows occur, are also included.<br />
The fair value of commodity futures is based on published price<br />
quotations. It is measured as of the balance sheet date, both internally<br />
and by external financial partners.<br />
Consolidated financial statements<br />
178 | 179<br />
The carrying amounts of trade accounts receivable and other current<br />
liabilities equal their fair values. The fair value of fixed rate liabilities<br />
equals the present value of expected cash flows. Discounting is based<br />
on interest rates applicable as of the balance sheet date. The carrying<br />
amounts of floating rate liabilities equal their fair values.<br />
Financial assets and liabilities measured at fair value could be<br />
categorized in the following three level fair value hierarchy:<br />
million €<br />
Balance as of<br />
Sept. 30,<br />
2010 Level 1 Level 2 Level 3<br />
Financial assets at fair value<br />
Fair value recognized in profit or loss<br />
Derivatives that do not qualify for hedge accounting<br />
(Financial assets held for trading) 172 0 172 0<br />
Derivatives that qualify for hedge accounting<br />
Fair value recognized in equity<br />
4 0 4 0<br />
Available-for-sale financial assets 19 16 3 0<br />
Derivatives that qualify for hedge accounting 150 0 150 0<br />
Total<br />
Financial liabilities at fair value<br />
Fair value recognized in profit or loss<br />
Derivatives that do not qualify for hedge accounting<br />
345 16 329 0<br />
(Financial assets held for trading) 137 0 137 0<br />
Derivatives that qualify for hedge accounting<br />
Fair value recognized in equity<br />
1 0 1 0<br />
Derivatives that qualify for hedge accounting 66 0 66 0<br />
Total 204 0 204 0<br />
million €<br />
Balance as of<br />
Sept. 30,<br />
2011 Level 1 Level 2 Level 3<br />
Financial assets at fair value<br />
Fair value recognized in profit or loss<br />
Derivatives that do not qualify for hedge accounting<br />
(Financial assets held for trading) 137 0 137 0<br />
Derivatives that qualify for hedge accounting<br />
Fair value recognized in equity<br />
0 0 0 0<br />
Available-for-sale financial assets 13 11 2 0<br />
Derivatives that qualify for hedge accounting 82 0 82 0<br />
Total<br />
Financial liabilities at fair value<br />
Fair value recognized in profit or loss<br />
Derivatives that do not qualify for hedge accounting<br />
232 11 221 0<br />
(Financial assets held for trading) 282 0 282 0<br />
Derivatives that qualify for hedge accounting<br />
Fair value recognized in equity<br />
0 0 0 0<br />
Derivatives that qualify for hedge accounting 96 0 96 0<br />
Total 378 0 378 0
3.6 Consolidated financial statements Notes to the consolidated financial statements<br />
The fair value hierarchy reflects the significance of the inputs used to<br />
determine fair values. Financial instruments with fair value<br />
measurement based on quoted prices in active markets are disclosed<br />
in Level 1. In Level 2 determination of fair values is based on<br />
observable inputs, e.g. foreign exchange rates. Level 3 comprises<br />
financial instruments for which the fair value measurement is based on<br />
unobservable inputs.<br />
The following table shows net gains and losses from financial<br />
instruments by measurement categories. Gains or losses arising from<br />
finance lease and from derivatives that qualify for hedge accounting<br />
are not included, as they are not part of any IAS 39 measurement<br />
category.<br />
million €<br />
Year ended<br />
Sept. 30,<br />
2010<br />
Year ended<br />
Sept. 30,<br />
2011<br />
Loans and receivables 576 409<br />
Available-for-sale financial assets<br />
Derivatives that do not qualify for hedge accounting<br />
98 38<br />
(Financial assets/liabilities held for trading) (19) 44<br />
Financial liabilities measured at amortized cost (514) (633)<br />
Net gains under “loans and receivables” mainly comprises interest on<br />
financial receivables and gains and losses on foreign currency<br />
receivables.<br />
The category “available-for-sale financial assets” mainly includes<br />
current earnings from equity and debt instruments, gains or losses on<br />
their disposal as well as impairments.<br />
Gains and losses arising from changes in fair value of foreign currency,<br />
interest rate and commodity derivatives that do not comply with the<br />
hedge accounting requirements under IAS 39 are included in the<br />
“derivatives that do not qualify for hedge accounting” category.<br />
The category “financial liabilities measured at amortized cost” mainly<br />
comprises of interest expenses on financial liabilities, gains and losses<br />
on foreign currency liabilities as well as income resulting from<br />
capitalized borrowing cost.<br />
Included in net gains and loses are exchange differences of €130<br />
million (2009/2010: €158 million).<br />
Derivative financial instruments<br />
The Group uses various derivative financial instruments, including<br />
foreign currency forward contracts, foreign currency options, interest<br />
rate swaps, cross currency swaps and commodity forward contracts.<br />
Derivative financial instruments are generally used to hedge existing or<br />
anticipated underlying transactions so as to reduce foreign currency,<br />
interest rate and commodity price risks.<br />
The following table shows the notional amounts and fair values of<br />
derivatives used within the Group:<br />
million €<br />
Notional<br />
amount<br />
Sept. 30,<br />
2010<br />
Carrying<br />
amount<br />
Sept. 30,<br />
2010<br />
Notional<br />
amount<br />
Sept. 30,<br />
2011<br />
Carrying<br />
amount<br />
Sept. 30,<br />
2011<br />
Assets<br />
Foreign currency derivatives that do<br />
not qualify for hedge accounting<br />
Foreign currency derivatives<br />
3,240 115 2,275 68<br />
qualifying as cash flow hedges 1,286 93 2,026 63<br />
Embedded derivatives<br />
Interest rate derivatives that do not<br />
128 6 128 5<br />
qualify for hedge accounting*<br />
Interest rate derivatives qualifying<br />
20 1 0 0<br />
as cash flow hedges*<br />
Interest rate derivatives qualifying<br />
0 0 299 5<br />
as fair value hedges<br />
Commodity derivatives that do not<br />
987 3 0 0<br />
qualify for hedge accounting<br />
Commodity derivatives qualifying as<br />
393 50 400 64<br />
cash flow hedges<br />
Commodity derivatives qualifying<br />
123 57 111 14<br />
as fair value hedges 20 1 0 0<br />
Total 6,197 326 5,239 219<br />
Liabilities<br />
Foreign currency derivatives that do<br />
not qualify for hedge accounting<br />
Foreign currency derivatives<br />
1,890 73 5,062 235<br />
qualifying as cash flow hedges 1,038 30 357 38<br />
Embedded derivatives<br />
Interest rate derivatives that do not<br />
94 5 70 2<br />
qualify for hedge accounting*<br />
Interest rate derivatives qualifying<br />
0 0 0 0<br />
as cash flow hedges*<br />
Interest rate derivatives qualifying<br />
752 34 750 35<br />
as fair value hedges<br />
Commodity derivatives that do not<br />
0 0 0 0<br />
qualify for hedge accounting<br />
Commodity derivatives qualifying<br />
408 59 287 45<br />
as cash flow hedges<br />
Commodity derivatives qualifying<br />
10 2 97 23<br />
as fair value hedges 20 1 0 0<br />
Total 4,212 204 6,623 378<br />
* inclusive of cross currency swaps
3.6 Consolidated financial statements Notes to the consolidated financial statements<br />
Derivatives that qualify for hedge accounting<br />
Hedge accounting in accordance with IAS 39 is used to hedge foreign<br />
currency risks of firm commitments, future receivables and liabilities<br />
denominated in foreign currency, commodity price risks arising from<br />
sales and purchase transactions, and interest rate risks from noncurrent<br />
financings.<br />
Cash flow hedges<br />
Cash flow hedges are mainly used to hedge future cash flows against<br />
foreign currency and commodity price risks arising from future sales<br />
and purchase transactions as well as interest rate risks from noncurrent<br />
liabilities. These derivatives are measured at fair value, divided<br />
into an effective and ineffective portion. Until realization of the hedged<br />
underlying transaction, the effective portion of fluctuations in fair value<br />
of these derivatives is recognized directly in equity in the cumulative<br />
other comprehensive income position, while the ineffective portion is<br />
recognized in profit or loss. The cumulative gain or loss recognized in<br />
equity is reclassified to profit or loss in the same period during which<br />
the future underlying transactions (hedged items) affect profit or loss.<br />
As of 30 September 2011, hedging instruments with positive fair value<br />
totaled €82 million (2010: €150 million) and those with negative fair<br />
value totaled €96 million (2010: €66 million). For the 2010/2011 fiscal<br />
year, €1 million (2009/2010: €97 million) (before tax) in unrealized<br />
gains or losses have been recognized directly in equity in the<br />
cumulative other comprehensive income position. Cash flows from<br />
future transactions are currently hedged for a maximum of 60 months.<br />
During the current fiscal year, €(2) million (2010: €(6) million) of<br />
cumulative other comprehensive income were reclassified to sales in<br />
profit or loss as a result of the underlying transactions being realized<br />
during the year. €(0.4) million (2010: 0) thereof are included in<br />
discontinued operations. In addition, €74 million (2010: €102 million),<br />
thereof €4 million (2010: €2 million) in discontinued operations, of<br />
cumulative other comprehensive income were reclassified to decrease<br />
cost of inventories, as the hedged commodities were recognized,<br />
although the underlying transaction had not yet been taken to profit or<br />
loss. This resulted in decreased expenses of €93 million, thereof €5<br />
million in discontinued operations, in 2010/2011 an expense of €19<br />
million, thereof €1 million in discontinued operations, of that<br />
reclassified amount is expected to impact earnings in the subsequent<br />
fiscal year. Furthermore, €5 million (2010: €121 million) of cumulative<br />
Consolidated financial statements<br />
180 | 181<br />
other comprehensive income were reclassified and decreased (2010:<br />
increased) cost of property, plant and equipment. Thereof expenses of<br />
€0.2 million impacted earnings in 2010/2011. In addition, €0.2 million<br />
of that reclassified amount is expected to impact earnings in<br />
2011/2012, €4.4 million in subsequent fiscal years.<br />
As of September 30, 2011, net income from the ineffective portions of<br />
derivatives classified as cash flow hedges totaled €(23) million<br />
(2009/2010: €11 million).<br />
The cancellation of cash flow hedges during the current fiscal year<br />
resulted in earnings of 0 (2009/2010: €(4) million) due to<br />
reclassification from cumulative other comprehensive income. These<br />
fluctuations in fair value of derivatives originally recognized in equity<br />
were reclassified to profit or loss when the hedged underlying<br />
transaction was no longer probable to occur.<br />
In the subsequent fiscal year fluctuations in fair value of derivatives<br />
included in cumulative other comprehensive income as of the reporting<br />
date is expected to impact earnings by income of €72 million. During<br />
the 2012/2013 fiscal year, earnings are expected to be impacted by<br />
income of €2 million, during the 2013/2014 fiscal year by expenses of<br />
€8 million and during the following fiscal years by expenses of €50<br />
million.<br />
Fair value hedges<br />
Fair value hedges are mainly used to hedge the exposure to changes in<br />
fair value of a firm commitment and exposure to inventory price risks<br />
as well as to hedge interest rate risks. These commodity and interest<br />
rate derivatives are measured at fair value. The carrying amounts of<br />
the corresponding underlying transactions are adjusted for the change<br />
of the fair values of the hedged risks. As of September 30, 2011,<br />
hedging instruments with positive fair value totalled 0 (2010: €4<br />
million) and those with negative fair value totalled 0 (2010: €1 million).<br />
Fluctuations in fair value are recognized immediately in profit or loss<br />
under sales, cost of sales or financial income/(expense), net,<br />
depending on the type of underlying transaction. During the fiscal year,<br />
income/(expense), net from the measurement of fair value hedging<br />
instruments totalled €1 million (2009/2010: 0), while<br />
income/(expense), net from the corresponding underlying transactions<br />
during the same period amounted to €(1) million (2009/2010: 0).
3.6 Consolidated financial statements Notes to the consolidated financial statements<br />
3.6 Consolidated financial statements Notes to the consolidated financial statements<br />
Derivates that do not qualify for hedge accounting<br />
If a hedging relationship does not meet the requirements for hedge<br />
accounting in accordance with the conditions under IAS 39, the<br />
derivative financial instrument is recognized as a derivative that does<br />
not qualify for hedge accounting. The resulting impact on profit or loss<br />
is shown in the table on net gains and losses from financial<br />
instruments by measurement categories. This item also includes<br />
embedded derivatives. They exist in the ThyssenKrupp Group in the<br />
way that regular supply and service transactions with suppliers and<br />
customers abroad are not concluded in the functional currency (local<br />
currency) of either contracting parties.<br />
Financial risks<br />
The management of ThyssenKrupp AG has implemented a risk<br />
management system that is monitored by the Supervisory Board. The<br />
general conditions for compliance with the requirements for proper and<br />
future-oriented risk management within the ThyssenKrupp Group are<br />
set out in the risk management principles. These principles aim at<br />
encouraging all Group members of staff to responsibly deal with risks<br />
as well as supporting a sustained process to improve risk awareness.<br />
The Group guideline on risk management and other Group guidelines<br />
specify risk management processes, compulsory limitations, and the<br />
application of financial instruments. The risk management system aims<br />
at identifying, analyzing, managing, controlling and communicating<br />
risks promptly throughout the Group. ThyssenKrupp Group’s risk<br />
environment is updated at least twice a year by carrying out a risk<br />
inventory in all Group companies. The results of the risk inventory<br />
process are communicated to both ThyssenKrupp AG’s Executive<br />
Board and the Supervisory Board's audit committee. Risk management<br />
reporting is a continuous process and part of regular Group reporting.<br />
Group guidelines and information systems are checked regularly and<br />
adapted to current developments. In addition, the internal auditing<br />
department regularly checks whether Group companies comply with<br />
risk management system requirements.<br />
Being a global Group, ThyssenKrupp is exposed to credit, liquidity and<br />
market risks (foreign currency, interest rate and commodity price risks)<br />
during the course of ordinary activities. The aim of risk management is<br />
to limit the risks arising from operating activities and associated<br />
financing requirements by applying selected derivate and nonderivative<br />
hedging instruments.<br />
Credit risk (counterparty default risk)<br />
To the Group, financial instruments bear default risk resulting from one<br />
party’s possible failure to meet its payment obligations, with the<br />
maximum default risk being equal to the positive fair value of the<br />
respective financial instrument. During crises, default risks take on<br />
greater significance; we are managing them very carefully by our<br />
business policy. In order to minimize default risk, the ThyssenKrupp<br />
Group only enters into financial instruments for financing purposes<br />
with contracting parties that have a very good credit standing or are<br />
members of a deposit protection fund. For further risk minimizing<br />
transactions are concluded in compliance with specified risk limits. In<br />
the operative area, receivables and default risks are monitored by<br />
Group companies on an ongoing basis and partially covered by<br />
merchandise credit insurance. Risks arising from the delivery of goods<br />
to major customers are subject to a special credit watch. In addition,<br />
letters of credit and indemnity bonds are used to hedge receivables<br />
from major customers. However, receivables from these contracting<br />
parties do not reach levels that would result in extraordinary risk<br />
concentrations. Default risk is taken into account by valuation<br />
allowances.<br />
Liquidity risk<br />
Liquidity risk is the risk that the Group is unable to meet its existing or<br />
future obligations due to insufficient availability of cash or cash<br />
equivalents. Managing liquidity risk, and therefore allocating resources<br />
and hedging the Group’s financial independence, are some of the<br />
central tasks of ThyssenKrupp AG. In order to be able to ensure the<br />
Group’s solvency and financial flexibility at all times, long-term credit<br />
limits and cash and cash equivalents are reserved on the basis of<br />
perennial financial planning and monthly rolling liquidity planning.<br />
Cash pooling and external financing focus primarily on ThyssenKrupp<br />
AG and specific financing companies. Despite the partially still difficult<br />
market environment as a consequence of the financial crisis and the<br />
current debt crisis of some countries, our financing is also secured for<br />
the next fiscal year.<br />
Cash pooling and external financing focus primarily on ThyssenKrupp<br />
AG and specific financing companies. Funds are provided internally to<br />
Group companies according to need.<br />
182
Consolidated financial statements<br />
The following table shows future undiscounted cash outflows from financial liabilities based on contractual agreements:<br />
million €<br />
Carrying<br />
amount<br />
Sept. 30,<br />
2010<br />
Cash flows<br />
in<br />
2010/2011<br />
Cash flows<br />
in<br />
2011/2012<br />
Cash flows<br />
between<br />
2012/2013<br />
and<br />
2014/2015<br />
182 | 183<br />
Cash flows<br />
after<br />
2014/2015<br />
Bonds 4,485 1,053 265 3,331 1085<br />
Liabilities to financial institutions 2,222 436 321 1,336 357<br />
Finance lease liabilities 87 30 24 33 24<br />
Other financial debt 641 166 29 461 95<br />
Trade accounts payable 5,411 5,366 33 8 4<br />
Derivative financial liabilities that do not qualify for hedge accounting 137 123 6 8 0<br />
Derivative financial liabilities that qualify for hedge accounting 67 42 9 12 0<br />
Other financial liabiltities 1,437 1,389 2 0 0<br />
million €<br />
Carrying<br />
amount<br />
Sept. 30,<br />
2011<br />
Cash flows<br />
in<br />
2011/2012<br />
Cash flows<br />
in<br />
2012/2013<br />
Cash flows<br />
between<br />
2013/2014<br />
and<br />
2015/2016<br />
Cash flows<br />
after<br />
2015/2016<br />
Bonds 3,738 265 1,269 3,135 0<br />
Liabilities to financial institutions 2,026 262 779 1,040 553<br />
Finance lease liabilities 68 23 13 28 28<br />
Other financial debt 840 68 296 606 16<br />
Trade accounts payable 4,807 4,789 4 11 3<br />
Derivative financial liabilities that do not qualify for hedge accounting 282 238 35 9 0<br />
Derivative financial liabilities that qualify for hedge accounting 96 62 9 21 0<br />
Other financial liabiltities 980 978 2 0 0<br />
Cash flows from derivatives are offset by cash flows from hedged<br />
underlying transactions, which have not been considered in the<br />
analysis of maturities. If cash flows from the hedged underlying<br />
transactions were also considered, the cash flows shown in the table<br />
would be accordingly lower.<br />
Market risks<br />
Market risk is the risk that fair values or future cash flows of nonderivative<br />
or derivative financial instruments will fluctuate due to<br />
changes in risk factors. Among market risks relevant to ThyssenKrupp<br />
are foreign currency, interest rate, commodity price, and especially raw<br />
material price risks. Associated with these risks are fluctuations in<br />
income, equity and cash flow. The objective of risk management is to<br />
eliminate or limit emerging risks by taking appropriate precautions,<br />
especially by applying derivatives. The application of derivatives is<br />
subject to strict controls set up on the basis of guidelines as part of<br />
regular reporting. The Group primarily concludes over-the-counter<br />
(OTC) forward foreign currency transactions, interest rate swaps, cross<br />
currency derivatives and commodity forward contracts with banks and<br />
trading partners. In addition, exchange-traded futures are used to<br />
hedge commodity prices.<br />
The following analysis and amounts determined by means of sensitivity<br />
analyses represent hypothetical, future-oriented data that can differ<br />
from actual outcomes because of unforeseeable developments in<br />
financial markets. Moreover, non-financial or non-quantifiable risks,<br />
such as business risks, are not considered here.<br />
Foreign currency risk exposures<br />
The international nature of our business activities generates numerous<br />
cash flows in different currencies – especially in US dollars. Hedging<br />
the resulting currency risk exposures is an essential part of our risk<br />
management.<br />
Group-wide regulations form the basis for ThyssenKrupp Group’s<br />
currency management. Principally, all group companies are obliged to<br />
hedge foreign currency positions at the time of inception. Affiliated<br />
companies based in the Euro zone are obliged to submit all unhedged<br />
positions from trade activities in major transaction currencies to a<br />
central clearing office. Depending on the derivatives’ hedging purpose<br />
and resulting accounting treatment, the offered positions are either<br />
hedged under a portfolio hedge approach or directly hedged with<br />
banks on a back-to-back basis taking into account the respective
3.6 Consolidated financial statements Notes to the consolidated financial statements<br />
3.6 Consolidated financial statements Notes to the consolidated financial statements<br />
maturity. Financial transactions and the transactions undertaken by our<br />
subsidiaries outside the Euro zone are hedged in close cooperation<br />
with central Group management. Compliance with the Group’s<br />
requirements is regularly ascertained by our Corporate Center Internal<br />
Auditing.<br />
Foreign currency hedging is used to fix prices on the basis of hedging<br />
rates as protection against any unfavorable exchange rate fluctuations<br />
in the future. When hedging anticipated production-related ore, coal<br />
and coke purchases, favorable developments in the Euro/US dollar<br />
exchange rate are also systematically exploited.<br />
Hedging periods are generally based on the maturities of underlying<br />
transactions. Foreign currency derivative contracts usually have<br />
maturities of twelve months or less, but can also be significantly longer<br />
in exceptional cases. The hedging periods for forecasted ore, coal and<br />
coke purchases have been established on the basis of a theoretical fair<br />
exchange rate (based on purchasing power parity) and the margin of<br />
fluctuation between the US dollar and the Euro based on historical<br />
data. In accordance with a set pattern, purchases forecasted for a<br />
specific period are hedged whenever defined hedging rates are<br />
reached.<br />
The US dollar is the only relevant risk variable for sensitivity analyses<br />
under IFRS 7, as the vast majority of foreign currency cash flows<br />
occurs in US dollars. As hedging transactions are generally used to<br />
hedge underlying transactions, opposite effects in underlying and<br />
hedging transactions are almost entirely offset over the total period.<br />
Thus, the currency risk exposure described here results from hedging<br />
relationships with off-balance sheet underlying transactions, i.e.<br />
hedges of firm commitments and forecasted sales. Based on our<br />
analysis, the US dollar exposure as of September 30, 2011 was as<br />
follows:<br />
If the Euro had been 10% stronger against the US dollar as of<br />
September 30, 2011, the hedge reserve in equity and fair value of<br />
hedging transactions would have been €170 million (2010: €118<br />
million) lower and earnings resulting from the measurement as of the<br />
balance sheet date €88 million (2009/2010: €125 million) higher. If the<br />
Euro had been 10% weaker against the US dollar as of September 30,<br />
2011, the hedge reserve in equity and fair value of hedging<br />
transactions would have been €206 million (2010: €145 million) higher<br />
and earnings resulting from the measurement as of the balance sheet<br />
date €106 million (2009/2010: €151 million) lower.<br />
Interest rate risk<br />
Due to the international focus of ThyssenKrupp’s business activities,<br />
the Group procures liquidity to cover its financial needs in international<br />
money and capital markets in different currencies and with various<br />
maturities. Some of the resulting financial debt and financial<br />
investments are exposed to interest rate risk. The Group’s central<br />
interest rate management manages and optimizes interest rate risk.<br />
This includes regular interest analyses. In some cases, the Group uses<br />
derivatives to hedge interest rate risk. These instruments are<br />
contracted with the objective of minimizing interest rate volatilities and<br />
finance costs for underlying transactions.<br />
The major part of the interest derivatives is immediately and directly<br />
allocated to particular financings as cash flow or fair value hedges.<br />
These are derivatives that qualify for hedge accounting. A small part of<br />
the interest derivatives is not specifically allocated to an individual<br />
financing but hedges a portfolio of individual loans using a macro<br />
hedge approach.<br />
Cross currency swaps have been contracted primarily in connection<br />
with the US dollar financing activities.<br />
Interest rate instruments can result in cash flow risks, opportunity<br />
effects, as well as interest rate risks affecting the balance sheet and<br />
earnings. Refinancing and variable-rate financial instruments are<br />
subject to cash flow risk which expresses the uncertainty of future<br />
interest payments. Cash flow risk is measured by means of cash flow<br />
sensitivity. Opportunity effects arise from non-derivatives, as these are<br />
measured at amortized cost rather than fair value, in contrast to<br />
interest derivatives. This difference, the so-called opportunity effect,<br />
affects neither the balance sheet nor the statement of income. Onbalance<br />
sheet interest rate risks affecting equity result from the<br />
measurement of interest derivatives qualifying as cash flow hedges.<br />
Interest rate risks affecting earnings arise from the remaining interest<br />
rate derivatives not qualifying for hedge accounting. Opportunity<br />
effects and interest rate risks affecting the balance sheet and earnings<br />
are determined by calculating fair value sensitivity analyses and<br />
changes.<br />
As of September 30, 2011, a +100/(20) basis point parallel shift in<br />
yield curves is assumed for all currencies in interest analyses. In fiscal<br />
year 2008/2009 the parallel downward shift was reduced to (20) basis<br />
points to consider the reduced interest level as a result of the financial<br />
crisis and to avoid negative interest rates. Due to the still relatively low<br />
184
3.6 Consolidated financial statements Notes to the consolidated financial statements<br />
interest level this approach is also maintained for the current analysis.<br />
The analysis results in the opportunities (positive values) and risks<br />
(negative values) shown in the following table:<br />
million €<br />
Changes in all yield curves<br />
as of Sept. 30, 2011 by<br />
+ 100 basis<br />
points<br />
(20) basis<br />
points<br />
Cash flow risk 26 (5)<br />
Opportunity effects<br />
Interest rate risks resulting from interest rate<br />
164 (34)<br />
derivatives affecting balance sheet<br />
Interest rate risks resulting from interest rate<br />
(1) 0<br />
derivatives affecting earnings 0 0<br />
In the previous year the analysis resulted in the opportunities (positive<br />
values) and risks (negative values) shown in the following table:<br />
million €<br />
Changes in all yield curves<br />
as of Sept. 30, 2010 by<br />
+ 100 basis<br />
points<br />
(20) basis<br />
points<br />
Cash flow risk 27 (5)<br />
Opportunity effects<br />
Interest rate risks resulting from interest rate<br />
203 (42)<br />
derivatives affecting balance sheet<br />
Interest rate risks resulting from interest rate<br />
2 0<br />
derivatives affecting earnings 0 0<br />
If, as of September 30, 2011, all yield curves combined had been 100<br />
basis points higher, the hedge reserve in equity and fair value of the<br />
relevant interest derivatives would have been €1 million lower (2010:<br />
€2 million higher) and earnings resulting from the measurement as of<br />
the balance sheet date €26 million (2009/2010: €27 million) higher. If,<br />
as of September 30, 2011, all yield curves combined had been 20<br />
basis points lower, the hedge reserve in equity and fair value of the<br />
relevant interest derivatives would have been unchanged as in the<br />
previous year and earnings resulting from the measurement as of the<br />
balance sheet date €5 million (2009/2010: €5 million) lower.<br />
Commodity price risks<br />
The Group uses various nonferrous metals, especially nickel, as well as<br />
commodities such as ore, coal, coke and energy, for different<br />
production processes. Purchase prices for commodities and energy<br />
can vary significantly depending on market conditions.<br />
Consolidated financial statements<br />
184 | 185<br />
This causes commodity price risks which can affect income, equity and<br />
cash flow. We react with adjusted selling prices and alternative<br />
purchasing resources to ensure our competitiveness. To minimize risks<br />
arising from commodity price volatilities, the Group also uses<br />
derivatives, especially for nickel and copper. The contracting of such<br />
financial derivatives is subject to strict guidelines which are checked for<br />
compliance by internal auditing. The nonferrous metals are generally<br />
hedged by a central system. Only marketable instruments are used, as<br />
there are mainly commodity forward contracts. Commodity forward<br />
contracts are measured at fair value. Fluctuations in fair value are<br />
recognized predominately in profit or loss under sales revenue or cost<br />
of sales. Sometimes cash flow hedge accounting is used when<br />
commodity derivatives are immediately and directly allocated to a<br />
particular firm commitment. In some cases, fair value hedges are used<br />
to hedge the exposure to changes in fair value of a firm commitment<br />
and exposure to inventory price risks.<br />
Risks resulting from rising energy prices are limited by structuring<br />
procurement on the electricity market and concluding or extending<br />
long-term natural gas contracts. These contracts are subject to the socalled<br />
“own use exemption” and therefore not carried as derivatives.<br />
Only hypothetical changes in market prices for derivatives are included<br />
in scenario analysis, required for financial instruments under IFRS 7.<br />
Offsetting effects from underlying transactions are not taken into<br />
account and would reduce their effect significantly.<br />
As of September 30, 2011 a +20/(20)% shift in market prices for<br />
commodities is assumed. The prior year assumptions of market prices<br />
at production cost level of important manufacturers respectively<br />
historical peak market prices have been replaced by this shift in market<br />
prices which seems to be more probable. If an increase of 20%<br />
(2009/2010: 142%) in market prices for said commodities is assumed,<br />
the estimated hypothetical impact on profit or loss resulting from the<br />
measurement as of the balance sheet date is 0 (2009/2010: €(200)<br />
million), and on equity €(9) million (2010: €113 million). If a decrease<br />
of 20% (2009/2010: 78%) in market prices for said commodities is<br />
assumed, the estimated hypothetical impact on profit or loss resulting<br />
from the measurement as of the balance sheet date is €65 million<br />
(2009/2010: €142 million), and on equity €(46) million (2010: €(50)<br />
million).
3.6 Consolidated financial statements Notes to the consolidated financial statements<br />
23 Related parties<br />
Based on the notification received in accordance with German<br />
Securities Trade Act (WpHG) Art. 21 as of December 21, 2006, the<br />
Alfried Krupp von Bohlen und Halbach Foundation holds an interest of<br />
25.10% in ThyssenKrupp AG; based on a voluntary notification of the<br />
Foundation as of October 05, 2011, the interest in ThyssenKrupp AG<br />
amounts to 25.33% as of September 30, 2011. Outside the services<br />
and considerations provided for in the by-laws (Article 21 of the Articles<br />
of Association of ThyssenKrupp AG), there are no other significant<br />
delivery and service relations except for the following transactions. In<br />
million €<br />
Year ended<br />
Sept. 30,<br />
2010<br />
2006/2007, a Group subsidiary received a €2 million elevator<br />
modernization contract from an entity belonging to the Alfried Krupp<br />
von Bohlen und Halbach Foundation. Based on this contract, a Group<br />
subsidiary realized sales of €0.1 million in 2009/2010.<br />
In 2009/2010 and 2010/2011, the Group has business relations with<br />
non-consolidated subsidiaries, associates and joint ventures.<br />
Transactions with these related parties result from the delivery and<br />
service relations in the ordinary course of business; the extent of the<br />
business relations is presented in the following table:<br />
Sales Supplies and services Receivables Payables<br />
Year ended<br />
Sept. 30,<br />
2011<br />
Year ended<br />
Sept. 30,<br />
2010<br />
Year ended<br />
Sept. 30,<br />
2011<br />
Non-consolidated subsidiaries 1 1 0 1 2 1 1 2<br />
Associates 54 56 1 36 43 29 31 27<br />
Joint ventures 241 296 1,300 2,222 62 71 178 248<br />
ESG Legierungen GmbH is classified as a related party due to the fact<br />
that a close member of the family of a former Executive Board member<br />
and current Supervisory Board member of ThyssenKrupp AG is a<br />
managing director. In 2010/2011 the Group realized sales of €0.5<br />
million (2009/2010: €0.7 million) with ESG Legierungen GmbH from<br />
the sale of zinc. In the same period the Group did not purchase any<br />
goods from ESG (2009/2010: Purchase of zinc alloy with a value of<br />
€0.1 million). The transactions were carried out at market conditions<br />
and resulted in trade accounts receivable of €45 thousand (2010:<br />
trade accounts payable of €90 thousand) as of September 30, 2011.<br />
The Heitkamp & Thumann Group located in Düsseldorf and the<br />
Heitkamp Baugruppe located in Herne are classified as related parties<br />
due to the fact that a member of the Supervisory Board has significant<br />
influence on both Groups. In 2010/2011 the ThyssenKrupp Group<br />
realized sales of €23.2 million (2009/2010: €18.6 million) with the<br />
Heitkamp & Thumann Group from the sale of steel and stainless<br />
material as well as from industrial servicing and with the Heitkamp<br />
Baugruppe sales of €0.3 million (2009/2010: €0.3 million). In the<br />
same period ThyssenKrupp did not purchase anything (2009/2010:<br />
goods with a value of €7 thousand) from the Heitkamp & Thumann<br />
Group and goods with a value of €1.9 million (2009/2010: €0.2<br />
million) from the Heitkamp Baugruppe. The transactions were carried<br />
out at market conditions. As of September 30, 2011, the transactions<br />
with the Heitkamp & Thumann Group resulted in trade accounts<br />
Sept. 30,<br />
2010<br />
Sept. 30,<br />
2011<br />
Sept. 30,<br />
2010<br />
Sept. 30,<br />
2011<br />
receivable of €1.7 million (2010: €1.7 million) and trade accounts<br />
payable of €15 thousand (2010: €22 thousand), the transactions with<br />
the Heitkamp Baugruppe resulted in trade accounts receivable of €5<br />
thousand (2010: €7 thousand) and trade accounts payable of €0.3<br />
million (2010: €7 thousand).<br />
Compensation of current Executive and Supervisory Board<br />
members<br />
The Group’s key management personnel compensation which has to<br />
be disclosed in accordance with IAS 24 comprises of the compensation<br />
of the current Executive and Supervisory Board members.<br />
Compensation of the current Executive Board members is as follows:<br />
Thousand €<br />
Year ended<br />
Sept. 30,<br />
2010<br />
Year ended<br />
Sept. 30,<br />
2011<br />
Short-term benefits<br />
(without share-based compensation) 8,249 8,833<br />
Post-employment benefits 2,726 3,149<br />
Share-based compensation 4,060 5,015<br />
Service cost and past service cost resulting from the pension<br />
obligations of the current members of the Executive Board are<br />
disclosed as post-employment benefits. The disclosure of share-based<br />
compensation refers to the fair value at grant date.
3.6 Consolidated financial statements Notes to the consolidated financial statements<br />
In addition, in fiscal year 2010/2011, the Executive Board members did<br />
not receive any payments from share-based compensation<br />
(2009/2010: 0).<br />
As of September 30, 2010 and 2011, respectively, no loans or<br />
advance payments were granted to members of the Executive Board;<br />
also as in the previous year no contingencies were assumed for the<br />
benefit of Executive Board members.<br />
Compensation of the current Supervisory Board members is as follows:<br />
Thousand €<br />
Year ended<br />
Sept. 30,<br />
2010<br />
Year ended<br />
Sept. 30,<br />
2011<br />
Short-term benefits 1,774 1,788<br />
Long-term benefits 0 0<br />
In addition, members of the Supervisory Board of ThyssenKrupp AG<br />
received compensation of €90 thousand in fiscal 2010/2011<br />
(2009/2010: €80 thousand) for supervisory board mandates at Group<br />
subsidiaries.<br />
As of September 30, 2010 and 2011, respectively, no loans or<br />
advance payments were granted to members of the Supervisory<br />
Board; also as in the previous year no contingencies were assumed for<br />
the benefit of Supervisory Board members.<br />
For individualized presentation and further details of Executive and<br />
Supervisory Board compensation refer to the presentation of the<br />
audited compensation report which is part of the “Corporate<br />
Governance” chapter of the annual report.<br />
Compensation of former Executive and Supervisory Board<br />
members<br />
Total compensation paid to former members of the Executive Board<br />
and their surviving dependants amounted to €14.6 million<br />
(2009/2010: €14.5 million). Under IFRS an amount of €192.7 million<br />
(2010: €190.6 million) is accrued for pension obligations benefiting<br />
former Executive Board members and their surviving dependants.<br />
Former Supervisory Board members who left the Supervisory Board<br />
prior to October 01, 2010 did not receive any proportional payment<br />
from the long-term compensation component in 2010/2011<br />
(2009/2010: 0).<br />
Consolidated financial statements<br />
186 | 187<br />
24 Segment reporting<br />
Since the implementation of the new organizational structure as of<br />
October 01, 2009, the Group is organized in the following eight<br />
business areas that represent the Group’s activities within materials<br />
and technologies. The business areas are in line with the internal<br />
organizational and reporting structure and represent the segments in<br />
accordance with IFRS 8. Prior year figures have been adjusted<br />
accordingly.<br />
Steel Europe<br />
This business area brings together the premium flat carbon steel<br />
activities, from intelligent material solutions to finished parts.<br />
Steel Americas<br />
This business area includes the production, processing and marketing<br />
of high-quality steel products in North and South America. It contains<br />
mainly the steelmaking and processing plants in Brazil and USA.<br />
Materials Services<br />
The business area activities comprise materials distribution, logistics<br />
and services, and the provision of technical services. In addition to<br />
rolled steel, stainless steel, tubes and pipes, nonferrous metals and<br />
plastics, Materials Services also offers services from processing and<br />
logistics to warehouse and inventory management through to supply<br />
chain management. The business area offers technical and<br />
infrastructure services in the areas of railway and construction<br />
equipment, industrial plants and steel mills.<br />
Elevator Technology<br />
This business area is active in the construction, modernization and<br />
servicing of elevators, escalators, moving walks, stair and platform lifts<br />
as well as passenger boarding bridges. Alongside a full range of<br />
installations for the volume market, the business area also delivers<br />
customized solutions.<br />
Plant Technology<br />
This business area is a supplier of chemical plants, refineries, cement<br />
plants, innovative solutions for the mining and handling of raw<br />
materials and minerals, production systems and assembly lines for the<br />
automotive industry.
3.6 Consolidated financial statements Notes to the consolidated financial statements<br />
Components Technology<br />
This business area offers efficient and innovative components for the<br />
automotive, construction and engineering sectors as well as for wind<br />
turbines.<br />
Marine Systems<br />
This business area is a supplier for naval surface vessels, submarines<br />
and premium-segment yachts. After the restructuring and the<br />
consummation of the disposals the business area will focus its<br />
activities on the construction of naval vessels.<br />
Stainless Global<br />
This business area is a supplier of flat stainless steel products and high<br />
performance materials such as nickel alloys and titanium. The<br />
business area also includes the new stainless steel mill in the USA.<br />
This segment is classified as a discontinued operation.<br />
Corporate<br />
Corporate comprises the Group’s head office including management of<br />
the business areas. It also includes the business services activities in<br />
the areas of finance, communications, IT and human resources. In<br />
addition, part of Corporate is real estate not used in operating that is<br />
managed and utilized centrally as well as inactive companies that could<br />
not be assigned to an individual business area.<br />
Corporate EBIT consists of:<br />
million €<br />
Year ended<br />
Sept. 30,<br />
2010<br />
Year ended<br />
Sept. 30,<br />
2011<br />
Corporate administration (223) (302)<br />
Pension expenses (25) 19<br />
R&D promotion (17) (7)<br />
Risk and insurance services 11 9<br />
Special items (3) (28)<br />
Other Corporate companies (11) (8)<br />
EBIT Corporate Headquarters (268) (317)<br />
EBIT Business Services (6) (12)<br />
EBIT IT-Services (2) (17)<br />
EBIT Real Estate (15) (31)<br />
EBIT Corporate (291) (377)<br />
Consolidation<br />
Consolidation essentially contains the elimination of intercompany<br />
profits in inventories and the reversal of intercompany interest income.<br />
The accounting principles for the segments are the same as those<br />
described for the Group in the summary of significant accounting<br />
principles. In accordance with the management approach which is<br />
applicable to segment reporting all figures presented are inclusive of<br />
disposal groups and discontinued operations.<br />
As of October 01, 2010 ThyssenKrupp switched its key earnings<br />
performance indicator from EBT to EBIT. Contrary to the previous EBT<br />
the new indicator EBIT can not be taken directly from the consolidated<br />
statement of income prepared in accordance with the IFRS rules.<br />
Factors that can only be optimized and assessed at Group level – in<br />
particular non-operating financial income/expense and income taxes –<br />
are disregarded in assessing operating units. Details on the definition<br />
of the new earnings indicator are presented in the “Value based<br />
management” chapter of the management report to the Group. Prior<br />
year figures have been adjusted accordingly; this refers in particular to<br />
the changed presentation of capitalized borrowing costs which were<br />
recognized in the statement of income within other financial<br />
income/expense and are included now in interest expense.<br />
Inter-segment pricing is determined on an arm’s length basis.
million €<br />
For the fiscal year<br />
ended Sept. 30, 2010<br />
Steel<br />
Europe<br />
Steel<br />
Americas<br />
Materials<br />
Services<br />
Elevator<br />
Technology<br />
Plant<br />
Technology<br />
Consolidated financial statements<br />
Components<br />
Technology<br />
Marine<br />
Systems<br />
Stainless<br />
Global* Corporate<br />
188 | 189<br />
Consolidation<br />
Group<br />
External sales 9,032 68 12,142 5,178 3,889 5,710 1,208 5,306 88 0 42,621<br />
Internal sales<br />
within the Group 1,738 0 621 10 42 14 3 595 43 (3,066) 0<br />
Total sales 10,770 68 12,763 5,188 3,931 5,724 1,211 5,901 131 (3,066) 42,621<br />
Income from companies<br />
accounted for using the<br />
equity method 30 0 3 1 2 0 20 0 0 0 56<br />
Aggregate investment in<br />
investees accounted for<br />
using the equity method 267 0 68 1 5 13 146 15 8 (1) 522<br />
Interest income 39 86 57 53 91 54 34 14 590 (671) 347<br />
Interest expense (109) 58 (107) (29) (33) (85) (49) (59) (903) 671 (645)<br />
EBIT 731 (600) 463 646 401 252 145 (57) (291) (344) 1,346<br />
Segment assets 9,433 9,020 7,660 5,435 5,372 5,596 4,132 5,393 16,852 (25,181) 43,712<br />
Depreciation and<br />
amortization expense 579 37 142 72 35 277 24 160 35 0 1,361<br />
Impairment losses of<br />
intangible assets, property,<br />
plant and equipment and<br />
investment property 4 6 3 6 2 37 7 0 10 0 75<br />
Impairment losses of<br />
investments accounted for<br />
using the equity method<br />
and of financial assets 0 0 2 0 0 0 5 0 0 0 7<br />
Reversals of impairment<br />
losses of intangible assets,<br />
property, plant and<br />
equipment and<br />
investment property 5 0 0 0 0 1 3 0 0 0 9<br />
Segment liabilities 5,761 7,124 5,113 3,268 4,306 3,398 3,308 3,759 23,054 (25,767) 33,324<br />
Significant non-cash items (65) (1) (15) (93) (106) (179) (24) (39) (26) (20) (568)<br />
Capital expenditures<br />
(intangible assets,<br />
property, plant,<br />
equipment and<br />
investment property) 286 2,054 125 70 32 272 8 344 206 11 3,408<br />
*Discontinued operation
3.6 Consolidated financial statements Notes to the consolidated financial statements<br />
3.6 Consolidated financial statements Notes to the consolidated financial statements<br />
million €<br />
For the fiscal year<br />
ended Sept. 30, 2011<br />
Steel<br />
Europe<br />
Steel<br />
Americas<br />
Materials<br />
Services<br />
Elevator<br />
Technology<br />
Plant<br />
Technology<br />
Components<br />
Technology<br />
Marine<br />
Systems<br />
Stainless<br />
Global* Corporate<br />
190<br />
Consolidation<br />
Group<br />
External sales 10,663 734 14,005 5,249 3,968 6,895 1,491 6,016 71 0 49,092<br />
Internal sales<br />
within the Group 2,151 405 771 4 36 13 2 723 72 (4,177) 0<br />
Total sales 12,814 1,139 14,776 5,253 4,004 6,908 1,493 6,739 143 (4,177) 49,092<br />
Income from companies<br />
accounted for using<br />
the equity method 42 0 4 1 2 0 22 3 0 0 74<br />
Aggregate investment in<br />
investees accounted for<br />
using the equity method 332 0 66 1 9 14 162 15 9 0 608<br />
Interest income 30 29 122 64 99 80 39 27 415 (599) 306<br />
Interest expense (92) (106) (128) (25) (32) (77) (19) (59) (947) 599 (886)<br />
EBIT 1,133 (3,145) 478 801 506 543 213 (785) (377) (355) (988)<br />
Segment assets 9,564 8,455 9,616 5,981 5,889 6,113 4,205 6,722 17,092 (30,034) 43,603<br />
Depreciation and<br />
amortization expense 530 391 134 74 36 285 19 175 41 (10) 1,675<br />
Impairment losses of<br />
intangible assets, property,<br />
plant and equipment and<br />
investment property 14 1,685 48 0 0 10 0 800 11 0 2,568<br />
Impairment losses of<br />
investments accounted for<br />
using the equity method<br />
and of financial assets 0 0 3 0 8 0 4 0 0 0 15<br />
Reversals of impairment<br />
losses of intangible assets,<br />
property, plant and<br />
equipment and<br />
investment property 0 0 2 0 0 58 0 0 0 0 60<br />
Segment liabilities 5,635 4,993 5,610 3,373 4,708 3,736 3,117 6,133 25,389 (29,473) 33,221<br />
Significant non-cash items (150) (6) (6) (87) (66) (84) (47) (11) (46) (10) (513)<br />
Capital expenditures<br />
(intangible assets,<br />
property, plant,<br />
equipment and<br />
investment property) 410 1,368 95 93 44 361 14 266 34 (24) 2,661<br />
*Discontinued operation
The reconciliations of sales, income from companies accounted for<br />
using the equity method, interest expense and of EBIT to EBT<br />
according to the statement of income are presented below:<br />
million €<br />
Year ended<br />
Sept. 30,<br />
2010<br />
Year ended<br />
Sept. 30,<br />
2011<br />
Sales as presented in segment reporting 42,621 49,092<br />
- Sales of Stainless Global (5,901) (6,739)<br />
+ Sales of Stainless Global to Group companies 595 723<br />
+ Sales of Group companies to Stainless Global 396 280<br />
Sales as presented in the statement of income 37,711 43,356<br />
Sales in the amount of €280 million (2009/2010: €396 million) result<br />
from sales of Group companies to Stainless Global. These business<br />
relationships shall also be continued after the disposal. They mainly<br />
relate to services provided by the Steel Europe business area to<br />
Stainless Global.<br />
million €<br />
Year ended<br />
Sept. 30,<br />
2010<br />
Year ended<br />
Sept. 30,<br />
2011<br />
Income from companies accounted for using the equity<br />
method as presented in segment reporting 56 74<br />
- Income form companies accounted for using the equity<br />
method of Stainless Global 0 (3)<br />
Income from companies accounted for using the equity<br />
method as presented in the statement of income 56 71<br />
million €<br />
Year ended<br />
Sept. 30,<br />
2010<br />
Year ended<br />
Sept. 30,<br />
2011<br />
Interest expense as presented in segment reporting 645 886<br />
- Interest expense of Stainless Global (2) (6)<br />
Interest expense as presented in the statement of income 643 880<br />
million €<br />
Year ended<br />
Sept. 30,<br />
2010<br />
Year ended<br />
Sept. 30,<br />
2011<br />
EBIT as presented in segment reporting<br />
- Depreciation of capitalized borrowing costs eliminated<br />
1,346 (988)<br />
in EBIT (15) (42)<br />
+ Interest income 347 306<br />
- Interest expense (645) (886)<br />
+ Other financial income/(expense), net<br />
- Items of other financial income/(expense), net assigned<br />
82 10<br />
to EBIT based on economic classification 20 22<br />
EBT - Group 1,135 (1,578)<br />
- EBT Stainless Global 70 827<br />
EBT as presented in the statement of income 1,205 (751)<br />
Consolidated financial statements<br />
190 | 191<br />
The aggregate investment in investees accounted for using the equity<br />
method reconciles to the aggregate amount according to the statement<br />
of financial postion as presented below:<br />
million €<br />
Year ended<br />
Sept. 30,<br />
2010<br />
Year ended<br />
Sept. 30,<br />
2011<br />
Aggregate investment in investees accounted for using<br />
the equity method as presented in segment reporting 522 608<br />
- aggregate investment in investees accounted for<br />
using the equity method that are held for sale 0 (15)<br />
Aggregate investment in investees accounted for using<br />
the equity method as presented in the statement of<br />
financial position 522 593<br />
In presenting information for geographical areas, allocation of sales is<br />
based on the location of the customer. Allocation of segment assets<br />
and capital expenditures is based on the location of the assets. Capital<br />
expenditures are presented in line with the definition of the cash flow<br />
statement.<br />
The geographical segment “Other EU” comprises of all member states<br />
of the European Union (besides Germany) as of the current reporting<br />
date. European countries which are currently not member of the<br />
European Union are part of the “Other countries” segment. The<br />
“Americas” segment includes the countries of the Nafta and of South<br />
America. The “Asia/Pacific” segment consists of Asia and Australia.<br />
Due to the high volume of customers and the variety of business<br />
activities, there are no individual customers that generate sales values<br />
that are material to the Group’s consolidated net sales.
3.6 Consolidated financial statements Notes to the consolidated financial statements<br />
million €<br />
External sales (location of the customer)<br />
Germany Other EU Americas Asia / Pacific<br />
Other<br />
countries Group<br />
Year ended Sept. 30, 2010 13,933 12,485 8,266 5,013 2,924 42,621<br />
Year ended Sept. 30, 2011 16,153 14,272 10,476 5,618 2,573 49,092<br />
Non-current assets (intangible assets, property, plant and equipment,<br />
investment property and other non-financial assets) (location of the assets)<br />
Sept. 30, 2010 7,658 2,279 10,381 923 452 21,693<br />
Sept. 30, 2011 6,621 2,070 9,658 1,012 450 19,811<br />
25 Accounting estimates and judgements<br />
The preparation of the Group’s consolidated financial statements<br />
requires management estimates and assumptions that affect reported<br />
amounts and related disclosures. All estimates and assumptions are<br />
made to the best of management’s knowledge and belief in order to<br />
fairly present the Groups financial position and results of operations.<br />
The following accounting policies are significantly impacted by<br />
management’s estimates and judgements.<br />
Business combinations<br />
As a result of acquisitions the Group recognized goodwill in its balance<br />
sheet. In a business combination, all identifiable assets, liabilities and<br />
contingent liabilities acquired are recorded at the date of acquisition at<br />
their respective fair value. One of the most significant estimates relates<br />
to the determination of the fair value of these asset and liabilities.<br />
Land, buildings and equipment are usually independently appraised<br />
while marketable securities are valued at market price. If any intangible<br />
assets are identified, depending on the type of intangible asset and the<br />
complexity of determining its fair value, the Group either consults with<br />
an independent external valuation expert or develops the fair value<br />
internally, using an appropriate valuation technique which is generally<br />
based on a forecast of the total expected future net cash flows. These<br />
evaluations are linked closely to the assumptions made by<br />
management regarding the future performance of the assets<br />
concerned and any changes in the discount rate applied.<br />
Goodwill<br />
As stated in the accounting policy in Note 01, the Group tests annually<br />
and in addition if any indicators exist, whether goodwill has suffered an<br />
impairment. If there is an indication, the recoverable amount of the<br />
cash-generating unit has to be estimated which is the greater of the<br />
fair value less costs to sell and the value in use. The determination of<br />
the value in use involves making adjustments and estimates related to<br />
the projection and discounting of future cash flows (see Note 04).<br />
Although management believes the assumptions used to calculate<br />
recoverable amounts are appropriate, any unforeseen changes in<br />
these assumptions could result in impairment charges to goodwill<br />
which could adversely affect the future financial position and operating<br />
results.<br />
Recoverability of assets<br />
At each balance sheet date, the Group assesses whether there is any<br />
indication that the carrying amounts of its property, plant and<br />
equipment, investment property or intangible assets may be impaired.<br />
If any such indication exists, the recoverable amount of the asset is<br />
estimated. The recoverable amount is the greater of the fair value less<br />
costs to sell and the value in use. In assessing the value in use,<br />
discounted future cash flows from the related assets have to be<br />
determined. Estimating the discounted future cash flows involves<br />
significant assumptions, including particularly those regarding future<br />
sale prices and sale volumes, costs and discount rates. Although
3.6 Consolidated financial statements Notes to the consolidated financial statements<br />
management believes that its estimates of the relevant expected useful<br />
lives, its assumptions concerning the economic environment and<br />
developments in the industries in which the Group operates and its<br />
estimations of the discounted future cash flows are appropriate,<br />
changes in the assumptions or circumstances could require changes in<br />
the analysis. This could lead to additional impairment charges in the<br />
future or to reversal of impairments if the trends identified by<br />
management reverse or the assumptions or estimates prove incorrect.<br />
Revenue recognition on construction contracts<br />
Certain Group entities, particularly in the Elevator Technology, Plant<br />
Technology and Marine Systems business areas, conduct a portion of<br />
their business under construction contracts which are accounted for<br />
using the percentage-of-completion method, recognizing revenue as<br />
performance on the contract progresses. This method requires<br />
accurate estimates of the extent of progress towards completion.<br />
Depending on the methodology to determine contract progress, the<br />
significant estimates include total contract costs, remaining costs to<br />
completion, total contract revenues, contract risks and other<br />
judgements. The managements of the operating companies<br />
continually review all estimates involved in such construction contracts<br />
and adjust them as necessary.<br />
Income taxes<br />
The Group operates and earns income in numerous countries and is<br />
subject to changing tax laws in multiple jurisdictions within the<br />
countries. Significant judgements are necessary in determining the<br />
worldwide income tax liabilities. Although management believes they<br />
have made reasonable estimates about the ultimate resolution of tax<br />
uncertainties, no assurance can be given that the final tax outcome of<br />
these matters will be consistent with what is reflected in the historical<br />
income tax provisions. Such differences could have an effect on the<br />
income tax liabilities and deferred tax liabilities in the period in which<br />
such determinations are made.<br />
At each balance sheet date, the Group assesses whether the<br />
realization of future tax benefits is sufficiently probable to recognize<br />
deferred tax assets. This assessment requires the exercise of<br />
judgement on the part of management with respect to, among other<br />
things, benefits that could be realized from available tax strategies and<br />
future taxable income, as well as other positive and negative factors.<br />
Consolidated financial statements<br />
192 | 193<br />
The recorded amount of total deferred tax assets could be reduced if<br />
estimates of projected future taxable income and benefits from<br />
available tax strategies are lowered, or if changes in current tax<br />
regulations are enacted that impose restrictions on the timing or extent<br />
of the Group’s ability to utilize future tax benefits. See Note 31 for<br />
further information on potential tax benefits for which no deferred tax<br />
asset is recognized.<br />
Employee benefits<br />
The Group accounts for pension and other postretirement benefits in<br />
accordance with actuarial valuations. These valuations rely on<br />
statistical and other factors in order to anticipate future events. These<br />
factors include key actuarial assumptions including the discount rate,<br />
expected return on plan assets, expected salary increases, mortality<br />
rates and health care cost trend rates. These actuarial assumptions<br />
may differ materially from actual developments due to changing<br />
market and economic conditions and therefore result in a significant<br />
change in postretirement employee benefit obligations and the related<br />
future expense. (See Note 15 for further information regarding<br />
employee benefits).<br />
Legal contingencies<br />
ThyssenKrupp companies are parties to litigations related to a number<br />
of matters as described in Note 21. The outcome of these matters may<br />
have a material effect on the financial position, results of operations or<br />
cash flows. Management regularly analyzes current information about<br />
these matters and provides provisions for probable contingent losses<br />
including the estimate of legal expense to resolve the matters. For the<br />
assessments internal and external lawyers are used. In making the<br />
decision regarding the need for loss provisions, management<br />
considers the degree of probability of an unfavourable outcome and<br />
the ability to make a sufficiently reliable estimate of the amount of loss.<br />
The filing of a suit or formal assertion of a claim against ThyssenKrupp<br />
companies or the disclosure of any such suit or assertions, does not<br />
automatically indicate that a provision of a loss may be appropriate.
3.6 Consolidated financial statements Notes Notes to to the the consolidated financial financial statements<br />
Notes to the consolidated statement of income<br />
26 Net sales<br />
Net sales include revenues resulting from the rendering of services of<br />
€9,308 million (2009/2010: €9,127 million) as well as sales from<br />
construction contracts of €6,682 million (2009/2010: €6,101 million).<br />
27 Other operating income<br />
million €<br />
Year ended<br />
Sept. 30,<br />
2010<br />
Year ended<br />
Sept. 30,<br />
2011<br />
Gains on the disposal of intangible assets, property,<br />
plant and equipment and investment property 19 43<br />
Currency exchange differences 122 74<br />
Insurance compensation 21 11<br />
Miscellaneous 239 378<br />
Total 401 506<br />
In fiscal year 2010/2011 miscellaneous other operating income<br />
includes €160 million resulting from a partial payback of a fine<br />
imposed by the EU Commission in 2007 for anticompetitive practices.<br />
Furthermore miscellaneous other operating income includes a<br />
multitude of minor single items resulting from the 621 (2008/2009:<br />
671) consolidated entities.<br />
28 Other operating expenses<br />
million €<br />
Year ended<br />
Sept. 30,<br />
2010<br />
Year ended<br />
Sept. 30,<br />
2011<br />
Losses on the disposal of intangible assets, property,<br />
plant and equipment and investment property 19 26<br />
Currency exchange differences 84 0<br />
Additions to /reversals of provisions 40 (45)<br />
Goodwill impairment<br />
Expenses in connection with non-customer related<br />
0 48<br />
research and development activities 178 175<br />
Other taxes 38 57<br />
Miscellaneous 327 319<br />
Total 686 580<br />
In fiscal year 2009/2010 miscellaneous other operating expenses<br />
contain expenses of €185 million that could not be capitalized and<br />
resulted from technical facilities not yet put into operation in the context<br />
with the major projects in Brazil and in the USA. In addition<br />
miscellaneous other operating expenses include a multitude of minor<br />
single items resulting from the 621 (2008/2009: 671) consolidated<br />
entities.<br />
29 Government grants<br />
In the preceding fiscal year, government grants to compensate<br />
expenses of the Group were recognized in the amount of €16 million<br />
(2009/2010: €15 million); thereof €1 million (2009/2010: €2 million)<br />
apply to discontinued operations.<br />
Payment of the above-mentioned government grants is subject to<br />
certain conditions which are currently assumed to be met.<br />
30 Financial income/(expense), net<br />
million €<br />
Year ended<br />
Sept. 30,<br />
2010<br />
194<br />
Year ended<br />
Sept. 30,<br />
2011<br />
Income from companies accounted for using the equity<br />
method 56 71<br />
Interest income from financial receivables<br />
Expected return on accrued pension and similar<br />
225 182<br />
obligations 122 124<br />
Interest income 347 306<br />
Interest expense from financial debt<br />
Interest cost of accretion of pensions and similar<br />
(186) (480)<br />
obligations (457) (400)<br />
Interest expense (643) (880)<br />
Income from investments 7 13<br />
Write-down of financial assets (7) (15)<br />
Gain/(loss) from disposals of financial assets (12) (23)<br />
Accretion of other provisions (19) (36)<br />
Miscellaneous, net 135 97<br />
Other financial income/(expense), net 104 36<br />
Financial income/(expense), net (136) (467)<br />
The line item “miscellaneous, net” as part of other financial<br />
income/(expense), net, includes interest income from financial assets<br />
that are not measured at fair value through profit or loss of €40 million<br />
(2009/2010: €27 million) and interest expense from financial liabilities<br />
that are not measured at fair value through profit or loss of €13 million<br />
(2009/2010: €23 million).<br />
Borrowing costs in the amount of €56 million (2009/2010: €339<br />
million) were capitalized during the period which reduced interest<br />
expense from financial debt. If financing is directly allocable to a<br />
certain investment, the actual borrowing costs are capitalized. If no<br />
direct allocation is possible, the Group’s average borrowing interest<br />
rate of the current period is taken into account to calculate the<br />
borrowing costs; it amounts to 6.1% for fiscal year 2010/2011<br />
(2009/2010: 6.6%).
3.6 Consolidated financial statements Notes to the consolidated financial statements<br />
31 Income taxes<br />
Income tax expense/(benefit) for the year ended September 30, 2011<br />
and the previous year consists of the following:<br />
million €<br />
Year ended<br />
Sept. 30,<br />
2010<br />
Year ended<br />
Sept. 30,<br />
2011<br />
Current income tax expense for the reporting period<br />
Deferred income tax expense/(benefit) for the reporting<br />
200 505<br />
period 96 (268)<br />
Current income tax expense/(benefit) for prior periods (156) 2<br />
Deferred income tax expense/(benefit) for prior periods 45 (36)<br />
Total<br />
This total breaks down to:<br />
185 203<br />
Current income tax expense/(benefit) Germany (41) 96<br />
Current income tax expense foreign 86 411<br />
Deferred income tax expense/(benefit) Germany (16) 140<br />
Deferred income tax expense/(benefit) foreign 156 (444)<br />
The German corporate income tax law applicable for 2010/2011 sets a<br />
statutory income tax rate of 15% (2009/2010: 15%) plus a solidarity<br />
surcharge of 5.5%. On average, the Group’s German companies are<br />
subject to a trade tax rate of 15.5% (2009/2010: 15.3%). Therefore, at<br />
year-end September 30, 2011, deferred taxes of German companies<br />
are calculated with a combined income tax rate (including solidarity<br />
surcharge) of 31.3% (2009/2010: 31.1%). The applicable tax rates for<br />
companies outside Germany range from 5.7% to 40.4% (2009/2010:<br />
5.7% to 40.4%). In fiscal year 2010/2011, changes in the domestic<br />
trade tax rate resulted in deferred tax expense in the amount of €4<br />
million (2009/2010: €1 million) and changes in foreign tax rates<br />
resulted in deferred tax benefit in the amount of €11 million<br />
(2009/2010: €7 million deferred tax expense).<br />
The components of income taxes recognized in total equity are as<br />
follows:<br />
million €<br />
Year ended<br />
Sept. 30,<br />
2010<br />
Year ended<br />
Sept. 30,<br />
2011<br />
Income tax expense as presented on the statement of<br />
income 185 203<br />
Income tax expense on discontinued operations<br />
Income non-effective tax effect on other comprehensive<br />
income<br />
23 2<br />
Continuing operations (204) 135<br />
Discontinued operations (11) 2<br />
Other income non-effective changes (93) 10<br />
Total (100) 352<br />
Consolidated financial statements<br />
194 | 195<br />
As of September 30, 2011, domestic corporate tax loss carryforwards<br />
amount to €387 million (2010: €794 million), domestic trade tax loss<br />
carryforwards amount to €46 million (2010: €237 million), and interest<br />
carryforwards amount to €257 million (2010: €151 million). In<br />
addition, foreign tax loss carryforwards amount to €2,922 million<br />
(2010: €1,704 million), in particular €994 million (2010: €192 million)<br />
in the USA, €876 million (2010: €164 million) in Brazil, and €452<br />
million (2010: €385 million) in Canada, and foreign tax credits amount<br />
to €44 million (2010: €28 million). In fiscal year 2009/2010, foreign<br />
interest carryforwards amounted to €13 million. In fiscal year<br />
2010/2011, deferred tax benefit in the amount of €243 million<br />
(2009/2010: €88 million) is attributable to tax loss carryforwards,<br />
interest carryforwards and foreign tax credits.<br />
Deferred tax assets are recognized only to the extent that the realization<br />
of such tax benefits is probable. In determining the related valuation<br />
allowance, all positive and negative factors, including prospective<br />
results, are taken into consideration in estimating whether sufficient<br />
taxable income will be generated to realize deferred tax assets. These<br />
estimates can change depending on the future course of events. As of<br />
September 30, 2011, tax loss carryforwards for which no deferred tax<br />
asset is recognized amount to €1,334 million (2010: €984 million).<br />
According to tax legislation as of September 30, 2011, an amount of<br />
€1,134 million (2010: €306 million) of these tax losses may be carried<br />
forward indefinitely and in unlimited amounts whereas an amount of<br />
€200 million (2010: €678 million) of these tax loss carryforwards will<br />
expire over the next 20 years if not utilized. Unrecognized deferred tax<br />
assets relating to tax loss carryforwards amount to €398 million as of<br />
September 30, 2011 (2010: €251 million). In addition, as of<br />
September 30, 2011, no deferred tax asset is recognized for deductible<br />
temporary differences in the amount of €1,660 million (2010: €419<br />
million). As of September 30, 2011, deferred tax assets for tax loss<br />
carryforwards and deductible temporary differences at ThyssenKrupp<br />
Companhia Siderúrgica do Atlântico are not recognized anymore as the<br />
realization of such tax benefits is no longer deemed sufficiently<br />
probable. In fiscal year 2010/2011, the benefit arising from previously<br />
unrecognized tax losses, foreign tax credits and temporary differences<br />
that are used to reduce the Group’s tax expense amounts to €13<br />
million (2009/2010: €12 million).
3.6 Consolidated financial statements Notes Notes to to the the consolidated financial financial statements<br />
Significant components of the deferred tax assets and liabilities are as follows:<br />
million €<br />
Deferred tax assets Deferred tax liabilities<br />
Intangible assets 421 360 384 397<br />
Property, plant and equipment 83 265 1,085 739<br />
Financial assets 124 131 12 7<br />
Inventories 1,958 2,376 268 295<br />
Other assets 309 315 255 496<br />
Accrued pension and similar obligations 1,052 805 85 3<br />
Other provisions 273 307 56 66<br />
Other liabilities 271 432 2,214 2,489<br />
Tax loss carryforwards 611 955 — —<br />
Interest carryforwards 45 70 — —<br />
Foreign tax credits 28 44 — —<br />
Gross value 5,175 6,060 4,359 4,492<br />
Valuation allowance (365) (952) — —<br />
Offset (4,220) (4,168) (4,220) (4,168)<br />
Balance sheet amount 590 940 139 324<br />
Deferred tax assets and liabilities are offset if they pertain to future tax<br />
effects for the same taxable entity towards the same taxation authority.<br />
Deferred tax assets of €45 million relate to consolidation items as of<br />
September 30, 2011 (2010: €68 million).<br />
For fiscal year 2010/2011, the income tax expense of €203 million<br />
presented in the financial statements is €438 million higher than the<br />
expected income tax benefit of €(235) million which would result if the<br />
million €<br />
Sept. 30,<br />
2010<br />
Sept. 30,<br />
2011<br />
Sept. 30,<br />
2010<br />
196<br />
Sept. 30,<br />
2011<br />
German combined income tax rate of 31.3% were applied to the<br />
Group’s income before income taxes. For fiscal year 2009/2010, the<br />
reported income tax expense of €185 million was €190 million lower<br />
than the expected income tax expense of €375 million with a German<br />
combined income tax rate of 31.1%. The following table reconciles the<br />
expected income tax expense/(benefit) to the income tax expense<br />
presented in the statement of income.<br />
Year ended<br />
Sept. 30,<br />
2010 in %<br />
Year ended<br />
Sept. 30,<br />
2011 in %<br />
Expected income tax expense/(benefit) 375 31.1 (235) 31.3<br />
Tax rate differentials to the German combined income tax rate (6) (0.5) (124) 16.5<br />
Changes in tax rates or laws 8 0.7 (7) 0.9<br />
Tax consequences of disposal of businesses (7) (0.6) 34 (4.5)<br />
Permanent items 61 5.1 16 (2.1)<br />
Change in valuation allowance (31) (2.6) 628 (83.6)<br />
Tax benefit not related to the reporting period (111) (9.2) (34) 4.5<br />
Income/(loss) from companies accounted for under the equity method (14) (1.2) (23) 3.1<br />
Tax losses received from Business Area Stainless Global (48) (4.0) 0 0.0<br />
Other, net (42) (3.5) (52) 6.9<br />
Income tax expense as presented on the statement of income 185 15.3 203 (27.0)
3.6 Consolidated financial statements Notes to the consolidated financial statements<br />
32 Earnings per share<br />
Basic earnings per share is calculated as follows:<br />
Consolidated financial statements<br />
196 | 197<br />
Year ended Sept. 30, 2010 Year ended Sept. 30, 2011<br />
Total amount<br />
in million €<br />
Earnings per<br />
share in €<br />
Total amount<br />
in million €<br />
Earnings per<br />
share in €<br />
Income/(loss) from continuing operations (net of tax) (attributable to ThyssenKrupp AG's stockholders) 916 1.97 (462) (0.97)<br />
Income/(loss) from discontinued operations (net of tax) (attributable to ThyssenKrupp AG's stockholders) (92) (0.20) (829) (1.74)<br />
Net income/(loss) (attributable to ThyssenKrupp AG's stockholders) 824 1.77 (1,291) (2.71)<br />
Weighted average shares 463,983,893 476,241,215<br />
Relevant number of common shares for the determination of<br />
earnings per share<br />
Earnings per share have been calculated by dividing net income/(loss)<br />
attributable to common stockholders of ThyssenKrupp AG (numerator)<br />
by the weighted average number of common shares outstanding<br />
(denominator) during the period. Shares sold during the period and<br />
shares reacquired during the period have been weighted for the<br />
portion of the period that they were outstanding.<br />
In fiscal year 2009/2010 the weighted average number outstanding<br />
shares was increased by the sale of treasury shares in December 2009<br />
and March 2010 in the context of the Group’s Share Purchase Program<br />
as well as by the sale of treasury shares in May 2010 in the context of<br />
the employee share purchase program. In fiscal year 2010/2011 the<br />
weighted average number of outstanding shares was increased by the<br />
sale of treasury shares in February 2011 in the context of the Group’s<br />
share purchase program, by the sale of treasury shares in May 2011 in<br />
the context of the employee share purchase and by the sale of treasury<br />
shares in the accelerated bookbuilding process to mainly institutional<br />
investors in July 2011.<br />
There were no dilutive securities in the periods presented.<br />
33 Additional disclosures on the consolidated statement of<br />
income<br />
Personnel expenses included in the consolidated statement of income<br />
are comprised of:<br />
million €<br />
Year ended<br />
Sept. 30,<br />
2010<br />
Year ended<br />
Sept. 30,<br />
2011<br />
Wages and salaries 6,812 7,045<br />
Social security taxes 1,308 1,352<br />
Net periodic pension costs - defined benefit* 108 171<br />
Net periodic pension costs - defined contribution<br />
Net periodic postretirement benefit cost other than<br />
119 111<br />
pensions* (20) (93)<br />
Other expenses for pensions and retirements 38 (19)<br />
Related fringe benefits 407 447<br />
Total 8,772 9,014<br />
* Excluding expected return on plan assets and interest cost which are<br />
recognzied as part of interest income/expense
3.6 Consolidated financial statements Notes to the consolidated financial statements<br />
3.6 Consolidated financial statements Notes to the consolidated financial statements<br />
The annual average number of employees is as follows:<br />
Year ended<br />
Sept. 30,<br />
2010<br />
Year ended<br />
Sept. 30,<br />
2011<br />
Steel Europe 34,923 32,635<br />
Steel Americas 2,434 3,787<br />
Materials Services 34,370 35,059<br />
Elevator Technology 43,062 45,180<br />
Plant Technology 12,975 13,135<br />
Components Technology 28,368 30,380<br />
Marine Systems 6,910 5,387<br />
Stainless Global 11,341 11,306<br />
Corporate 2,455 2,665<br />
Total 176,838 179,534<br />
This total breaks down to:<br />
Wage earners 101,357 103,850<br />
Salaried employees 70,954 71,167<br />
Trainees 4,527 4,517<br />
Auditors’ fees and services<br />
For the services performed by the Group auditors KPMG AG<br />
Wirtschaftsprüfungsgesellschaft and the companies of the worldwide<br />
KPMG association in fiscal years 2009/2010 and 2010/2011 the<br />
following fees (including expenses) were recognized as expenses:<br />
million €<br />
Year ended Sept. 30, 2010 Year ended Sept. 30, 2011<br />
thereof<br />
thereof<br />
Total Germany Total Germany<br />
Audit fees 15 8 14 7<br />
Audit-related fees 3 1 4 2<br />
Tax fees 1 0 3 1<br />
Fees for other services 0 0 1 1<br />
Total 19 9 22 11<br />
For the services performed by PricewaterhouseCoopers<br />
Wirtschaftsprüfungsgesellschaft and the companies of the worldwide<br />
PricewaterhouseCoopers association in fiscal years 2009/2010 and<br />
2010/2011 the following fees (including expenses) were recognized as<br />
expenses:<br />
million €<br />
Year ended Sept. 30, 2010 Year ended Sept. 30, 2011<br />
thereof<br />
thereof<br />
Total Germany Total Germany<br />
Audit fees 8 3 8 3<br />
Audit-related fees 3 1 3 2<br />
Tax fees 2 0 1 0<br />
Fees for other services 1 0 1 0<br />
Total 14 4 13 5<br />
The audit fees include mainly fees for the year-end audit of the<br />
consolidated financial statements, and the statutory auditing of<br />
ThyssenKrupp AG and the subsidiaries included in the consolidated<br />
financial statements. The audit-related fees essentially comprise the<br />
auditors’ review of the interim consolidated financial statements and<br />
the fees for due diligence services in connection with acquisitions and<br />
disposals. The tax fees include in particular fees for tax consulting<br />
services for current and planned transactions, for the preparation of tax<br />
returns, for tax due diligence services, for tax advice in connection with<br />
projects and Group-internal reorganizations as well as tax advice for<br />
employees sent to work abroad. The fees for other services are mainly<br />
fees for project-related consulting services.<br />
198
3.6 Consolidated financial statements Notes to the consolidated financial statements<br />
Notes to the consolidated statement<br />
of cash flows<br />
34 Additional information on the consolidated statement<br />
of cash flows<br />
The liquid funds considered in the consolidated statement of cash<br />
flows correspond to the “Cash and cash equivalents” line item in the<br />
consolidated statement of financial position taking into account the<br />
cash and cash equivalents attributable to the disposal groups inclusive<br />
of discontinued operations.<br />
Non-cash investing activities<br />
In fiscal 2010/2011, the acquisition and first-time consolidation of<br />
companies created an increase in non-current assets of €38 million<br />
(2009/2010: €27 million).<br />
The non-cash addition of assets under capital leases in fiscal<br />
2010/2011 amounted to €24 million (2009/2010: €13 million).<br />
Non-cash financing activities<br />
In fiscal 2010/2011, the acquisition and first-time consolidation of<br />
companies did not result in any increase in gross financial debt<br />
(2009/2010: €19 million).<br />
Consolidated financial statements<br />
Subsequent events<br />
35 Subsequent events<br />
No reportable events occured.<br />
Other information<br />
36 Declarations of conformity with the German Corporate<br />
Governance Code in accordance with Art. 161<br />
of the German Stock Corporation Act (AktG)<br />
198 | 199<br />
On October 01, 2011, the Executive Board and the Supervisory Board<br />
of ThyssenKrupp AG issued the declaration of conformity in<br />
accordance with Art. 161 of the Stock Corporation Act (AktG) and is<br />
now publicly available to the shareholders on the company’s website.<br />
ThyssenKrupp AG complies with all recommendations of the German<br />
Corporate Governance Code as amended on May 26, 2010 and<br />
complied with all recommendations of the Code in the period from the<br />
date of issue of the last Declaration of Conformity on January 21,<br />
2011.<br />
The declaration of conformity of our exchange-listed subsidiary Eisen-<br />
und Hüttenwerke AG was issued on October 01, 2011 and is now<br />
publicly available to the shareholders on the company’s website.
3.6 Consolidated financial statements Notes Notes to to the the Consolidated consolidated financial statements<br />
37 Application of Art. 264 Par. 3 and Art. 264b of German Commercial Code (HGB)<br />
The following domestic subsidiaries in the legal form of a capital corporation or a commercial partnership as defined in Art. 264a partly made use<br />
of the exemption clause included in Art. 264 Par. 3 and Art. 264b of German Commercial Code.<br />
A<br />
AGOZAL Oberflächenveredelung GmbH Neuwied<br />
Aloverzee Handelsgesellschaft mbH Düsseldorf<br />
AWG Industrieanlagen und Wassertechnik GmbH Berlin Berlin<br />
B<br />
Becker & Co. GmbH Neuwied<br />
BERCO Deutschland GmbH Ennepetal<br />
BIS Blohm + Voss Inspection Service GmbH Hamburg<br />
Blohm + Voss Naval GmbH Hamburg<br />
Blohm + Voss Repair GmbH Hamburg<br />
Blohm + Voss Shipyards & Services GmbH Hamburg<br />
Blohm + Voss Shipyards GmbH Hamburg<br />
C<br />
Christian Hein GmbH Langenhagen<br />
D<br />
Dr. Mertens Edelstahlhandel GmbH Offenbach<br />
DWR - Deutsche Gesellschaft für Weißblechrecycling mbH Andernach<br />
E<br />
EH Güterverkehr GmbH Duisburg<br />
Eisenmetall Handelsgesellschaft mbH Gelsenkirchen<br />
ELEG Europäische Lift + Escalator GmbH Düsseldorf<br />
Emder Werft und Dockbetriebe GmbH Emden<br />
Erich Weit GmbH Munich<br />
F<br />
Freiburger Stahlhandel GmbH Freiburg i.Br.<br />
G<br />
GMT Aufzug-Service GmbH Forst<br />
GWH Aufzüge GmbH Himmelstadt<br />
H<br />
Haisch Aufzüge GmbH Gingen/Fils<br />
Hanseatische Aufzugsbau GmbH Rostock<br />
Health Care Solutions GmbH Düsseldorf<br />
Herzog Coilex GmbH Stuttgart<br />
Hoesch Hohenlimburg GmbH Hagen<br />
Hövelmann & Co. Eisengroßhandlung GmbH Gelsenkirchen<br />
Howaldtswerke-Deutsche Werft GmbH Kiel<br />
I<br />
IKL Ingenieurkontor Lübeck GmbH Kiel<br />
Innovative Meerestechnik GmbH Emden<br />
J<br />
Jacob Bek GmbH Ulm<br />
K<br />
KBS Kokereibetriebsgesellschaft Schwelgern GmbH Duisburg<br />
Kraemer & Freund Handel GmbH Hagen<br />
L<br />
LiftEquip GmbH Elevator Components Neuhausen a.d.F.<br />
Liftservice und Montage GmbH Saarbrücken<br />
M<br />
Max Cochius GmbH Berlin<br />
MgF Magnesium Flachprodukte GmbH Freiberg<br />
MONTAN GmbH Assekuranz-Makler Düsseldorf<br />
O<br />
Otto Wolff Handelsgesellschaft mbH Essen<br />
Otto Wolff U.S. Sales GmbH Andernach<br />
R<br />
Rasselstein GmbH Andernach<br />
Rasselstein Verwaltungs GmbH Neuwied<br />
Reisebüro Dr. Tigges GmbH Essen<br />
Rothe Erde GmbH Dortmund<br />
S<br />
Stahlhauser Liegenschaften Verwaltungsgesellschaft mbH Essen<br />
SVG Steinwerder Verwaltungsgesellschaft mbH Hamburg<br />
T<br />
Tepper Aufzüge GmbH<br />
Thyssen Liegenschaften Verwaltungs- und Verwertungs GmbH<br />
Münster<br />
& Co. KG Industrie<br />
Thyssen Liegenschaften Verwaltungs- und Verwertungs GmbH<br />
Essen<br />
& Co. KG Stahl Essen<br />
Thyssen Rheinstahl Technik GmbH Düsseldorf<br />
Thyssen Stahl GmbH Düsseldorf<br />
ThyssenKrupp Academy GmbH Düsseldorf<br />
ThyssenKrupp Access Holding GmbH Essen<br />
ThyssenKrupp AdMin GmbH Düsseldorf<br />
ThyssenKrupp Aerospace Germany GmbH Rodgau<br />
ThyssenKrupp Aufzüge GmbH Stuttgart<br />
ThyssenKrupp Aufzugswerke GmbH Neuhausen a.d.F.<br />
ThyssenKrupp Automotive Systems GmbH Essen<br />
ThyssenKrupp Bauservice GmbH Hückelhoven<br />
ThyssenKrupp Bausysteme GmbH Kreuztal<br />
ThyssenKrupp Bilstein Suspension GmbH Ennepetal<br />
ThyssenKrupp Bilstein Tuning GmbH Ennepetal<br />
ThyssenKrupp Business Services GmbH Essen<br />
ThyssenKrupp DeliCate GmbH Düsseldorf<br />
ThyssenKrupp Dienstleistungen GmbH Düsseldorf<br />
ThyssenKrupp Electrical Steel GmbH Gelsenkirchen<br />
200
3.6 Consolidated financial statements Notes to the Consolidated financial statements<br />
ThyssenKrupp Electrical Steel Verwaltungsgesellschaft mbH Gelsenkirchen<br />
ThyssenKrupp Elevator (CENE) GmbH Essen<br />
ThyssenKrupp Elevator (CENE) Infrastruktur GmbH Essen<br />
ThyssenKrupp Elevator (EBC) GmbH Berlin<br />
ThyssenKrupp Elevator (ES/PBB) GmbH Essen<br />
ThyssenKrupp Elevator AG Düsseldorf<br />
ThyssenKrupp Elevator Research GmbH Düsseldorf<br />
ThyssenKrupp Encasa GmbH Neuss<br />
ThyssenKrupp Energievertriebs GmbH Essen<br />
ThyssenKrupp Erste Beteiligungsgesellschaft mbH Düsseldorf<br />
ThyssenKrupp Fahrtreppen GmbH Hamburg<br />
ThyssenKrupp Federn GmbH Hagen<br />
ThyssenKrupp Fördertechnik GmbH Essen<br />
ThyssenKrupp Gerlach GmbH Homburg/Saar<br />
ThyssenKrupp GfT Bautechnik GmbH Essen<br />
ThyssenKrupp GfT Tiefbautechnik GmbH Essen<br />
ThyssenKrupp Grundbesitz Verwaltungs GmbH Essen<br />
ThyssenKrupp Grundbesitz-Vermietungs GmbH & Co. KG Essen<br />
ThyssenKrupp Immobilien Verwaltungs GmbH & Co. KG Krupp<br />
Hoesch Stahl Essen<br />
ThyssenKrupp Immobilien Verwaltungs GmbH & Co. KG Stahl Essen<br />
ThyssenKrupp Immobilienentwicklungs Concordiahütte GmbH Oberhausen<br />
ThyssenKrupp Immobilienentwicklungs Krefeld GmbH Oberhausen<br />
ThyssenKrupp Industrial Services Holding GmbH Düsseldorf<br />
ThyssenKrupp Information Services GmbH Düsseldorf<br />
ThyssenKrupp IT Services GmbH Essen<br />
ThyssenKrupp Lasertechnik GmbH Ravensburg<br />
ThyssenKrupp Management Consulting GmbH Düsseldorf<br />
ThyssenKrupp Mannex GmbH Essen<br />
ThyssenKrupp Marine Systems AG Hamburg<br />
ThyssenKrupp Materials International GmbH Essen<br />
ThyssenKrupp Metallurgical Products GmbH Essen<br />
ThyssenKrupp MetalServ GmbH Essen<br />
ThyssenKrupp Plastics GmbH Essen<br />
ThyssenKrupp Plastics International GmbH Essen<br />
ThyssenKrupp Polysius Aktiengesellschaft Beckum<br />
ThyssenKrupp Presta Chemnitz GmbH Chemnitz<br />
ThyssenKrupp Presta Esslingen GmbH Esslingen<br />
ThyssenKrupp Presta Ilsenburg GmbH Ilsenburg<br />
ThyssenKrupp Presta SteerTec GmbH Düsseldorf<br />
ThyssenKrupp Presta SteerTec Mülheim GmbH Mülheim<br />
ThyssenKrupp Presta SteerTec Schönebeck GmbH Schönebeck<br />
ThyssenKrupp Printmedia GmbH Duisburg<br />
ThyssenKrupp Real Estate GmbH Essen<br />
ThyssenKrupp Risk and Insurance Services GmbH Essen<br />
ThyssenKrupp Sägenstahlcenter GmbH Duisburg<br />
ThyssenKrupp Schulte GmbH Essen<br />
ThyssenKrupp Stahl Immobilien GmbH Duisburg<br />
ThyssenKrupp Stahlkontor GmbH Düsseldorf<br />
ThyssenKrupp Stahl-Service-Center GmbH Krefeld<br />
ThyssenKrupp Steel Europe AG Duisburg<br />
ThyssenKrupp Steel Zweite Beteiligungsgesellschaft mbH Duisburg<br />
ThyssenKrupp System <strong>Engineering</strong>GmbH Essen<br />
ThyssenKrupp Systems & Services GmbH Düsseldorf<br />
ThyssenKrupp Tailored Blanks GmbH Duisburg<br />
ThyssenKrupp Technologies Beteiligungen GmbH Essen<br />
Consolidated financial statements<br />
200 | 201<br />
ThyssenKrupp Transrapid GmbH Kassel<br />
ThyssenKrupp Uhde GmbH Dortmund<br />
U<br />
Uhde High Pressure Technologies GmbH Hagen<br />
Uhde Inventa-Fischer GmbH Berlin<br />
Uhde Services and Consulting GmbH Dortmund<br />
Uhde Services GmbH Haltern am See<br />
The following Dutch subsidiaries made use of the exemption clause<br />
included in Art. 2:403 of the Civil Code of the Netherlands.<br />
T<br />
ThyssenKrupp Nederland B.V. Roermond<br />
ThyssenKrupp Nederland Holding B.V. Roermond<br />
ThyssenKrupp Nederland Intermediate B.V. Roermond<br />
ThyssenKrupp Slab International B.V. Brielle<br />
ThyssenKrupp Veerhaven B.V. Rotterdam<br />
U<br />
Uhde Fertilizer Technology B.V. Amsterdam
3.6 Consolidated financial statements Notes to the consolidated financial statements<br />
38 List of the Groups’ subsidiaries and equity interests<br />
Fully consolidated group companies (as of September 30, 2011)<br />
No. Name and domicile of company<br />
Steel Europe<br />
ThyssenKrupp Steel Europe<br />
1 ThyssenKrupp Steel Europe AG, Duisburg 438,771 99.53 607<br />
2 DE-VerwaltungsGmbH, Duisburg 25 100.00 1<br />
3 KBS Kokereibetriebsgesellschaft Schwelgern GmbH, Duisburg 25 100.00 1<br />
4 Pruna Betreiber GmbH, Grünwald 150 0.00 2) 1<br />
5 ThyssenKrupp Galmed, S.A., Sagunto, Spain 48,150 100.00 622 75.00%<br />
6 ThyssenKrupp Steel North America, Inc., Dover/Delaware, USA USD 10 100.00 648<br />
Processing<br />
Foreign<br />
currency<br />
7 DWR - Deutsche Gesellschaft für Weißblechrecycling mbH, Andernach 25 100.00 10<br />
8 Hoesch Hohenlimburg GmbH, Hagen 15,340 99.50 1<br />
9 Otto Wolff U.S. Sales GmbH, Andernach 26 100.00 10<br />
10 Rasselstein GmbH, Andernach 40,960 99.50 11<br />
1 25.00%<br />
11 Rasselstein Verwaltungs GmbH, Neuwied 93,500 100.00 1 59.23%<br />
12 ThyssenKrupp Bausysteme GmbH, Kreuztal 7,670 100.00 1<br />
49 40.77%<br />
13 ThyssenKrupp Electrical Steel GmbH, Gelsenkirchen 15,163 99.58 14 87.62%<br />
1 7.67%<br />
607 4.29%<br />
14 ThyssenKrupp Electrical Steel Verwaltungsgesellschaft mbH, Gelsenkirchen 30,000 100.00 1 62.46%<br />
15 ThyssenKrupp Sägenstahlcenter GmbH, Duisburg 1,023 100.00 1<br />
16 ThyssenKrupp Tailored Blanks GmbH, Duisburg 4,116 100.00 1<br />
49 37.54%<br />
17 EURISOL S.A., Steenvoorde, France 151 74.94 20 74.91%<br />
18 Hoesch Bausysteme Gesellschaft m.b.H., Vienna, Austria 1,454 100.00 626<br />
19 Isocab France S.A.S., Dunkerque, France 610 100.00 640<br />
12 0.03%<br />
20 Isocab N.V., Harelbeke-Bavikhove, Belgium 10,750 100.00 59 99.98%<br />
21 Isocab Vietnam JV Company, Ho Chi Minh , Vietnam USD 2,280 53.68 20<br />
22 ThyssenKrupp Aceros y Servicios S.A., Santiago, Chile CLP 4,988,440 1) 100.00 1<br />
23 ThyssenKrupp Bouwsystemen B. V., Veenendaal, Netherlands 20 100.00 59<br />
24 ThyssenKrupp Building Systems Ltd., Birmingham, Great Britain GBP 5 100.00 647<br />
25 ThyssenKrupp Byggesystem A/S, Støvring, Denmark DKK 500 100.00 12<br />
26 ThyssenKrupp Comercial Colombia S.A., Bogota, Columbia COP 272,610 1) 100.00 22<br />
1 0.02%<br />
27 ThyssenKrupp Electrical Steel India Private Ltd., Mumbai/Nashik, India INR 3,149,349 100.00 13 100.00% 3)<br />
28 ThyssenKrupp Electrical Steel Italia S.r.l., Milan, Italy 2,000 100.00 642<br />
29 ThyssenKrupp Electrical Steel UGO S.A.S, Isbergues, France 5,235 100.00 13<br />
30 ThyssenKrupp Épitöelemek Kft, Budapest, Hungary HUF 2,520,000 100.00 18<br />
31 ThyssenKrupp gradjevinski elementi d.o.o., Lepoglava, Croatia HRK 20 100.00 18<br />
32 ThyssenKrupp Metal Forming (Wuhan) Ltd., Wuhan, PR China 20,000 1) 100.00 636<br />
33 ThyssenKrupp Sisteme pentru Constructii S.R.L., Bucharest, Romania RON 55 100.00 18<br />
14 0.00% 3)<br />
34 ThyssenKrupp stavební systémy s.r.o., Nymburk, Czech Republic CZK 1,000 1) 100.00 18 98.00%<br />
35 ThyssenKrupp Systembau Austria Gesellschaft m.b.H., Vienna, Austria 51 100.00 626<br />
12 2.00%<br />
36 ThyssenKrupp Tailored Blanks Celik Sanayi VE Ticaret Ltd., Nilüfer/ Bursa, Turkey TRY 2,803 100.00 16 96.47%<br />
38 3.53%<br />
37 ThyssenKrupp Tailored Blanks S.A. de C.V., Puebla, Mexico MXN 50 1) 100.00 42 100.00% 3)<br />
38 ThyssenKrupp Tailored Blanks S.r.l., Turin, Italy 3,810 52.50 16<br />
1) fiscal year not 09/30 2) in accordance with IFRS regulations 3) splinter investment as of fourth digits behind decimal point 4) parent company<br />
Capital stock<br />
in €1,000<br />
or domestic<br />
currency<br />
Share<br />
holdings<br />
% Held by No.<br />
43 0.00% 3)
Fully consolidated group companies (as of September 30, 2011)<br />
No. Name and domicile of company<br />
Consolidated financial statements<br />
39 ThyssenKrupp Tailored Blanks Sverige AB, Olofström, Sweden 1,940 100.00 16<br />
202 | 203<br />
40 ThyssenKrupp Tailored Blanks (Wuhan) Ltd., Wuhan, PR China USD 21,000 1) 100.00 636 68.43%<br />
41 TKAS (Changchun) Tailored Blanks Ltd., Changchun, PR China USD 10,000 55.00 636<br />
42 TWB Company, LLC, Monroe, USA USD 1,500 55.00 6<br />
16 31.57%<br />
43 TWB de Mexico, S.A. de C.V., Saltillo, Coahuila, Mexico MXN 50 1) 100.00 42 99.00%<br />
45 1.00%<br />
44 TWB Industries, S.A. de C.V., Saltillo, Coahuila, Mexico MXN 50 1) 100.00 42 99.00%<br />
45 TWB of Ohio, Inc., Columbus/Ohio, USA USD 0 100.00 42<br />
Other Companies Steel Europe<br />
46 AGOZAL Oberflächenveredelung GmbH, Neuwied 1,540 100.00 1<br />
47 Becker & Co. GmbH, Neuwied 768 100.00 11<br />
48 EH Güterverkehr GmbH, Duisburg 1,534 100.00 1<br />
49 Eisen- und Hüttenwerke AG, Andernach 45,056 87.98 1<br />
50 MgF Magnesium Flachprodukte GmbH, Freiberg 500 100.00 1<br />
51 ThyssenKrupp Lasertechnik GmbH, Ravensburg 25 100.00 1<br />
52 ThyssenKrupp Printmedia GmbH, Duisburg 26 100.00 1<br />
53 ThyssenKrupp Steel Zweite Beteiligungsgesellschaft mbH, Duisburg 25 100.00 1<br />
45 1.00%<br />
54 B.V. Stuwadoors-Maatschappij Kruwal, Rotterdam, Netherlands 45 75.00 59 50.00%<br />
1 25.00%<br />
55 Ertsoverslagbedrijf Europoort C.V., Rotterdam, Netherlands 4,538 75.00 59 50.00%<br />
56 ThyssenKrupp Stål Danmark A/S, Copenhagen, Denmark DKK 800 100.00 59<br />
57 ThyssenKrupp Steel & Technologies Japan Co., Ltd., Tokyo, Japan JPY 10,000 100.00 59<br />
58 ThyssenKrupp Steel (Asia Pacific) Pte Ltd, Singapore, Singapore SGD 500 100.00 59<br />
59 ThyssenKrupp Veerhaven B.V., Rotterdam, Netherlands 5,000 100.00 645<br />
Steel Americas<br />
CSA<br />
60 AirSteel Comercial Gases Industriais Ltda., Rio de Janeiro, Brazil BRL 100 0.00 2) 1<br />
61 ThyssenKrupp Companhia Siderúrgica do Atlântico, Rio de Janeiro, Brazil BRL 14,382,258 73.13 65<br />
62 White Martins Steel Gases Industriais Ltda., Rio de Janeiro, Brazil BRL 100 0.00 2) 1<br />
ThyssenKrupp Steel USA<br />
63 ThyssenKrupp Steel and Stainless USA, LLC, Wilmington/Delaware, USA USD 1,000 100.00 66<br />
64 ThyssenKrupp Steel USA, LLC, Wilmington/Delaware, USA USD 1,000 100.00 63<br />
Other Companies Steel Americas<br />
65 ThyssenKrupp Slab International B.V., Brielle, Netherlands 80 73.13 59<br />
66 ThyssenKrupp Steel Americas, LLC, Wilmington/Delaware, USA USD 1 100.00 648<br />
Stainless Global<br />
ThyssenKrupp Stainless Sonstige Beteiligungen<br />
67 ThyssenKrupp Nirosta GmbH, Krefeld 110,000 100.00 593<br />
68 ThyssenKrupp Stainless Erste Beteiligungsgesellschaft mbH, Essen 25 100.00 593<br />
69 ThyssenKrupp Stainless Zweite Beteiligungen AG, Essen 100 100.00 593<br />
70 ThyssenKrupp Italia S.p.A., Terni, Italy 200,000 100.00 68<br />
71 ThyssenKrupp Nederland B.V., Roermond, Netherlands 13,613 100.00 68<br />
72 ThyssenKrupp Stainless Holding USA, Inc., Wilmington/Delaware, USA USD 1 1) 100.00 68<br />
ThyssenKrupp Nirosta<br />
73 ThyssenKrupp Nirosta Präzisionsband GmbH, Krefeld 1,000 100.00 67<br />
ThyssenKrupp Acciai Speciali Terni (I)<br />
Foreign<br />
currency<br />
74 Aspasiel S.r.l., Rome, Italy 260 100.00 77<br />
75 Società delle Fucine S.r.l., Terni, Italy 7,988 100.00 77<br />
76 Terninox S.p.A., Terni, Italy 20,800 100.00 77<br />
77 ThyssenKrupp Acciai Speciali Terni S.p.A., Terni, Italy 159,682 100.00 70<br />
1) fiscal year not 09/30 2) in accordance with IFRS regulations 3) splinter investment as of fourth digits behind decimal point 4) parent company<br />
Capital stock<br />
in €1,000<br />
or domestic<br />
currency<br />
Share<br />
holdings<br />
% Held by No.<br />
1 25.00%
3.6 Consolidated financial statements Notes to the consolidated financial statements<br />
Fully consolidated group companies (as of September 30, 2011)<br />
No. Name and domicile of company<br />
78 Tubificio di Terni S.p.A., Terni, Italy 5,944 97.00 77<br />
ThyssenKrupp Mexinox (MX)<br />
79 Mexinox Trading S.A. de C.V., Mexico D.F., Mexico MXN 100,600 1) 100.00 82 100.00% 3)<br />
80 Mexinox USA Inc., Brownsville/Texas, USA USD 2,000 100.00 82<br />
80 0.00% 3)<br />
81 ThyssenKrupp Mexinox CreateIT, S.A. de C.V., San Luis Potosi, Mexico MXN 50 1) 100.00 82 99.98%<br />
79 0.02%<br />
82 ThyssenKrupp Mexinox Participations, S.A. de C.V., San Luis Potosi, Mexico MXN 542,830 1) 100.00 71 100.00% 3)<br />
85 0.00% 3)<br />
83 ThyssenKrupp Mexinox S.A. de C.V., San Luis Potosi, Mexico MXN 377,170 1) 100.00 71 100.00% 3)<br />
Shanghai Krupp Stainless (CHN)<br />
84 Shanghai Krupp Stainless Co., Ltd., Pudong New Area / Shanghai, PR China CNY 2,618,815 1) 60.00 67<br />
ThyssenKrupp Stainless USA<br />
85 ThyssenKrupp Stainless USA, LLC, Wilmington/Delaware, USA USD 1,000 100.00 72<br />
ThyssenKrupp VDM<br />
86 ThyssenKrupp VDM GmbH, Werdohl 32,000 100.00 67<br />
87 ThyssenKrupp VDM Australia Pty. Ltd., Mulgrave/Victoria, Australia AUD 2,000 100.00 86<br />
88 ThyssenKrupp VDM Austria Gesellschaft m.b.H., Vienna, Austria 50 100.00 71<br />
89 ThyssenKrupp VDM Benelux B.V., Dordrecht, Netherlands 51 100.00 71<br />
90 ThyssenKrupp VDM Canada Ltd., Markham/Ontario, Canada CAD 300 100.00 86<br />
91 ThyssenKrupp VDM de Mexico S.A. de C.V., Naucalpan de Juarez, Mexico MXN 550 1) 100.00 86<br />
92 ThyssenKrupp VDM (GZ) Trading Co., Ltd., Guangzhou, PR China 470 100.00 636<br />
93 ThyssenKrupp VDM Hongkong Ltd., Hongkong, PR China HKD 10 1) 99.98 86<br />
94 ThyssenKrupp VDM Italia S.r.l., Sesto San Giovanni, Italy 10 100.00 70<br />
95 ThyssenKrupp VDM Japan K.K., Tokyo, Japan JPY 30,000 100.00 86<br />
96 ThyssenKrupp VDM Korea Co. Ltd., Bundang-gu, Sungnam-Si, Kyunggi-Do, South Korea KRW 100,000 100.00 86<br />
97 ThyssenKrupp VDM S.A.S., Rueil-Malmaison, France 120 100.00 105<br />
98 ThyssenKrupp VDM (Schweiz) AG, Basel, Switzerland CHF 100 100.00 86<br />
99 ThyssenKrupp VDM UK Ltd., Claygate-Esher, Great Britain GBP 60 100.00 86<br />
100 ThyssenKrupp VDM USA, Inc., Reno/Nevada, USA USD 600 100.00 85<br />
ThyssenKrupp Stainless International<br />
101 ThyssenKrupp Stainless International GmbH, Krefeld 26 100.00 67<br />
102 ThyssenKrupp SILCO-INOX Szervizközpont Kft, Batonyterenye, Hungary HUF 765,980 100.00 103<br />
103 ThyssenKrupp Stainless Benelux B.V., Rotterdam, Netherlands 18,151 100.00 71<br />
104 ThyssenKrupp Stainless DVP, S.A., Barcelona, Spain 5,344 100.00 71<br />
105 ThyssenKrupp Stainless France S.A., Paris, France 14,555 100.00 71<br />
106 ThyssenKrupp Stainless (GZ) Trading Company Ltd., Guangzhou, PR China USD 75 100.00 103<br />
107 ThyssenKrupp Stainless International (Guangzhou) Ltd., Guangzhou, PR China USD 9,500 100.00 636<br />
108 ThyssenKrupp Stainless International (HK) Ltd., Hongkong, PR China HKD 8,315 1) 100.00 101<br />
109 ThyssenKrupp Stainless Istanbul Çelik Servis Merkezi A.S., Istanbul, Turkey 1,049 100.00 103<br />
110 ThyssenKrupp Stainless Polska Sp.z o o., Dabrowa Gornicza, Poland PLN 34,312 100.00 101<br />
111 ThyssenKrupp Stainless UK Ltd., Birmingham, Great Britain GBP 100 100.00 71<br />
Materials Services<br />
MetalsServices<br />
Foreign<br />
currency<br />
112 ThyssenKrupp Materials International GmbH, Essen 283,383 99.84 593<br />
113 Aloverzee Handelsgesellschaft mbH, Düsseldorf 26 100.00 112<br />
114 Dr. Mertens Edelstahlhandel GmbH, Offenbach 1,023 100.00 112<br />
115 Eisenmetall Handelsgesellschaft mbH, Gelsenkirchen 26 100.00 112<br />
116 Erich Weit GmbH, Munich 356 100.00 123<br />
117 Freiburger Stahlhandel GmbH, Freiburg i.Br. 2,200 51.00 112<br />
118 Health Care Solutions GmbH, Düsseldorf 4,173 100.00 112<br />
119 Herzog Coilex GmbH, Stuttgart 4,100 74.90 132<br />
120 Hövelmann & Co. Eisengroßhandlung GmbH, Gelsenkirchen 256 100.00 112<br />
1) fiscal year not 09/30 2) in accordance with IFRS regulations 3) splinter investment as of fourth digits behind decimal point 4) parent company<br />
Capital stock<br />
in €1,000<br />
or domestic<br />
currency<br />
Share<br />
holdings<br />
% Held by No.<br />
85 0.00% 3)
Fully consolidated group companies (as of September 30, 2011)<br />
No. Name and domicile of company<br />
Consolidated financial statements<br />
Foreign<br />
currency<br />
121 Jacob Bek GmbH, Ulm 2,807 79.96 112<br />
122 Max Cochius GmbH, Berlin 920 75.00 112<br />
123 Otto Wolff Handelsgesellschaft mbH, Essen 15,400 99.50 112<br />
124 Peiniger International GmbH, Grünwald 1,023 100.00 133<br />
125 Thyssen Rheinstahl Technik GmbH, Düsseldorf 8,948 100.00 112<br />
126 ThyssenKrupp Information Services GmbH, Düsseldorf 41,600 100.00 607<br />
127 ThyssenKrupp Mannex GmbH, Essen 10,100 100.00 112<br />
128 ThyssenKrupp MetalServ GmbH, Essen 1,534 100.00 112 94.00%<br />
129 ThyssenKrupp Schulte GmbH, Essen 26 100.00 112<br />
130 ThyssenKrupp Services Immobilien GmbH, Düsseldorf 50 100.00 112<br />
204 | 205<br />
593 6.00%<br />
131 ThyssenKrupp Stahlkontor GmbH, Düsseldorf 1,486 99.98 112 77.70%<br />
195 19.91%<br />
607 2.38%<br />
132 ThyssenKrupp Stahl-Service-Center GmbH, Krefeld 9,287 99.55 112 94.89%<br />
593 4.66%<br />
133 ThyssenKrupp Systems & Services GmbH, Düsseldorf 59,310 100.00 112 94.90%<br />
134 Vermögensverwaltungsgesellschaft TAUS mbH, Grünwald 6,741 100.00 611<br />
135 Vermögensverwaltungsgesellschaft Xtend mbH, Grünwald 10,516 100.00 112<br />
136 Xtend new media Holding GmbH, Grünwald 100 100.00 126<br />
137 B.V.`Nedeximpo` Nederlandse Export- en Importmaatschappij, Amsterdam, Netherlands 1,362 100.00 171<br />
138 Carolina Building Materials, Inc., Carolina, Puerto Rico USD 450 100.00 123<br />
139 Cimex-Nor S.A., San Sebastian, Spain 618 74.00 112<br />
593 5.10%<br />
140 LAGERMEX S.A. de C.V., Puebla, Mexico MXN 120,545 1) 100.00 112 71.95%<br />
1 28.05%<br />
141 LAMINCER S.A., Munguia, Spain 180 1) 100.00 112 60.00%<br />
142 OOO ThyssenKrupp Materials, Moscow, Russia RUB 928,369 96.03 112<br />
143 PALMETAL Controlo e Armazenagem S.A., Palmela, Portugal 1,000 90.00 139<br />
139 40.00%<br />
144 Sidcomex S.A. de C.V., Puebla, Mexico MXN 50 1) 100.00 140 99.99%<br />
145 Thyssen Financial Services B.V., 's-Gravendeel, Netherlands 3,857 100.00 195<br />
146 Thyssen Sudamerica N.V., Willemstad, Netherland Antilles USD 5,463 100.00 171<br />
147 Thyssen Trading S.A., São Paulo, Brazil BRL 19,738 1) 100.00 112<br />
112 0.01%<br />
148 ThyssenKrupp Christon N.V., Lokeren, Belgium 7,033 100.00 645 53.50%<br />
149 ThyssenKrupp Energostal S.A., Torun, Poland PLN 15,000 84.00 112<br />
150 ThyssenKrupp Ferostav, spol. s r.o., Nové Zámky, Slovakia 1,492 80.00 112<br />
151 ThyssenKrupp Ferroglobus Kereskedelmi ZRt, Budapest, Hungary HUF 3,244,000 100.00 112<br />
152 ThyssenKrupp Ferrosta spol. s.r.o., Prague, Czech Republic CZK 200 100.00 112<br />
153 ThyssenKrupp Fortinox S.A., Buenos Aires, Argentina USD 2,100 80.00 112<br />
154 ThyssenKrupp Industrial Services Canada, Inc., Windsor/Ontario, Canada CAD 0 100.00 635<br />
155 ThyssenKrupp Industrial Services NA, Inc., Southfield/Michigan, USA USD 25 100.00 170<br />
156 ThyssenKrupp ISIS Holding, Inc., Wilmington/Delaware, USA USD 1 100.00 170<br />
157 ThyssenKrupp Logistics, Inc., Wilmington/Delaware, USA USD 1 100.00 170<br />
158 ThyssenKrupp Mannex Asia Pte. Ltd., Singapore, Singapore USD 154 100.00 127<br />
159 ThyssenKrupp Mannex Pty. Ltd., Sydney/New South Wales, Australia AUD 213 100.00 112<br />
160 ThyssenKrupp Mannex Sverige AB, Göteborg, Sweden SEK 2,000 100.00 127<br />
161 ThyssenKrupp Mannex UK Ltd., Woking, Great Britain GBP 2,175 100.00 647<br />
162 ThyssenKrupp Materials Austria GmbH, Vienna, Austria 2,455 100.00 626<br />
112 46.50%<br />
163 ThyssenKrupp Materials Belgium N.V./S.A., Lokeren, Belgium 1,200 100.00 645 85.87%<br />
164 ThyssenKrupp Materials CA Ltd., Concord/Ontario, Canada CAD 14,778 100.00 170<br />
165 ThyssenKrupp Materials d.o.o., Indjija, Serbia 9,990 100.00 112<br />
166 ThyssenKrupp Materials France S.A.S., Maurepas, France 25,958 100.00 640<br />
1) fiscal year not 09/30 2) in accordance with IFRS regulations 3) splinter investment as of fourth digits behind decimal point 4) parent company<br />
Capital stock<br />
in €1,000<br />
or domestic<br />
currency<br />
Share<br />
holdings<br />
% Held by No.<br />
112 14.13%
3.6 Consolidated financial statements Notes to the consolidated financial statements<br />
Fully consolidated group companies (as of September 30, 2011)<br />
No. Name and domicile of company<br />
167 ThyssenKrupp Materials Holding (Thailand) Ltd., Samut Prakarn Province, Thailand THB 46,900 100.00 176 51.00%<br />
168 ThyssenKrupp Materials Ibérica S.A., Martorelles, Spain 7,681 100.00 622<br />
169 ThyssenKrupp Materials Korea Company Ltd., Seoul, South Korea KRW 7,000,000 60.00 112<br />
170 ThyssenKrupp Materials NA, Inc., Southfield/Michigan, USA USD 2 100.00 648<br />
171 ThyssenKrupp Materials Nederland B.V., Amsterdam, Netherlands 9,076 100.00 645<br />
172 ThyssenKrupp Materials Romania S.R.L., Bucharest, Romania RON 21,552 1) 100.00 112<br />
173 ThyssenKrupp Materials Switzerland AG, Bronschhofen, Switzerland CHF 4,600 100.00 112<br />
174 ThyssenKrupp Materials (Shanghai) Co., Ltd., Shanghai, PR China CNY 23,000 1) 70.00 112<br />
175 ThyssenKrupp Materials Sverige AB, Göteborg, Sweden SEK 23,090 100.00 112<br />
112 49.00%<br />
176 ThyssenKrupp Materials (Thailand) Co., Ltd., Bangkok, Thailand THB 200,000 83.50 112 49.00%<br />
177 ThyssenKrupp Materials (UK) Ltd., Smethwick, Great Britain GBP 12,032 100.00 647<br />
178 ThyssenKrupp Materials Vietnam LLC, Hanoi, Vietnam VND 121,000,000 97.36 112<br />
179 ThyssenKrupp OnlineMetals, LLC, Southfield/Michigan, USA USD 1,600 100.00 170<br />
180 ThyssenKrupp Portugal - Aços e Serviços, Lda., Carregado, Portugal 1,150 100.00 112<br />
181 ThyssenKrupp Securitization Corp., Southfield/Michigan, USA USD 0 100.00 648<br />
182 ThyssenKrupp Service Acier S.A.S., Fosses, France 14,000 100.00 640<br />
183 ThyssenKrupp Stahlunion Polska Sp. z o.o., Katowitz, Poland PLN 100 100.00 123<br />
184 ThyssenKrupp Stal Serwis Polska Sp. z o.o., Dabrowa Górnicza, Poland PLN 28,000 100.00 132<br />
185 ThyssenKrupp Steel Distribution, LLC , Wilmington/Delaware, USA USD 1 100.00 170<br />
186 ThyssenKrupp-Jupiter Stomana OOD, Sofia, Bulgaria BGN 500 80.00 112<br />
SpecialServices<br />
Foreign<br />
currency<br />
187 DSU Beteiligungs-Gesellschaft für Dienstleistungen und Umwelttechnik mbH, Oberhausen 30 100.00 197<br />
188 ThyssenKrupp Aerospace Germany GmbH, Rodgau, Nieder-Roden DEM 1,000 100.00 112<br />
189 ThyssenKrupp AT.PRO tec GmbH, Essen 42 61.19 196<br />
167 34.50%<br />
190 ThyssenKrupp Bauservice GmbH, Hückelhoven 2,557 100.00 112 94.90%<br />
191 ThyssenKrupp Energievertriebs GmbH, Essen 5,113 100.00 112<br />
192 ThyssenKrupp GfT Bautechnik GmbH, Essen 500 70.00 112<br />
193 ThyssenKrupp GfT Gleistechnik GmbH, Essen 1,000 100.00 112<br />
194 ThyssenKrupp GfT Tiefbautechnik GmbH, Essen 26 100.00 192<br />
593 5.10%<br />
195 ThyssenKrupp Industrial Services Holding GmbH, Düsseldorf 50,000 100.00 112 94.90%<br />
607 5.10%<br />
196 ThyssenKrupp Metallurgical Products GmbH, Essen 8,000 100.00 112 82.53%<br />
197 ThyssenKrupp MillServices & Systems GmbH, Duisburg 1,875 68.00 195<br />
198 ThyssenKrupp Plastics GmbH, Essen 10,000 100.00 199<br />
199 ThyssenKrupp Plastics International GmbH, Essen 5,113 100.00 112<br />
195 17.47%<br />
200 Vermögensverwaltungsgesellschaft TKAS mbH, Grünwald 4,536 100.00 112 94.71%<br />
201 Alfaplast AG, Steinhausen, Switzerland CHF 250 100.00 234<br />
202 DSU - Romania S.r.l., Bucharest, Romania RON 6,968 100.00 187<br />
203 Indu-Light AG, Beromünster/Luzern, Switzerland CHF 150 53.33 204<br />
204 Neomat AG, Beromünster/Luzern, Switzerland CHF 200 100.00 234<br />
205 Notz Plastics AG, Biel/Bienne, Switzerland CHF 1,000 100.00 234<br />
206 OOO ThyssenKrupp Bautechnik technischer Service, St. Petersburg, Russia RUB 360 1) 100.00 192<br />
207 RIAS A/S, Roskilde, Denmark DKK 23,063 54.15 199<br />
208 RIP Comércio Ltda., São Paulo, Brazil BRL 619 100.00 209<br />
209 RIP Serviços Industriais Ltda., São Paulo, Brazil BRL 180,562 100.00 112<br />
607 5.29%<br />
210 RIP Serviços Siderúrgicos Ltda., Rio de Janeiro, Brazil BRL 1,000 100.00 209 100.00% 3)<br />
211 Röhm Italia S.r.l., Garbagnate Milanese, Italy 100 100.00 642<br />
212 Steba AG, Pfäffikon, Switzerland CHF 500 100.00 204<br />
1) fiscal year not 09/30 2) in accordance with IFRS regulations 3) splinter investment as of fourth digits behind decimal point 4) parent company<br />
Capital stock<br />
in €1,000<br />
or domestic<br />
currency<br />
Share<br />
holdings<br />
% Held by No.<br />
208 0.00% 3)
Fully consolidated group companies (as of September 30, 2011)<br />
No. Name and domicile of company<br />
Consolidated financial statements<br />
213 STEBA Direktverkauf Kunststoffe + Plexiglas GmbH, Hunzenschwil, Switzerland CHF 20 100.00 212<br />
214 ThyssenKrupp Aerospace Australia Pty. Ltd., Wetherill Park/New South Wales, Australia AUD 2,549 100.00 217<br />
215 ThyssenKrupp Aerospace Finland Oy, Mänttä, Finland 59 100.00 217<br />
206 | 207<br />
216 ThyssenKrupp Aerospace India Private Ltd., Bangalore, India INR 100 100.00 217 99.99%<br />
217 ThyssenKrupp Aerospace International Holdings Ltd., Birmingham, Great Britain GBP 650 100.00 220<br />
218 ThyssenKrupp Aerospace Nederland B.V., Venlo, Netherlands 18 100.00 645<br />
219 ThyssenKrupp Aerospace (Shanghai) Co. Ltd., Shanghai, PR China USD 2,000 100.00 220<br />
220 ThyssenKrupp Aerospace UK Ltd., Birmingham, Great Britain GBP 3,295 100.00 647<br />
221 ThyssenKrupp Aerospace (Xi'an) Co., Ltd., Xi'an, PR China USD 175 100.00 636<br />
222 ThyssenKrupp Autômata Industria de Peças Ltda., São Paulo , Brazil BRL 335 80.00 209<br />
223 ThyssenKrupp Cadillac Plastic S.A.S., Mitry-Mory, France 1,053 100.00 640<br />
220 0.01%<br />
224 ThyssenKrupp Comércio de Combustíveis e Gases Ltda., Rio de Janeiro, Brazil BRL 100,230 100.00 196 95.00%<br />
225 ThyssenKrupp GfT Polska Sp. z o.o., Krakow, Poland PLN 15,750 100.00 193<br />
226 ThyssenKrupp InPlant Services LLC, Dover/Delaware, USA USD 2,900 51.00 170<br />
61 5.00%<br />
227 ThyssenKrupp Máquinas e Equipamentos Ltda., Rio de Janeiro, Brazil BRL 10 100.00 209 95.00%<br />
228 ThyssenKrupp Materials, LLC, Southfield/Michigan, USA USD 1 100.00 170<br />
229 ThyssenKrupp MinEnergy (Tianjin) Co., Ltd., Tianjin, PR China USD 200 1) 100.00 196<br />
230 ThyssenKrupp Otto Wolff N.V./S.A, Mechelen, Belgium 711 100.00 199<br />
231 ThyssenKrupp Plastic Ibérica SL, Massalfassar (Valencia), Spain 3,000 100.00 622<br />
232 ThyssenKrupp Plastics Austria GmbH, Hörsching, Austria 182 100.00 626<br />
233 ThyssenKrupp Steelcom Pty. Ltd., North Sydney/New South Wales, Australia AUD 0 100.00 192<br />
234 ThyssenKrupp Stokvis Plastics B.V., Roosendaal, Netherlands 4,500 100.00 645<br />
235 ThyssenKrupp-Dopravné Stavby Slovensko s.r.o., Bratislava, Slovakia SKK 1,000 1) 51.00 193<br />
236 TOO ThyssenKrupp-CL COO, Aktau, Kazakhstan KZT 32,000 1) 51.00 192<br />
237 UAB ThyssenKrupp Baltija, Klaipeda, Lithuania LTL 10 1) 51.00 192<br />
IndustrialServices<br />
Foreign<br />
currency<br />
238 Siegfried Schlüssler Feuerungsbau GmbH, Bispingen 135 1) 100.00 239<br />
239 ThyssenKrupp Xervon Energy GmbH, Duisburg 1,300 1) 100.00 240<br />
240 ThyssenKrupp Xervon GmbH, Düsseldorf 12,000 1) 100.00 133<br />
241 ThyssenKrupp Xervon Utilities GmbH, Düsseldorf 25 1) 100.00 240<br />
61 5.00%<br />
242 Rosendaal Services N.V., Kapellen, Belgium 125 100.00 240 98.40%<br />
243 Sumatec/Astel-Peiniger (M) Joint Venture, Selangor Darul Ehsan, Malaysia MYR 56.00 254<br />
244 ThyssenKrupp Palmers Ltd., West Midlands, Great Britain GBP 320 100.00 240<br />
245 ThyssenKrupp Services Ltd., Coventry, Great Britain GBP 125 100.00 246<br />
246 ThyssenKrupp Services (UK) Ltd., Business Park Coventry West Midlands, Great Britain GBP 656 100.00 647<br />
241 1.60%<br />
247 ThyssenKrupp Xervon Algerie S.A.R.L., Algier, Algeria DZD 300,000 100.00 240 95.00%<br />
248 ThyssenKrupp Xervon Austria GmbH, Maria Lanzendorf, Austria 1,453 100.00 240<br />
249 ThyssenKrupp Xervon Co. Ltd., Shanghai, PR China CNY 5,805 1) 100.00 240<br />
250 ThyssenKrupp Xervon Corp - Mindus Joint Venture, Kuala Lumpur, Malaysia MYR 0 80.00 251<br />
251 ThyssenKrupp Xervon Corp. Sdn. Bhd., Kuala Lumpur, Malaysia MYR 6,800 49.00 254<br />
252 5.00%<br />
252 ThyssenKrupp Xervon Egypt SAE, Cairo, Egypt EGP 14,000 100.00 253 98.96%<br />
253 ThyssenKrupp Xervon Gulf LLC, Sharjah, United Arab Emirates AED 500 100.00 240<br />
254 ThyssenKrupp Xervon Malaysia Sdn. Bhd., Kuala Lumpur, Malaysia MYR 2,650 1) 100.00 240<br />
255 ThyssenKrupp Xervon Norway AS, Oslo, Norway NOK 20,000 100.00 240<br />
256 ThyssenKrupp Xervon Polska Sp. z o.o., Warsaw, Poland PLN 7,150 100.00 240<br />
257 ThyssenKrupp Xervon Saudi Arabia L.L.C., Al-Khubar, Saudi Arabia SAR 1,000 100.00 253<br />
258 ThyssenKrupp Xervon Sweden AB, Stockholm, Sweden SEK 1,200 100.00 240<br />
259 ThyssenKrupp Xervon U.A.E. - L.L.C. For Industrial Services, Abu Dhabi, United Arab Emirates AED 2,000 100.00 253<br />
1) fiscal year not 09/30 2) in accordance with IFRS regulations 3) splinter investment as of fourth digits behind decimal point 4) parent company<br />
Capital stock<br />
in €1,000<br />
or domestic<br />
currency<br />
Share<br />
holdings<br />
% Held by No.<br />
240 1.04%
3.6 Consolidated financial statements Notes to the consolidated financial statements<br />
Fully consolidated group companies (as of September 30, 2011)<br />
No. Name and domicile of company<br />
Elevator Technology<br />
Corporate Elevator<br />
260 ThyssenKrupp Elevator AG, Düsseldorf 100,000 100.00 593<br />
261 ELEG Europäische Lift + Escalator GmbH, Düsseldorf 51 100.00 260<br />
262 Rheinstahl Union Gesellschaft mit beschränkter Haftung, Düsseldorf 26 100.00 260<br />
263 ThyssenKrupp Elevator Research GmbH, Düsseldorf 25 100.00 261<br />
Central/Eastern/Northern Europe (CENE)<br />
Foreign<br />
currency<br />
264 Christian Hein GmbH, Langenhagen 522 100.00 274<br />
265 GMT Aufzug-Service GmbH, Forst 26 100.00 274<br />
266 GWH Aufzüge GmbH, Himmelstadt 26 100.00 274<br />
267 Haisch Aufzüge GmbH, Gingen/Fils 50 100.00 274<br />
268 Hanseatische Aufzugsbau GmbH, Rostock 33 100.00 274<br />
269 LiftEquip GmbH Elevator Components, Neuhausen a.d.F. 25 100.00 274<br />
270 Liftservice und Montage GmbH, Saarbrücken 51 100.00 274<br />
271 Tepper Aufzüge GmbH, Münster 1,641 100.00 274<br />
272 ThyssenKrupp Aufzüge GmbH, Stuttgart 2,700 100.00 275<br />
273 ThyssenKrupp Aufzugswerke GmbH, Neuhausen a.d.F. 10,226 99.50 274<br />
274 ThyssenKrupp Elevator (CENE) GmbH, Essen 7,100 100.00 260<br />
275 ThyssenKrupp Elevator (CENE) Infrastruktur GmbH, Essen 2,700 100.00 274<br />
276 Ascenseurs Drieux-Combaluzier S.A.S., Les Lilas, France 977 100.00 287<br />
277 Bardeck Lift Engineers Ltd., London, Great Britain GBP 11 100.00 647<br />
278 Compagnie des Ascenseurs et Elevateurs S.A.M. 'CASEL SAM', Monaco, Monaco 153 99.60 287<br />
279 Hammond & Champness Ltd., Nottingham, Great Britain GBP 500 100.00 290<br />
280 HK Services A/S, Bergen, Norway NOK 351 100.00 291<br />
281 MGTI SNEV S.A.S., Saint Jeannet, France 526 100.00 287<br />
282 Mulder Liftservice B.V., Nuth, Netherlands 18 100.00 296<br />
283 OOO ThyssenKrupp Elevator, Moscow, Russia RUB 14,344 100.00 274<br />
284 Proxi-Line E.U.R.L., Angers, France 77 100.00 297<br />
285 The Britannic Lift Company Ltd., West Yorkshire, Great Britain GBP 35 100.00 290<br />
286 ThyssenKrupp Ascenseurs Luxembourg S.a.r.l., Luxembourg, Luxembourg 34 100.00 274<br />
287 ThyssenKrupp Ascenseurs S.A.S., Angers, France 8,117 100.00 297<br />
288 ThyssenKrupp Aufzüge AG, Rümlang, Switzerland CHF 1,165 100.00 274 85.84%<br />
289 ThyssenKrupp Aufzüge Gesellschaft m.b.H., Vienna, Austria 370 100.00 626<br />
290 ThyssenKrupp Aufzüge Ltd., Nottingham, Great Britain GBP 20,990 100.00 647<br />
291 ThyssenKrupp Aufzüge Norge A/S, Oslo, Norway NOK 5,200 100.00 274<br />
287 14.16%<br />
292 ThyssenKrupp Aufzugswerke Konstruktions GmbH, Gratkorn, Austria 35 100.00 626 60.00%<br />
293 ThyssenKrupp DVG dvigala d.o.o., Trzin, Slowenia 805 100.00 626<br />
294 ThyssenKrupp Elevator A/S, Oslo, Norway NOK 100 100.00 291<br />
295 ThyssenKrupp Elevator A/S, Glostrup, Denmark DKK 550 100.00 274<br />
296 ThyssenKrupp Elevator B.V., Krimpen aan den IJssel, Netherlands 4,977 100.00 645<br />
297 ThyssenKrupp Elevator Holding France S.A.S., Puteaux Cedex, France 34,433 100.00 640<br />
298 ThyssenKrupp Elevator Ireland, Ltd., Dublin, Ireland 63 100.00 290<br />
299 ThyssenKrupp Elevator Lithuania UAB, Vilnius, Lithuania LTL 0 1) 100.00 626<br />
300 ThyssenKrupp Elevator Manufacturing France S.A.S., Angers, France 4,602 100.00 287<br />
301 ThyssenKrupp Elevator Sp. z o.o., Warsaw, Poland PLN 15,300 100.00 274<br />
302 ThyssenKrupp Elevator Sverige AB, Stockholm, Sweden SEK 8,542 100.00 291<br />
303 ThyssenKrupp Elevator UK Ltd., Nottingham, Great Britain GBP 2,300 100.00 290<br />
304 ThyssenKrupp Elevatori d.o.o., Belgrad, Serbia 750 1) 100.00 289<br />
305 ThyssenKrupp Hissit Oy, Helsinki, Finland 42 100.00 274<br />
306 ThyssenKrupp Kazlift LLP, Almaty, Kazakhstan KZT 234,876 100.00 329<br />
307 ThyssenKrupp Koncar dizala d.o.o., Zagreb, Croatia HRK 17,204 100.00 274<br />
273 40.00%<br />
308 ThyssenKrupp Lift Kft, Budapest, Hungary HUF 101,480 100.00 289 99.90%<br />
1) fiscal year not 09/30 2) in accordance with IFRS regulations 3) splinter investment as of fourth digits behind decimal point 4) parent company<br />
Capital stock<br />
in €1,000<br />
or domestic<br />
currency<br />
Share<br />
holdings<br />
% Held by No.<br />
261 0.10%
Fully consolidated group companies (as of September 30, 2011)<br />
No. Name and domicile of company<br />
Consolidated financial statements<br />
208 | 209<br />
309 ThyssenKrupp Liften Ascenseurs S.A., Brussels, Belgium 2,480 100.00 274 100.00% 3)<br />
310 ThyssenKrupp Liften B.V., Krimpen aan den IJssel, Netherlands 1,875 100.00 296<br />
311 ThyssenKrupp Rulletrapper A/S, Oslo, Norway NOK 100 100.00 291<br />
312 ThyssenKrupp Vytahy s.r.o., Bratislava, Slovakia 266 100.00 289<br />
313 ThyssenKrupp Vytahy s.r.o., Prague, Czech Republic CZK 78,313 100.00 274<br />
260 0.00% 3)<br />
314 TOB ThyssenKrupp Elevator Ukraine, Kiev, Ukraine UAH 45,754 1) 100.00 274 99.90%<br />
315 Trapo Küng AG, Basel, Switzerland CHF 500 100.00 288<br />
Southern Europe/Africa/Middle East (SEAME)<br />
316 ASEL Ascensores S.L., Madrid, Spain 606 100.00 329<br />
317 Nuova TKEI S.P.A., Milano, Italy 1,500 100.00 642<br />
261 0.10%<br />
318 ThyssenKrupp Asansör Sanayi ve Tic. A.S., Istanbul, Turkey TRY 28,164 100.00 274 67.55%<br />
319 ThyssenKrupp Elevadores, S.A., Lissabon, Portugal 3,586 100.00 329<br />
320 ThyssenKrupp Elevadores, S.L., Madrid, Spain 4,696 100.00 329<br />
321 ThyssenKrupp Elevator Almoayyed W.L.L., Manama, Bahrain BHD 20 70.00 260<br />
260 32.45%<br />
322 ThyssenKrupp Elevator Egypt Ltd., Cairo, Egypt EGP 2,400 100.00 260 75.00%<br />
329 25.00%<br />
323 ThyssenKrupp Elevator Israel LP, Rishon Le'zion, Israel ILS 40,000 100.00 261 49.90%<br />
324 ThyssenKrupp Elevator Italia S.p.A., Milan, Italy 490 100.00 317<br />
325 ThyssenKrupp Elevator Manufacturing Spain S.L., Andoain, Spain 281 100.00 320<br />
329 49.90%<br />
674 0.20%<br />
326 ThyssenKrupp Elevator Maroc S.A.R.L., Casablanca. Marruecos, Marocco MAD 2,085 100.00 329 95.00%<br />
320 5.00%<br />
327 ThyssenKrupp Elevator Saudi Co. Ltd., Riyadh, Saudi Arabia SAR 2,000 100.00 274 90.00%<br />
328 ThyssenKrupp Elevator (South Africa) (Pty.) Ltd., Johannesburg, South Africa ZAR 111 100.00 260<br />
329 ThyssenKrupp Elevator Southern Europe, Africa & Middle East, S.L.U., Madrid, Spain 306,109 100.00 622<br />
262 10.00%<br />
330 ThyssenKrupp Elevator SRL, Bucharest, Romania RON 1,545 1) 100.00 329 100.00% 3)<br />
331 ThyssenKrupp Elevator UAE (L L C), Dubai, United Arab Emirates AED 80,300 100.00 260<br />
332 ThyssenKrupp Elevator/Jordan Ltd. Co., Amman, Jordan JOD 1,569 100.00 260<br />
333 ThyssenKrupp Elevators Bulgaria EAD, Sofia, Bulgaria BGN 1,000 100.00 329<br />
320 0.00% 3)<br />
334 ThyssenKrupp Elevators Hellas S.A., Athen, Greece 4,840 100.00 260 51.00%<br />
335 ThyssenKrupp Industries and Services Qatar LLC, Doha, Qatar QAR 2,000 100.00 260<br />
Americas (AMS)<br />
Foreign<br />
currency<br />
336 Computerized Elevator Control Corp., New York, USA USD 8 100.00 349<br />
337 Elevator Service Holding Company Inc., Orlando/Florida, USA USD 0 100.00 349<br />
338 General Elevator Sales & Service Inc., Orlando/Florida, USA USD 18,505 100.00 337<br />
339 ThyssenKrupp Elevadores, S.A., São Paulo , Brazil BRL 259,607 99.81 320<br />
329 49.00%<br />
340 ThyssenKrupp Elevadores, S.A., Guatemala, Guatemala GTQ 10,178 1) 100.00 320 90.00%<br />
341 ThyssenKrupp Elevadores S.A., Panama, Panama USD 867 1) 100.00 320<br />
342 10.00%<br />
342 ThyssenKrupp Elevadores S.A., Buenos Aires, Argentina ARS 18,728 1) 100.00 320 94.98%<br />
344 5.02%<br />
343 ThyssenKrupp Elevadores S.A., Bogota, Columbia COP 5,657,905 1) 100.00 320 94.00%<br />
340 1.50%<br />
342 1.50%<br />
344 1.50%<br />
346 1.50%<br />
344 ThyssenKrupp Elevadores S.A., Santiago de Chile-Nunoa, Chile CLP 2,289,533 100.00 320 98.84%<br />
1) fiscal year not 09/30 2) in accordance with IFRS regulations 3) splinter investment as of fourth digits behind decimal point 4) parent company<br />
Capital stock<br />
in €1,000<br />
or domestic<br />
currency<br />
Share<br />
holdings<br />
% Held by No.<br />
342 1.16%
3.6 Consolidated financial statements Notes to the consolidated financial statements<br />
Fully consolidated group companies (as of September 30, 2011)<br />
No. Name and domicile of company<br />
345 ThyssenKrupp Elevadores, S.A. de C.V., Mexico City, Mexico MXN 75,036 1) 100.00 320 99.93%<br />
342 0.07%<br />
346 ThyssenKrupp Elevadores S.A.C., Lima, Peru PEN 12,556 1) 100.00 320 99.81%<br />
342 0.19%<br />
347 ThyssenKrupp Elevadores, S.R.L., Montevideo, Uruguay UYU 6,303 100.00 320 95.00%<br />
342 5.00%<br />
348 ThyssenKrupp Elevadores, S.R.L., Asunción, Paraguay PYG 1,330,000 1) 100.00 320 100.00% 3)<br />
349 ThyssenKrupp Elevator Americas Corp., Wilmington/Delaware, USA USD 0 100.00 648<br />
350 ThyssenKrupp Elevator Canada Ltd., Toronto/Ontario, Canada CAD 178,141 100.00 355<br />
351 ThyssenKrupp Elevator Capital Corp., Wilmington/Delaware, USA USD 302,250 100.00 352<br />
352 ThyssenKrupp Elevator Corp., Wilmimgton/Delaware, USA USD 26,261 100.00 349<br />
353 ThyssenKrupp Elevator Inc., San Juan, Puerto Rico USD 1 100.00 352<br />
354 ThyssenKrupp Elevator Manufacturing Inc., Collierville/Tennessee, USA USD 1 100.00 352<br />
355 ThyssenKrupp Northern Elevator Corp., Scarborough/Ontario, Canada CAD 174,100 100.00 635<br />
Asia/Pacific (AP)<br />
356 PT. ThyssenKrupp Elevator Indonesia, Jakarta, Indonesia IDR 12,760,653 94.68 260<br />
357 Sun Rhine Enterprises Ltd., Taipei, Taiwan TWD 138,075 100.00 260<br />
358 Sun Rich Enterprises Ltd., Taipei, Taiwan TWD 6,000 100.00 260<br />
359 Thyssen Elevators Co., Ltd., Zhongshan, PR China USD 31,680 1) 100.00 260<br />
360 ThyssenKrupp Elevator & Escalator (Shanghai) Co.Ltd., Shanghai, PR China USD 5,250 1) 100.00 636<br />
361 ThyssenKrupp Elevator Asia Pacific Ltd., Hongkong, PR China HKD 58,000 100.00 260<br />
362 ThyssenKrupp Elevator Australia Pty. Ltd., Sydney/New South Wales, Australia AUD 4,300 100.00 375<br />
363 ThyssenKrupp Elevator (BD) Pvt. Ltd., Dhaka, Bangladesh BDT 3,395 100.00 365<br />
364 ThyssenKrupp Elevator (HK) Ltd., Hongkong, PR China HKD 129,970 100.00 260<br />
342 0.00% 3)<br />
365 ThyssenKrupp Elevator (India) Private Limited, New Delhi, India INR 881,620 100.00 260 100.00% 3)<br />
366 ThyssenKrupp Elevator Installation and Maintenance (China) Co. Ltd., Guangzhou, PR China USD 6,500 1) 100.00 636<br />
367 ThyssenKrupp Elevator (Korea) Ltd., Seoul, South Korea KRW 1,273,220 100.00 260<br />
368 ThyssenKrupp Elevator Malaysia Sdn. Bhd., Selangor, Malaysia MYR 500 100.00 260<br />
369 ThyssenKrupp Elevator New Zealand Ltd., Auckland, New Zealand NZD 1 100.00 362<br />
370 ThyssenKrupp Elevator Queensland Pty. Ltd., Melbourne/Victoria, Australia AUD 0 100.00 375<br />
371 ThyssenKrupp Elevator (Singapore) Pte.Ltd., Singapore, Singapore SGD 4,800 100.00 260<br />
372 ThyssenKrupp Elevator (Thailand) Co., Ltd., Bangkok, Thailand THB 155,776 100.00 260<br />
373 ThyssenKrupp Elevator Vietnam Co., Ltd., Hanoi, Vietnam USD 200 100.00 260<br />
374 ThyssenKrupp Elevators (Shanghai) Co., Ltd., Shanghai, PR China USD 13,940 1) 100.00 636<br />
375 ThyssenKrupp Lifts Pacific Pty. Ltd., Alexandria/New South Wales, Australia AUD 5,151 100.00 260<br />
261 0.00% 3)<br />
376 TK Lif & Eskalator Sdn. Bhd., Shah Alam, Malaysia MYR 100 100.00 361 70.00%<br />
Escalators/Passenger Boarding Bridges(ES/PBB)<br />
Foreign<br />
currency<br />
377 ThyssenKrupp Elevator (EBC) GmbH, Berlin 25 100.00 260<br />
378 ThyssenKrupp Elevator (ES/PBB) GmbH, Essen 25 100.00 260<br />
379 ThyssenKrupp Fahrtreppen GmbH, Hamburg 1,311 100.00 274<br />
380 AVIOTEAM Servizio e Manutenzioni S.r.l., Rome, Italy 52 1) 65.00 381<br />
381 ThyssenKrupp Airport Services S.L., Mieres / Asturias, Spain 150 1) 100.00 384<br />
382 ThyssenKrupp Airport Systems Co. (Zhongshan) Ltd., Zhongshan/Guangdong, PR China USD 2,550 100.00 636<br />
383 ThyssenKrupp Airport Systems Inc., Fort Worth/Texas, USA USD 3,510 100.00 648<br />
368 30.00%<br />
384 ThyssenKrupp Airport Systems, S.A., Mieres/Oviedo, Spain 1,743 100.00 320 100.00%<br />
385 ThyssenKrupp Elevator (ES/PBB) Ltd., Newton Aycliffe, Great Britain GBP 4,135 100.00 647<br />
386 ThyssenKrupp Elevator Innovation Center, S.A., Mieres/Oviedo, Spain 902 100.00 388<br />
387 ThyssenKrupp Escalator Co. (China) Ltd., Zhongshan/Guangdong, PR China USD 14,800 1) 100.00 636<br />
388 0.00%<br />
388 ThyssenKrupp Norte S.A., Mieres/Oviedo, Spain 4,147 100.00 622 66.30%<br />
1) fiscal year not 09/30 2) in accordance with IFRS regulations 3) splinter investment as of fourth digits behind decimal point 4) parent company<br />
Capital stock<br />
in €1,000<br />
or domestic<br />
currency<br />
Share<br />
holdings<br />
% Held by No.<br />
320 33.70%
Fully consolidated group companies (as of September 30, 2011)<br />
No. Name and domicile of company<br />
Access (ACC)<br />
Consolidated financial statements<br />
389 ThyssenKrupp Access Holding GmbH, Essen 25 100.00 260<br />
390 ThyssenKrupp Encasa GmbH, Neuss 32 100.00 260<br />
391 Lift Able Ltd., Cleveland, Great Britain GBP 7 100.00 395<br />
392 ThyssenKrupp Access China Ltd., Shanghai, PR China USD 1,970 100.00 636<br />
393 ThyssenKrupp Access Corp., Kansas City/Missouri, USA USD 0 100.00 648<br />
394 ThyssenKrupp Access Japan Co., Ltd., Tokyo, Japan JPY 47,000 100.00 260<br />
395 ThyssenKrupp Access Ltd., Stockton-on-Tees, Great Britain GBP 100 100.00 647<br />
396 ThyssenKrupp Access Manufacturing, LLC, Delaware, USA USD 2,500 100.00 393<br />
397 ThyssenKrupp Accessibility B.V., Krimpen aan den Ijssel, Netherlands 1,270 100.00 296<br />
398 ThyssenKrupp Encasa AS, Oslo, Norway NOK 110 100.00 291<br />
399 ThyssenKrupp Encasa B.V., Krimpen aan den Ijssel, Netherlands 97 100.00 296<br />
400 ThyssenKrupp Encasa, SA, Sintra, Portugal 50 100.00 260<br />
401 ThyssenKrupp Encasa S.L., Madrid, Spain 3 100.00 622<br />
402 ThyssenKrupp Encasa S.r.l., Pisa, Italy 500 100.00 324<br />
403 ThyssenKrupp Monolift AB, Stockholm, Sweden SEK 100 100.00 296<br />
210 | 211<br />
404 ThyssenKrupp Monolift N.V., Gent, Belgium 450 100.00 296 99.93%<br />
405 ThyssenKrupp Monolift S.A.S., Gennevilliers, France 128 100.00 297<br />
Plant Technology<br />
Uhde<br />
406 AWG Industrieanlagen und Wassertechnik GmbH Berlin, Berlin DEM 50 100.00 408<br />
407 GKI-OFU Industrieofenbau GmbH, Dortmund 26 100.00 408<br />
389 0.07%<br />
408 ThyssenKrupp Uhde GmbH, Dortmund 49,650 100.00 616 94.90%<br />
409 Uhde High Pressure Technologies GmbH, Hagen 1,023 100.00 408<br />
410 Uhde Inventa-Fischer GmbH, Berlin 3,210 100.00 408<br />
411 Uhde Services GmbH, Haltern am See 588 100.00 408<br />
412 OOO Uhde, Dzerzhinsk, Russia RUB 5,000 1) 100.00 408<br />
413 OSC Process <strong>Engineering</strong> Ltd., Stockport, Great Britain GBP 350 90.00 647<br />
414 ThyssenKrupp PDNA <strong>Engineering</strong> (Proprietary) Ltd., Sunninghill, South Africa ZAR 1,000 74.90 460<br />
415 Uhde Arabia Ltd., Al-Khobar, Saudi Arabia SAR 2,000 60.00 408<br />
416 Uhde Asia Pacific Pty. Ltd., West Melbourne/Victoria, Australia AUD 857 100.00 408<br />
417 Uhde Corporation of America, Bridgeville/Pennsylvania, USA USD 0 100.00 648<br />
418 Uhde Edeleanu S.E. Asia Pte. Ltd., Singapore, Singapore SGD 1,000 100.00 408<br />
419 Uhde <strong>Engineering</strong> Consulting (Shanghai) Co., Ltd., Shanghai, PR China 364 1) 100.00 427<br />
593 5.10%<br />
420 Uhde <strong>Engineering</strong> de México, S.A. de C.V., Mexico D.F., Mexico MXN 8,919 1) 100.00 425 99.99%<br />
421 Uhde <strong>Engineering</strong> Egypt Company (S.A.E.), Cairo, Egypt EGP 250 100.00 408<br />
422 Uhde Fertilizer Technology B.V., Amsterdam, Netherlands 18 100.00 645<br />
423 Uhde India Private Ltd., Mumbai, India INR 29,440 80.43 408<br />
424 Uhde Inventa-Fischer AG, Domat / Ems, Switzerland CHF 100 100.00 408<br />
408 0.01%<br />
425 Uhde Mexico S.A. de C.V., Mexico City, Mexico MXN 45,219 1) 100.00 408 98.06%<br />
622 1.22%<br />
429 0.72%<br />
426 Uhde Services Slovakia s.r.o., Lazaretská, Slovakia SKK 200 100.00 411 85.00%<br />
427 Uhde Shedden (Australia) Pty. Ltd., South Melbourne/Victoria, Australia AUD 5,757 100.00 416<br />
428 Uhde (Thailand) Ltd., Bangkok, Thailand THB 31,000 48.38 416<br />
Polysius<br />
Foreign<br />
currency<br />
408 15.00%<br />
429 ThyssenKrupp Polysius AG, Beckum 10,737 100.00 616 94.90%<br />
430 A-C Equipment Services Corp., Milwaukee/Wisconsin, USA USD 4,500 100.00 436<br />
431 ELEX CemCat AG, Schwerzenbach, Switzerland CHF 100 60.00 429<br />
1) fiscal year not 09/30 2) in accordance with IFRS regulations 3) splinter investment as of fourth digits behind decimal point 4) parent company<br />
Capital stock<br />
in €1,000<br />
or domestic<br />
currency<br />
Share<br />
holdings<br />
% Held by No.<br />
593 5.10%
3.6 Consolidated financial statements Notes to the consolidated financial statements<br />
Fully consolidated group companies (as of September 30, 2011)<br />
No. Name and domicile of company<br />
432 Maerz Ofenbau AG, Zürich, Switzerland CHF 1,000 100.00 429<br />
433 OOO Polysius, Moscow, Russia RUB 17,000 100.00 429<br />
434 Polysius Asia Pacific Pte. Ltd., Singapore, Singapore SGD 100 100.00 429<br />
435 Polysius Australia Pty. Ltd., Perth/Western Australia, Australia AUD 50 100.00 429<br />
436 Polysius Corp., Atlanta/Georgia, USA USD 0 100.00 648<br />
437 Polysius de Argentina S.A., Buenos Aires, Argentina ARS 120 100.00 429<br />
438 Polysius de Mexico S.A. de C.V., Mexico-City, Mexico MXN 12,000 1) 100.00 429<br />
439 Polysius del Peru S.A., Arequipa, Peru PEN 28,678 100.00 429 99.01%<br />
440 Polysius do Brasil Ltda., São Paulo, Brazil BRL 62,179 100.00 429<br />
441 Polysius <strong>Engineering</strong> Sdn. Bhd., Kuala Lumpur, Malaysia MYR 500 100.00 429<br />
438 0.99%<br />
442 Polysius Ingenieria y Servicios del Peru S.A., Arequipa, Peru PEN 410 100.00 429 99.00%<br />
443 Polysius Ltd., Ascot/Berkshire, Great Britain GBP 300 100.00 647<br />
444 Polysius Polska Sp. z o.o., Warsaw, Poland PLN 50 100.00 429<br />
445 Polysius S.A., Madrid, Spain 601 100.00 622<br />
446 Polysius S.A.S., Aix en Provence, France 2,400 100.00 640<br />
447 Polysius (Shanghai) Co., Ltd., Shanghai, PR China 12,082 100.00 636<br />
448 Polysius Vietnam Ltd., Hanoi, Vietnam VND 2,416,700 100.00 429<br />
449 PT. ThyssenKrupp Polysius Indonesia, Jakarta, Indonesia USD 250 67.00 429<br />
437 1.00%<br />
450 ThyssenKrupp <strong>Engineering</strong> (Proprietary) Ltd., Gabarone, Botsuana BWP 3 100.00 460 99.97%<br />
429 0.03%<br />
451 ThyssenKrupp Servicios S.A. de C.V., Mexico D.F., Mexico MXN 50 1) 100.00 438 98.00%<br />
452 TOV Polysius Ukraine, Kiev, Ukraine 300 100.00 429<br />
453 Umatac Industrial Processes Inc., Calgary/ Alberta, Canada CAD 5,636 70.00 429<br />
Fördertechnik<br />
429 2.00%<br />
454 ThyssenKrupp Fördertechnik GmbH, Essen 22,344 100.00 616 94.90%<br />
455 Krupp Canada Inc., Calgary/Alberta, Canada CAD 5,000 100.00 454<br />
456 Mining Plants & Systems Bulgaria EOOD, Sofia, Bulgaria BGN 5 1) 100.00 454<br />
457 PWH Materials Handling Systems Inc., Calgary/Alberta, Canada CAD 20 100.00 454<br />
458 ThyssenKrupp BulkTec (China) Ltd., Beijing, PR China 5,000 1) 100.00 636<br />
459 ThyssenKrupp <strong>Engineering</strong> (Australia) Pty. Ltd., Stirling/Western Australia, Australia AUD 170 100.00 454<br />
593 5.10%<br />
460 ThyssenKrupp <strong>Engineering</strong> (Proprietary) Ltd., Sunninghill, South Africa ZAR 101 100.00 408 60.00%<br />
461 ThyssenKrupp Industries India Pvt. Ltd., Pimpri, India INR 97,865 54.73 596<br />
462 ThyssenKrupp Ingenieria Chile Ltda., Santiago de Chile, Chile USD 15 100.00 465<br />
463 ThyssenKrupp KH Mineral S.A.S., Sarreguemines, France 1,000 100.00 640<br />
464 ThyssenKrupp Materials Handling Pty. Ltd., Stirling/Western Australia, Australia AUD 25 100.00 454<br />
465 ThyssenKrupp Robins Inc., Denver/Colorado, USA USD 0 100.00 648<br />
System <strong>Engineering</strong><br />
Foreign<br />
currency<br />
466 ThyssenKrupp System <strong>Engineering</strong> GmbH, Essen 50 100.00 616<br />
467 OOO ThyssenKrupp System <strong>Engineering</strong>, Kaluga, Russia RUB 4,500 100.00 466<br />
468 ThyssenKrupp Krause Ltd., Redhill/Surrey, Great Britain GBP 0 100.00 647<br />
469 ThyssenKrupp System <strong>Engineering</strong>, Inc., Auburn Hills/Michigan, USA USD 150 100.00 648<br />
454 30.00%<br />
429 10.00%<br />
470 ThyssenKrupp System <strong>Engineering</strong> India Private Limited, Pune, India INR 12,000 100.00 466 99.90%<br />
471 ThyssenKrupp System <strong>Engineering</strong> Ltd., Coventry, Great Britain GBP 130 100.00 647<br />
616 0.10%<br />
472 ThyssenKrupp System <strong>Engineering</strong> Ltda., Diadema-São Paulo, Brazil BRL 110,959 100.00 616 99.75%<br />
473 ThyssenKrupp System <strong>Engineering</strong> S.A., Barcelona, Spain 60 100.00 622<br />
474 ThyssenKrupp System <strong>Engineering</strong>, S.A. de C.V., Santiago de Querétaro, Mexico MXN 4,929 1) 100.00 466<br />
1) fiscal year not 09/30 2) in accordance with IFRS regulations 3) splinter investment as of fourth digits behind decimal point 4) parent company<br />
Capital stock<br />
in €1,000<br />
or domestic<br />
currency<br />
Share<br />
holdings<br />
% Held by No.<br />
556 0.25%
Fully consolidated group companies (as of September 30, 2011)<br />
No. Name and domicile of company<br />
Consolidated financial statements<br />
475 ThyssenKrupp System <strong>Engineering</strong> S.A.S., Ensisheim, France 458 100.00 640<br />
476 ThyssenKrupp System <strong>Engineering</strong> (Shanghai) Co., Ltd., Shanghai, PR China 1,000 1) 100.00 636<br />
477 ThyssenKrupp System <strong>Engineering</strong> Sp. z o.o., Gdansk, Poland PLN 23,646 100.00 466<br />
Transrapid<br />
478 ThyssenKrupp Transrapid GmbH, Kassel DEM 1,500 100.00 616<br />
Sonstige Beteiligungen Plant Technology<br />
479 Uhde Services and Consulting GmbH, Dortmund 26 100.00 616<br />
Components Technology<br />
Presta Camshafts<br />
480 ThyssenKrupp Presta Chemnitz GmbH, Chemnitz 25 100.00 616<br />
212 | 213<br />
481 ThyssenKrupp Presta Ilsenburg GmbH, Ilsenburg 307 100.00 616 94.98%<br />
482 ThyssenKrupp Presta Dalian Co. Ltd., Dalian, PR China 18,500 100.00 636<br />
483 ThyssenKrupp Presta Danville, LLC, Danville/Illinois, USA USD 0 100.00 648<br />
484 ThyssenKrupp Presta TecCenter AG, Eschen, Liechtenstein CHF 10,000 100.00 481<br />
Forging-Group<br />
485 ThyssenKrupp Gerlach GmbH, Homburg/Saar 34,257 100.00 616<br />
486 ThyssenKrupp Birmid, Newton Aycliffe, Great Britain GBP 0 100.00 629<br />
487 ThyssenKrupp Crankshaft Co. LLC, Danville/Illinois, USA USD 1 100.00 648<br />
488 ThyssenKrupp Engine Components (China) Co., Ltd., Nanjing, PR China USD 76,000 100.00 636<br />
593 5.02%<br />
489 ThyssenKrupp Engine Components (India) Private Ltd., Nashik, India INR 300,000 1) 100.00 485 99.90%<br />
490 ThyssenKrupp Mavilor S.A., L'Horme, France 89,965 100.00 640<br />
491 ThyssenKrupp Metalúrgica Campo Limpo Ltda., Campo Limpo Paulista, Brazil BRL 85,000 59.77 646<br />
492 ThyssenKrupp Metalúrgica de México S.A. de C.V., Puebla, Mexico MXN 141,800 1) 100.00 491<br />
493 ThyssenKrupp Metalúrgica Santa Luzia Ltda., Santa Luzia, Brazil BRL 58,198 100.00 491<br />
616 0.10%<br />
494 ThyssenKrupp Metalúrgica Servicios S.A. de C.V., Puebla, Mexico MXN 131 1) 100.00 492 100.00% 3)<br />
Waupaca<br />
493 0.00% 3)<br />
495 ThyssenKrupp Waupaca de Mexico, S. de R.L. de C.V., Mexico, Mexico USD 3 1) 100.00 496 95.00%<br />
496 ThyssenKrupp Waupaca, Inc., Waupaca/Wisconsin, USA USD 0 100.00 632<br />
Rothe Erde<br />
Foreign<br />
currency<br />
497 PSL Wälzlager GmbH, Dietzenbach 26 100.00 506<br />
632 5.00%<br />
498 Rothe Erde GmbH, Dortmund 12,790 100.00 616 80.00%<br />
499 Defontaine Ibérica S.A., Viana, Spain 721 100.00 502<br />
500 Defontaine Italia S.r.l., Sesto San Giovanni, Italy 99 100.00 502<br />
501 Defontaine (Qingdao) Machinery Co., Ltd., Jiaonan City, Shandong Province, PR China 33,500 100.00 636<br />
607 20.00%<br />
502 Defontaine S.A., Saint Herblain, France 4,603 100.00 640 99.99%<br />
503 Defontaine Tunisie S.A., Ben Arous, Tunesia TND 1,500 50.97 502<br />
504 Nippon Roballo Company Ltd., Minato-ku/Tokyo, Japan JPY 740,000 100.00 498<br />
498 0.01%<br />
505 OOO PSL, Moscow, Russia RUB 100 1) 100.00 506 99.00%<br />
506 PSL a.s., Povazská Bystrica, Slovakia 7,769 100.00 498<br />
507 PSL of America Inc., Twinsburg/Ohio, USA USD 1 100.00 506<br />
508 REX (Xuzhou) Slewing Bearing Co., Ltd., Xuzhou, PR China USD 39,500 1) 60.00 636<br />
509 Roballo <strong>Engineering</strong> Company Ltd., Peterlee, Great Britain GBP 1,000 100.00 647<br />
510 Robrasa Rolamentos Especiais Rothe Erde Ltda., Diadema, Brazil BRL 10,119 100.00 616<br />
511 Rotek Incorporated, Aurora/Ohio, USA USD 100 100.00 648<br />
512 Rothe Erde - Metallurgica Rossi S.p.A., Visano, Italy 1,612 100.00 642<br />
513 Rothe Erde Ibérica S.A., Zaragoza, Spain 1,369 100.00 622<br />
1) fiscal year not 09/30 2) in accordance with IFRS regulations 3) splinter investment as of fourth digits behind decimal point 4) parent company<br />
Capital stock<br />
in €1,000<br />
or domestic<br />
currency<br />
Share<br />
holdings<br />
% Held by No.<br />
497 1.00%
3.6 Consolidated financial statements Notes to the consolidated financial statements<br />
Fully consolidated group companies (as of September 30, 2011)<br />
No. Name and domicile of company<br />
514 Rothe Erde India Private Ltd., Maharashtra, India INR 1,190,570 100.00 498 100.00% 3)<br />
515 Xuzhou Rothe Erde Ring Mill Co., Ltd., Xuzhou, PR China USD 27,749 1) 100.00 636<br />
516 Xuzhou Rothe Erde Slewing Bearing Co., Ltd., Xuzhou, PR China USD 27,300 1) 60.00 636<br />
Berco<br />
517 BERCO Deutschland GmbH, Ennepetal 2,387 100.00 616<br />
518 Berco Bulgaria EOOD, Apriltsi, Bulgaria BGN 780 100.00 522<br />
519 Berco of America Inc., Waukesha/Wisconsin, USA USD 50 100.00 648<br />
520 Berco (Shanghai) Undercarriage Technology Co., Ltd., Shanghai, PR China 4,000 100.00 636<br />
521 Berco (Shanghai) Undercarriage Trading Co.,Ltd., Shanghai, PR China 2,000 100.00 636<br />
512 0.00% 3)<br />
522 Berco S.p.A., Copparo, Italy 38,700 100.00 642 99.95%<br />
523 Berco (UK) Ltd., Birmingham, Great Britain GBP 120 100.00 647<br />
593 0.05%<br />
524 Berco Undercarriages (India) Private Ltd., Andrah Pradesh, India INR 450,000 100.00 522 99.00%<br />
525 BercoSul Ltda., Diadema-São Paulo, Brazil BRL 14,062 100.00 522<br />
Presta Steering<br />
526 BMB Steering Innovation GmbH, Schönebeck 512 100.00 528<br />
527 ThyssenKrupp Presta Esslingen GmbH, Esslingen 50 100.00 547<br />
517 1.00%<br />
528 ThyssenKrupp Presta SteerTec GmbH, Düsseldorf 5,114 100.00 616 94.99%<br />
529 ThyssenKrupp Presta SteerTec Mülheim GmbH, Mülheim 26 100.00 528<br />
530 ThyssenKrupp Presta SteerTec Schönebeck GmbH, Schönebeck 26 100.00 528<br />
531 ThyssenKrupp Automotive Sales & Technical Center, Inc., Troy/Michigan, USA USD 3 100.00 648<br />
532 ThyssenKrupp Presta Aktiengesellschaft, Eschen, Liechtenstein CHF 15,000 100.00 616<br />
533 ThyssenKrupp Presta Cold Forging LLC, Wilmington/Delaware, USA USD 5,000 100.00 531<br />
593 5.01%<br />
534 ThyssenKrupp Presta de México S.A. de C.V., Puebla, Mexico MXN 17,316 1) 100.00 537 33.33%<br />
547 33.33%<br />
560 33.33%<br />
535 ThyssenKrupp Presta do Brasil Ltda., Curitiba, Brazil BRL 36,944 100.00 537 89.81%<br />
536 ThyssenKrupp Presta Fawer (Changchun) Co. Ltd., Changchun, PR China CNY 52,834 1) 60.00 537<br />
537 ThyssenKrupp Presta France S.A.S., Florange, France 23,660 100.00 640<br />
538 ThyssenKrupp Presta HuiZhong Shanghai Co., Ltd., Shanghai, PR China CNY 100,562 1) 60.00 537<br />
539 ThyssenKrupp Presta Hungary Kft., Budapest, Hungary HUF 632,770 100.00 527<br />
540 ThyssenKrupp Presta Japan Co., Ltd., Tokyo, Japan JPY 10,000 100.00 616<br />
547 10.19%<br />
541 ThyssenKrupp Presta Servicios de México S.A. de C.V., Puebla, Mexico MXN 50 1) 100.00 547 33.33%<br />
542 ThyssenKrupp Presta Shanghai Co. Ltd., Shanghai, PR China 11,000 1) 100.00 636<br />
543 ThyssenKrupp Presta SteerTec Poland Sp.z o.o., Meseritz, Poland PLN 3,664 100.00 528<br />
544 ThyssenKrupp Presta Terre Haute, LLC, Terre Haute/Indiana, USA USD 4,000 100.00 531<br />
Bilstein-Gruppe<br />
Foreign<br />
currency<br />
545 HF Vermögensverwaltungsgesellschaft im Ruhrtal GmbH, Hagen 2,098 99.95 550<br />
546 Kraemer & Freund Handel GmbH, Hagen 100 100.00 550<br />
547 ThyssenKrupp Automotive Systems GmbH, Essen 2,557 100.00 616<br />
537 33.33%<br />
560 33.33%<br />
548 ThyssenKrupp Bilstein Suspension GmbH, Ennepetal 5,982 99.50 616 94.49%<br />
549 ThyssenKrupp Bilstein Tuning GmbH, Ennepetal 100 100.00 548<br />
593 5.01%<br />
550 ThyssenKrupp Federn GmbH, Hagen 15,595 100.00 548 94.99%<br />
551 ThyssenKrupp Federn und Stabilisatoren GmbH, Hagen 25 100.00 616<br />
552 ThyssenKrupp Automotive Systèmes France S.A.R.L., Hambach, France 152 100.00 640<br />
1) fiscal year not 09/30 2) in accordance with IFRS regulations 3) splinter investment as of fourth digits behind decimal point 4) parent company<br />
Capital stock<br />
in €1,000<br />
or domestic<br />
currency<br />
Share<br />
holdings<br />
% Held by No.<br />
593 5.01%
Fully consolidated group companies (as of September 30, 2011)<br />
No. Name and domicile of company<br />
Consolidated financial statements<br />
214 | 215<br />
553 ThyssenKrupp Automotive Systems de México S.A. de C.V., Puebla, Mexico MXN 50 1) 100.00 547 100.00% 3)<br />
534 0.00% 3)<br />
554 ThyssenKrupp Automotive Systems Industrial do Brasil Ltda., Paraná, Brazil BRL 170,659 100.00 547 93.74%<br />
555 ThyssenKrupp Automotive Systems of America. LLC, Wilmington/Delaware, USA USD 1 100.00 648<br />
491 6.26%<br />
556 0.00% 3)<br />
556 ThyssenKrupp Bilstein Brasil Molas e Componentes de Suspensão Ltda., São Paulo, Brazil BRL 76,090 100.00 550 100.00% 3)<br />
595 0.00% 3)<br />
557 ThyssenKrupp Bilstein Compa S.A., Sibiu, Romania LEU 3,029 73.09 548 72.82%<br />
558 ThyssenKrupp Bilstein Ibérica, S.L.U., Alonsotegui, Spain 8,297 100.00 622<br />
559 ThyssenKrupp Bilstein of America Inc., San Diego/California, USA USD 945 100.00 648<br />
560 ThyssenKrupp Bilstein Sasa S.A. de C.V., San Luis Potosi, Mexico MXN 457,561 1) 100.00 550<br />
561 ThyssenKrupp Bilstein Woodhead Ltd., Leeds, Great Britain GBP 7,610 100.00 629<br />
562 ThyssenKrupp Fawer Liaoyang Spring Co., Ltd., Liaoyang/Liaoning, PR China USD 21,278 1) 60.00 636<br />
563 ThyssenKrupp Sasa Servicios, S.A.de C.V., San Luis Potosi, Mexico MXN 50 1) 100.00 560<br />
Sonstige Beteiligungen Components Technology<br />
564 ThyssenKrupp Technologies Japan Co., Ltd., Tokyo, Japan JPY 10,000 100.00 616<br />
Marine Systems<br />
Naval<br />
565 Blohm + Voss Marine Systems GmbH, Hamburg 25 100.00 592<br />
566 Blohm + Voss Naval GmbH, Hamburg 50 100.00 592<br />
567 Emder Werft und Dockbetriebe GmbH, Emden 3,800 100.00 592<br />
568 HDW/MFI Business Partnership, Kiel 0 95.00 570<br />
569 Hörn-Beteiligungs-GmbH, Kiel 26 100.00 570<br />
570 Howaldtswerke-Deutsche Werft GmbH, Kiel 30,000 100.00 592<br />
571 IKL Ingenieurkontor Lübeck GmbH, Kiel 26 100.00 570<br />
572 Innovative Meerestechnik GmbH, Emden 1,023 100.00 567<br />
573 Schiffahrtskontor "MARITIM" GmbH, Kiel 26 100.00 570<br />
574 SDC Sheltered Docking Center GmbH, Kiel 25 100.00 570<br />
575 Blohm+Voss El Djazair S.a.r.l., Algier, Algeria DZD 10,000 100.00 580<br />
576 Greek Naval Shipyards Holding S.A., Skaramanga, Greece 66,265 100.00 569<br />
577 Kockums AB, Malmö, Sweden SEK 50,000 100.00 570<br />
578 ThyssenKrupp Marin Sistem Gemi Sanayi ve Ticaret A.S., Istanbul, Turkey TRY 200 1) 60.00 592<br />
579 ThyssenKrupp Marine Systems Canada Inc., Ottawa/Ontario , Canada CAD 100 100.00 592<br />
580 ThyssenKrupp Marine Systems International Pte. Ltd., Singapore, Singapore SGD 36,536 100.00 592<br />
Shipyards and Services<br />
581 BIS Blohm + Voss Inspection Service GmbH, Hamburg 26 100.00 584<br />
582 Blohm + Voss Industries GmbH, Hamburg 10,226 100.00 616<br />
583 Blohm + Voss Repair GmbH, Hamburg 2,560 100.00 592<br />
584 Blohm + Voss Shipyards GmbH, Hamburg 8,950 100.00 592<br />
585 SVG Steinwerder Verwaltungsgesellschaft mbH, Hamburg 30 100.00 592<br />
586 Blohm & Voss Industries (China) Ltd., Hongkong, PR China HKD 300 100.00 582<br />
587 Blohm + Voss Industries (Shanghai) Ltd., Shanghai, PR China USD 140 100.00 586<br />
588 Blohm + Voss Industries (Singapore) Pte. Ltd., Singapore, Singapore SGD 250 1) 100.00 582<br />
589 Blohm + Voss (Korea) Ltd., Pusan, South Korea KRW 75,000 75.00 582<br />
590 Blohm+Voss Oil Tools, LLC, Wilmington/Delaware, USA USD 5,000 100.00 648<br />
Sonstige Beteiligungen Marine Systems<br />
Foreign<br />
currency<br />
591 Blohm + Voss Shipyards & Services GmbH, Hamburg 25 100.00 592<br />
592 ThyssenKrupp Marine Systems AG, Hamburg 34,087 100.00 616<br />
1) fiscal year not 09/30 2) in accordance with IFRS regulations 3) splinter investment as of fourth digits behind decimal point 4) parent company<br />
Capital stock<br />
in €1,000<br />
or domestic<br />
currency<br />
Share<br />
holdings<br />
% Held by No.<br />
550 0.18%<br />
466 0.09%
3.6 Consolidated financial statements Notes to the consolidated financial statements<br />
Fully consolidated group companies (as of September 30, 2011)<br />
No. Name and domicile of company<br />
Corporate<br />
Corporate Headquarters<br />
Foreign<br />
currency<br />
593 ThyssenKrupp AG, Duisburg und Essen 1,317,092 4)<br />
594 Banter See Vermögensverwaltung GmbH, Düsseldorf 486 100.00 611<br />
595 Brüninghaus Schmiede GmbH, Grünwald 511 100.00 616<br />
596 Buckau-Walther GmbH, Grünwald 9,216 100.00 616<br />
597 Bucketwheel <strong>Engineering</strong> GmbH, Essen 26 100.00 596<br />
598 CCI Crane Cooperation International Handelsgesellschaft mbH, Essen 1,534 100.00 593<br />
599 GLH GmbH, Essen DEM 30,000 100.00 621<br />
600 Hoesch AG, Düsseldorf 50 100.00 593<br />
601 Konsortium für Kurssicherung GbR, Düsseldorf 39,113 97.76 1 43.80%<br />
602 Krupp Entwicklungszentrum GmbH, Essen 1,534 100.00 652<br />
67 18.99%<br />
593 17.07%<br />
616 11.67%<br />
112 5.57%<br />
260 0.65%<br />
603 Krupp Industrietechnik GmbH, Grünwald 51,129 100.00 607 94.90%<br />
604 Krupp Informatik Gesellschaft mit beschränkter Haftung, Düsseldorf 51 100.00 596<br />
605 MONTAN GmbH Assekuranz-Makler, Düsseldorf 184 53.81 615<br />
606 Reisebüro Dr. Tigges GmbH, Essen 300 76.00 112<br />
593 5.10%<br />
607 Thyssen Stahl GmbH, Düsseldorf 935,147 100.00 593 82.64%<br />
608 ThyssenKrupp Academy GmbH, Düsseldorf 25 100.00 593<br />
609 ThyssenKrupp AdMin GmbH, Düsseldorf 25 100.00 611<br />
610 ThyssenKrupp DeliCate GmbH, Düsseldorf 26 100.00 611<br />
611 ThyssenKrupp Dienstleistungen GmbH, Düsseldorf 15,500 100.00 593<br />
612 ThyssenKrupp Erste Beteiligungsgesellschaft mbH, Düsseldorf 25 100.00 607<br />
613 ThyssenKrupp Management Consulting GmbH, Düsseldorf 25 100.00 611<br />
614 ThyssenKrupp Reinsurance AG, Essen 3,000 100.00 615<br />
615 ThyssenKrupp Risk and Insurance Services GmbH, Essen 3,000 100.00 593<br />
616 ThyssenKrupp Technologies Beteiligungen GmbH, Essen 130,000 100.00 593<br />
617 Vermögensverwaltungsgesellschaft EZM mbH, Grünwald 4,142 100.00 607<br />
618 Vermögensverwaltungsgesellschaft KSH mbH, Grünwald 5,113 100.00 593<br />
619 Vermögensverwaltungsgesellschaft TKW mbH, Grünwald 512 100.00 611<br />
620 Budcan Holdings Inc., Kitchener/Ontario, Canada CAD 0 100.00 635<br />
621 GLH, LLC, Fond du Lac/Wisconsin, USA USD 108,993 100.00 648<br />
622 Grupo ThyssenKrupp S.L., Madrid, Spain 16,156 100.00 593<br />
623 Kitchener Frame Limited, Toronto/Ontario, Canada CAD 0 100.00 350<br />
624 Krupp Camford Pressings Ltd., Llanelli, Great Britain GBP 24,594 100.00 629<br />
625 QDF Components Ltd., County Durham, Great Britain GBP 19,680 100.00 629<br />
626 ThyssenKrupp Austria Beteiligungs GmbH, Vienna, Austria 35 100.00 628<br />
627 ThyssenKrupp Austria GmbH, Vienna, Austria 35 100.00 593<br />
628 ThyssenKrupp Austria GmbH & Co. KG, Vienna, Austria 35 100.00 593<br />
629 ThyssenKrupp Automotive (UK) Ltd., Newton Aycliffe, Great Britain GBP 13,519 100.00 647<br />
630 ThyssenKrupp Body Stampings Ltd., Cannock, Great Britain GBP 132 100.00 629<br />
631 ThyssenKrupp Budd Canada Inc., Kitchener/Ontario, Canada CAD 0 100.00 350<br />
632 ThyssenKrupp Budd Company, Troy/Michigan, USA USD 1 100.00 648<br />
633 ThyssenKrupp Camford <strong>Engineering</strong> PLC, County Durham, Great Britain GBP 5,207 100.00 629<br />
634 ThyssenKrupp Camford Ltd., Newton Aycliff, Great Britain GBP 25 100.00 629<br />
635 ThyssenKrupp Canada, Inc., Calgary/Alberta, Canada CAD 1,000 100.00 593<br />
636 ThyssenKrupp (China) Ltd., Beijing, PR China USD 200,000 100.00 593<br />
1) fiscal year not 09/30 2) in accordance with IFRS regulations 3) splinter investment as of fourth digits behind decimal point 4) parent company<br />
Capital stock<br />
in €1,000<br />
or domestic<br />
currency<br />
Share<br />
holdings<br />
% Held by No.<br />
652 17.36%
Fully consolidated group companies (as of September 30, 2011)<br />
No. Name and domicile of company<br />
Consolidated financial statements<br />
637 ThyssenKrupp Finance Canada, Inc., Calgary/Alberta, Canada CAD 1 100.00 593<br />
638 ThyssenKrupp Finance Nederland B.V., Krimpen aan den Ijssel, Netherlands 2,300 100.00 593<br />
639 ThyssenKrupp Finance USA, Inc., Wilmington/Delaware, USA USD 1 100.00 648<br />
640 ThyssenKrupp France S.A.S., Rueil-Malmaison, France 116,149 100.00 593<br />
641 ThyssenKrupp Intermediate U.K. Ltd., County Durham, Great Britain GBP 28,145 100.00 647<br />
642 ThyssenKrupp Italia Holding S.r.l., Terni, Italy 10 100.00 593<br />
643 ThyssenKrupp Knowsley Ltd., Dundee, Great Britain GBP 25,610 100.00 616<br />
644 ThyssenKrupp Nederland Holding B.V., Roermond, Netherlands 10,100 100.00 593<br />
645 ThyssenKrupp Nederland Intermediate B.V., Roermond, Netherlands 10,000 100.00 644<br />
646 ThyssenKrupp Participations B.V., Veghel, Netherlands 100 100.00 593<br />
216 | 217<br />
647 ThyssenKrupp UK Plc., County Durham, Great Britain GBP 76,145 100.00 593 100.00% 3)<br />
648 ThyssenKrupp USA, Inc., Troy/Michigan, USA USD 247,989 100.00 593<br />
Business Services<br />
649 ThyssenKrupp Business Services GmbH, Essen 25 100.00 593<br />
IT Services<br />
650 ThyssenKrupp IT Services GmbH, Essen 25 100.00 616<br />
Real Estate<br />
Foreign<br />
currency<br />
651 Hellweg Liegenschaften GmbH, Bochum 50 94.00 652<br />
607 0.00% 3)<br />
652 Krupp Hoesch Stahl GmbH, Dortmund 181,510 100.00 644 94.90%<br />
593 5.10%<br />
653 Stahlhauser Liegenschaften Verwaltungsgesellschaft mbH, Essen 25 94.00 663 88.00%<br />
593 6.00%<br />
654 Thyssen Liegenschaften Verwaltungs- und Verwertungs GmbH & Co. KG Industrie, Essen 692 100.00 616 94.90%<br />
663 5.10%<br />
655 Thyssen Liegenschaften Verwaltungs- und Verwertungs GmbH & Co. KG Stahl, Essen 511 100.00 607 94.90%<br />
656 ThyssenKrupp Grundbesitz Verwaltungs GmbH, Essen 25 100.00 593<br />
657 ThyssenKrupp Grundbesitz-Vermietungs GmbH & Co. KG, Essen 1,000 100.00 593<br />
658 ThyssenKrupp Immobilien Verwaltungs GmbH & Co. KG Krupp Hoesch Stahl, Essen 1,000 100.00 652<br />
659 ThyssenKrupp Immobilien Verwaltungs GmbH & Co. KG Stahl, Essen 1,000 100.00 655<br />
663 5.10%<br />
660 ThyssenKrupp Immobilienentwicklungs Concordiahütte GmbH, Oberhausen 25 100.00 616 94.80%<br />
661 ThyssenKrupp Immobilienentwicklungs Krefeld GmbH, Oberhausen 25 100.00 607<br />
593 5.20%<br />
662 ThyssenKrupp Liegenschaften Umformtechnik Verwaltungs GmbH, Essen 25 100.00 616 94.80%<br />
663 ThyssenKrupp Real Estate GmbH, Essen 15,441 100.00 593<br />
593 5.20%<br />
664 ThyssenKrupp Stahl Immobilien GmbH, Duisburg 50 100.00 663 94.90%<br />
665 Rhenus Immobilien Gesellschaft m.b.H., Vienna, Austria 70 100.00 626<br />
666 ThyssenKrupp Real Estate France S.A.S., Rueil-Malmaison, France 8,537 100.00 640<br />
1) fiscal year not 09/30 2) in accordance with IFRS regulations 3) splinter investment as of fourth digits behind decimal point 4) parent company<br />
Capital stock<br />
in €1,000<br />
or domestic<br />
currency<br />
Share<br />
holdings<br />
% Held by No.<br />
593 5.10%
3.6 Consolidated financial statements Notes to the consolidated financial statements<br />
Non consolidated companies (as of September 30, 2011)<br />
No. Name and domicile of company<br />
Steel Americas<br />
CSA<br />
667 CTA Termoelétrica do Atlântico Ltda., Rio de Janeiro, Brazil BRL 10 99.00 61<br />
Stainless Global<br />
ThyssenKrupp VDM<br />
668 VDM-Unterstützungskasse GmbH, Werdohl 26 100.00 86<br />
669 ThyssenKrupp VDM High Performance Metals Trading Co., Ltd., Shanghai, PR China USD 300 100.00 636<br />
Materials Services<br />
MetalsServices<br />
670 OST-PLUS s.r.o., Teplice, Czech Republic CZK 1,000 1) 90.00 116<br />
671 ThyssenKrupp HiServ s.r.o., Kosice, Slovakia 7 1) 100.00 112<br />
SpecialServices<br />
672 DvB Aufbereitungs-GmbH zur Behandlung von Metallprodukten, Duisburg 102 1) 100.00 197<br />
IndustrialServices<br />
673 ThyssenKrupp Xervon Dubai (L.L.C.), Dubai, United Arab Emirates AED 300 100.00 253<br />
Elevator Technology<br />
Southern Europe/Africa/Middle East (SEAME)<br />
674 ThyssenKrupp Elevator (Management) Ltd., Rishon Le'zion, Israel ILS 0 100.00 261 50.00%<br />
Plant Technology<br />
Uhde<br />
675 Edeleanu SDN. BHD., Kuala Lumpur, Malaysia MYR 1,000 100.00 408<br />
676 Uhde do Brasil Ltda., São Paulo, Brazil BRL 798 100.00 408<br />
677 Uhde Edeleanu s.r.o., Brno, Czech Republic CZK 1,000 1) 100.00 408<br />
678 Uhde Inventa-Fischer Chemical Fiber Equipment (Shanghai) Ltd., Shanghai, PR China USD 200 1) 100.00 636<br />
Polysius<br />
679 Polysius-Hilfe GmbH, Münster DEM 50 100.00 429<br />
680 Maerz Ofenbau SRL, Timisoara, Romania RON 204 1) 100.00 432<br />
System <strong>Engineering</strong><br />
329 50.00%<br />
681 ThyssenKrupp System <strong>Engineering</strong> S.r.l., Turin, Italy 120 100.00 642 98.00%<br />
Components Technology<br />
Rothe Erde<br />
682 Roballo France S.A.R.L., Rueil-Malmaison, France 180 100.00 640<br />
Sonstige Beteiligungen Components Technology<br />
466 2.00%<br />
683 ThyssenKrupp Automotive Italia S.r.l., Turin, Italy 99 100.00 616 99.00%<br />
Marine Systems<br />
Naval<br />
684 Maritime Services Consultant Enterprise Sdn.Bhd., Petaling Jaya, Malaysia MYR 300 100.00 584<br />
685 ThyssenKrupp Marine Systems Australia Pty Ltd, Canberra/Australian Capital Territory, Australia AUD 2,851 100.00 566<br />
686 United Stirling, Malmö, Sweden SEK 100 100.00 577<br />
Sonstige Beteiligungen Marine Systems<br />
Foreign<br />
currency<br />
532 1.00%<br />
687 ThyssenKrupp Technologies HELLAS Marketing Services S.A., Athen, Greece 60 100.00 616 99.98%<br />
1) fiscal year not 09/30 2) in accordance with IFRS regulations 3) splinter investment as of fourth digits behind decimal point 4) parent company<br />
Capital stock<br />
in €1,000<br />
or domestic<br />
currency<br />
Share<br />
holdings<br />
% Held by No.
Equity-stated companies (*=Joint Venture / as of September 30, 2011)<br />
No. Name and domicile of company<br />
Steel Europe<br />
ThyssenKrupp Steel Europe<br />
Consolidated financial statements<br />
688 Hüttenwerke Krupp Mannesmann GmbH, Duisburg* 103,000 1) 50.00 1<br />
689 ANSC-TKS Galvanizing Co., Ltd., Dalian, Liaoning Province, PR China* CNY 1,065,806 1) 50.00 1<br />
Processing<br />
690 Kreislaufsystem Blechverpackungen Stahl GmbH (KBS), Düsseldorf 385 1) 40.00 10<br />
691 SUNSCAPE ISOCAB NEW BUILDING MATERIALS LIMITED, Rizhao City, PR China USD 11,960 1) 27.50 20<br />
692 TKAS (Changchun) Steel Service Center Ltd., Changchun, PR China* USD 12,000 1) 50.00 636<br />
Other Companies Steel Europe<br />
693 Walzen-Service-Center GmbH, Oberhausen* 1,023 50.00 1<br />
694 Acciai di Qualità, Centro Lavorazione Lamiere S.p.A., Geonova, Italy 1,731 1) 24.90 642<br />
695 RKE N.V., Antwerpen, Belgium 645 1) 38.54 1<br />
696 Transport- en Handelmaatschappij `Steenkolen Utrecht` B.V., Rotterdam, Netherlands* 8,204 1) 50.00 59<br />
Stainless Global<br />
ThyssenKrupp Acciai Speciali Terni (I)<br />
697 Euroacciai S.r.l., Sarezzo (BS), Italy 1,500 1) 30.23 77<br />
698 Ilserv S.r.l., Terni, Italy 1,924 1) 35.00 77<br />
699 Terni Frantumati S.p.A., Terni, Italy 930 1) 21.00 77<br />
ThyssenKrupp Mexinox (MX)<br />
700 Fischer Mexicana S.A. de C.V., San Luis Potosi, Mexico* MXN 108,544 1) 50.00 82<br />
Materials Services<br />
MetalsServices<br />
701 Aceros de America Inc., San Juan, Puerto Rico* USD 1,000 50.00 123<br />
702 Ferona Thyssen Plastics, s.r.o., Velká Bystrîce, Olomouc, Czech Republic* CZK 16,000 1) 50.00 112<br />
703 Leong Jin Corporation Pte. Ltd., Singapore, Singapore SGD 20,000 1) 30.00 112<br />
704 Polarputki Oy, Helsinki, Finland* 1,009 1) 50.00 112<br />
705 Thyssen Ros Casares S.A., Valencia, Spain* 5,000 50.00 132<br />
SpecialServices<br />
706 Brouwer Shipping & Chartering GmbH, Hamburg 100 1) 30.00 196<br />
707 TGHM GmbH & Co. KG, Dortmund* 511 1) 50.00 593<br />
708 BCCW (Tangshan) Jiahua Coking & Chemical Co., Ltd., Tangshan, PR China CNY 1,130,000 1) 25.00 196<br />
709 MRT Track & Services Co., Inc., Bloomfield/New Jersey, USA* USD 100 50.00 193<br />
Elevator Technology<br />
Americas (AMS)<br />
710 Braun ThyssenKrupp Elevator LLC, Madison/Wisconsin, USA* USD 1,000 1) 50.00 352<br />
Asia/Pacific (AP)<br />
711 Suzhou Marohn Elevator Co., Ltd., Changshu City, Jiangsu Province, PR China* CNY 100,000 1) 25.00 636<br />
Plant Technology<br />
Uhde<br />
712 KEPCO-Uhde Inc., Seoul, South Korea* KRW 17,205,000 34.00 408<br />
713 Uhdenora S.p.A., Milan, Italy* 3,600 50.00 408<br />
Polysius<br />
714 Vecoplan FuelTrack GmbH, Bad Marienberg* 50 51.00 429<br />
System <strong>Engineering</strong><br />
Foreign<br />
currency<br />
715 HFS Hotforming Solutions GmbH, Schwalbach* 200 50.00 466<br />
1) fiscal year not 09/30 2) in accordance with IFRS regulations 3) splinter investment as of fourth digits behind decimal point 4) parent company<br />
Capital stock<br />
in €1,000<br />
or domestic<br />
currency<br />
218 | 219<br />
Share<br />
holdings<br />
% Held by No.
3.6 Consolidated financial statements Notes to the consolidated financial statements<br />
Equity-stated companies (*=Joint Venture / as of September 30, 2011)<br />
No. Name and domicile of company<br />
Components Technology<br />
Forging-Group<br />
716 Huizhou Sumikin Forging Company Ltd., Huizhou, PR China USD 29,680 1) 34.00 636<br />
Marine Systems<br />
Naval<br />
717 Atlas Elektronik GmbH, Bremen* 31,240 1) 51.00 616<br />
718 MARLOG Marine Logistik GmbH & Co. KG, Kiel* 1,500 1) 50.00 570<br />
719 MarineForce International LLP, London, Great Britain* GBP 693 1) 50.00 570<br />
Corporate<br />
Real Estate<br />
Foreign<br />
currency<br />
720 COMUNITHY Immobilien GmbH, Düsseldorf 100 1) 49.00 663<br />
1) fiscal year not 09/30 2) in accordance with IFRS regulations 3) splinter investment as of fourth digits behind decimal point 4) parent company<br />
Capital stock<br />
in €1,000<br />
or domestic<br />
currency<br />
Share<br />
holdings<br />
% Held by No.
Other associated affiliates (*=Joint Venture / as of September 30, 2011)<br />
No. Name and domicile of company<br />
Steel Europe<br />
ThyssenKrupp Steel Europe<br />
Consolidated financial statements<br />
721 JEVISE Corporation, Tokyo, Japan* JPY 10,000 1) 50.00 1<br />
Stainless Global<br />
ThyssenKrupp VDM<br />
722 MOL Katalysatortechnik GmbH, Merseburg 77 1) 20.46 86<br />
Materials Services<br />
MetalsServices<br />
723 Indo German International Private Ltd., New Delhi, India INR 38,975 1) 50.00 127<br />
724 Sidecontrol S.L., Gandia, Spain 36 1) 50.00 139<br />
SpecialServices<br />
725 SIB Schell Industrieanlagen-Bau GmbH, Duisburg 102 50.00 197<br />
726 Solid Slab Track GmbH, Görschen 100 49.00 193<br />
727 TGHM Verwaltungsgesellschaft mbH, Dortmund DEM 50 1) 50.00 593<br />
Plant Technology<br />
Uhde<br />
728 Shedden (Malaysia) Sdn. Bhd., Petaling Jaya, Malaysia MYR 2,285 1) 40.00 427<br />
Transrapid<br />
729 Transrapid International Verwaltungsgesellschaft mbH, i. L., Berlin 80 50.00 478<br />
Components Technology<br />
Bilstein-Gruppe<br />
730 ABC Sistemas e Módulos Ltda., São Paulo, Brazil BRL 600 33.33 554<br />
Marine Systems<br />
Naval<br />
731 Marlog Verwaltungsgesellschaft mbH, Kiel 25 1) 50.00 570<br />
732 MS "MARITIM FRANKFURT" Schiffahrtskontor "MARITIM" GmbH & Co. KG, Kiel 1,218 1) 42.09 570<br />
733 MS "MARITIM KIEL" Schiffahrtskontor "MARITIM" GmbH & Co. KG, Kiel 1,335 1) 33.33 570<br />
220 | 221<br />
734 MTG Marinetechnik GmbH, Hamburg 3,068 1) 48.98 566 19.98<br />
Shipyards and Services<br />
735 Bollfilter Japan Ltd., Kobe, Japan JPY 10,000 25.00 582<br />
736 Simplex Turbulo Company Ltd., Wherwell, Great Britain GBP 6 25.10 582<br />
Sonstige Beteiligungen Marine Systems<br />
737 LISNAVE-ESTALEIROS NAVAIS S.A., Lissabon, Portugal 5,000 1) 20.00 592<br />
Corporate<br />
Corporate Headquarters<br />
738 Grundstücksgesellschaft Schlossplatz 1 mbH & Co.KG, Berlin 21,250 1) 20.00 593<br />
Real Estate<br />
Foreign<br />
currency<br />
739 Gewerkschaft Hermann V GmbH, Essen 26 33.33 652<br />
740 NORA Grundstücks-Vermietungsgesellschaft mbH & Co. Objekt Gelsenkirchen KG, Düsseldorf 10 1) 94.76 654<br />
1) fiscal year not 09/30 2) in accordance with IFRS regulations 3) splinter investment as of fourth digits behind decimal point 4) parent company<br />
Capital stock<br />
in €1,000<br />
or domestic<br />
currency<br />
Share<br />
holdings<br />
% Held by No.<br />
570 19.00%<br />
717 10.00%
3.6 Consolidated financial statements Notes to the consolidated financial statements<br />
Other shareholdings (as of September 30, 2011)<br />
No. Name and domicile of company<br />
Corporate<br />
Real Estate<br />
Foreign<br />
currency<br />
741 VBW Bauen und Wohnen GmbH, Bochum 12,858 13.06 652<br />
Equity 74,789<br />
Result 6,255<br />
1) fiscal year not 09/30 2) in accordance with IFRS regulations 3) splinter investment as of fourth digits behind decimal point 4) parent company<br />
Capital stock<br />
in €1,000<br />
or domestic<br />
currency<br />
Share<br />
holdings<br />
% Held by No.
Auditors’ Auditor’ report Report<br />
Auditors’ Report<br />
We have audited the consolidated financial statements prepared by the<br />
ThyssenKrupp AG, Duisburg and Essen, comprising the consolidated<br />
statement of financial position, the consolidated statement of income,<br />
the consolidated statement of comprehensive income, the consolidated<br />
statement of changes in equity, the consolidated statement of cash<br />
flows and the notes to the consolidated financial statements, together<br />
with the group management report for the business year from October<br />
1, 2010 to September 30, 2011. The preparation of the consolidated<br />
financial statements and the group management report in accordance<br />
with IFRSs, as adopted by the EU, and the additional requirements of<br />
German commercial law pursuant to § 315a Abs. 1 HGB (Handelsgesetzbuch<br />
“German Commercial Code”) are the responsibility of the<br />
parent company’s management. Our responsibility is to express an<br />
opinion on the consolidated financial statements and on the group<br />
management report based on our audit.<br />
We conducted our audit of the consolidated financial statements in<br />
accordance with § 317 HGB and German generally accepted standards<br />
for the audit of financial statements promulgated by the Institute of<br />
Public Auditors in Germany (Institut der Wirtschaftsprüfer - IDW) and in<br />
accordance with International Standards on Auditing (ISA). Those<br />
standards require that we plan and perform the audit such that misstatements<br />
materially affecting the presentation of the net assets,<br />
financial position and results of operations in the consolidated financial<br />
statements in accordance with the applicable financial reporting<br />
framework and in the group management report are detected with<br />
reasonable assurance. Knowledge of the business activities and the<br />
economic and legal environment of the Group and expectations as to<br />
possible misstatements are taken into account in the determination of<br />
audit procedures. The effectiveness of the accounting-related internal<br />
control system and the evidence supporting the disclosures in the<br />
consolidated financial statements and the group management report<br />
are examined primarily on a test basis within the framework of the<br />
audit. The audit includes assessing the annual financial statements of<br />
222 | 223<br />
those entities included in consolidation, the determination of entities to<br />
be included in consolidation, the accounting and consolidation principles<br />
used and significant estimates made by management, as well as<br />
evaluating the overall presentation of the consolidated financial statements<br />
and group management report. We believe that our audit provides<br />
a reasonable basis for our opinion.<br />
Our audit has not led to any reservations.<br />
In our opinion, based on the findings of our audit, the consolidated<br />
financial statements comply with IFRSs, as adopted by the EU, the<br />
additional requirements of German commercial law pursuant to § 315a<br />
Abs. 1 HGB and give a true and fair view of the net assets, financial<br />
position and results of operations of the Group in accordance with<br />
these requirements. The group management report is consistent with<br />
the consolidated financial statements and as a whole provides a suitable<br />
view of the Group’s position and suitably presents the opportunities<br />
and risks of future development.<br />
Düsseldorf, November 29, 2011<br />
KPMG AG<br />
Wirtschaftsprüfungsgesellschaft<br />
Klaus Becker Michael Gewehr<br />
Wirtschaftsprüfer Wirtschaftsprüfer<br />
(German public auditor) (German public auditor)
Reponsibility Responsibility statement statement<br />
Responsibility statement<br />
To the best of our knowledge, and in accordance with the applicable<br />
reporting principles, the consolidated financial statements give a true<br />
and fair view of the assets, liabilities, financial position and profit and<br />
loss of the Group, and the Group management report includes a fair<br />
review of the development and performance of the business and the<br />
position of the Group, together with a description of the principal opportunities<br />
and risks associated with the expected development of the<br />
Group.<br />
Essen, November 29, 2011<br />
ThyssenKrupp AG<br />
The Executive Board<br />
Hiesinger<br />
Berlien Claassen Eichler Kerkhoff Labonte<br />
224
Additional<br />
information<br />
How have ThyssenKrupp’s key fi gures developed over the past few<br />
Additional information<br />
years, when are the next important fi nancial dates, what other director-<br />
ships are held by members of the Executive Board and Supervisory<br />
Board? All this information is provided on the following pages. There<br />
are also aids to help you fi nd your way around this report.<br />
Additional information<br />
4.1 Multi-year overview 229 – 230<br />
4.2 Other directorships held by<br />
Executive Board members 231<br />
4.3 Other directorships held by<br />
Supervisory Board members 232 – 233<br />
4.4 Glossary 234<br />
4.5 Index 235 – 236<br />
4.6 List of abbreviations 237<br />
4.7 Index of tables and graphics 238<br />
4.8 Contact and 2012/2013 dates 239
Chemicals<br />
Minerals & Mining<br />
The challenge<br />
of production<br />
Plant
Making things more effi ciently<br />
The challenge of production: With resources limited,<br />
rising demand for consumer and capital goods can<br />
only be met with innovative production processes.<br />
Worldwide cement<br />
production (in million tons)<br />
133<br />
702<br />
1,660<br />
3,300<br />
1950 1975 2000 2010
More consumption<br />
More products for more<br />
people<br />
More information on this subject can be<br />
found in the ThyssenKrupp Yearbook on<br />
pages 58 – 73.<br />
<strong>Engineering</strong><br />
Better production<br />
Saving energy and<br />
resources
4.1 Additional information Multi-year overview<br />
ThyssenKrupp Group<br />
Results of operations<br />
Year<br />
ended<br />
Sept. 30,<br />
2007<br />
Year<br />
ended<br />
Sept. 30,<br />
2008<br />
Year<br />
ended<br />
Sept. 30,<br />
2009<br />
Group Total Continuing Operations<br />
Year<br />
ended<br />
Sept. 30,<br />
2010<br />
Year<br />
ended<br />
Sept. 30,<br />
2011 Change<br />
Year ended Sept. 30,<br />
2011 vs.<br />
Year ended Sept. 30,<br />
2010<br />
Change in<br />
%<br />
Year<br />
ended<br />
Sept. 30,<br />
2010<br />
Year<br />
ended<br />
Sept. 30,<br />
2011 Change<br />
Additional information<br />
228 | 229<br />
Year ended Sept. 30,<br />
2011 vs.<br />
Year ended Sept. 30,<br />
2010<br />
Net sales million € 51,723 53,426 40,563 42,621 49,092 6,471 15 37,711 43,356 5,645 15<br />
Gross profit million € 9,432 9,156 3,658 6,362 5,109 (1,253) (20)<br />
EBITDA 1) million € 5,254 4,976 192 2,769 3,385 616 22 2,660 3,210 550 21<br />
EBIT 1) million € 3,728 3,572 (1,663) 1,346 (988) (2,334) – – 1,398 (188) (1,586) – –<br />
EBT million € 3,330 3,128 (2,364) 1,135 (1,578) (2,713) – – 1,206 (751) (1,957) – –<br />
Change in<br />
%<br />
Net income/(loss) million € 2,190 2,276 (1,873) 927 (1,783) (2,710) – –<br />
Earnings<br />
per share (EPS) € 4.30 4.59 (4.01) 1.77 (2.71) (4.48) – – 0.0 0.00 0.00 0<br />
Gross margin % 18.2 17.1 9.0 14.9 10.4 (4.5) —<br />
EBITDA margin % 10.2 9.3 0.5 6.5 6.9 0.4 — 7.1 7.4 0.3 —<br />
EBIT margin % 7.2 6.7 (4.1) 3.2 (2.0) (5.2) — 3.7 (0.4) (4.1) —<br />
EBT margin % 6.4 5.9 (5.8) 2.7 (3.2) (5.9) — 3.2 (1.7) (4.9) —<br />
Return on equity<br />
(before taxes) % 31.9 27.2 (24.4) 10.9 (15.2) (26.1) —<br />
Personnel expense<br />
per employee € 48,988 49,212 50,120 49,605 53,582 3,977 8<br />
Sales per employee € 275,146 272,824 210,587 241,017 291,818 50,801 21<br />
Assets/liabilities<br />
situation<br />
Non-current assets million € 15,385 18,308 20,725 22,953 21,548 (1,405) (6)<br />
Current assets million € 22,689 23,334 20,642 20,759 22,055 1,296 6<br />
Total assets million € 38,074 41,642 41,367 43,712 43,603 (109) 0<br />
Total equity million € 10,447 11,489 9,696 10,388 10,382 (6) 0<br />
Liabilities million € 27,627 30,153 31,671 33,324 33,221 (103) —<br />
Accrued pension<br />
and similar obligations million € 7,139 6,550 7,537 8,211 7,297 (914) (11)<br />
Financial debt<br />
non-current million € 2,813 3,068 7,160 6,163 6,555 392 6<br />
Financial debt<br />
current million € 825 1,348 444 1,298 596 (702) (54)<br />
Financial debt<br />
non-current/current million € 3,638 4,416 7,604 7,461 7,151 (310) (4)<br />
Trade accounts payable million € 4,960 5,731 4,185 5,471 6,259 788 14<br />
Equity ratio % 27.4 27.6 23.4 23.8 23.8 — —<br />
Gearing % (2.1) 13.8 21.2 36.4 34.5 (1.9) —<br />
Inventory turnover days 61.7 64.0 60.0 70.3 73.7 3.4 5<br />
Average<br />
collection period days 52.7 53.1 46.8 49.7 43.8 (5.9) (12)<br />
1) Prior-year figures have been adjusted.<br />
2) Cash flows for investments before cash and cash equivalents acquired from acquisitions of consolidated companies<br />
3) Proposal to the Annual General Meeting
4.1 Additional information Multi-year overview<br />
4.1 Additional information Multi-year overview<br />
ThyssenKrupp Group<br />
Year<br />
ended<br />
Sept. 30,<br />
2007<br />
Year<br />
ended<br />
Sept. 30,<br />
2008<br />
Year<br />
ended<br />
Sept. 30,<br />
2009<br />
Group Total Continuing Operations<br />
Year<br />
ended<br />
Sept. 30,<br />
2010<br />
Year<br />
ended<br />
Sept. 30,<br />
2011 Change<br />
Year ended Sept. 30,<br />
2011 vs.<br />
Year ended Sept. 30,<br />
2010<br />
Change in<br />
%<br />
Value management<br />
Capital employed<br />
(average) million € 18,000 19,478 20,662 20,767 23,223 2,456 12<br />
ROCE % 20.7 18.3 (8.1) 6.5 (4.3) (10.8) —<br />
Weighted average<br />
cost of capital (WACC) % 9.0 8.5 8.5 8.5 8.5 — —<br />
Cash<br />
flows/investments<br />
Year<br />
ended<br />
Sept. 30,<br />
2010<br />
Year<br />
ended<br />
Sept. 30,<br />
2011 Change<br />
Year ended Sept. 30,<br />
2011 vs.<br />
Year ended Sept. 30,<br />
2010<br />
230<br />
Change in<br />
%<br />
Operating cash flows million € 2,220 3,679 3,699 868 776 (92) (11) 1,031 1,012 (19) (2)<br />
Cash flows from<br />
disposals million € 673 329 199 553 424 (129) (23) 547 423 (124) (23)<br />
Cash flows<br />
for investments 1) million € (2,997) (4,227) (4,077) (3,512) (2,771) 741 21 (3,168) (2,505) 663 21<br />
Free cash flow 1) million € (104) (219) (179) (2,091) (1,571) 520 25 (1,590) (1,070) 520 33<br />
Cash flows from<br />
financing activities 1) million € (670) (705) 2,824 256 1,527 1,271 496 (245) 989 1,234 504<br />
Investments 1) 2) million € 3,001 4,282 4,079 3,515 2,771 (744) (21) 3,168 2,505 (663) (21)<br />
Cash and<br />
cash equivalents million € 3,861 2,832 5,545 3,681 3,568 (113) (3)<br />
Net financial<br />
debt/(assets) million € (223) 1,584 2,059 3,780 3,578 (202) (5)<br />
Internal financing<br />
capability 1.0 0.9 1.0 0.3 0.3 — —<br />
Debt to<br />
cash flow ratio — 0.4 0.6 4.4 4.6 0.2 5<br />
ThyssenKrupp AG<br />
Net income/(loss) million € 309 1,175 (882) 800 494 (306) (38)<br />
Dividend payout million € 635 603 139 209 232 3) 23 11<br />
Dividend per share € 1.30 1.30 0.30 0.45 0.45 3) — —<br />
1) Prior-year figures have been adjusted.<br />
2) Cash flows for investments before cash and cash equivalents acquired from acquisitions of consolidated companies.<br />
3) Proposal to the Annual General Meeting
4.2 Additional information Other directorships held held by by Executive Board Board members members<br />
Other directorships held<br />
by Executive Board members<br />
Dr.-Ing. Heinrich Hiesinger<br />
Chairman<br />
Within the Group:<br />
• ThyssenKrupp Elevator AG (Chair)<br />
• ThyssenKrupp Steel Europe AG<br />
(Chair)<br />
Dr. Olaf Berlien<br />
Within the Group:<br />
• ThyssenKrupp Marine Systems AG<br />
(Chair)<br />
- ThyssenKrupp (China) Ltd./PR China<br />
(Chairman)<br />
- ThyssenKrupp Elevator Americas<br />
Corp. (Chairman)<br />
Dr. Jürgen Claassen<br />
Within the Group:<br />
• ThyssenKrupp Gerlach GmbH<br />
• ThyssenKrupp Materials International<br />
GmbH<br />
• ThyssenKrupp Nirosta GmbH<br />
• ThyssenKrupp Steel Europe AG<br />
- ThyssenKrupp (China) Ltd./PR China<br />
Edwin Eichler<br />
• Heidelberger Druckmaschinen AG *<br />
• Hüttenwerke Krupp Mannesmann<br />
GmbH (Vice Chair)<br />
• SGL Carbon SE *<br />
- ANSC-TKS Galvanizing Co., Ltd./<br />
PR China (Chairman)<br />
Within the Group:<br />
• ThyssenKrupp Materials International<br />
GmbH (Chair)<br />
• ThyssenKrupp Nirosta GmbH (Chair)<br />
- ThyssenKrupp Steel Americas,<br />
LLC/USA (Chairman)<br />
Guido Kerkhoff<br />
Within the Group:<br />
• ThyssenKrupp Elevator AG<br />
• ThyssenKrupp Nirosta GmbH<br />
• ThyssenKrupp Reinsurance AG<br />
(Chair)<br />
Ralph Labonte<br />
- PEAG Holding GmbH (Chair)<br />
Within the Group:<br />
• Rothe Erde GmbH<br />
• ThyssenKrupp Bilstein Suspension<br />
GmbH<br />
• ThyssenKrupp Elevator AG<br />
• ThyssenKrupp Marine Systems AG<br />
• ThyssenKrupp Materials International<br />
GmbH<br />
• ThyssenKrupp Polysius AG<br />
(Vice Chair)<br />
• ThyssenKrupp Steel Europe AG<br />
• ThyssenKrupp Uhde GmbH<br />
(Vice Chair)<br />
- ThyssenKrupp System <strong>Engineering</strong><br />
GmbH<br />
Additional information<br />
230 | 231<br />
At the close of the Annual General<br />
Meeting on January 21, 2011,<br />
Prof. Dr.-Ing. Ekkehard D. Schulz<br />
resigned from the Executive Board and<br />
joined the Supervisory Board. He held the<br />
following directorships at the time of<br />
departure:<br />
• AXA Konzern AG<br />
• Bayer AG *<br />
• MAN SE (Vice Chair) *<br />
• RWE AG *<br />
Within the Group:<br />
• ThyssenKrupp Elevator AG (Chair)<br />
• ThyssenKrupp Steel Europe AG<br />
(Chair)<br />
At the close of March 31, 2011<br />
Dr. Alan Hippe resigned from the<br />
Executive Board. He held the following<br />
directorships at the time of departure:<br />
• ERGO Versicherungsgruppe AG<br />
• Voith AG<br />
Within the Group:<br />
• ThyssenKrupp Elevator AG<br />
• ThyssenKrupp Nirosta GmbH<br />
• ThyssenKrupp Reinsurance AG<br />
(Chair)<br />
• Membership of supervisory boards within the meaning of Art. 125 of the German Stock Corporation Act (AktG) (as of September 30, 2011)<br />
* Exchange-listed or comparable company<br />
- Membership of comparable German and non-German control bodies of business enterprises within the meaning of Art. 125 of the German Stock Corporation Act (AktG) (as of September 30, 2011)
4.3 Additional information Other directorships held held by by Supervisory Board Board members members<br />
Other directorships held<br />
by Supervisory Board members<br />
Prof. Dr. h.c. mult. Berthold Beitz, Essen<br />
Honorary Chairman,<br />
Chairman of the Board of Trustees of the<br />
Alfried Krupp von Bohlen und Halbach<br />
Foundation<br />
——<br />
Prof. Dr. Günter Vogelsang, Düsseldorf<br />
Honorary Chairman<br />
——<br />
Dr. Gerhard Cromme, Essen<br />
Chairman,<br />
Former Chairman of the Executive Board of<br />
ThyssenKrupp AG<br />
• Allianz SE<br />
• Axel Springer AG<br />
• Siemens AG (Chair)<br />
- Compagnie de Saint-Gobain/France<br />
Bertin Eichler, Frankfurt/Main<br />
Vice Chairman,<br />
Member of the Executive Committee of the<br />
German Metalworkers’ Union (IG Metall)<br />
• BGAG Beteiligungsgesellschaft der<br />
Gewerkschaften GmbH (Chair)<br />
• BMW AG<br />
Markus Grolms, Bochum<br />
Trade union secretary at the Düsseldorf<br />
branch office of IG Metall<br />
——<br />
Susanne Herberger, Dresden<br />
Engineer (FH) – information technology,<br />
Chairwoman of the General Works Council of<br />
ThyssenKrupp Aufzüge GmbH,<br />
Chairwoman of the Works Council Union<br />
ThyssenKrupp Elevator Technology<br />
Within the Group:<br />
• ThyssenKrupp Elevator AG<br />
Bernd Kalwa, Krefeld<br />
Lathe operator,<br />
Chairman of the General Works Council of<br />
ThyssenKrupp Nirosta GmbH,<br />
Chairman of the Works Council Union<br />
ThyssenKrupp Stainless Global<br />
Within the Group:<br />
• ThyssenKrupp Nirosta GmbH<br />
Prof. Dr. Hans-Peter Keitel, Essen<br />
President of the Federation of German<br />
Industries (Bundesverband der Deutschen<br />
Industrie e.V.)<br />
• Commerzbank AG<br />
• National-Bank AG<br />
- RAG Foundation (Member of the Board of<br />
Trustees)<br />
Ernst-August Kiel, Blumenthal<br />
Fitter,<br />
Chairman of the Works Council of<br />
Howaldtswerke-Deutsche Werft GmbH,<br />
Chairman of the Works Council Union<br />
ThyssenKrupp Marine Systems<br />
Within the Group:<br />
• Howaldtswerke-Deutsche Werft GmbH<br />
• ThyssenKrupp Marine Systems AG<br />
232<br />
Prof. Dr. Ulrich Lehner, Düsseldorf<br />
Member of the Shareholders’ Committee of<br />
Henkel AG & Co. KGaA<br />
• Deutsche Telekom AG (Chair)<br />
• E.ON AG<br />
• Henkel Management AG<br />
• Porsche Automobil Holding SE<br />
- Dr. August Oetker KG<br />
(Member of the Advisory Board)<br />
- Henkel AG & Co. KGaA<br />
(Member of the Shareholders’ Committee)<br />
- Novartis AG/Switzerland<br />
(Member of the Board of Directors)<br />
Sabine Maaßen, Dinslaken<br />
(since January 22, 2011)<br />
Legal counsel to IG Metall<br />
• Adam Opel AG<br />
• GM Powertrain GmbH<br />
• Membership of supervisory boards within the meaning of Art. 125 of the German Stock Corporation Act (AktG) (as of September 30, 2011)<br />
- Membership of comparable German and non-German control bodies of business enterprises within the meaning of Art. 125 of the German Stock Corporation Act (AktG) (as of September 30, 2011)
4.3 Additional information Other directorships held by Supervisory Board members<br />
Prof. Dr. Bernhard Pellens, Bochum<br />
Professor of Business Studies and<br />
International Accounting, Ruhr University<br />
Bochum<br />
• Rölfs WP Partner AG Wirtschaftsprüfungsgesellschaft<br />
- AKAFÖ – Akademisches Förderungswerk<br />
Bochum (Member of the Advisory Board)<br />
Peter Remmler, Wolfsburg<br />
Wholesale and export trader,<br />
Chairman of the Works Council of<br />
ThyssenKrupp Schulte GmbH (Braunschweig),<br />
Chairman of the Works Council Union<br />
ThyssenKrupp Materials Services<br />
——<br />
Dr. Kersten v. Schenck, Bad Homburg<br />
Attorney and notary public<br />
• Praktiker AG (Chair)<br />
• Praktiker Deutschland GmbH (Chair)<br />
Thomas Schlenz, Duisburg<br />
Shift foreman,<br />
Chairman of the Group Works Council of<br />
ThyssenKrupp AG<br />
- PEAG Personalentwicklungs- und<br />
Arbeitsmarktagentur GmbH<br />
- WISAG Produktionsservice GmbH<br />
Within the Group:<br />
• ThyssenKrupp Materials International<br />
GmbH<br />
• ThyssenKrupp MillServices & Systems<br />
GmbH<br />
Prof. Dr.-Ing. Ekkehard D. Schulz, Krefeld<br />
(since January 21, 2011)<br />
Former Chairman of the Executive Board of<br />
ThyssenKrupp AG<br />
• AXA Konzern AG<br />
• Bayer AG<br />
• MAN SE (Vice Chair)<br />
• RWE AG<br />
Wilhelm Segerath, Duisburg<br />
Automotive body maker,<br />
Chairman of the General Works Council of<br />
ThyssenKrupp Steel Europe AG,<br />
Chairman of the Works Council Union<br />
ThyssenKrupp Steel Europe<br />
Within the Group:<br />
• ThyssenKrupp Steel Europe AG<br />
Peer Steinbrück, Bonn<br />
Member of the German Parliament, Federal<br />
Minister (retd.)<br />
- Borussia Dortmund KGaA (Member of<br />
the Supervisory Board)<br />
——<br />
Christian Streiff, Paris<br />
Former President of PSA Peugeot Citroën S.A.<br />
- Crédit Agricole S.A./France<br />
- Finmeccanica S.p.A./Italy<br />
- TI Automotive Ltd./United Kingdom<br />
Jürgen R. Thumann, Düsseldorf<br />
Chairman of the Advisory Board of<br />
Heitkamp & Thumann Group<br />
• Deutsche Messe AG<br />
• HanseMerkur Holding AG<br />
• HanseMerkur Krankenversicherung auf<br />
Gegenseitigkeit<br />
• Heitkamp BauHolding GmbH (Chair)<br />
- Heitkamp & Thumann Group<br />
(Chairman of the Advisory Board)<br />
Prof. Dr. Beatrice Weder di Mauro,<br />
Frankfurt/Main<br />
Professor of Economics, Economic Policy &<br />
International Macroeconomics, Johannes<br />
Gutenberg University of Mainz<br />
Member of the German Council of Economic<br />
Experts<br />
- DEG - Deutsche Investitions- und<br />
Entwicklungsgesellschaft mbH<br />
(Member of the Supervisory Board)<br />
- Roche AG/Switzerland<br />
(Member of the Board of Directors)<br />
Additional information<br />
232 | 233<br />
Klaus Wiercimok, Düsseldorf<br />
Attorney<br />
Head of the Materials Services department at<br />
Corporate Center Legal & Compliance<br />
of ThyssenKrupp AG<br />
Within the Group:<br />
• ThyssenKrupp Xervon GmbH<br />
At the close of the Annual General Meeting<br />
on January 21, 2011<br />
Dr. Henning Schulte-Noelle and<br />
Peter Scherrer resigned from the Supervisory<br />
Board. Insofar as they held other directorships<br />
at the time of their departure, these are listed<br />
below:<br />
Dr. Henning Schulte-Noelle, Munich<br />
Chairman of the Supervisory Board<br />
of Allianz SE<br />
• Allianz SE (Chair)<br />
• E.ON AG<br />
Peter Scherrer, Brussels<br />
General Secretary of the European<br />
Metalworkers’ Federation<br />
• Vodafone Holding GmbH<br />
• Membership of supervisory boards within the meaning of Art. 125 of the German Stock Corporation Act (AktG) (as of September 30, 2011)<br />
- Membership of comparable German and non-German control bodies of business enterprises within the meaning of Art. 125 of the German Stock Corporation Act (AktG) (as of September 30, 2011)
4.4 Additional information Glossary<br />
Glossary<br />
A<br />
Average collection period<br />
Trade accounts receivable divided by sales, multiplied by<br />
360 (the lower the ratio, the faster customers pay)<br />
B<br />
Business continuity plan<br />
Plans to maintain operations under difficult external<br />
conditions<br />
C<br />
Capital employed<br />
Interest-bearing invested capital<br />
Coating<br />
Corrosion protection for carbon steel by the application of<br />
a metallic or organic coating<br />
Compliance<br />
Adherence to laws and company policies<br />
Corporate governance declaration<br />
Statement by a stock corporation under Art. 289a<br />
German GAAP (HGB) containing a description of how the<br />
executive board and supervisory board operate, the<br />
declaration of conformity and information about<br />
governance practices<br />
Cost of capital<br />
Minimum return required by<br />
capital providers<br />
D<br />
DAX<br />
Deutscher Aktienindex (German stock index), compiled<br />
by Deutsche Börse. The index reflects the performance<br />
of the 30 largest and strongest selling German stocks,<br />
including ThyssenKrupp stock.<br />
Declaration of conformity<br />
Declaration by executive board and supervisory board in<br />
accordance with Art. 161 Stock Corporation Act (AktG)<br />
on the implementation of the recommendations of the<br />
Government Commission on the German Corporate<br />
Governance Code<br />
DJ STOXX<br />
Dow Jones STOXX 600, compiled by index provider Stoxx<br />
Ltd. It lists the performance of 600 companies from 18<br />
European countries.<br />
E<br />
EBIT<br />
Earnings Before Interest and Taxes<br />
EBITDA<br />
Earnings Before Interest, Taxes, Depreciation and<br />
Amortization<br />
EBT<br />
Earnings Before Taxes<br />
Emerging markets<br />
Up and coming markets of Asia, Latin America and<br />
Eastern Europe<br />
E-procurement<br />
Purchasing materials using modern electronic media,<br />
particularly the internet<br />
Equity ratio<br />
Ratio of total equity to balance sheet total (the higher the<br />
ratio, the lower the indebtedness)<br />
F<br />
Free cash flow (before dividend)<br />
Operating cash flows less cash flows from investing<br />
activities<br />
Free float<br />
Shareholding generally taken into account in the<br />
weighting of ThyssenKrupp's stock in stock indices such<br />
as the DAX or DJ STOXX<br />
G<br />
Gearing<br />
Ratio of financial liabilities to total equity (the lower the<br />
ratio, the higher the share of total equity in the interestbearing<br />
capital employed)<br />
Gross profit<br />
Net sales less cost of sales<br />
I<br />
impact<br />
Corporate program to enhance performance and<br />
implement the company strategy<br />
Internal financing strength<br />
Ratio of operating cash flows to cash flows from investing<br />
activities<br />
International Financial Reporting Standards (IFRS)<br />
Standard international accounting rules intended to make<br />
company data more comparable. Under an EU<br />
regulation, listed companies must report in accordance<br />
with these rules.<br />
Inventory turnover<br />
Inventories divided by sales, multiplied by 360 (the lower<br />
the ratio, the faster the inventory turnover)<br />
IP strategy<br />
Strategy for a company’s intellectual property, e.g.<br />
patents and other property rights<br />
L<br />
Long Term Incentive plan (LTI)<br />
Long-term variable compensation for Executive Board<br />
members and other selected executives through stock<br />
rights<br />
M<br />
Mid Term Incentive plan (MTI)<br />
Mid-term variable compensation for Executive Board<br />
members and other selected executives through stock<br />
rights<br />
O<br />
Operating cash flow<br />
Inflow/outflow of cash and cash equivalents other than<br />
from investing, disposal or financing activities<br />
R<br />
Rating<br />
Ratings are used to assess the future ability of a company<br />
to meet its payment obligations on time and in full.<br />
They are based on an analysis of quantitative and<br />
qualitative factors.<br />
ROCE<br />
Return On Capital Employed<br />
234<br />
S<br />
Slab<br />
Compact block of crude steel as starting product for<br />
sheet or strip<br />
Supply chain management<br />
Integrated planning, control and monitoring of all<br />
logistics activities in a supply chain<br />
SWOT analysis<br />
Instrument for analyzing situations and identifying<br />
strategies. SWOT stands for Strengths, Weaknesses,<br />
Opportunities and Threats.<br />
T<br />
Tailored blank<br />
Metal blank comprising individual steel sheets of different<br />
grade, gauge and finish which are welded together and<br />
are suitable for deep drawing<br />
ThyssenKrupp Value Added (TKVA)<br />
Central indicator for value-based management,<br />
comparing earnings before interest and taxes with cost of<br />
capital<br />
Tinplate<br />
Thin steel sheet for the packaging industry electrolytically<br />
coated with tin or chromium
4.5 Additional information Index<br />
4.5 Additional information Index<br />
Index<br />
A<br />
Abbreviations 237<br />
Abbreviations<br />
Additional bonus<br />
237<br />
35<br />
Additional<br />
Adjusted EBIT<br />
bonus<br />
63<br />
35<br />
Adjusted<br />
Analyst recommendations<br />
EBIT<br />
41<br />
63<br />
Analyst<br />
Annual General<br />
recommendations<br />
Meeting 65<br />
41<br />
Annual<br />
Audit opinion<br />
General Meeting<br />
223<br />
65<br />
Audit opinion 223<br />
B<br />
Business areas 49, 71, 107, 115, 187<br />
Business<br />
Business<br />
areas<br />
management<br />
49, 71, 107, 115, 187<br />
54<br />
Business management 54<br />
C<br />
Capabilities 49<br />
Capital<br />
Capabilities<br />
expenditure 85<br />
49<br />
Capital<br />
Capital expenditure<br />
stock 161<br />
85<br />
Cash<br />
Capital<br />
flow<br />
stock<br />
88, 133<br />
161<br />
Climate<br />
Cash flow<br />
protection<br />
88, 133<br />
99<br />
Compensation<br />
Climate protection<br />
report 33<br />
99<br />
Compliance<br />
Compensation report<br />
29, 113<br />
33<br />
Components<br />
Compliance<br />
Technology 79, 86, 108, 118,<br />
29,<br />
188<br />
113<br />
Consolidated<br />
Components Technology<br />
financial statements<br />
79, 86, 108, 118, 188<br />
125<br />
Consolidated<br />
Consolidated<br />
statement<br />
financial statements<br />
of cash flows 88, 133<br />
125<br />
Consolidated<br />
Consolidated statement<br />
statement<br />
of<br />
of<br />
cash<br />
changes<br />
flows<br />
in equity<br />
88, 133<br />
132<br />
Consolidated<br />
Consolidated statement<br />
statement<br />
of<br />
of<br />
changes<br />
comprehensive<br />
in equity<br />
income 131<br />
132<br />
Consolidation<br />
Consolidated statement of comprehensive income<br />
134<br />
131<br />
Contact<br />
Consolidation<br />
239<br />
134<br />
Corporate<br />
Contact<br />
at ThyssenKrupp AG 84, 188<br />
239<br />
Corporate<br />
Corporate at<br />
governance<br />
ThyssenKrupp AG<br />
27, 29,<br />
84,<br />
253<br />
188<br />
Corporate<br />
Corporate governance<br />
governance declaration<br />
27, 29,<br />
33,<br />
253<br />
120<br />
Course<br />
Corporate<br />
of business<br />
governance declaration 33, 120<br />
60<br />
Currency<br />
Course of<br />
translation<br />
business<br />
135<br />
60<br />
Customer<br />
Currency translation<br />
groups<br />
135<br />
67<br />
Customer groups 67<br />
D<br />
Dates 239<br />
Dates<br />
Declaration of conformity<br />
239<br />
27<br />
Declaration<br />
Definition of<br />
of<br />
EBIT<br />
conformity<br />
(new) 56<br />
27<br />
Definition<br />
Directors’<br />
of<br />
dealings<br />
EBIT (new)<br />
31<br />
56<br />
Directors’<br />
Disclosure<br />
dealings<br />
of takeover provisions 120<br />
31<br />
Disclosure<br />
Discontinued<br />
of takeover<br />
operation<br />
provisions<br />
49, 51,<br />
120<br />
82<br />
Discontinued<br />
Disposals<br />
operation 49, 51, 82<br />
51<br />
Disposals<br />
Diversity 30, 99<br />
51<br />
Diversity<br />
Dividend 43, 65,<br />
30,<br />
105<br />
99<br />
Dividend<br />
Divisions<br />
43, 65, 105<br />
49<br />
Divisions 49<br />
E<br />
Earnings 62, 104<br />
Earnings<br />
Earnings<br />
per share<br />
62,<br />
65,<br />
104<br />
197<br />
EBIT<br />
Earnings per share 65, 197<br />
62<br />
Economic<br />
EBIT<br />
conditions 57, 102, 115<br />
62<br />
Elevator<br />
Economic<br />
Technology<br />
conditions<br />
76, 86, 107,<br />
57,<br />
117,<br />
102,<br />
187<br />
115<br />
Elevator Technology<br />
Emissions trading<br />
76, 86, 107, 117, 187<br />
70<br />
Employees<br />
Emissions trading<br />
65, 96<br />
70<br />
Energy<br />
Employees<br />
67,<br />
65,<br />
106<br />
96<br />
Environmental<br />
Energy<br />
protection<br />
67,<br />
99,<br />
106<br />
106<br />
Executive<br />
Environmental<br />
Board<br />
protection 99, 106<br />
18<br />
Executive<br />
Executive<br />
Board<br />
Board<br />
compensation 33, 186<br />
18<br />
Executive Board compensation 33, 186<br />
F<br />
Additional information<br />
234 | 235<br />
235<br />
Female representation 30, 99<br />
Female<br />
Financial<br />
representation<br />
calendar<br />
30,<br />
239<br />
99<br />
Financial<br />
Financial<br />
calendar<br />
debt<br />
239<br />
87<br />
Financial<br />
Financial<br />
debt<br />
instruments 111, 177<br />
87<br />
Financial<br />
Financial position<br />
instruments 111, 177<br />
85<br />
Financial<br />
Financial risks<br />
position<br />
111, 182<br />
85<br />
Financial<br />
Financial-statement<br />
risks<br />
audit 27, 198,<br />
111, 182<br />
223<br />
Financial-statement<br />
Financing<br />
audit 27,<br />
85,<br />
198,<br />
89, 106<br />
223<br />
Financing<br />
Fixed compensation<br />
85, 89, 106<br />
34<br />
Fixed<br />
Forecast<br />
compensation<br />
102<br />
34<br />
Forecast<br />
Free float<br />
102<br />
43<br />
Free float 43<br />
G<br />
Glossary 234<br />
Gross<br />
Glossary<br />
domestic product 58, 102<br />
234<br />
Gross domestic product 58, 102<br />
H<br />
Health and safety 97<br />
Health and safety 97<br />
I<br />
IFRS 134<br />
impact<br />
IFRS 134<br />
53<br />
Impairment<br />
impact<br />
62, 74, 83<br />
53<br />
Income<br />
Impairment<br />
statement<br />
62, 74,<br />
130<br />
83<br />
Index<br />
Income<br />
of<br />
statement<br />
tables and graphics 238<br />
130<br />
Innovations<br />
Index of tables and graphics<br />
94, 106<br />
238<br />
Inoxum<br />
Innovations 94, 106<br />
51<br />
Intangible<br />
Inoxum<br />
assets 153<br />
51<br />
Intangible assets<br />
Internal control and risk management system<br />
153<br />
with Internal regard control to the and accounting risk management process system<br />
109<br />
Inventories<br />
with regard to the accounting process<br />
159<br />
109<br />
Investor<br />
Inventories<br />
relations 32,<br />
159<br />
44<br />
Investor relations 32, 44<br />
L<br />
Legal risks 113, 174<br />
Letter<br />
Legal risks<br />
to shareholders<br />
113, 174<br />
06<br />
Liquidity<br />
Letter to shareholders<br />
planning 89, 106<br />
06<br />
Long<br />
Liquidity<br />
Term<br />
planning<br />
Incentive plan<br />
89, 106<br />
34<br />
Long Term Incentive plan 34<br />
M<br />
Management development 98<br />
Management<br />
Management report<br />
development<br />
on the Group 45<br />
98<br />
Management<br />
Marine Systems<br />
report on the Group<br />
80, 87, 108, 118, 188<br />
45<br />
Marketing<br />
Marine Systems 80, 87, 108, 118, 188<br />
66<br />
Marketing<br />
Materials expense 67<br />
66<br />
Materials<br />
Materials<br />
expense<br />
Services 75, 86, 107, 116<br />
67<br />
Materials<br />
Mission statement<br />
Services 75, 86, 107,<br />
U2,<br />
116<br />
52<br />
Mission<br />
Multi-year<br />
statement<br />
overview<br />
U2,<br />
229<br />
52<br />
Multi-year overview 229
4.5 Additional Additional information Index<br />
N<br />
Net financial debt 87<br />
Net income of ThyssenKrupp AG 65<br />
Notes 134<br />
O<br />
Opportunities management 106<br />
Opportunities report 106<br />
Order intake 61<br />
Organizational structure 49<br />
Other directorships held by Executive Board members 231<br />
Other directorships held by Supervisory Board members 232<br />
Outlook 102<br />
P<br />
Pensions 35, 115, 165<br />
Performance bonus 34<br />
Personnel expense 97, 197<br />
Plant Technology 78, 86, 107, 117, 187<br />
Procurement 67, 106<br />
Property, plant and equipment 156<br />
R<br />
Rating 90<br />
Report by the Supervisory Board 22<br />
Research and development 94, 106<br />
Responsibility statement 224<br />
Risk management 108<br />
Risk report 108<br />
S<br />
Sales 61, 66<br />
Sales markets 59, 66, 104<br />
Sector activity 58, 103<br />
Share-based compensation 37, 163<br />
Share ownership 202<br />
Share price performance 42<br />
Shareholder structure 43<br />
Social commitment 101<br />
49, 51, 82, 87, 118, 156,<br />
Stainless Global<br />
188<br />
Statement of financial position 90, 129<br />
Steel Americas 73, 86, 107, 116, 187<br />
Steel Europe 71, 86, 107, 115, 187<br />
Steel in Transition 116<br />
Stock 41<br />
Stock exchange value/Market capitalization 41<br />
Stock key data 41<br />
Strategic development 50<br />
Subsequent events 101<br />
Subsidiaries 202<br />
Summarized assessment 57<br />
Supervisory Board 20<br />
Supervisory Board committees 21, 23<br />
Supervisory Board compensation 38, 186<br />
Sustainability 93<br />
T<br />
ThyssenKrupp Academy 99<br />
ThyssenKrupp PerspActive 98<br />
ThyssenKrupp Value Added (TKVA) 54<br />
Total equity 161<br />
Training 97, 105<br />
Treasury shares 52, 162<br />
U<br />
University partnerships 98<br />
V<br />
Value-based management 54<br />
236
4.6 Additional information List of abbreviations<br />
4.6 Additional information List List of of abbreviations<br />
List of abbreviations<br />
A<br />
AktG<br />
AktG German Stock Corporation Act<br />
German Stock Corporation Act<br />
B<br />
BIC<br />
BIC Brazil, India, China<br />
Brazil,<br />
BRIC<br />
India, China<br />
BRIC Brazil, Russia, India and China<br />
Brazil, Russia, India and China<br />
C<br />
CESR<br />
CESR Committee of European Securities Regulators<br />
Committee<br />
CGU<br />
of European Securities Regulators<br />
CGU Cash Generating Unit<br />
Cash<br />
CO<br />
Generating Unit<br />
2<br />
CO Carbon 2 dioxide<br />
Carbon dioxide<br />
D<br />
DAX<br />
DAX German stock index<br />
German<br />
DEHSt<br />
stock index<br />
DEHSt German emissions trading office<br />
German<br />
DJ STOXX<br />
emissions trading office<br />
DJ Dow STOXX Jones STOXX<br />
Dow<br />
DRS<br />
Jones STOXX<br />
DRS German Accounting Standard<br />
German<br />
DSR<br />
Accounting Standard<br />
DSR German Accounting Standards Board<br />
German Accounting Standards Board<br />
E<br />
EPS<br />
EPS Earnings per share<br />
Earnings per share<br />
F<br />
FFO/TD<br />
FFO/TD Funds From Operations/Total Debt<br />
Funds From Operations/Total Debt<br />
H<br />
HGB<br />
HGB German Commercial Code<br />
German Commercial Code<br />
I<br />
I<br />
IAS<br />
IAS International Accounting Standards<br />
International<br />
IASB<br />
Accounting Standards<br />
IASB International Accounting Standards Board<br />
International<br />
IFRIC<br />
Accounting Standards Board<br />
IFRIC International Financial Interpretations Committee<br />
International and interpretation Financial of IFRIC Interpretations Committee<br />
and<br />
IFRS<br />
interpretation of IFRIC<br />
IFRS International Financial Reporting Standards<br />
International<br />
IP<br />
Financial Reporting Standards<br />
IP Intellectual property<br />
Intellectual<br />
IT<br />
property<br />
IT Information technology<br />
Information technology<br />
L<br />
LTI<br />
LTI Long Term Incentive plan<br />
Long Term Incentive plan<br />
M<br />
MitbestG<br />
MitbestG German Codetermination Law<br />
German<br />
MTI<br />
Codetermination Law<br />
MTI Mid Term Incentive plan<br />
Mid Term Incentive plan<br />
R<br />
ROCE<br />
ROCE Return on Capital Employed<br />
Return on Capital Employed<br />
S<br />
SPE<br />
SPE Special Purpose Entity<br />
Special Purpose Entity<br />
T<br />
TKVA<br />
TKVA ThyssenKrupp Value Added<br />
ThyssenKrupp Value Added<br />
V<br />
Additional information<br />
VorstAG<br />
VorstAG Act on the Appropriateness of Management Board<br />
Act Compensation on the Appropriateness of Management Board<br />
Compensation<br />
W<br />
WACC<br />
WACC Weighted Average Cost of Capital<br />
Weighted<br />
WpHG<br />
Average Cost of Capital<br />
WpHG German Securities Trading Act<br />
German Securities Trading Act<br />
237<br />
236 | 237
4.7 Additional information Index Index of of tables tables and and graphics<br />
Index of tables and graphics<br />
Facts ThyssenKrupp overview 2010/2011<br />
Figures 2/3<br />
Innovations worldwide 5<br />
Sales 5<br />
Employees 7<br />
Challenges/capabilities 12<br />
Our capabilities 13<br />
Stock 13<br />
Shareholder structure by investor group 15<br />
Shareholder structure by region 2/3<br />
Financial dates 5<br />
1 To our shareholders<br />
1.3 Corporate governance report<br />
Executive Board compensation 36<br />
Supervisory Board compensation 39<br />
Compensation from Supervisory Board directorships within<br />
the Group<br />
1.4 ThyssenKrupp stock<br />
40<br />
Key data of ThyssenKrupp stock 41<br />
Analyst recommendations for ThyssenKrupp stock 41<br />
Performance of ThyssenKrupp stock 42<br />
Highs and lows of ThyssenKrupp stock 43<br />
2 Management report on the Group<br />
2.1 Profile and strategy<br />
Organizational structure 49<br />
Business opportunities for ThyssenKrupp 50<br />
Corporate program impact 53<br />
Calculation of ThyssenKrupp Value Added (TKVA) 54<br />
Components of ThyssenKrupp Value Added (TKVA)<br />
2.2 Consolidated results of operations<br />
55<br />
Targets and target achievement 2010/2011 57<br />
Gross domestic product 2010, 2011 58<br />
Situation on important sales markets 59<br />
ThyssenKrupp in figures 60<br />
Order intake by business area 60<br />
Sales by business area 61<br />
EBIT by business area 62<br />
Adjusted EBIT 64<br />
Employees by region 64<br />
Sales by region 65<br />
Sales by customer group 65<br />
Materials expense by business area 66<br />
Materials expense of business areas as % of sales 66<br />
Iron ore prices 67<br />
Nickel prices 68<br />
Natural gas prices ThyssenKrupp in Germany<br />
2.3 Results of operations of the business areas<br />
57<br />
Steel Europe in figures 69<br />
Steel Europe order intake/EBIT 70<br />
Steel Americas in figures 71<br />
Steel Americas order intake/EBIT 71<br />
Materials Services in figures 73<br />
Materials Services order intake/EBIT 73<br />
Elevator Technology in figures 74<br />
Elevator Technology order intake/EBIT 75<br />
Plant Technology in figures 76<br />
Plant Technology order intake/EBIT 76<br />
Components Technology in figures 77<br />
Components Technology order intake/EBIT 78<br />
Marine Systems in figures 78<br />
Marine Systems order intake/EBIT 79<br />
Stainless Global in figures 80<br />
Stainless Global order intake/EBIT 80<br />
Stainless Global business with external customers<br />
2.4. Financial position<br />
81<br />
Investment by business area 83<br />
Progression of net financial debt 2010/2011 85<br />
Net financial debt 86<br />
Change in cash and cash equivalents 87<br />
Ratings<br />
2.5 Non-financial performance indicators<br />
88<br />
Research and development expenditure 94<br />
Employees by business area 94<br />
Employees by region 95<br />
Personnel expense 95<br />
Accidents at work<br />
Expenditure on environmental protection 2006/2007 to<br />
95<br />
2010/2011 98<br />
Expenditure on environmental protection 2010/2011 in %<br />
2.7 Expected developments and associated opportunities and risks<br />
98<br />
Gross domestic product 2011, 2012 100<br />
Forecasts for important sales markets 102<br />
Risk management ThyssenKrupp Group 106<br />
238
4.8 Additional information Contact and and 2012/2013 dates dates<br />
Contact and 2012/2013 dates<br />
For more information please contact:<br />
Corporate Communications<br />
Telephone +49 201 844-536043<br />
Fax +49 201 844-536041<br />
E-mail press@thyssenkrupp.com<br />
Investor Relations<br />
E-mail ir@thyssenkrupp.com<br />
Institutional investors and analysts<br />
Telephone +49 201 844-536464<br />
Fax +49 201 8456-531000<br />
Private investors<br />
Infoline +49 201 844-538382<br />
Fax +49 201 8456-531000<br />
Address<br />
ThyssenKrupp AG<br />
ThyssenKrupp Allee 1, 45143 Essen, Germany<br />
Postfach, 45063 Essen, Germany<br />
Telephone +49 201 844-0<br />
Fax +49 201 844-536000<br />
E-mail info@thyssenkrupp.com<br />
www.thyssenkrupp.com<br />
Forward-looking statements<br />
This document contains forward-looking statements that reflect management’s current<br />
views with respect to future events. Such statements are subject to risks and<br />
uncertainties that are beyond ThyssenKrupp’s ability to control or estimate precisely,<br />
such as future market and economic conditions, the behavior of other market<br />
participants, the ability to successfully integrate acquired businesses and achieve<br />
anticipated synergies and the actions of government regulators. If any of these or<br />
other risks and uncertainties occur, or if the assumptions underlying any of these<br />
statements prove incorrect, then actual results may be materially different from those<br />
expressed or implied by such statements. ThyssenKrupp does not intend or assume<br />
any obligation to update any forward-looking statements to reflect events or<br />
circumstances after the date of these materials.<br />
Rounding differences and rates of change<br />
Percentages and figures in this report may include rounding differences. The signs<br />
used to indicate rates of change are based on economic aspects: Improvements are<br />
indicated by a + sign, deteriorations are shown in brackets ( ). Very high positive and<br />
negative rates of change (≥1,000% or ≤(100)%) are indicated by ++ and −−<br />
respectively.<br />
TK 685 e 1.7,5.12.11 DP<br />
2012/2013 dates<br />
January 20, 2012<br />
Annual General Meeting<br />
January 23, 2012<br />
Payment of dividend for the 2010/2011 fiscal year<br />
February 14, 2012<br />
Interim report<br />
1st Quarter 2011/2012 (October to December)<br />
Conference call with analysts and investors<br />
May 15, 2012<br />
Interim report<br />
1st half 2011/2012 (October to March)<br />
Conference call with analysts and investors<br />
August 10, 2012<br />
Interim report<br />
9 months 2011/2012 (October to June)<br />
Conference call with analysts and investors<br />
November 22, 2012<br />
Annual press conference<br />
Analysts’ and investors’ conference<br />
January 18, 2013<br />
Annual General Meeting<br />
Additional information<br />
238 | 239<br />
Variances for technical reasons<br />
For technical reasons (e.g. conversion of electronic formats) there may be variances<br />
between the accounting documents contained in this annual report and those<br />
submitted to the electronic Federal Gazette (Bundesanzeiger). In this case, the version<br />
submitted to the electronic Federal Gazette shall be binding.<br />
This English version of the annual report is a translation of the original German<br />
version; in the event of variances, the German version shall take precedence over the<br />
English translation.<br />
Both language versions of the annual report can be downloaded from the internet at<br />
www.thyssenkrupp.com. An interactive online version of the annual report is also<br />
available on our website.<br />
On request we would be pleased to send you further copies free of charge:<br />
Telephone +49 201 844-536367 and +49 201 844-538382<br />
Fax +49 201 8456-531000<br />
E-mail ir@thyssenkrupp.com
ThyssenKrupp AG<br />
ThyssenKrupp Allee 1<br />
45143 Essen, Germany<br />
www.thyssenkrupp.com