Meghalaya - Ministry of Environment and Forests
Meghalaya - Ministry of Environment and Forests
Meghalaya - Ministry of Environment and Forests
- No tags were found...

Create successful ePaper yourself
Turn your PDF publications into a flip-book with our unique Google optimized e-Paper software.
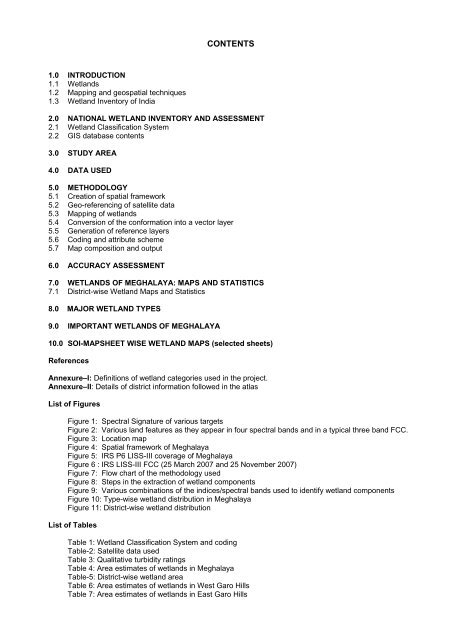
CONTENTS1.0 INTRODUCTION1.1 Wetl<strong>and</strong>s1.2 Mapping <strong>and</strong> geospatial techniques1.3 Wetl<strong>and</strong> Inventory <strong>of</strong> India2.0 NATIONAL WETLAND INVENTORY AND ASSESSMENT2.1 Wetl<strong>and</strong> Classification System2.2 GIS database contents3.0 STUDY AREA4.0 DATA USED5.0 METHODOLOGY5.1 Creation <strong>of</strong> spatial framework5.2 Geo-referencing <strong>of</strong> satellite data5.3 Mapping <strong>of</strong> wetl<strong>and</strong>s5.4 Conversion <strong>of</strong> the conformation into a vector layer5.5 Generation <strong>of</strong> reference layers5.6 Coding <strong>and</strong> attribute scheme5.7 Map composition <strong>and</strong> output6.0 ACCURACY ASSESSMENT7.0 WETLANDS OF MEGHALAYA: MAPS AND STATISTICS7.1 District-wise Wetl<strong>and</strong> Maps <strong>and</strong> Statistics8.0 MAJOR WETLAND TYPES9.0 IMPORTANT WETLANDS OF MEGHALAYA10.0 SOI-MAPSHEET WISE WETLAND MAPS (selected sheets)ReferencesAnnexure–I: Definitions <strong>of</strong> wetl<strong>and</strong> categories used in the project.Annexure–II: Details <strong>of</strong> district information followed in the atlasList <strong>of</strong> FiguresFigure 1: Spectral Signature <strong>of</strong> various targetsFigure 2: Various l<strong>and</strong> features as they appear in four spectral b<strong>and</strong>s <strong>and</strong> in a typical three b<strong>and</strong> FCC.Figure 3: Location mapFigure 4: Spatial framework <strong>of</strong> <strong>Meghalaya</strong>Figure 5: IRS P6 LISS-III coverage <strong>of</strong> <strong>Meghalaya</strong>Figure 6 : IRS LISS-III FCC (25 March 2007 <strong>and</strong> 25 November 2007)Figure 7: Flow chart <strong>of</strong> the methodology usedFigure 8: Steps in the extraction <strong>of</strong> wetl<strong>and</strong> componentsFigure 9: Various combinations <strong>of</strong> the indices/spectral b<strong>and</strong>s used to identify wetl<strong>and</strong> componentsFigure 10: Type-wise wetl<strong>and</strong> distribution in <strong>Meghalaya</strong>Figure 11: District-wise wetl<strong>and</strong> distributionList <strong>of</strong> TablesTable 1: Wetl<strong>and</strong> Classification System <strong>and</strong> codingTable-2: Satellite data usedTable 3: Qualitative turbidity ratingsTable 4: Area estimates <strong>of</strong> wetl<strong>and</strong>s in <strong>Meghalaya</strong>Table-5: District-wise wetl<strong>and</strong> areaTable 6: Area estimates <strong>of</strong> wetl<strong>and</strong>s in West Garo HillsTable 7: Area estimates <strong>of</strong> wetl<strong>and</strong>s in East Garo Hills