Download
Download
Download
- No tags were found...

Create successful ePaper yourself
Turn your PDF publications into a flip-book with our unique Google optimized e-Paper software.
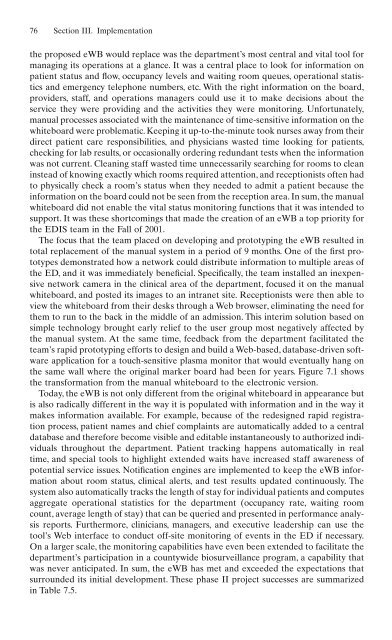
76 Section III. Implementationthe proposed eWB would replace was the department’s most central and vital tool formanaging its operations at a glance. It was a central place to look for information onpatient status and flow, occupancy levels and waiting room queues, operational statisticsand emergency telephone numbers, etc. With the right information on the board,providers, staff, and operations managers could use it to make decisions about theservice they were providing and the activities they were monitoring. Unfortunately,manual processes associated with the maintenance of time-sensitive information on thewhiteboard were problematic. Keeping it up-to-the-minute took nurses away from theirdirect patient care responsibilities, and physicians wasted time looking for patients,checking for lab results, or occasionally ordering redundant tests when the informationwas not current. Cleaning staff wasted time unnecessarily searching for rooms to cleaninstead of knowing exactly which rooms required attention, and receptionists often hadto physically check a room’s status when they needed to admit a patient because theinformation on the board could not be seen from the reception area. In sum, the manualwhiteboard did not enable the vital status monitoring functions that it was intended tosupport. It was these shortcomings that made the creation of an eWB a top priority forthe EDIS team in the Fall of 2001.The focus that the team placed on developing and prototyping the eWB resulted intotal replacement of the manual system in a period of 9 months. One of the first prototypesdemonstrated how a network could distribute information to multiple areas ofthe ED, and it was immediately beneficial. Specifically, the team installed an inexpensivenetwork camera in the clinical area of the department, focused it on the manualwhiteboard, and posted its images to an intranet site. Receptionists were then able toview the whiteboard from their desks through a Web browser, eliminating the need forthem to run to the back in the middle of an admission. This interim solution based onsimple technology brought early relief to the user group most negatively affected bythe manual system. At the same time, feedback from the department facilitated theteam’s rapid prototyping efforts to design and build a Web-based, database-driven softwareapplication for a touch-sensitive plasma monitor that would eventually hang onthe same wall where the original marker board had been for years. Figure 7.1 showsthe transformation from the manual whiteboard to the electronic version.Today, the eWB is not only different from the original whiteboard in appearance butis also radically different in the way it is populated with information and in the way itmakes information available. For example, because of the redesigned rapid registrationprocess, patient names and chief complaints are automatically added to a centraldatabase and therefore become visible and editable instantaneously to authorized individualsthroughout the department. Patient tracking happens automatically in realtime, and special tools to highlight extended waits have increased staff awareness ofpotential service issues. Notification engines are implemented to keep the eWB informationabout room status, clinical alerts, and test results updated continuously. Thesystem also automatically tracks the length of stay for individual patients and computesaggregate operational statistics for the department (occupancy rate, waiting roomcount, average length of stay) that can be queried and presented in performance analysisreports. Furthermore, clinicians, managers, and executive leadership can use thetool’s Web interface to conduct off-site monitoring of events in the ED if necessary.On a larger scale, the monitoring capabilities have even been extended to facilitate thedepartment’s participation in a countywide biosurveillance program, a capability thatwas never anticipated. In sum, the eWB has met and exceeded the expectations thatsurrounded its initial development. These phase II project successes are summarizedin Table 7.5.