Lecture Notes for Finance 1 (and More).
Lecture Notes for Finance 1 (and More).
Lecture Notes for Finance 1 (and More).

Create successful ePaper yourself
Turn your PDF publications into a flip-book with our unique Google optimized e-Paper software.
<strong>Lecture</strong> <strong>Notes</strong> <strong>for</strong> <strong>Finance</strong> 1 (<strong>and</strong> <strong>More</strong>).<br />
David L<strong>and</strong>o<br />
Rolf Poulsen<br />
January 2006
Chapter 1<br />
Preface<br />
These notes are intended <strong>for</strong> the introductory finance course mathematicseconomics<br />
program at the University of Copenhagen. At this stage they are<br />
not complete. The notes (the dominant part of which are written by DL) aim<br />
to fill a gap between elementary textbooks such as Copel<strong>and</strong> <strong>and</strong> Weston 1<br />
or Brealey <strong>and</strong> Myers 2 , <strong>and</strong> more advanced books which require knowledge<br />
of finance theory <strong>and</strong> often cover continuous-time modelling, such as Duffie 3<br />
<strong>and</strong> Campbell, Lo <strong>and</strong> MacKinlay 4 <strong>and</strong> Leroy <strong>and</strong> Werner. 5<br />
Except <strong>for</strong> a brief introduction to the Black-Scholes model, the aim is to<br />
present important parts of the theory of finance through discrete-time models<br />
emphasizing definitions <strong>and</strong> setups which prepare the students <strong>for</strong> the study<br />
of continuous-time models.<br />
At this stage the notes have no historical accounts <strong>and</strong> hardly references<br />
any original papers or existing st<strong>and</strong>ard textbooks. This will be remedied in<br />
later versions but at this stage, in addition to the books already mentioned,<br />
we would like to acknowledge having included things we learned from the<br />
classic Hull 6 , the also recommendable Luenberger 7 , as well as Jarrow <strong>and</strong><br />
Turnbull 8 , <strong>and</strong> Jensen. 9<br />
1T. Copel<strong>and</strong> <strong>and</strong> F. Weston: Financial Theory <strong>and</strong> Corporate Policy<br />
2Brealey <strong>and</strong> Myers: Principles of Corporate <strong>Finance</strong>.McGraw-Hill 4th ed. 1991.<br />
3Duffie, D: Dynamic Asset Pricing Theory.<br />
3rd ed. Princeton 2001.<br />
4Campbell, J., A. Lo <strong>and</strong> A.C. MacKinlay: The Econometrics of Financial Markets.<br />
Princeton 1997.<br />
5LeRoy, S. L. <strong>and</strong> J. Werner: Principles of Financial Economics, Cambridge 2001.<br />
6Hull, J.: Options, Futures <strong>and</strong> Other Derivative Securities. Prentice-Hall. 4th ed.<br />
1999 7Luenberger, D., ”Investment Science”, Ox<strong>for</strong>d, 1997.<br />
8 Jarrow R. <strong>and</strong> S. Turnbull: Derivative Securities.Cincinnati: South-Western (1996).<br />
9 Jensen, B.A. Rentesregning. DJØFs <strong>for</strong>lag. 2001.<br />
3
4 CHAPTER 1. PREFACE
Chapter 2<br />
Introduction<br />
A student applying <strong>for</strong> student loans is investing in his or her human capital.<br />
Typically, the income of a student is not large enough to cover living expenses,<br />
books etc., but the student is hoping that the education will provide future<br />
income which is more than enough to repay the loans. The government<br />
subsidizes students because it believes that the future income generated by<br />
highly educated people will more than compensate <strong>for</strong> the costs of subsidy,<br />
<strong>for</strong> example through productivity gains <strong>and</strong> higher tax revenues.<br />
A first time home buyer is typically not able to pay the price of the new<br />
home up front but will have to borrow against future income <strong>and</strong> using the<br />
house as collateral.<br />
A company which sees a profitable investment opportunity may not have<br />
sufficient funds to launch the project (buy new machines, hire workers) <strong>and</strong><br />
will seek to raise capital by issuing stocks <strong>and</strong>/or borrowing money from a<br />
bank.<br />
The student, the home buyer <strong>and</strong> the company are all in need of money<br />
to invest now <strong>and</strong> are confident that they will earn enough in the future to<br />
pay back loans that they might receive.<br />
Conversely, a pension fund receives payments from members <strong>and</strong> promises<br />
to pay a certain pension once members retire.<br />
Insurance companies receive premiums on insurance contracts <strong>and</strong> delivers<br />
a promise of future payments in the events of property damage or other<br />
unpleasant events which people wish to insure themselves against.<br />
A new lottery millionaire would typically be interested in investing his or<br />
her <strong>for</strong>tune in some sort of assets (government bonds <strong>for</strong> example) since this<br />
will provide a larger income than merely saving the money in a mattress.<br />
The pension fund, the insurance company <strong>and</strong> the lottery winner are all<br />
looking <strong>for</strong> profitable ways of placing current income in a way which will<br />
provide income in the future.<br />
5
6 CHAPTER 2. INTRODUCTION<br />
A key role of financial markets is to find efficient ways of connecting<br />
the dem<strong>and</strong> <strong>for</strong> capital with the supply of capital. The examples above<br />
illustrated the need <strong>for</strong> economic agents to substitute income intertemporally.<br />
An equally important role of financial markets is to allow risk averse agents<br />
(such as insurance buyers) to share risk.<br />
In underst<strong>and</strong>ing the way financial markets allocate capital we must underst<strong>and</strong><br />
the chief mechanism by which it per<strong>for</strong>ms this allocation, namely<br />
through prices. Prices govern the flow of capital, <strong>and</strong> in financial markets<br />
investors will compare the price of some financial security with its promised<br />
future payments. A very important aspect of this comparison is the riskiness<br />
of the promised payments. We have an intuitive feeling that it is reasonable<br />
<strong>for</strong> government bonds to give a smaller expected return than stocks in<br />
risky companies, simply because the government is less likely to default. But<br />
exactly how should the relationship between risk <strong>and</strong> reward (return on an<br />
investment) be in a well functioning market? Trying to answer that question<br />
is a central part of this course. The best answers delivered so far are in a set<br />
of mathematical models developed over the last 40 years or so. One set of<br />
models, CAPM <strong>and</strong> APT, consider expected return <strong>and</strong> variance on return<br />
as the natural definitions of reward <strong>and</strong> risk, respectively <strong>and</strong> tries to answer<br />
how these should be related. Another set of models are based on arbitrage<br />
pricing, which is a very powerful application of the simple idea, that two<br />
securities which deliver the same payments should have the same price. This<br />
is typically illustrated through option pricing models <strong>and</strong> in the modelling<br />
of bond markets, but the methodology actually originated partly in work<br />
which tried to answer a somewhat different question, which is an essential<br />
part of financial theory as well: How should a firm finance its investments?<br />
Should it issue stocks <strong>and</strong>/or bonds or maybe something completely different?<br />
How should it (if at all) distribute dividends among shareholders? The<br />
so-called Modigliani-Miller theorems provide a very important starting point<br />
<strong>for</strong> studying these issues which currently are by no means resolved.<br />
A historical survey of how finance theory has evolved will probably be<br />
more interesting at the end of the course since we will at that point underst<strong>and</strong><br />
versions of the central models of the theory.<br />
But let us start by considering a classical explanation of the significance<br />
of financial markets in a microeconomic setting.<br />
2.1 The Role of Financial Markets<br />
Consider the definition of a private ownership economy as in Debreu (1959):<br />
Assume <strong>for</strong> simplicity that there is only one good <strong>and</strong> one firm with pro-
2.1. THE ROLE OF FINANCIAL MARKETS 7<br />
duction set Y . The ith consumer is characterized by a consumption set Xi,<br />
a preference preordering �i, an endowment ωi <strong>and</strong> shares in the firm θi.<br />
Given a price system p, <strong>and</strong> given a profit maximizing choice of production<br />
y, the firm then has a profit of π(p) = p · y <strong>and</strong> this profit is distributed to<br />
shareholders such that the wealth of the ith consumer becomes<br />
wi = p · ωi + θiπ(p) (2.1)<br />
The definition of an equilibrium in such an economy then has three seemingly<br />
natural requirements: The firm maximizes profits, consumers maximize<br />
utility subject to their budget constraint <strong>and</strong> markets clear, i.e. consumption<br />
equals the sum of initial resources <strong>and</strong> production. But why should the firm<br />
maximize its profits? After all, the firm has no utility function, only consumers<br />
do. But note that given a price system p, the shareholders of the firm<br />
all agree that it is desirable to maximize profits, <strong>for</strong> the higher profits the<br />
larger the consumers wealth, <strong>and</strong> hence the larger is the set of feasible consumption<br />
plans, <strong>and</strong> hence the larger is the attainable level of utility. In this<br />
way the firm’s production choice is separated from the shareholders’ choice<br />
of consumption. There are many ways in which we could imagine shareholders<br />
disagreeing over the firm’s choice of production. Some examples could<br />
include cases where the choice of production influences on the consumption<br />
sets of the consumers, or if we relax the assumption of price taking behavior,<br />
where the choice of production plan affects the price system <strong>and</strong> thereby the<br />
initial wealth of the shareholders. Let us, by two examples, illustrate in what<br />
sense the price system changes the behavior of agents.<br />
Example 1 Consider a single agent who is both a consumer <strong>and</strong> a producer.<br />
The agent has an initial endowment e0 > 0 of the date 0 good <strong>and</strong> has to<br />
divide this endowment between consumption at date 0 <strong>and</strong> investment in<br />
production of a time 1 good. Assume that only non-negative consumption is<br />
allowed. Through investment in production, the agent is able to trans<strong>for</strong>m<br />
an input of i0 into f(i0) units of date 1 consumption. The agent has a<br />
utility function U(c0, c1) which we assume is strictly increasing. The agent’s<br />
problem is then to maximize utility of consumption, i.e. to maximize U(c0, c1)<br />
subject to the constraints c0 + i0 ≤ e0 <strong>and</strong> c1 = f(i0) <strong>and</strong> we may rewrite<br />
this problem as<br />
maxv(c0) ≡ U(c0, f(e0 − c0))<br />
subject to c0 ≤ e0<br />
If we impose regularity conditions on the functions f <strong>and</strong> U (<strong>for</strong> example<br />
that they are differentiable <strong>and</strong> strictly concave <strong>and</strong> that utility of zero consumption<br />
in either period is -∞) then we know that at the maximum c ∗ 0 we<br />
equilibrium<br />
utility function
8 CHAPTER 2. INTRODUCTION<br />
will have 0 < c∗ 0 < e0 <strong>and</strong> v ′<br />
(c∗ 0 ) = 0 i.e.<br />
D1U(c ∗ 0 , f(e0 − c ∗ 0 )) · 1 − D2U(c ∗ 0 , f(e0 − c ∗ ′<br />
0 ))f (e0 − c ∗ 0 ) = 0<br />
where D1 means differentiation after the first variable. Defining i∗ 0 as the<br />
optimal investment level <strong>and</strong> c∗ 1 = f(e0 − c∗ 0 ), we see that<br />
f ′<br />
(i ∗ 0) = D1U(c ∗ 0 , c∗ 1 )<br />
D2U(c ∗ 0 , c∗ 1 )<br />
<strong>and</strong> this condition merely says that the marginal rate of substitution in production<br />
is equal to the marginal rate of substitution of consumption.<br />
The key property to note in this example is that what determines the<br />
production plan in the absence of prices is the preferences <strong>for</strong> consumption<br />
of the consumer. If two consumers with no access to trade owned shares in<br />
the same firm, but had different preferences <strong>and</strong> identical initial endowments,<br />
they would bitterly disagree on the level of the firm’s investment.<br />
Example 2 Now consider the setup of the previous example but assume<br />
that a price system (p0, p1) (whose components are strictly positive) gives<br />
the consumer an additional means of transferring date 0 wealth to date<br />
1 consumption. Note that by selling one unit of date 0 consumption the<br />
agent acquires p0<br />
p0<br />
units of date 1 consumption, <strong>and</strong> we define 1+r = . The<br />
p1 p1<br />
initial endowment must now be divided between three parts: consumption at<br />
date 0 c0, input into production i0 <strong>and</strong> s0 which is sold in the market <strong>and</strong><br />
whose revenue can be used to purchase date 1 consumption in the market.<br />
With this possibility the agent’s problem becomes that of maximizing<br />
U(c0, c1) subject to the constraints<br />
c0 + i0 + s0 ≤ e0<br />
c1 ≤ f(i0) + (1 + r)s0<br />
<strong>and</strong> with monotonicity constraints the inequalities may be replaced by equalities.<br />
Note that the problem then may be reduced to having two decision<br />
variables c0 <strong>and</strong> i0 <strong>and</strong> maximizing<br />
v(c0, i0) ≡ U(c0, f(i0) + (1 + r)(e0 − c0 − i0)).<br />
Again we may impose enough regularity conditions on U (strict concavity,<br />
twice differentiability, strong aversion to zero consumption) to ensure that it<br />
attains its maximum in an interior point of the set of feasible pairs (c0, i0)<br />
<strong>and</strong> that at this point the gradient of v is zero, i.e.<br />
D1U(c ∗ 0 , c∗1 ) · 1 − D2U(c ∗ 0 , f(i∗0 ) + (1 + r)(e0 − c ∗ 0 − i∗0 ))(1 + r) = 0<br />
D2U(c ∗ 0 , f(i∗0 ) + (1 + r)(e0 − c ∗ 0 − i∗ ′<br />
0 ))(f (i ∗ 0 ) − (1 + r)) = 0
2.1. THE ROLE OF FINANCIAL MARKETS 9<br />
With the assumption of strictly increasing U, the only way the second equality<br />
can hold, is if<br />
f ′<br />
(i ∗ 0 ) = (1 + r)<br />
<strong>and</strong> the first equality holds if<br />
D1U(c ∗ 0 , c∗ 1 )<br />
D2U(c ∗ 0, c ∗ 1)<br />
= (1 + r)<br />
We observe two significant features:<br />
First, the production decision is independent of the utility function of<br />
the agent. Production is chosen to a point where the marginal benefit of<br />
investing in production is equal to the ’interest rate’ earned in the market.<br />
The consumption decision is separate from the production decision <strong>and</strong> the<br />
marginal condition is provided by the market price. In such an environment<br />
we have what is known as Fisher Separation where the firm’s decision is<br />
independent of the shareholder’s utility functions. Such a setup rests critically<br />
on the assumptions of the perfect competitive markets where there is<br />
price taking behavior <strong>and</strong> a market <strong>for</strong> both consumption goods at date 0.<br />
Whenever we speak of firms having the objective of maximizing shareholders’<br />
wealth we are assuming an economy with a setup similar to that of the<br />
private ownership economy of which we may think of the second example as<br />
a very special case.<br />
Second, the solution to the maximization problem will typically have a<br />
higher level of utility <strong>for</strong> the agent at the optimal point: Simply note that<br />
any feasible solution to the first maximization problem is also a solution<br />
to the second. This is an improvement which we take as a ’proof’ of the<br />
significance of the existence of markets. If we consider a private ownership<br />
economy equilibrium, the equilibrium price system will see to that consumers<br />
<strong>and</strong> producers coordinate their activities simply by following the price system<br />
<strong>and</strong> they will obtain higher utility than if each individual would act without<br />
a price system as in example 1.<br />
Fisher Separation
10 CHAPTER 2. INTRODUCTION
Chapter 3<br />
Payment Streams under<br />
Certainty<br />
3.1 Financial markets <strong>and</strong> arbitrage<br />
In this section we consider a very simple setup with no uncertainty. There<br />
are three reasons that we do this:<br />
First, the terminology of bond markets is conveniently introduced in this<br />
setting, <strong>for</strong> even if there were uncertainty in our model, bonds would be<br />
characterized by having payments whose size at any date are constant <strong>and</strong><br />
known in advance.<br />
Second, the classical net present value (NPV) rule of capital budgeting is<br />
easily understood in this framework.<br />
And finally, the mathematics introduced in this section will be extremely<br />
useful in later chapters as well.<br />
A note on notation: If v ∈ R N is a vector the following conventions <strong>for</strong><br />
“vector positivity” are used:<br />
• v ≥ 0 (“v is non-negative”) means that all of v ′ s coordinates are nonnegative.<br />
ie. ∀i: vi ≥ 0.<br />
• v > 0 (“v is positive” ) means that v ≥ 0 <strong>and</strong> that at least one coordinate<br />
is strictly positive, ie. ∀i: vi ≥ 0 <strong>and</strong> ∃i: vi > 0, or differently<br />
that v ≥ 0 <strong>and</strong> v �= 0.<br />
• v ≫ 0 (“v is strictly positive”) means that every coordinate is strictly<br />
positive, ∀i: vi > 0. This (when v is N-dimensional) we will sometimes<br />
write as v ∈ RN ++ . (This saves a bit of space, when we want to indicate<br />
both strict positivity <strong>and</strong> the dimension of v.)<br />
11<br />
net present value,<br />
NPV<br />
positivity of<br />
vectors
financial market<br />
security price<br />
system<br />
payment stream<br />
portfolio<br />
short position<br />
long position<br />
arbitrage<br />
opportunity<br />
12 CHAPTER 3. PAYMENT STREAMS UNDER CERTAINTY<br />
Throughout we use v ⊤ to denote the transpose of the vector v. Vectors<br />
without the transpose sign are always thought of as column vectors.<br />
We now consider a model <strong>for</strong> a financial market (sometimes also called a<br />
security market or price system; individual components are then referred to<br />
as securities) with T + 1 dates: 0, 1, . . ., T <strong>and</strong> no uncertainty.<br />
Definition 1 A financial market consists of a pair (π, C) where π ∈ R N<br />
<strong>and</strong> C is an N × T −matrix.<br />
The interpretation is as follows: By paying the price πi at date 0 one<br />
is entitled to a stream of payments (ci1, . . ., ciT) at dates 1, . . .,T. Negative<br />
components are interpreted as amounts that the owner of the security has<br />
to pay. There are N different payment streams trading. But these payment<br />
streams can be bought or sold in any quantity <strong>and</strong> they may be combined in<br />
portfolios to <strong>for</strong>m new payment streams:<br />
Definition 2 A portfolio θ is an element of R N . The payment stream generated<br />
by θ is C ⊤ θ ∈ R T . The price of the portfolio θ at date 0 is π · θ<br />
(= π ⊤ θ = θ ⊤ π).<br />
Note that allowing portfolios to have negative coordinates means that we<br />
allow securities to be sold. We often refer to a negative position in a security<br />
as a short position <strong>and</strong> a positive position as a long position. Short positions<br />
are not just a convenient mathematical abstraction. For instance when you<br />
borrow money to buy a home, you take a short position in bonds.<br />
Be<strong>for</strong>e we even think of adopting (π, C) as a model of a security market<br />
we want to check that the price system is sensible. If we think of the financial<br />
market as part of an equilibrium model in which the agents use the market<br />
to transfer wealth between periods, we clearly want a payment stream of<br />
(1, . . ., 1) to have a lower price than that of (2, . . .,2). We also want payment<br />
streams that are non-negative at all times to have a non-negative price. <strong>More</strong><br />
precisely, we want to rule out arbitrage opportunities in the security market<br />
model:<br />
Definition 3 A portfolio θ is an arbitrage opportunity (of type 1 or 2) if it<br />
satisfies one of the following conditions:<br />
1. π · θ = 0 <strong>and</strong> C ⊤ θ > 0.<br />
2. π · θ < 0 <strong>and</strong> C ⊤ θ ≥ 0.<br />
Alternatively, we can express this as (−π · θ, C ⊤ θ) > 0.
3.1. FINANCIAL MARKETS AND ARBITRAGE 13<br />
The interpretation is that it should not be possible to <strong>for</strong>m a portfolio at<br />
zero cost which delivers non-negative payments at all future dates <strong>and</strong> even<br />
gives a strictly positive payment at some date. And it should not be possible<br />
to <strong>for</strong>m a portfolio at negative cost (i.e. a portfolio which gives the owner<br />
money now) which never has a negative cash flow in the future.<br />
Usually type 1 arbitrages can be trans<strong>for</strong>med into type 2. arbitrages, <strong>and</strong><br />
vice versa. For instance, if the exists a ci > 0, then we easily get from 2 to 1<br />
But there is not mathematical equivalence (take π = 0 or C = 0 to see this).<br />
Definition 4 The security market is arbitrage-free if it contains no arbitrage<br />
opportunities.<br />
To give a simple characterization of arbitrage-free markets we need a<br />
lemma which is very similar to Farkas’ theorem of alternatives proved in<br />
Matematik 2OK using separating hyperplanes:<br />
Lemma 1 (Stiemke’s lemma) Let A be an n × m−matrix: Then precisely<br />
one of the following two statements is true:<br />
1. There exists x ∈ Rm ++ such that Ax = 0.<br />
2. There exists y ∈ R n such that y ⊤ A > 0.<br />
We will not prove the lemma here (it is a very common exercise in convexity/linear<br />
programming courses, where the name Farkas is encountered).<br />
But it is the key to our next theorem:<br />
Theorem 2 The security market (π, C) is arbitrage-free if <strong>and</strong> only if there<br />
exists a strictly positive vector d ∈ RT ++ such that π = Cd.<br />
In the context of our security market the vector d will be referred to as<br />
a vector of discount factors. This use of language will be clear shortly.<br />
Proof. Define the matrix<br />
⎛<br />
⎞<br />
−π1 c11 c12 · · · c1T<br />
⎜ −π2 c21 c22 · · · c2T<br />
⎟<br />
A = ⎜<br />
⎝<br />
.<br />
. . . ..<br />
⎟<br />
. ⎠<br />
−πN cN1 cN2 · · · cNT<br />
First, note that the existence of x ∈ R T+1<br />
++ such that Ax = 0 is equivalent<br />
to the existence of a vector of discount factors since we may define<br />
di = xi<br />
x0<br />
i = 1, . . .,T.<br />
separating<br />
hyperplane<br />
Stiemke’s lemma<br />
discount factors
14 CHAPTER 3. PAYMENT STREAMS UNDER CERTAINTY<br />
complete market Hence if the first condition of Stiemke’s lemma is satisfied, a vector d exists<br />
such that π = Cd. The second condition corresponds to the existence of an<br />
arbitrage opportunity: If y ⊤ A > 0 then we have either<br />
or<br />
(y ⊤ A)1 > 0 <strong>and</strong> (y ⊤ A)i ≥ 0 i = 1, . . .,T + 1<br />
(y ⊤ A)1 = 0 , y ⊤ A ≥ 0 <strong>and</strong> (y ⊤ A)i > 0 some i ∈ {2, . . .,T + 1}<br />
<strong>and</strong> this is precisely the condition <strong>for</strong> the existence of an arbitrage opportunity.<br />
Now use Stiemke’s lemma.<br />
Another important concept is market completeness (in Danish: Komplethed<br />
or fuldstændighed).<br />
Definition 5 The security market is complete if <strong>for</strong> every y ∈ R T there<br />
exists a θ ∈ R N such that C ⊤ θ = y.<br />
In linear algebra terms this means that the rows of C span R T , which can<br />
only happen if N ≥ T, <strong>and</strong> in our interpretation it means that any desired<br />
payment stream can be generated by an appropriate choice of portfolio.<br />
Theorem 3 Assume that (π, C) is arbitrage-free. Then the market is complete<br />
if <strong>and</strong> only if there is a unique vector of discount factors.<br />
Proof. Since the market is arbitrage-free we know that there exists d ≫ 0<br />
such that π = Cd. Now if the model is complete then R T is spanned by the<br />
columns of C ⊤ , ie. the rows of C of which there are N. This means that C<br />
has T linearly independent rows, <strong>and</strong> from basic linear algebra (look around<br />
where rank is defined) it also has T linearly independent columns, which is<br />
to say that all the columns are independent. They there<strong>for</strong>e <strong>for</strong>m a basis <strong>for</strong><br />
a T-dimensional linear subspace of R N (remember we must have N ≥ T to<br />
have completeness), ie. any vector in this subspace has unique representation<br />
in terms of the basis-vectors. Put differently, the equation Cx = y has at<br />
most one solution. And in case where y = π, we know there is one by absence<br />
of arbitrage. For the other direction assume that the model is incomplete.<br />
Then the columns of C are linearly dependent, <strong>and</strong> that means that there<br />
exists a vector � d �= 0 such that 0 = C � d. Since d ≫ 0, we may choose ǫ > 0<br />
such that d + ǫ � d ≫ 0. Clearly, this produces a vector of discount factors<br />
different from d.
3.2. ZERO COUPON BONDS AND THE TERM STRUCTURE 15<br />
3.2 Zero coupon bonds <strong>and</strong> the term structure<br />
Assume throughout this section that the model (π, C) is complete <strong>and</strong> arbitrage-<br />
free <strong>and</strong> let d ⊤ = (d1, . . ., dT) be the unique vector of discount factors. Since<br />
there must be at least T securities to have a complete model, C must have<br />
at least T rows. On the other h<strong>and</strong> if C has exactly T linearly independent<br />
rows, then adding other securities to C will not add any more possibilities of<br />
wealth transfer to the market. Hence we can assume that C is am invertible<br />
T × T matrix.<br />
Definition 6 The payment stream of a zero coupon bond with maturity t is<br />
given by the t ′ th unit vector et of R T .<br />
Next we see why the words discount factors were chosen:<br />
Proposition 4 The price of a zero coupon bond with maturity t is dt.<br />
Proof. Let θt be the portfolio such that C ⊤ θt = et. Then<br />
π ⊤ θt = (Cd) ⊤ θt = d ⊤ C ⊤ θt = d ⊤ et = dt.<br />
Note from the definition of d that we get the value of a stream of payments c<br />
by computing �T t=1 ctdt. In other words, the value of a stream of payments is<br />
obtained by discounting back the individual components. There is nothing<br />
in our definition of d which prevents ds > dt even when s > t, but in the<br />
models we will consider this will not be relevant: It is safe to think of dt as<br />
decreasing in t corresponding to the idea that the longer the maturity of a<br />
zero coupon bond, the smaller is its value at time 0.<br />
From the discount factors we may derive/define various types of interest<br />
rates which are essential in the study of bond markets.:<br />
Definition 7 (Short <strong>and</strong> <strong>for</strong>ward rates.) The short rate at date 0 is given<br />
by<br />
r0 = 1<br />
− 1.<br />
The (one-period) time t- <strong>for</strong>ward rate at date 0, is equal to<br />
where d0 = 1 by convention.<br />
d1<br />
f(0, t) = dt<br />
dt+1<br />
− 1,<br />
zero coupon bond,<br />
ZCB<br />
discount factors<br />
<strong>for</strong>ward rates<br />
short rate
yield to maturity<br />
term structure of<br />
interest rates<br />
16 CHAPTER 3. PAYMENT STREAMS UNDER CERTAINTY<br />
The interpretation of the short rate should be straight<strong>for</strong>ward: Buying 1<br />
d1<br />
units of a maturity 1 zero coupon bond costs 1<br />
d1 d1 = 1 at date 0 <strong>and</strong> gives a<br />
payment at date 1 of 1<br />
d1 = 1 + r0. The <strong>for</strong>ward rate tells us the rate at which<br />
we may agree at date 0 to borrow (or lend) between dates t <strong>and</strong> t+1. To see<br />
this, consider the following strategy at time 0 :<br />
• Sell 1 zero coupon bond with maturity t.<br />
• Buy dt<br />
dt+1<br />
zero coupon bonds with maturity t + 1.<br />
Note that the amount raised by selling precisely matches the amount used<br />
<strong>for</strong> buying <strong>and</strong> hence the cash flow from this strategy at time 0 is 0. Now<br />
consider what happens if the positions are held to the maturity date of the<br />
bonds: At date t the cash flow is then −1 <strong>and</strong> at date t + 1 the cash flow is<br />
dt<br />
dt+1<br />
= 1 + f(0, t).<br />
Definition 8 The yield (or yield to maturity) at time 0 of a zero coupon<br />
bond with maturity t is given as<br />
Note that<br />
�<br />
1<br />
y(0, t) =<br />
dt<br />
�1<br />
t<br />
− 1.<br />
dt(1 + y(0, t)) t = 1.<br />
<strong>and</strong> that one may there<strong>for</strong>e think of the yield as an ’average interest rate’<br />
earned on a zero coupon bond. In fact, the yield is a geometric average of<br />
<strong>for</strong>ward rates:<br />
1 + y(0, t) = ((1 + f(0, 0)) · · ·(1 + f(0, t − 1))) 1<br />
t<br />
Definition 9 The term structure of interest rates (or the yield curve) at<br />
date 0 is given by (y(0, 1), . . ., y(0, T)).<br />
Note that if we have any one of the vector of yields, the vector of <strong>for</strong>ward<br />
rates <strong>and</strong> the vector of discount factors, we may determine the other two.<br />
There<strong>for</strong>e we could equally well define a term structure of <strong>for</strong>ward rates <strong>and</strong><br />
a term structure of discount factors. In these notes unless otherwise stated,<br />
we think of the term structure of interest rates as the yields of zero coupon<br />
bonds as a function of time to maturity. It is important to note that the term<br />
structure of interest rate depicts yields of zero coupon bonds. We do however<br />
also speak of yields on securities with general positive payment steams:
3.2. ZERO COUPON BONDS AND THE TERM STRUCTURE 17<br />
Definition 10 The yield (or yield to maturity) of a security c ⊤ = (c1, . . .,cT)<br />
with c > 0 <strong>and</strong> price π is the unique solution y > −1of the equation<br />
π =<br />
T�<br />
i=1<br />
ci<br />
(1 + y) i.<br />
Example 3 (Compounding Periods) In most of the analysis in this chapter<br />
the time is “stylized”; it is measured in some unit (which we think of <strong>and</strong><br />
refer to as “years”) <strong>and</strong> cash-flows occur at dates {0, 1, 2, . . ., T }. But it<br />
is often convenient (<strong>and</strong> not hard) to work with dates that are not integer<br />
multiples of the fundamental time-unit. We quote interest rates in units of<br />
years−1 (“per year’), but to any interest rate there should be a number, m,<br />
associated stating how often the interest is compounded. By this we mean<br />
the following: If you invest 1 $ <strong>for</strong> n years at the m-compounded rate rm you<br />
end up with<br />
�<br />
1 + rm<br />
m<br />
� mn<br />
. (3.1)<br />
The st<strong>and</strong>ard example: If you borrow 1$ in the bank, a 12% interest rate<br />
means they will add 1% to you debt each month (i.e. m = 12) <strong>and</strong> you<br />
will end up paying back 1.1268 $ after a year, while if you make a deposit,<br />
they will add 12% after a year (i.e. m = 1) <strong>and</strong> you will of course get 1.12$<br />
back after one year. If we keep rm <strong>and</strong> n fixed in (3.1) (<strong>and</strong> then drop the<br />
m-subscript) <strong>and</strong> <strong>and</strong> let m tend to infinity, it is well known that we get:<br />
�<br />
lim 1 +<br />
m→∞<br />
r<br />
�mn = e<br />
m<br />
nr ,<br />
<strong>and</strong> in this case we will call r the continuously compounded interest rate. In<br />
other words: If you invest 1 $ <strong>and</strong> the continuously compounded rate rc <strong>for</strong><br />
a period of length t, you will get back etrc . Note also that a continuously<br />
compounded rate rc can be used to find (uniquely <strong>for</strong> any m) rm such that<br />
1 $ invested at m-compounding corresponds to 1 $ invested at continuous<br />
compounding, i.e.<br />
�<br />
1 + rm<br />
m<br />
� m<br />
= e rc .<br />
This means that in order to avoid confusion – even in discrete models –<br />
there is much to be said in favor of quoting interest rates on a continuously<br />
compounded basis. But then again, in the highly stylized discrete models<br />
it would be pretty artificial, so we will not do it (rather it will always be<br />
m = 1).<br />
yield to maturity<br />
compounding<br />
periods<br />
continuously<br />
compounded<br />
interest rate
annuity<br />
serial loan<br />
bullet bond<br />
annuity<br />
18 CHAPTER 3. PAYMENT STREAMS UNDER CERTAINTY<br />
3.3 Annuities, serial loans <strong>and</strong> bullet bonds<br />
Typically, zero-coupon bonds do not trade in financial markets <strong>and</strong> one there<strong>for</strong>e<br />
has to deduce prices of zero-coupon bonds from other types of bonds<br />
trading in the market. Three of the most common types of bonds which do<br />
trade in most bond markets are annuities, serial loans <strong>and</strong> bullet bonds. (In<br />
literature relating to the American market, “bond” is usually understood to<br />
mean “bullet bond with 2 yearly payments”. Further, “bills” are term short<br />
bonds, annuities explicitly referred to as such, <strong>and</strong> serial loans rare.) We<br />
now show how knowing to which of these three types a bond belongs <strong>and</strong><br />
knowing three characteristics, namely the maturity, the principal <strong>and</strong> the<br />
coupon rate, will enable us to determine the bond’s cash flow completely.<br />
Let the principal or face value of the bond be denoted F. Payments on the<br />
bond start at date 1 <strong>and</strong> continue to the time of the bond’s maturity, which<br />
we denote τ. The payments are denoted ct. We think of the principal of a<br />
bond with coupon rate R <strong>and</strong> payments c1, . . .,cτ as satisfying the following<br />
difference equation:<br />
pt = (1 + R)pt−1 − ct t = 1, . . .,τ, (3.2)<br />
with the boundary conditions p0 = F <strong>and</strong> pτ = 0.<br />
Think of pt as the remaining principal right after a payment at date<br />
t has been made. For accounting <strong>and</strong> tax purposes <strong>and</strong> also as a helpful tool<br />
in designing particular types of bonds, it is useful to split payments into a<br />
part which serves as reduction of principal <strong>and</strong> one part which is seen as an<br />
interest payment. We define the reduction in principal at date t as<br />
<strong>and</strong> the interest payment as<br />
δt = pt−1 − pt<br />
it = Rpt−1 = ct − δt.<br />
Definition 11 An annuity with maturity τ, principal F <strong>and</strong> coupon rate R<br />
is a bond whose payments are constant between dates 1 <strong>and</strong> τ, <strong>and</strong> whose<br />
principal evolves according to Equation (3.2).<br />
With constant payments we can use (3.2) repeatedly to write the remaining<br />
principal at time t as<br />
pt = (1 + R) t �t−1<br />
F − c (1 + R) j<br />
j=0<br />
<strong>for</strong> t = 1, 2, . . .,τ.
3.3. ANNUITIES, SERIAL LOANS AND BULLET BONDS 19<br />
To satisfy the boundary condition pτ = 0 we must there<strong>for</strong>e have<br />
�τ−1<br />
F − c (1 + R) j−τ = 0,<br />
j=0<br />
so by using the well-known <strong>for</strong>mula �n−1 i=0 xi = (xn − 1)/(x − 1) <strong>for</strong> the<br />
summation of a geometric series, we get<br />
c = F<br />
� τ−1<br />
�<br />
(1 + R) j−τ<br />
j=0<br />
� −1<br />
= F<br />
R(1 + R)τ<br />
(1 + R) τ R<br />
= F .<br />
− 1 1 − (1 + R) −τ<br />
Note that the size of the payment is homogeneous (of degree 1) in the principal,<br />
so it’s usually enough to look at the F = 1. (This rather trivial observation<br />
can in fact be extremely useful in a dynamic context.) It is common<br />
to use the shorth<strong>and</strong> notation<br />
αn⌉R = (“Alfahage”) = (1 + R)n − 1<br />
.<br />
R(1 + R) n<br />
Having found what the size of the payment must be we may derive the<br />
interest <strong>and</strong> the deduction of principal as well: Let us calculate the size of<br />
the payments <strong>and</strong> see how they split into deduction of principal <strong>and</strong> interest<br />
payments. First, we derive an expression <strong>for</strong> the remaining principal:<br />
pt = (1 + R) t F − F<br />
= F<br />
ατ⌉R<br />
= F<br />
ατ⌉R<br />
= F<br />
ατ⌉R<br />
�t−1<br />
(1 + R) j<br />
j=0<br />
�<br />
(1 + R) t ατ⌉R − (1 + R)t �<br />
− 1<br />
R<br />
� τ (1 + R) − 1<br />
R(1 + R) τ−t − (1 + R)τ − (1 + R) τ−t<br />
R(1 + R) τ−t<br />
�<br />
ατ−t⌉R.<br />
ατ⌉R<br />
This gives us the interest payment <strong>and</strong> the deduction immediately <strong>for</strong> the<br />
annuity:<br />
it = R F<br />
δt = F<br />
ατ−t+1⌉R<br />
ατ⌉R<br />
ατ⌉R<br />
(1 − Rατ−t+1⌉R).<br />
In the definition of an annuity, the size of the payments is implicitly<br />
defined. The definitions of bullets <strong>and</strong> serials are more direct.<br />
alfahage; $“alpha<br />
˙n“rceil R $
ullet bond<br />
serial loan<br />
20 CHAPTER 3. PAYMENT STREAMS UNDER CERTAINTY<br />
Definition 12 A bullet bond 1 with maturity τ, principal F <strong>and</strong> coupon rate<br />
R is characterized by having it = ct <strong>for</strong> t = 1, . . ., τ − 1 <strong>and</strong> cτ = (1 + R)F.<br />
The fact that we have no reduction in principal be<strong>for</strong>e τ <strong>for</strong>ces us to have<br />
ct = RF <strong>for</strong> all t < τ.<br />
Definition 13 A serial loan or bond with maturity τ, principal F <strong>and</strong> coupon<br />
rate R is characterized by having δt, constant <strong>for</strong> all t = 1, . . .,τ.<br />
Since the deduction in principal is constant every period <strong>and</strong> we must have<br />
pτ = 0, it is clear that δt = F <strong>for</strong> t = 1, . . ., τ. From this it is straight<strong>for</strong>ward<br />
τ<br />
to calculate the interest using it = Rpt−1.<br />
We summarize the characteristics of the three types of bonds in the table<br />
below:<br />
Annuity Fα −1<br />
τ⌉R<br />
Bullet<br />
Serial<br />
payment interest deduction of principal<br />
RF <strong>for</strong> t < τ<br />
(1 + R)F <strong>for</strong> t = τ<br />
F<br />
τ + R � F − t−1<br />
τ F�<br />
R F<br />
α τ⌉R ατ−t+1⌉R<br />
RF<br />
R � F − t−1<br />
τ F�<br />
F<br />
(1 − Rατ−t+1⌉R)<br />
ατ⌉R 0 <strong>for</strong> t < τ<br />
F<br />
τ<br />
F <strong>for</strong> t = τ<br />
Example 4 (A Simple Bond Market) Consider the following bond market<br />
where time is measured in years <strong>and</strong> where payments are made at dates<br />
{0, 1, . . ., 4}:<br />
Bond (i) Coupon rate (Ri) Price at time 0 (πi(0))<br />
1 yr bullet 5 100.00<br />
2 yr bullet 5 99.10<br />
3 yr annuity 6 100.65<br />
4 yr serial 7 102.38<br />
We are interested in finding the zero-coupon prices/yields in this market.<br />
First we have to determine the payment streams of the bonds that are traded<br />
(the C-matrix). Since α3⌉6 = 2.6730 we find that<br />
C =<br />
⎡<br />
⎢<br />
⎣<br />
1 In Danish: Et st˚aende l˚an<br />
105 0 0<br />
5 105 0 0<br />
37.41 37.41 37.41 0<br />
32 30.25 28.5 26.75<br />
⎤<br />
⎥<br />
⎦
3.3. ANNUITIES, SERIAL LOANS AND BULLET BONDS 21<br />
Clearly this matrix is invertible so et = C ⊤ θt has a unique solution <strong>for</strong> all<br />
t ∈ {1, . . ., 4} (namely θt = (C ⊤ ) −1 et). If the resulting t-zero-coupon bond<br />
prices, dt(0) = π(0) · θt, are strictly positive then there is no arbitrage.<br />
Per<strong>for</strong>ming the inversion <strong>and</strong> the matrix multiplications we find that<br />
(d1(0), d2(0), d3(0), d4(0)) ⊤ = (0.952381, 0.898458, 0.839618, 0.7774332),<br />
or alternatively the following zero-coupon yields<br />
100 ∗ (y(0, 1), y(0, 2), y(0, 3), y(0, 4)) ⊤ = (5.00, 5.50, 6.00, 6.50).<br />
Now suppose that somebody introduces a 4 yr annuity with a coupon rate<br />
of 5 % . Since α4⌉5 = 3.5459 this bond has a unique arbitrage-free price of<br />
π5(0) = 100<br />
(0.952381 + 0.898458 + 0.839618 + 0.7774332) = 97.80.<br />
3.5459<br />
Notice that bond prices are always quoted per 100 units (e.g. $ or DKK) of<br />
principal. This means that if we assume the yield curve is the same at time<br />
1 the price of the serial bond would be quoted as<br />
π4(1) = d1:3(0) · C4,2:4<br />
0.75<br />
= 76.87536<br />
0.75<br />
= 102.50<br />
(where d1:3(0) means the first 3 entries of d(0) <strong>and</strong> C4,2:4 means the entries 2<br />
to 4 in row 4 of C).<br />
Example 5 (Reading the financial pages) This example gives concrete<br />
calculations <strong>for</strong> a specific Danish Government bond traded at the Copenhagen<br />
Stock Exchange(CSX): A bullet bond with a 4 % coupon rate <strong>and</strong><br />
yearly coupon payments that matures on January 1 2010. Around February<br />
1 2005 you could read the following on the CSX homepage or on the financial<br />
pages of decent newspapers<br />
Bond type Current date Maturity date Price Yield<br />
4% bullet February 1 2005 January 1 2010 104.02 3.10 %<br />
Let us see how the yield was calculated. First, we need to set up the cash-flow<br />
stream that results from buying the bond. The first cash-flow, π in the sense<br />
of Definition 8 would take place today. (Actually it wouldn’t, even these days<br />
trades take a couple of day to be in effect; valør in Danish. We don’t care<br />
here.) And how large is it? By convention, <strong>and</strong> reasonably so, the buyer has<br />
to pay the price (104.02; this is called the clean price) plus compensate the<br />
seller of the bond <strong>for</strong> the accrued interest over the period from January 1 to<br />
clean price
22 CHAPTER 3. PAYMENT STREAMS UNDER CERTAINTY<br />
dirty price February 1, ie. <strong>for</strong> 1 month, which we take to mean 1/12 of a year. (This is<br />
not as trivial as it seems. In practice there are a lot of finer - <strong>and</strong> extremely<br />
boring - points about how days are counted <strong>and</strong> fractions calculated. Suffice<br />
it to say that mostly actual days are used in Denmark.) By definition the<br />
buyer has to pay accrued interest of “coupon × year-fraction”, ie. 4 × 1/12<br />
= 0.333, so the total payment (called the dirty price) is π = 104.35. So now<br />
we can write down the cash-flows <strong>and</strong> verify the yield calculation:<br />
Date tk Cash-flow (ck) dk = (1 + 0.0310) −tk PV= dk ∗ ck<br />
Feb. 1 2005<br />
Jan. 1 2006<br />
0 - 104.35 1<br />
11<br />
12 4 0.9724 3.890<br />
Jan. 1 2007 1 11<br />
12 4 0.9432 3.772<br />
Jan. 1 2008 2 11<br />
12 4 0.9148 3.660<br />
Jan. 1 2009 3 11<br />
12 4 0.8873 3.549<br />
Jan. 1 2010 4 11<br />
12 104 0.8606 89.505<br />
SUM = 104.38<br />
(The match, 104.35 vs. 104.38 isn’t perfect. But to 3 significant digits 0.0310<br />
is the best solution, <strong>and</strong> anything else can be attributed to out rough approach<br />
to exact dates.)<br />
Example 6 (Finding the yield curve) In early February you could find<br />
prices 4%-coupon rate bullet bonds with a range of different maturities (all<br />
maturities fall on January firsts):<br />
Maturity year 2006 2007 2008 2009 2010<br />
Clean price 101.46 102.69 103.43 103.88 104.02<br />
Maturity year 2011 2012 2013 2014 2015<br />
Clean price 103.80 103.50 103.12 102.45 102.08<br />
These bonds (with names like 4%10DsINKx) are used <strong>for</strong> the construction of<br />
private home-owners variable/floating rate loans such as “FlexL˚an”. (Hey!<br />
How does the interest rate get floating? Well, it does if you (completely)<br />
refinance your 30-year loan every year or every 5 years with shorter maturity<br />
bonds.) In many practical contexts these are not the right bonds to use;<br />
yield curves “should” be inferred from government bonds. (Of course this<br />
statement makes no sense within our modelling framework.)<br />
Dirty prices, these play the role of π, are found as in Example 5, <strong>and</strong> the (10<br />
by 10) C-matrix has the <strong>for</strong>m<br />
⎧<br />
⎨ 4 if j < i<br />
Ci,j = 104<br />
⎩<br />
0<br />
if j = i<br />
if j > i
3.3. ANNUITIES, SERIAL LOANS AND BULLET BONDS 23<br />
zero coupon yield<br />
0.020 0.025 0.030 0.035 0.040<br />
Danish zero coupon yields early February 2005<br />
2 4 6 8 10<br />
maturity<br />
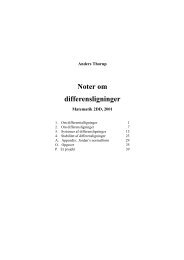
Figure 3.1: The term structure of interest rates in Denmark, February 2005.<br />
The o’s are the points we have actually calculated, the rest is just linear<br />
interpolation.<br />
The system Cd = π has the positive (∼ no arbitrage) unique (∼ completeness)<br />
solution<br />
d = (0.9788,0.9530,0.9234,0.8922,0.8593,0.8241,0.789, 50.7555,0.7200,0.6888) ⊤ .<br />
<strong>and</strong> that corresponds to these (yearly compounded) zero coupon yields:<br />
Maturity 0.92 1.92 2.92 3.92 4.92 5.92 6.92 7.92 8.92 9.92<br />
ZC yield in % 2.37 2.55 2.77 2.95 3.13 3.32 3.48 3.61 3.75 3.83<br />
as depicted in Figure 3.1.<br />
Example 7 The following example is meant to illustrate the perils of relying<br />
too much on yields. Especially if they are used incorrectly! The numbers<br />
are taken from Jakobsen <strong>and</strong> Tanggaard. 2 Consider the following small bond<br />
2 Jakobsen, S. <strong>and</strong> C. Tanggard: Faldgruber i brugen af effektiv rente og varighed,<br />
finans/invest, 2/87.
24 CHAPTER 3. PAYMENT STREAMS UNDER CERTAINTY<br />
market:<br />
Bond (i) 100*Coupon rate (Ri) Price at time 0 (πi(0)) 100*Yield<br />
1 yr bullet 10 100.00 10.00<br />
2 yr bullet 10 98.4 10.93<br />
3 yr bullet 10 95.5 11.87<br />
4 yr bullet 10 91.8 12.74<br />
5 yr bullet 10 87.6 13.58<br />
5 yr serial 10 95.4 11.98<br />
Now consider a portfolio manager with the following argument: “Let us sell<br />
1 of each of the bullet bonds <strong>and</strong> use the money to buy the serial bond. The<br />
weighted yield on our liabilities (the bonds sold) is<br />
100 ∗ 10 + 98.4 ∗ 10.93 + 95.5 ∗ 11.87 + 91.8 ∗ 12.74 + 87.6 ∗ 13.58<br />
100 + 98.4 + 95.5 + 91.8 + 87.6<br />
= 11.76%,<br />
while the yield on our assets (the bond we bought) is 11.98%. So we just sit<br />
back <strong>and</strong> take a yield gain of 0.22%.” But let us look <strong>for</strong> a minute at the<br />
cash-flows from this arrangement (Note that one serial bond has payments<br />
(30, 28, 26, 24, 22) <strong>and</strong> that we can buy 473.3/95.4 = 4.9612 serial bonds <strong>for</strong><br />
the money we raise.)<br />
Time 0 1 2 3 4 5<br />
Liabilities<br />
1 yr bullet 100 -110 0 0 0 0<br />
2 yr bullet 98.4 -10 -110 0 0 0<br />
3 yr bullet 95.5 -10 -10 -110 0 0<br />
4 yr bullet 91.8 -10 -10 -10 -110 0<br />
5 yr bullet<br />
Assets<br />
87.6 -10 -10 -10 -10 -110<br />
5 yr serial<br />
Net position<br />
-473.3 148.84 138.91 128.99 119.07 109.15<br />
0 -1.26 -1.19 -1.01 -0.93 -0.75<br />
So we see that what have in fact found is a sure-fire way of throwing money<br />
away. So what went wrong? The yield on the liability side is not 11.76%. The<br />
yield of a portfolio is a non-linear function of all payments of the portfolio,<br />
<strong>and</strong> it is not a simple function (such as a weighted average) of the yields of<br />
the individual components of the portfolio. The correct calculation gives that<br />
the yield on the liabilities is 12.29%. This suggests that we should per<strong>for</strong>m<br />
the exact opposite transactions. And we should, since from the table of cashflow<br />
we see that this is an arbitrage-opportunity (“a free lunch”). But how
3.4. IRR, NPV AND CAPITAL BUDGETING UNDER CERTAINTY. 25<br />
can we be sure to find such arbitrages? By per<strong>for</strong>ming an analysis similar to<br />
that in Example 4, i.e. pick out a sufficient number of bonds to construct<br />
zero-coupon bonds <strong>and</strong> check if all other bonds are priced correctly. If not<br />
it is easy to see how the arbitrage-opportunities are exploited. If we pick<br />
out the 5 bullets <strong>and</strong> do this, we find that the correct price of the serial is<br />
94.7, which is confirmation that arbitrage-opportunities exists in the market.<br />
Note that we do not have to worry if it is the serial that is overpriced or the<br />
bullets that are underpriced.<br />
Of course things are not a simple in practice as in this example. Market<br />
imperfections (such as bid-ask spreads) <strong>and</strong> the fact that there are more<br />
payments dates the bonds make it a challenging empirical task to estimate<br />
the zero-coupon yield curve. Nonetheless the idea of finding the zero-coupon<br />
yield curve <strong>and</strong> using it to find over- <strong>and</strong> underpriced bonds did work wonders<br />
in the Danish bond market in the ’80ies (the 1980’ies, that is).<br />
3.4 IRR, NPV <strong>and</strong> capital budgeting under<br />
certainty.<br />
The definition of internal rate of return (IRR) is the same as that of yield,<br />
but we use it on arbitrary cash flows, i.e. on securities which may have<br />
negative cash flows as well:<br />
Definition 14 An internal rate of return of a security (c1, . . .,cT) with price<br />
π �= 0 is a solution y > −1of the equation<br />
π =<br />
T�<br />
i=1<br />
ci<br />
(1 + y) i.<br />
Hence the definitions of yield <strong>and</strong> internal rate of return are identical <strong>for</strong><br />
positive cash flows. It is easy to see that <strong>for</strong> securities whose future payments<br />
are both positive <strong>and</strong> negative we may have several IRRs. This is one reason<br />
that one should be very careful interpreting <strong>and</strong> using this measure at all<br />
when comparing cash flows. We will see below that there are even more<br />
serious reasons. When judging whether a certain cash flow is ’attractive’ the<br />
correct measure to use is net present value:<br />
Definition 15 The PV <strong>and</strong> NPV of security (c1, . . .,cT)with price c0 given<br />
a term structure (y(0, 1), . . ., y(0, T)) are defined as<br />
PV (c) =<br />
T�<br />
i=1<br />
ci<br />
(1 + y(0, i)) i<br />
capital<br />
budgeting<br />
internal rate of<br />
return<br />
net present value,<br />
NPV
NPV criterion<br />
26 CHAPTER 3. PAYMENT STREAMS UNDER CERTAINTY<br />
NPV (c) =<br />
T�<br />
i=1<br />
ci<br />
− c0<br />
(1 + y(0, i)) i<br />
Next, we will see how these concepts are used in deciding how to invest under<br />
certainty.<br />
Assume throughout this section that we have a complete security market<br />
as defined in the previous section. Hence a unique discount function d is<br />
given as well as the associated concepts of interest rates <strong>and</strong> yields.We let<br />
y denote the term structure of interest rates <strong>and</strong> use the short h<strong>and</strong> notation<br />
yi <strong>for</strong> y(0, i).<br />
In capital budgeting we analyze how firms should invest in projects whose<br />
payoffs are represented by cash flows. Whereas we assumed in the security<br />
market model that a given security could be bought or sold in any quantity<br />
desired, we will use the term project more restrictively: We will say that the<br />
project is scalable by a factor λ �= 1 if it is possible to start a project which<br />
produces the cash flow λc by paying λc0 initially. A project is not scalable<br />
unless we state this explicitly <strong>and</strong> we will not consider any negative scaling.<br />
In a complete financial market an investor who needs to decide on only<br />
one project faces a very simple decision: Accept the project if <strong>and</strong> only if<br />
it has positive NPV. We will see why this is shortly. Accepting this fact<br />
we will see examples of some other criteria which are generally inconsistent<br />
with the NPV criterion. We will also note that when a collection of projects<br />
are available capital budgeting becomes a problem of maximizing NPV over<br />
the range of available projects. The complexity of the problem arises from<br />
the constraints that we impose on the projects. The available projects may<br />
be non-scalable or scalable up to a certain point, they may be mutually<br />
exclusive (i.e. starting one project excludes starting another), we may impose<br />
restrictions on the initial outlay that we will allow the investor to make<br />
(representing limited access to borrowing in the financial market), we may<br />
assume that a project may be repeated once it is finished <strong>and</strong> so on. In all<br />
cases our objective is simple: Maximize NPV.<br />
First, let us note why looking at NPV is a sensible thing to do:<br />
Proposition 5 Given a cash flow c = (c1, . . .,cT) <strong>and</strong> given c0 such that<br />
NPV (c0; c) < 0. Then there exists a portfolio θ of securities whose price is<br />
c0 <strong>and</strong> whose payoff satisfies<br />
⎛ ⎞<br />
C ⊤ θ ><br />
⎜<br />
⎝<br />
c1<br />
.<br />
cT<br />
⎟<br />
⎠.
3.4. IRR, NPV AND CAPITAL BUDGETING UNDER CERTAINTY. 27<br />
Conversely, if NPV (c0; c) > 0,then every θ with C ⊤ θ = c satisfies π ⊤ θ > c0.<br />
Proof. Since the security market is complete, there exists a portfolio θ c such<br />
that C ⊤ θ c = c. Now π ⊤ θ c < c0 (why?), hence we may <strong>for</strong>m a new portfolio by<br />
investing the amount c0 − π ⊤ θ c in some zero coupon bond (e1, say)<strong>and</strong> also<br />
invest in θ c . This generates a stream of payments equal to C⊤θ c + (c0−π⊤θc )<br />
e1 > d1<br />
c <strong>and</strong> the cost is c0 by construction.<br />
The second part is left as an exercise.<br />
The interpretation of this lemma is the following: One should never accept<br />
a project with negative NPV since a strictly larger cash flow can be obtained<br />
at the same initial cost by trading in the capital market. On the other h<strong>and</strong>,<br />
a positive NPV project generates a cash flow at a lower cost than the cost<br />
of generating the same cash flow in the capital market. It might seem that<br />
this generates an arbitrage opportunity since we could buy the project <strong>and</strong><br />
sell the corresponding future cash flow in the capital market generating a<br />
profit at time 0. However, we insist on relating the term arbitrage to the<br />
capital market only. Projects should be thought of as ’endowments’: Firms<br />
have an available range of projects. By choosing the right projects the firms<br />
maximize the value of these ’endowments’.<br />
Some times when per<strong>for</strong>ming NPV-calculations, we assume that ’the term<br />
structure is flat’ . What this means is that the discount function has the<br />
particularly simple <strong>for</strong>m<br />
dt =<br />
1<br />
(1 + r) t<br />
<strong>for</strong> some constant r, which we will usually assume to be non-negative, although<br />
our model only guarantees that r > −1 in an arbitrage-free market.<br />
A flat term structure is very rarely observed in practice - a typical real world<br />
term structure will be upward sloping: Yields on long maturity zero coupon<br />
bonds will be greater than yields on short bonds. Reasons <strong>for</strong> this will be<br />
discussed once we model the term structure <strong>and</strong> its evolution over time -<br />
a task which requires the introduction of uncertainty to be of any interest.<br />
When the term structure is flat then evaluating the NPV of a project having<br />
a constant cash flow is easily done by summing the geometric series. The<br />
present value of n payments starting at date 1, ending at date n each of size<br />
c, is<br />
n�<br />
cd i �n−1<br />
= cd d i 1 − dn<br />
= cd , d �= 1<br />
1 − d<br />
i=1<br />
i=0
Gordon’s growth<br />
<strong>for</strong>mula<br />
capital budgeting<br />
28 CHAPTER 3. PAYMENT STREAMS UNDER CERTAINTY<br />
Another classical <strong>for</strong>mula concerns the present value of a geometrically growing<br />
payment stream (c, c(1 + g), . . ., c(1 + g) n−1 ) as<br />
=<br />
=<br />
n�<br />
i=1<br />
(1 + g)i−1<br />
c<br />
(1 + r) i<br />
c �n−1<br />
1 + r<br />
c<br />
r − g<br />
(1 + g)<br />
i=0<br />
i<br />
(1 + r) i<br />
� � �n� 1 + g<br />
1 − .<br />
1 + r<br />
Although we have not taken into account the possibility of infinite payment<br />
streams, we note <strong>for</strong> future reference, that <strong>for</strong> 0 ≤ g < r we have what is<br />
known as Gordon’s growth <strong>for</strong>mula:<br />
∞�<br />
i=1<br />
c(1 + g) i−1 c<br />
=<br />
(1 + r) i r − g .<br />
3.4.1 Some rules that are inconsistent with the NPV<br />
rule.<br />
Corresponding to our definition of internal rate of return in Chapter 3, we<br />
define an internal rate of return on a project c with initial cost c0 > 0,<br />
denoted IRR(c0; c), as a solution to the equation<br />
c0 =<br />
T�<br />
i=1<br />
ci<br />
(1 + x) i,<br />
x > −1<br />
As we have noted earlier such a solution need not be unique unless c > 0<br />
<strong>and</strong> c0 > 0.<br />
Note that an internal rate of return is defined without referring to the<br />
underlying term structure. The internal rate of return describes the level of a<br />
flat term structure at which the NPV of the project is 0. The idea behind its<br />
use in capital budgeting would t hen be to say that the higher the level of the<br />
interest rate, the better the project (<strong>and</strong> some sort of comparison with the<br />
existing term structure would then be appropriate when deciding whether to<br />
accept the project at all). But as we will see in the following example, IRR<br />
<strong>and</strong> NPV may disagree on which project is better: Consider the projects<br />
shown in the table below (whose last column shows a discount function d):
3.4. IRR, NPV AND CAPITAL BUDGETING UNDER CERTAINTY. 29<br />
date proj 1 proj 2 d<br />
0 -100 -100 1<br />
1 50 50 0.95<br />
2 5 80 0.85<br />
3 90 4 0.75<br />
IRR 0.184 0.197 -<br />
NPV 19.3 18.5 -<br />
Project 2 has a higher IRR than project 1, but 1 has a larger NPV than<br />
2. Using the same argument as in the previous section it is easy to check,<br />
that even if a cash flow similar to that of project 2 is desired by an investor,<br />
he would be better off investing in project 1 <strong>and</strong> then re<strong>for</strong>ming the flow of<br />
payments using the capital market.<br />
Another problem with trying to use IRR as a decision variable arises when<br />
the IRR is not uniquely defined - something which typically happens when<br />
the cash flows exhibit sign changes. Which IRR should we then choose?<br />
One might also contemplate using the payback method <strong>and</strong> count the<br />
number of years it takes to recover the initial cash outlay - possibly after<br />
discounting appropriately the future cash flows. Project 2 in the table has<br />
a payback of 2 years whereas project 1 has a payback of three years. The<br />
example above there<strong>for</strong>e also shows that choosing projects with the shortest<br />
payback time may be inconsistent with the NPV method.<br />
3.4.2 Several projects<br />
Consider someone with c0 > 0 available at date 0 who wishes to allocate<br />
this capital over the T + 1 dates, <strong>and</strong> who considers a project c with initial<br />
cost c0. We have seen that precisely when NPV (c0; c) > 0 this person will<br />
be able to obtain better cash flows by adopting c <strong>and</strong> trading in the capital<br />
market than by trading in the capital market alone.<br />
When there are several projects available the situation really does not<br />
change much: Think of the i ′ th project (p i 0 , p) as an element of a set Pi ⊂<br />
R T+1 . Assume that 0 ∈ Pi all i representing the choice of not starting the<br />
i’th project. For a non-scalable project this set will consist of one point in<br />
addition to 0.<br />
Given a collection of projects represented by (Pi) i∈I . Situations where<br />
there is a limited amount of money to invest at the beginning (<strong>and</strong> borrowing<br />
is not permitted), where projects are mutually exclusive etc. may then<br />
be described abstractly by the requirement that the collection of selected<br />
projects (p i 0 , pi )i∈I are chosen from a feasible subset P of the Cartesian product<br />
×i∈IPi. The NPV of the chosen collection of projects is then just the sum
30 CHAPTER 3. PAYMENT STREAMS UNDER CERTAINTY<br />
of the NPVs of the individual projects <strong>and</strong> this in turn may be written as<br />
the NPV of the sum of the projects:<br />
�<br />
NPV (p i 0 ; pi �<br />
�<br />
) = NPV (p i 0 , pi �<br />
) .<br />
i∈I<br />
Hence we may think of the chosen collection of projects as producing one<br />
project <strong>and</strong> we can use the result of the previous section to note that clearly<br />
an investor should choose a project giving the highest NPV. In practice, the<br />
maximization over feasible “artificial” may not be easy at all.<br />
Let us look at an example from Copel<strong>and</strong> <strong>and</strong> Weston (1988): .<br />
Example 8 Consider the following 4 projects<br />
i∈I<br />
project NPV initial cost<br />
1 30.000 200.000<br />
2 16.250 125.000<br />
3 19.250 175.000<br />
4 12.000 150.000<br />
Assume that all projects are non-scalable, <strong>and</strong> assume that we can only invest<br />
up to an amount of 300.000. This capital constraint <strong>for</strong>ces us to choose,<br />
i.e. projects become mutually exclusive to some extent. Clearly, with no<br />
constraints all projects would be adopted since the NPVs are positive in all<br />
cases. Note that project 1 generates the largest NPV but it also uses a large<br />
portion of the budget: If we adopt 1, there is no room <strong>for</strong> additional projects.<br />
The only way to deal with this problem is to stick to the NPV-rule <strong>and</strong> go<br />
through the set of feasible combinations of projects <strong>and</strong> compute the NPV.<br />
It is not hard to see that combining projects 2 <strong>and</strong> 3 produces the maximal<br />
NPV given the capital constraint. If the projects were assumed scalable, the<br />
situation would be different: Then project 1 adopted at a scale of 1.5 would<br />
clearly be optimal. This is simply because the amount of NPV generated per<br />
dollar invested is larger <strong>for</strong> project 1 than <strong>for</strong> the other projects. Exercises<br />
will illustrate other examples of NPV-maximization.<br />
The moral of this section is simple: Given a perfect capital market, investors<br />
who are offered projects should simply maximize NPV. This is merely<br />
an equivalent way of saying that profit maximization with respect to the existing<br />
price system (as represented by the term structure) is the appropriate<br />
strategy when a perfect capital market exists. The technical difficulties arise<br />
from the constraints that we impose on the projects <strong>and</strong> these constraints
3.5. DURATION, CONVEXITY AND IMMUNIZATION. 31<br />
easily lead to linear programming problems, integer programming problems<br />
or even non-linear optimization problems.<br />
However, real world projects typically do not generate cash flows which<br />
are known in advance. Real world projects involve risk <strong>and</strong> uncertainty <strong>and</strong><br />
there<strong>for</strong>e capital budgeting under certainty is really not sophisticated enough<br />
<strong>for</strong> a manager deciding which projects to undertake. A key objective of this<br />
course is to try <strong>and</strong> model uncertainty <strong>and</strong> to construct models of how risky<br />
cash flows are priced. This will give us definitions of NPV which work <strong>for</strong><br />
uncertain cash flows as well.<br />
3.5 Duration, convexity <strong>and</strong> immunization.<br />
3.5.1 Duration with a flat term structure.<br />
In this chapter we introduce the notions of duration <strong>and</strong> convexity which are<br />
often used in practical bond risk management <strong>and</strong> asset/liability management.<br />
It is worth stressing that when we introduce dynamic models of the<br />
term structure of interest rates in a world with uncertainty, we obtain much<br />
more sophisticated methods <strong>for</strong> measuring <strong>and</strong> controlling interest rate risk<br />
than the ones presented in this section.<br />
Consider an arbitrage-free <strong>and</strong> complete financial market where the discount<br />
function d = (d1, . . .dT) satisfies<br />
di =<br />
1<br />
<strong>for</strong> i = 1, . . .,T.<br />
(1 + r) i<br />
This corresponds to the assumption of a flat term structure. We stress that<br />
this assumption is rarely satisfied in practice but we will see how to relax<br />
this assumption.<br />
What we are about to investigate are changes in present values as a<br />
function of changes in r.. We will speak freely of ’interest changes’ occurring<br />
even though strictly speaking, we still do not have uncertainty in our model.<br />
With a flat term structure, the present value of a payment stream c =<br />
(c1, . . .,cT) is given by<br />
PV (c; r) =<br />
T�<br />
t=1<br />
ct<br />
(1 + r) t<br />
We have now included the dependence on r explicitly in our notation since<br />
what we are about to model are essentially derivatives of PV (c; r) with respect<br />
to r.
duration,<br />
Macaulay<br />
convexity<br />
32 CHAPTER 3. PAYMENT STREAMS UNDER CERTAINTY<br />
Definition 16 Let c be a non-negative payment stream. The Macaulay duration<br />
D(c; r) of c is given by<br />
D(c; r) =<br />
�<br />
− ∂<br />
�<br />
1 + r<br />
PV (c; r)<br />
∂r PV (c; r)<br />
(3.3)<br />
=<br />
T� 1 ct<br />
t<br />
PV (c; r) (1 + r) t<br />
The Macaulay duration <strong>and</strong> is the classical one (many more advanced durations<br />
have been proposed in the literature). Note that rather than saying it<br />
is based on a flat term structure, we could refer to it as being based on the<br />
yield of the bond (or portfolio).<br />
If we define<br />
wt =<br />
then we have � T<br />
t=1 wt = 1, hence<br />
t=1<br />
ct<br />
(1 + r) t<br />
1<br />
, (3.4)<br />
PV (c; r)<br />
D(c; r) =<br />
T�<br />
t wt.<br />
Definition 17 The convexity of c is given by<br />
T�<br />
K(c; r) = t 2 wt. (3.5)<br />
where wt is given by (3.4).<br />
Let us try to interpret D <strong>and</strong> K by computing the first <strong>and</strong> second derivatives<br />
3 of PV (c; r) with respect to r.<br />
PV ′ (c; r) = −<br />
PV ′′ (c; r) =<br />
T�<br />
t=1<br />
t ct<br />
= − 1<br />
1 + r<br />
=<br />
t=1<br />
t=1<br />
1<br />
(1 + r) t+1<br />
T� 1<br />
t ct<br />
(1 + r) t<br />
t=1<br />
T� ct<br />
t (t + 1)<br />
(1 + r) t=1<br />
t+2<br />
1<br />
(1 + r) 2<br />
�<br />
T�<br />
t 2 1<br />
ct +<br />
(1 + r) t<br />
t=1<br />
T� 1<br />
tct<br />
(1 + r) t<br />
�<br />
3 ′ ′′ ∂<br />
∂2<br />
From now on we write PV (c; r) <strong>and</strong> PV (c; r) instead of ∂r PV (c; r) resp. ∂r2PV (c; r)<br />
t=1
3.5. DURATION, CONVEXITY AND IMMUNIZATION. 33<br />
Now consider the relative change in PV (c; r) when r changes to r + ∆r, i.e.<br />
PV (c; r + ∆r) − PV (c; r)<br />
PV (c; r)<br />
By considering a second order Taylor expansion of the numerator, we obtain<br />
PV (c; r + ∆r) − PV (c; r)<br />
PV (c; r)<br />
≈ PV ′ (c; r)∆r + 1<br />
2 PV ′′ (c; r)(∆r) 2<br />
PV (c; r)<br />
= −D ∆r<br />
� �2 1 ∆r<br />
+ (K + D)<br />
(1 + r) 2 1 + r<br />
Hence D <strong>and</strong> K can be used to approximate the relative change in<br />
PV (c; r) as a function of the relative change in r (or more precisely, relative<br />
changes in 1 + r, since ∆(1+r) ∆r = 1+r 1+r ).<br />
Sometimes one finds the expression modified duration defined by<br />
MD(c; r) = D<br />
1 + r<br />
<strong>and</strong> using this in a first order approximation, we get the relative change in<br />
PV (c; r) expressed by −MD(c; r)∆r, which is a function of ∆r itself. The<br />
interpretation of D as a price elasticity gives us no reasonable explanation of<br />
the word ’duration’, which certainly leads one to think of quantity measured<br />
in units of time. If we use the definition of wt we have the following simple<br />
expression <strong>for</strong> the duration:<br />
D(c; r) =<br />
T�<br />
t wt.<br />
Notice that wt expresses the present value of ct divided by the total present<br />
value, i.e. wt expresses the weight by which ct is contributing to the total<br />
present value. Since � T<br />
t=1 wt = 1 we see that D(c; r) may be interpreted as<br />
a ’mean waiting time’. The payment which occurs at time t is weighted by<br />
wt.<br />
Example 9 For the bullet bond in Example 5 the present value of the<br />
payment stream is 104.35 <strong>and</strong> y = 0.0310, so there<strong>for</strong>e the Macaulay duration<br />
is �4 k=1 tkck(1 + y) −tk<br />
= 475.43<br />
= 4.556<br />
104.35<br />
PV<br />
while the convexity is<br />
�4 k=1 t2k ck(1 + y) −tk<br />
PV<br />
t=1<br />
= 2266.35<br />
104.35<br />
= 21.72,<br />
duration,<br />
modified
34 CHAPTER 3. PAYMENT STREAMS UNDER CERTAINTY<br />
<strong>and</strong> the following table shows the the exact <strong>and</strong> approximated relative chances<br />
in present value when the yield changes:<br />
Yield △yield Exact rel. (%) First order Second order<br />
PV-change approximation approximation<br />
0.021 -0.010 4.57 4.42 4.54<br />
0.026 -0.005 2.27 2.21 2.24<br />
0.031 0 0 0 0<br />
0.036 0.005 -2.15 -2.21 -2.18<br />
0.041 0.010 -4.27 -4.42 - 4.30<br />
Notice that since PV is a decreasing, convex function of y we know that the<br />
first order approximation will underestimate the effect of decreasing y (<strong>and</strong><br />
overestimate the effect of increasing it).<br />
Notice that <strong>for</strong> a zero coupon bond with time to maturity t the duration<br />
is t. For other kinds of bonds with time to maturity t, the duration is less<br />
than t. Furthermore, note that investing in a zero coupon bond with yield<br />
to maturity r <strong>and</strong> holding the bond to expiration guarantees the owner an<br />
annual return of r between time 0 <strong>and</strong> time t. This is not true of a bond<br />
with maturity t which pays coupons be<strong>for</strong>e t. For such a bond the duration<br />
has an interpretation as the length of time <strong>for</strong> which the bond can ensure an<br />
annual return of r :<br />
Let FV (c; r, H) denote the (future) value of the payment stream c at time<br />
H if the interest rate is fixed at level r. Then<br />
FV (c; r, H) = (1 + r) H PV (c; r)<br />
=<br />
H−1 �<br />
t=1<br />
ct(1 + r) H−t + cH +<br />
T�<br />
t=H+1<br />
ct<br />
1<br />
(1 + r) t−H<br />
Consider a change in r which occurs an instant after time 0. How would<br />
such a change affect FV (c; r, H)? There are two effects with opposite directions<br />
which influence the future value: Assume that r decreases. Then the<br />
first sum in the expression <strong>for</strong> FV (c; r, H) will decrease. This decrease can<br />
be seen as caused by reinvestment risk: The coupons received up to time H<br />
will have to be reinvested at a lower level of interest rates. The last sum will<br />
increase when r decreases. This is due to price risk : As interest rates fall<br />
the value of the remaining payments after H will be higher since they have<br />
to be discounted by a smaller factor. Only cH is unchanged.<br />
The natural question to ask then is <strong>for</strong> which H these two effects cancel<br />
each other. At such a time point we must have ∂ FV (c; r, H) = 0 since an<br />
∂r<br />
infinitesimal change in r should have no effect on the future value. Now,
3.5. DURATION, CONVEXITY AND IMMUNIZATION. 35<br />
∂<br />
∂<br />
FV (c; r, H) =<br />
∂r ∂r<br />
� (1 + r) H PV (c; r) �<br />
= H(1 + r) H−1 PV (c; r) + (1 + r) H PV ′ (c; r)<br />
Setting this expression equal to 0 gives us<br />
H = −PV ′ (c; r)<br />
(1 + r)<br />
PV (c; r)<br />
i.e. H = D(c; r)<br />
Furthermore, at H = D(c; r), we have ∂2<br />
∂r2FV (c; r, H) > 0. This you can<br />
check by computing ∂2<br />
∂r2 � �<br />
H (1 + r) PV (c; r) ,reexpressing in terms D <strong>and</strong> K,<br />
<strong>and</strong> using the fact that K > D2 . Hence, at H = D(c; r), FV (c; r, H) will have<br />
a minimum in r. We say that FV (c; r, H) is immunized towards changes in r,<br />
but we have to interpret this expression with caution: The only way a bond<br />
really can be immunized towards changes in the interest rate r between time<br />
0 <strong>and</strong> the investment horizon t is by buying zero coupon bonds with maturity<br />
t. Whenever we buy a coupon bond at time 0 with duration t, then to a first<br />
order approximation, an interest change immediately after time 0, will leave<br />
the future value at time t unchanged. However, as date 1 is reached (say)<br />
it will not be the case that the duration of the coupon bond has decreased<br />
to t − 1. As time passes, it is generally necessary to adjust bond portfolios<br />
to maintain a fixed investment horizon, even if r is unchanged. This is true<br />
even in the case of certainty.<br />
Later when we introduce dynamic hedging strategies we will see how a<br />
portfolio of bonds can be dynamically managed so as to truly immunize the<br />
return.<br />
3.5.2 Relaxing the assumption of a flat term structure.<br />
What we have considered above were parallel changes in a flat term structure.<br />
Since we rarely observe this in practice, it is natural to try <strong>and</strong> generalize<br />
the analysis to different shapes of the term structure. Consider a family of<br />
structures given by a function r of two variables, t <strong>and</strong> x. Holding x fixed<br />
gives a term structure r(·, x).<br />
For example, given a current term structure (y1, . . .,yT) we could have<br />
r(t, x) = yt + x in which case changes in x correspond to additive changes<br />
in the current term structure (the one corresponding to x = 0). Or we could<br />
have 1+r(t, x) = (1+yt)x, in which case changes in x would produce multiplicative<br />
changes in the current (obtained by letting x = 1) term structure.<br />
immunization
36 CHAPTER 3. PAYMENT STREAMS UNDER CERTAINTY<br />
duration Now let us compute changes in present values as x changes:<br />
which gives us<br />
where<br />
∂PV<br />
∂x<br />
∂PV<br />
∂x<br />
= −<br />
1<br />
PV<br />
T� 1<br />
tct<br />
(1 + r(t, x)) t+1<br />
t=1<br />
wt =<br />
= −<br />
T�<br />
t=1<br />
∂r(t, x)<br />
∂x<br />
twt ∂r(t, x)<br />
1 + r(t, x) ∂x<br />
ct<br />
(1 + r(t, x)) t<br />
1<br />
PV<br />
We want to try <strong>and</strong> generalize the ’investment horizon’ interpretation of<br />
duration, <strong>and</strong> hence calculate the future value of the payment stream at<br />
time H <strong>and</strong> differentiate with respect to x. Assume that the current term<br />
structure is r(·, x0).<br />
FV (c; r(H, x0), H) = (1 + r(H, x0)) H PV (c; r(t, x0))<br />
Differentiating we get<br />
∂<br />
∂PV<br />
FV (c; r(H, x), H) = (1 + r(H, x))H<br />
∂x ∂x<br />
+H(1 + r(H, x))<br />
H−1∂r(H, x)<br />
PV (c; r(t, x))<br />
∂x<br />
Evaluate this derivative at x = x0 <strong>and</strong> set it equal to 0 :<br />
�<br />
∂PV �<br />
�<br />
∂x<br />
�<br />
1 ∂r(H, x) �<br />
= −H �<br />
PV ∂x<br />
(1 + r(H, x0)) −1<br />
� x=x0<br />
� x=x0<br />
<strong>and</strong> hence we could define the duration corresponding to the given parametrization<br />
as the value D <strong>for</strong> which<br />
�<br />
�<br />
∂PV �<br />
�<br />
1 ∂r(D, x) �<br />
= −D � (1 + r(D, x0))<br />
∂x PV ∂x<br />
−1 .<br />
� x=x0<br />
� x=x0<br />
The additive case would correspond to<br />
�<br />
∂r(D, x) �<br />
� = 1,<br />
∂x<br />
<strong>and</strong> the multiplicative case to<br />
∂r(D, x)<br />
∂x<br />
�<br />
�<br />
�<br />
� x=1<br />
� x=0<br />
= 1 + yD.
3.5. DURATION, CONVEXITY AND IMMUNIZATION. 37<br />
Note that the multiplicative case gives us the duration measure (called the<br />
Fisher-Weil duration)<br />
Dmult = − ∂PV<br />
∂x<br />
1<br />
PV =<br />
T�<br />
twt<br />
which is just like the original measure although the weights of course reflect<br />
the structure y(0, t).<br />
Example 10 (Macaulay vs. Fisher-Weil) Consider again the small bond<br />
market from Example 4. We have already found the zero-coupon yields in<br />
the market, <strong>and</strong> find that the Fisher-Weil duration of the 4 yr serial bond is<br />
�<br />
1 32 2 ∗ 30.25 3 ∗ 28.5 4 ∗ 26.75<br />
+ + +<br />
102.38 1.0500 1.05502 1.06003 1.06504 �<br />
= 2.342,<br />
<strong>and</strong> the following table gives the yields, Macaulay durations based on yields<br />
<strong>and</strong> Fisher-Weil durations <strong>for</strong> all the coupon bonds:<br />
t=1<br />
Bond Yield ( ) M-duration FW-duration<br />
1 yr bullet 5 1 1<br />
2 yr bullet 5.49 1.952 1.952<br />
3 yr annuity 5.65 1.963 1.958<br />
4 yr serial 5.93 2.354 2.342<br />
So not much difference.<br />
Similarly, the Fisher-Weil duration of the bullet bond from Examples 5, 6<br />
<strong>and</strong> 9 is 4.552, whereas its Macaulay duration was 4.556.<br />
3.5.3 The Barbell: Messing with your head<br />
We finish this chapter with an example (with something usually referred to<br />
as a barbell strategy) which is intended to cause some concern. Some of the<br />
claims are <strong>for</strong> you to check!<br />
A financial institution issues 100 million $ worth of 10 year bullet bonds<br />
with time to maturity 10 years <strong>and</strong> a coupon rate of 7 percent. Assume that<br />
the term structure is flat at r = 7 percent. The revenue (of 100 million $) is<br />
used to purchase 10-<strong>and</strong> 20 year annuities also with coupon rates of 7%. The<br />
numbers of the 10 <strong>and</strong> 20 year annuities purchased are chosen in such a way<br />
that the duration of the issued bullet bond matches that of the portfolio of<br />
annuities. Now there are three facts you need to know at this stage. Letting<br />
T denote time to maturity, r the level of the term structure <strong>and</strong> γ the coupon<br />
rate, we have that the duration of an annuity is given by<br />
duration,<br />
Fisher-Weil<br />
barbell strategy
38 CHAPTER 3. PAYMENT STREAMS UNDER CERTAINTY<br />
Dann =<br />
1 + r<br />
r −<br />
T<br />
(1 + r) T − 1 .<br />
Note that since payments on an annuity are equal in all periods we need not<br />
know the size of the payments to calculate the duration.<br />
The duration of a bullet bond is<br />
Dbullet =<br />
1 + r<br />
r<br />
− 1 + r − T(r − R)<br />
R ((1 + r) T − 1) + r<br />
which of course simplifies when r = R.<br />
The third fact you need to check is that if a portfolio consists of two<br />
securities whose values are P1 <strong>and</strong> P2 respectively, then the duration of the<br />
portfolio P1 + P2 is given as<br />
D(P1 + P2 ) = P1<br />
P1 + P2<br />
D(P1) + P2<br />
P1 + P2<br />
D(P2).<br />
Using these three facts you will note that a portfolio consisting of 23.77<br />
million dollars worth of the 10-year annuity <strong>and</strong> 76.23 million dollars worth of<br />
the 20-year annuity will produce a portfolio whose duration exactly matches<br />
that of the issued bullet bond. By construction the present value of the two<br />
annuities equals that of the bullet bond. The present value of the whole<br />
transaction in other words is 0 at an interest level of 7 percent. However,<br />
<strong>for</strong> all other levels of the interest rate, the present value is strictly positive!<br />
In other words, any change away from 7 percent will produce a profit to the<br />
financial institution. We will have more to say about this phenomenon in<br />
the exercises <strong>and</strong> we will return to it when discussing the term structure of<br />
interest rates in models with uncertainty. As you will see then, the reason<br />
that we can construct the example above is that we have set up an economy<br />
in which there are arbitrage opportunities.
Chapter 4<br />
Arbitrage pricing in a<br />
one-period model<br />
One of the biggest success stories of financial economics is the Black-Scholes<br />
model of option pricing. But even though the <strong>for</strong>mula itself is easy to use,<br />
a rigorous presentation of how it comes about requires some fairly sophisticated<br />
mathematics. Fortunately, the so-called binomial model of option<br />
pricing offers a much simpler framework <strong>and</strong> gives almost the same level of<br />
underst<strong>and</strong>ing of the way option pricing works. Furthermore, the binomial<br />
model turns out to be very easy to generalize (to so-called multinomial models)<br />
<strong>and</strong> more importantly to use <strong>for</strong> pricing other derivative securities (i.e.<br />
different contract types or different underlying securities) where an extension<br />
of the Black-Scholes framework would often turn out to be difficult. The flexibility<br />
of binomial models is the main reason why these models are used daily<br />
in trading all over the world.<br />
Binomial models are often presented separately <strong>for</strong> each application. For<br />
example, one often sees the ”classical” binomial model <strong>for</strong> pricing options on<br />
stocks presented separately from binomial term structure models <strong>and</strong> pricing<br />
of bond options etc.<br />
The aim of this chapter is to present the underlying theory at a level<br />
of abstraction which is high enough to underst<strong>and</strong> all binomial/multinomial<br />
approaches to the pricing of derivative securities as special cases of one model.<br />
Apart from the obvious savings in allocation of brain RAM that this provides,<br />
it is also the goal to provide the reader with a language <strong>and</strong> framework<br />
which will make the transition to continuous-time models in future courses<br />
much easier.<br />
39<br />
binomial model<br />
option pricing
inomial model,<br />
one-period<br />
stock<br />
money market account—“seebank<br />
account<br />
bank account<br />
call option,<br />
European<br />
40 CHAPTER 4. ARBITRAGE PRICING IN A ONE-PERIOD MODEL<br />
4.1 An appetizer.<br />
Be<strong>for</strong>e we introduce our model of a financial market with uncertainty <strong>for</strong>mally,<br />
we present a little appetizer. Despite its simplicity it contains most<br />
of the insights that we are about to get in this chapter.<br />
Consider a one-period model with two states of nature, ω1 <strong>and</strong> ω2. At<br />
time t = 0 nothing is known about the time state, at time t = 1 the state is<br />
revealed. State ω1 occurs with probability p. Two securities are traded:<br />
• A stock which costs S at time 0 <strong>and</strong> is worth uS at time 1 in one state<br />
<strong>and</strong> dS in the other. 1<br />
• A money market account or bank account which costs 1 at time 0 <strong>and</strong><br />
is worth R at time 1 regardless of the state.<br />
Assume 0 < d < R < u. (This condition will be explained later.) We<br />
summarize the setup with a graph:<br />
� 1<br />
S<br />
�<br />
�✟ ✟✟✟✟✟✟✟✟✟✟✟<br />
p<br />
❍<br />
❍❍❍❍❍❍❍❍❍❍❍�<br />
1 − p<br />
�<br />
� R<br />
uS<br />
� R<br />
dS<br />
Now assume that we introduce into the economy a European call option<br />
(the term “European” is used <strong>for</strong> historical reasons; it has no particular<br />
meaning today, <strong>and</strong> it is doubtful if it ever had) on the stock with exercise<br />
(or strike) price K <strong>and</strong> expiry (sometimes called maturity, although this is<br />
1 We use stock as a generic term <strong>for</strong> a risky asset whose stochastic price behaviour we<br />
mostly (with Chapter 11 as the notable exception) take as given. Words such as “share”<br />
or “equity” are largely synonymous.<br />
�<br />
�
4.1. AN APPETIZER. 41<br />
primarily used <strong>for</strong> bonds) 1. At time 1 the value of this call is equal to (where<br />
the notation [y] + (or sometimes (y) + ) means max(y, 0))<br />
� +<br />
[uS − K] if ω = ω1<br />
C1(ω) =<br />
[dS − K] + if ω = ω2<br />
We will discuss options in more detail later. For now, note that it can be<br />
thought of as a contract giving the owner the right but not the obligation to<br />
buy the stock at time 1 <strong>for</strong> K.<br />
To simplify notation, let Cu = C1(ω1) <strong>and</strong> Cd = C1(ω2). The question is:<br />
What should the price of this call option be at time 0? A simple replication<br />
argument will give the answer: Let us try to <strong>for</strong>m a portfolio at time 0 using<br />
only the stock <strong>and</strong> the money market account which gives the same payoff<br />
as the call at time 1 regardless of which state occurs. Let (a, b) denote,<br />
respectively, the number of stocks <strong>and</strong> units of the money market account<br />
held at time 0. If the payoff at time 1 has to match that of the call, we must<br />
have<br />
a(uS) + bR = Cu<br />
a(dS) + bR = Cd<br />
Subtracting the second equation from the first we get<br />
i.e.<br />
<strong>and</strong> algebra gives us<br />
a(u − d)S = Cu − Cd<br />
a = Cu − Cd<br />
S(u − d)<br />
b = 1 uCd − dCu<br />
R (u − d)<br />
where we have used our assumption that u > d. The cost of <strong>for</strong>ming the<br />
portfolio (a, b) at time 0 is<br />
(Cu − Cd) 1 uCd − dCu<br />
S + · 1<br />
S (u − d) R (u − d)<br />
= R (Cu − Cd) 1 uCd − dCu<br />
+<br />
R (u − d) R (u − d)<br />
= 1<br />
�<br />
R − d<br />
R u − d Cu<br />
u − R<br />
+<br />
u − d Cd<br />
�<br />
.<br />
$(“cdot)ˆ+$notation<br />
replication
42 CHAPTER 4. ARBITRAGE PRICING IN A ONE-PERIOD MODEL<br />
We will <strong>for</strong>mulate below exactly how to define the notion of no arbitrage<br />
when there is uncertainty, but it should be clear that the argument we have<br />
just given shows why the call option must have the price<br />
C0 = 1<br />
�<br />
R − d<br />
R u − d Cu<br />
u − R<br />
+<br />
u − d Cd<br />
�<br />
Rewriting this expression we get<br />
<strong>and</strong> if we let<br />
we get<br />
C0 =<br />
� R − d<br />
u − d<br />
� Cu<br />
R +<br />
q =<br />
R − d<br />
u − d<br />
� �<br />
u − R Cd<br />
u − d R<br />
C0 = q Cu<br />
+ (1 − q)Cd<br />
R R .<br />
If the price were lower, one could buy the call <strong>and</strong> sell the portfolio (a, b),<br />
receive cash now as a consequence <strong>and</strong> have no future obligations except to<br />
exercise the call if necessary.<br />
Some interesting features of this example will be much clearer as we go<br />
along:<br />
• The probability p plays no role in the expression <strong>for</strong> C0.<br />
• A new set of probabilities<br />
q =<br />
R − d<br />
u − d<br />
<strong>and</strong> 1 − q =<br />
u − R<br />
u − d<br />
emerges (this time we also use that d < R < u) <strong>and</strong> with this set of<br />
probabilities we may write the value of the call as<br />
C0 = E q<br />
� �<br />
C1(ω)<br />
R<br />
i.e. an expected value using q of the discounted time 1 value of the<br />
call.<br />
• If we compute the expected value using q of the discounted time 1 stock<br />
price we find<br />
E q<br />
� � � � � �<br />
S(ω) R − d 1 u − R 1<br />
= (uS) + (dS) = S<br />
R u − d R u − d R<br />
The method of pricing the call really did not use the fact that Cu <strong>and</strong> Cd<br />
were call-values. Any security with a time 1 value depending on ω1 <strong>and</strong> ω2<br />
could have been priced.
4.2. THE SINGLE PERIOD MODEL 43<br />
4.2 The single period model<br />
The mathematics used when considering a one-period financial market with<br />
uncertainty is exactly the same as that used to describe the bond market in<br />
a multiperiod model with certainty: Just replace dates by states.<br />
Given two time points t = 0 <strong>and</strong> t = 1 <strong>and</strong> a finite state space<br />
Ω = {ω1, . . .,ωS}.<br />
Whenever we have a probability measure P (or Q) we write pi (or qi) instead<br />
of P ({ωi}) (or Q ({ωi})).<br />
A financial market or a security price system consists of a vector π ∈ R N<br />
<strong>and</strong> an N ×S matrix D where we interpret the i’th row (di1, . . .,diS) of D as<br />
the payoff at time 1 of the i’th security in states 1, . . ., S, respectively. The<br />
price at time 0 of the i’th security is πi. A portfolio is a vector θ ∈ R N whose<br />
coordinates represent the number of securities bought at time 0. The price<br />
of the portfolio θ bought at time 0 is π · θ.<br />
Definition 18 An arbitrage in the security price system (π, D) is a portfolio<br />
θ which satisfies either<br />
or<br />
π · θ ≤ 0 ∈ R <strong>and</strong> D ⊤ θ > 0 ∈ R S<br />
π · θ < 0 ∈ R <strong>and</strong> D ⊤ θ ≥ 0 ∈ R S<br />
A security price system (π, D) <strong>for</strong> which no arbitrage exists is called arbitragefree.<br />
Remark 1 Our conventions when using inequalities on a vector in R k are<br />
the same as described in Chapter 3.<br />
When a market is arbitrage-free we want a vector of prices of ’elementary<br />
securities’ - just as we had a vector of discount factors in Chapter 3.<br />
Definition 19 ψ ∈ R S ++ (i.e. ψ ≫ 0) is said to be a state-price vector <strong>for</strong><br />
the system (π, D) if it satisfies<br />
π = Dψ<br />
Sometimes ψ is called a state-price density, or its elements referred to as<br />
Arrow-Debreu-prices <strong>and</strong> the term Arrow-Debreu attached to the elementary<br />
securities . Clearly, we have already proved the following in Chapter 3:<br />
probability<br />
measure<br />
financial market<br />
security price<br />
system<br />
portfolio<br />
arbitrage<br />
opportunity<br />
state-price vector<br />
Arrow-Debreu<br />
prices
iskfree asset<br />
redundant<br />
44 CHAPTER 4. ARBITRAGE PRICING IN A ONE-PERIOD MODEL<br />
Proposition 6 A security price system is arbitrage-free if <strong>and</strong> only if there<br />
exists a state-price vector.<br />
Unlike the model we considered in Chapter 3, the security which pays 1<br />
in every state plays a special role here. If it exists, it allows us to speak of<br />
an ’interest rate’:<br />
Definition 20 The system (π, D) contains a riskfree asset if there exists a<br />
linear combination of the rows of D which gives us (1, . . .,1) ∈ R S .<br />
In an arbitrage-free system the price of the riskless asset d0 is called the<br />
discount factor <strong>and</strong> R0 ≡ 1 is the return on the riskfree asset. Note that<br />
d0<br />
when a riskfree asset exists, <strong>and</strong> the price of obtaining it is d0, we have<br />
d0 = θ ⊤<br />
0 π = θ⊤0<br />
Dψ = ψ1 + · · · + ψS where θ0 is the portfolio that constructs the riskfree asset.<br />
Now define<br />
qi = ψi , i = 1, . . .,S<br />
d0<br />
Clearly, qi > 0 <strong>and</strong> � S<br />
i=1 qi = 1, so we may interpret the qi’s as probabilities.<br />
We may now rewrite the identity (assuming no arbitrage) π = Dψ as follows:<br />
π = d0Dq = 1<br />
R0<br />
Dq, where q = (q1, . . .,qS) ⊤<br />
If we read this coordinate by coordinate it says that<br />
πi = 1<br />
R0<br />
(q1di1 + . . . + qSdiS)<br />
which is the discounted expected value using q of the i’th security’s payoff<br />
at time 1. Note that since R0 is a constant we may as well say ”expected<br />
discounted . . .”.<br />
We assume throughout the rest of this section that a riskfree asset exists.<br />
Definition 21 A security c = (c1, . . .,cS) is redundant given the security<br />
price system (π, D) if there exists a portfolio θc such that D t θc = c.<br />
Proposition 7 Let an arbitrage-free � system (π, D) <strong>and</strong> a redundant security<br />
c by given. The augmented system �π, � �<br />
D obtained by adding πc to the vector<br />
π <strong>and</strong> c ∈ R S as a row of D is arbitrage-free if <strong>and</strong> only if<br />
πc = 1<br />
R0<br />
(q1c1 + . . . + qScS) ≡ ψ 1c1 + . . . + ψ ScS.
4.2. THE SINGLE PERIOD MODEL 45<br />
Proof. Assume πc < ψ 1c1 + . . . + ψ ScS. Buy the security c <strong>and</strong> sell the<br />
portfolio θc. The price of θc is by assumption higher than πc, so we receive<br />
a positive cash-flow now. The cash-flow at time 1 is 0. Hence there is an<br />
arbitrage opportunity. If πc > ψ 1c1 + . . . + ψ ScS reverse the strategy. �<br />
Definition 22 The market is complete if <strong>for</strong> every y ∈ R S there exists a<br />
θ ∈ R N such that<br />
D ⊤ θ = y<br />
i.e. if the rows of D (the columns of D ⊤ ) span R S .<br />
Proposition 8 If the market is complete <strong>and</strong> arbitrage-free, there exists precisely<br />
one state-price vector ψ.<br />
The proof is exactly as in Chapter 3 <strong>and</strong> we are ready to price new<br />
securities in the financial market; also known as pricing of contingent claim. 2<br />
Here is how it is done in a one-period model: Construct a set of securities<br />
(the D-matrix,) <strong>and</strong> a set of prices. Make sure that (π, D) is arbitrage-free.<br />
Make sure that either<br />
(a) the model is complete, i.e. there are as many linearly independent<br />
securities as there are states<br />
or<br />
(b) the contingent claim we wish to price is redundant given (π, D).<br />
Clearly, (a) implies (b) but not vice versa. (a) is almost always what is<br />
done in practice. Given a contingent claim c = (c1, . . .,cS). Now compute<br />
the price of the contingent claim as<br />
π (c) = 1<br />
R0<br />
E q (c) ≡ 1<br />
R0<br />
S�<br />
i=1<br />
qici<br />
(4.1)<br />
where qi = ψ i<br />
d0 ≡ R0ψ i. The method in Equation (4.1) (<strong>and</strong> the generalizations<br />
of it we’ll meet in Chapters 5 <strong>and</strong> 6) is often called risk-neutral pricing.<br />
Arbitrage-free prices are calculated as discounted expected values (with some<br />
new or artificial probabilities, the q’s), ie. as if agents were risk-neutral. But<br />
the “as if” is important to note. No assumption of actual agent risk-neutrality<br />
is use to derive (4.1), just (slightly implicitly, but spelled out more in the<br />
next section) that they prefer more to less. As a catch-phrase: Risk-neutral<br />
2 A contingent claim just a r<strong>and</strong>om variable describing pay-offs; the pay-off is contingent<br />
on ω. The term (financial) derivative (asset, contract, or security) is largely synonymous,<br />
except that we are usually more specific about the pay-off being contingent on another<br />
financial asset such as a stock. We say option, we have even more specific pay-off structures<br />
in mind.<br />
complete market<br />
contingent claim<br />
risk-neutral<br />
pricing
46 CHAPTER 4. ARBITRAGE PRICING IN A ONE-PERIOD MODEL<br />
risk-neutrality pricing does not assume risk-neutrality. Skeptics will say that the assumption<br />
risk-neutrality has just been substituted with the less transparent one<br />
of market completeness.<br />
The portfolio generating the claim is the solution to D ⊤ θc = c, <strong>and</strong> since<br />
we can always in a complete model reduce the matrix to an S × S invertible<br />
matrix without changing the model this can be done by matrix inversion.<br />
(And, might the skeptics add , an ”obviously unrealistic” assumption of<br />
costless trading that is especially critical <strong>for</strong> the multiperiod model.)<br />
Let us return to our example in the beginning of this chapter: The security<br />
price system is<br />
�� 1<br />
S<br />
� �<br />
R R<br />
,<br />
uS dS<br />
��<br />
.<br />
For this to be arbitrage-free, proposition (6) tells us that there must be a<br />
solution (ψ 1, ψ 2) with ψ 1 > 0 <strong>and</strong> ψ 2 > 0 to the equation<br />
� 1<br />
S<br />
�<br />
=<br />
� R R<br />
uS dS<br />
� � ψ1<br />
� �<br />
R R<br />
u �= d ensures that the matrix has full rank. u > d can be<br />
uS dS<br />
assumed without loss of generality. We find<br />
ψ 1 =<br />
ψ 2 =<br />
R − d<br />
R (u − d)<br />
u − R<br />
R (u − d)<br />
<strong>and</strong> note that the solution is strictly positive precisely when u > R > d<br />
(given our assumption that u > d > 0).<br />
Clearly the riskfree asset has a return of R, <strong>and</strong><br />
q1 = Rψ 1 =<br />
q2 = Rψ 2 =<br />
R − d<br />
u − d<br />
u − R<br />
u − d<br />
are the probabilities defining the measure q which can be used <strong>for</strong> pricing.<br />
Note that the market is complete, <strong>and</strong> this explains why we could use the<br />
procedure in the previous example to say what the correct price at time 0 of<br />
any claim (c1, c2) should be.<br />
ψ 2<br />
�<br />
.
4.3. THE ECONOMIC INTUITION 47<br />
4.3 The economic intuition<br />
At first, it may seem surprising that the ’objective’ probability p does not<br />
enter into the expression <strong>for</strong> the option price. Even if the the probability is<br />
0.99 making the probability of the option paying out a positive amount very<br />
large, it does not alter the option’s price at time 0. Looking at this problem<br />
from a mathematical viewpoint, one can just say that this is a consequence of<br />
the linear algebra of the problem: The cost of <strong>for</strong>ming a replicating strategy<br />
does not depend on the probability measure <strong>and</strong> there<strong>for</strong>e it does not enter<br />
into the contract. But this argument will not (<strong>and</strong> should not) convince a<br />
person who is worried by the economic interpretation of a model. Addressing<br />
the problem from a purely mathematical angle leaves some very important<br />
economic intuition behind. We will try in this section to get the economic<br />
intuition behind this ’invariance’ to the choice of p straight. This will provide<br />
an opportunity to outline how the financial markets studied in this course fit<br />
in with a broader microeconomic analysis.<br />
Be<strong>for</strong>e the more <strong>for</strong>mal approach, here is the story in words: If we argue<br />
(erroneously) that changing p ought to change the option’s price at time 0,<br />
the same argument should also lead to a suggested change in S0. But the<br />
experiment involving a change in p is an experiment which holds S0 fixed.<br />
The given price of the stock is supposed to represent a ’sensible’ model of the<br />
market. If we change p without changing S0 we are implicitly changing our<br />
description of the underlying economy. An economy in which the probability<br />
of an up jump p is increased to 0.99 while the initial stock price remains<br />
fixed must be a description of an economy in which payoff in the upstate has<br />
lost value relative to a payoff in the downstate. These two opposite effects<br />
precisely offset each other when pricing the option.<br />
The economic model we have in mind when studying the financial market<br />
is one in which utility is a function of wealth in each state <strong>and</strong> wealth is<br />
measured by a scalar (kroner, dollars, . . .). Think of the financial market<br />
as a way of transferring money between different time periods <strong>and</strong> different<br />
states. A real economy would have a (spot) market <strong>for</strong> real goods also (food,<br />
houses, TV-sets, . . .) <strong>and</strong> perhaps agents would have known endowments of<br />
real goods in each state at each time. If the spot prices of real goods which<br />
are realized in each state at each future point in time are known at time 0,<br />
then we may as well express the initial endowment in terms of wealth in each<br />
state. Similarly, the optimal consumption plan is associated with a precise<br />
transfer of wealth between states which allows one to realize the consumption<br />
plan. So even if utility is typically a function of the real goods (most people<br />
like money because of the things it allows them to buy), we can <strong>for</strong>mulate<br />
the utility as a function of the wealth available in each state.
utility function<br />
equilibrium<br />
state-price vector<br />
48 CHAPTER 4. ARBITRAGE PRICING IN A ONE-PERIOD MODEL<br />
Consider3 an agent who has an endowment e = (e1, . . .,eS) ∈ RS + . This<br />
vector represents the r<strong>and</strong>om wealth that the agent will have at time 1. The<br />
agent has a utility function U : R S +<br />
→ R which we assume to be concave,<br />
differentiable <strong>and</strong> strictly increasing in each coordinate. Given a financial<br />
market represented by the pair (π, D), the agent’s problem is<br />
max<br />
θ U(e + D⊤ θ) (4.2)<br />
s.t. π ⊤ θ ≤ 0.<br />
If we assume that there exists a security with a non-negative payoff which<br />
is strictly positive in at least one state, then because the utility function<br />
is increasing we can replace the inequality in the constraint by an equality.<br />
And then the interpretation is simply that the agent sells endowment in some<br />
states to obtain more in other states. But no cash changes h<strong>and</strong>s at time 0.<br />
Note that while utility is defined over all (non-negative) consumption vectors,<br />
it is the rank of D which decides in which directions the consumer can move<br />
away from the initial endowment.<br />
Now make sure that you can prove the following<br />
Proposition 9 If there exists a portfolio θ with D ⊤ θ > 0 then the agent can<br />
find a solution to the maximization problem if <strong>and</strong> only if (π, D) is arbitragefree.<br />
The ’only if’ part of this statement shows how no arbitrage is a necessary<br />
condition <strong>for</strong> existence of a solution to the agent’s problem <strong>and</strong> hence <strong>for</strong> the<br />
existence of equilibrium <strong>for</strong> economies where agents have increasing utility<br />
(no continuity assumptions are needed here). The ’if’ part uses continuity<br />
<strong>and</strong> compactness (why?) to ensure existence of a maximum, but of course to<br />
discuss equilibrium would require more agents <strong>and</strong> then we need some more<br />
of our general equilibrium apparatus to prove existence.<br />
The important insight is the following (see Proposition 1C in Duffie<br />
(1996)):<br />
Proposition 10 Assume that there exists a portfolio θ with D ⊤ θ > 0. If<br />
there exists a solution θ ∗ to (4.2) <strong>and</strong> the associated optimal consumption<br />
is given by c ∗ := e + D ⊤ θ ∗ >> 0, then the gradient ∇U(c ∗ ) (thought of<br />
as a column vector) is proportional to a state-price vector. The constant of<br />
proportionality is positive.<br />
3 This closely follows Darrell Duffie: Dynamic Asset Pricing Theory. Princeton Univer-<br />
sity Press. 1996
4.3. THE ECONOMIC INTUITION 49<br />
Proof. Since c ∗ is strictly positive, then <strong>for</strong> any portfolio θ there exists<br />
some k(θ) such that c ∗ + αD ⊤ θ ≥ 0 <strong>for</strong> all α in [−k(θ), k(θ)]. Define<br />
as<br />
gθ : [−k(θ), k(θ)] → R<br />
gθ(α) = U(c ∗ + αD ⊤ θ)<br />
Now consider a θ with π ⊤ θ = 0. Since c ∗ is optimal, gθ must be maximized<br />
at α = 0 <strong>and</strong> due to our differentiability assumptions we must have<br />
g ′ θ(0) = (∇U(c ∗ )) ⊤ D ⊤ θ = 0.<br />
We can conclude that any θ with π ⊤ θ = 0 satisfies (∇U(c ∗ )) ⊤ D ⊤ θ = 0. Transposing<br />
the last expression, we may also write θ ⊤ D∇U(c ∗ ) = 0. In words, any<br />
vector which is orthogonal to π is also orthogonal to D∇U(c ∗ ). This means<br />
that µπ = D∇U(c ∗ ) <strong>for</strong> some µ showing that ∇U(c ∗ ) is proportional to a<br />
state-price vector. Choosing a θ + with D ⊤ θ + > 0 we know from no arbitrage<br />
that π ⊤ θ + > 0 <strong>and</strong> from the assumption that the utility function is strictly<br />
increasing, we have ∇U(c ∗ )D ⊤ θ + > 0. Hence µ must be positive.<br />
To underst<strong>and</strong> the implications of this result we turn to the special case<br />
where the utility function has an expected utility representation, i.e. where<br />
we have a set of probabilities (p1, . . .,pS) <strong>and</strong> a function u such that<br />
U(c) =<br />
S�<br />
piu(ci).<br />
i=1<br />
In this special case we note that the coordinates of the state-price vector<br />
satisfy<br />
ψ i = λpiu ′ (c ∗ i), i = 1, . . .,S. (4.3)<br />
where λ is some constant of proportionality. Now we can state the economic<br />
intuition behind the option example as follows (<strong>and</strong> it is best to think of<br />
a complete market to avoid ambiguities in the interpretation): Given the<br />
complete market (π, D) we can find a unique state price vector ψ. This state<br />
price vector does not depend on p. Thus if we change p <strong>and</strong> we are thinking<br />
of some agent out there ’justifying’ our assumptions on prices of traded<br />
securities, it must be the case that the agent has different marginal utilities<br />
associated with optimal consumption in each state. The difference must<br />
offset the change in p in such a way that (4.3) still holds. We can think<br />
of this change in marginal utility as happening in two ways: One way is to<br />
change utility functions altogether. Then starting with the same endowment<br />
marginal utility
50 CHAPTER 4. ARBITRAGE PRICING IN A ONE-PERIOD MODEL<br />
the new utility functions would offset the change in probabilities so that the<br />
equality still holds. Another way to think of state prices as being fixed with<br />
new probabilities but utility functions unchanged, is to think of a different<br />
value of the initial endowment. If the endowment is made very large in one<br />
state <strong>and</strong> very small in the other, then this will offset the large change in<br />
probabilities of the two states. The analysis of the single agent can be carried<br />
over to an economy with many agents with suitable technical assumptions.<br />
Things become particularly easy when the equilibrium can be analyzed by<br />
considering the utility of a single, ’representative’ agent, whose endowment<br />
is the sum of all the agents’ endowments. An equilibrium then occurs only if<br />
this representative investor has the initial endowment as the solution to the<br />
utility maximization problem <strong>and</strong> hence does not need to trade in the market<br />
with the given prices. In this case the aggregate endowment plays a crucial<br />
role. Increasing the probability of a state while holding prices <strong>and</strong> the utility<br />
function of the representative investor constant must imply that the aggregate<br />
endowment is different with more endowment (low marginal utility) in<br />
the states with high probability <strong>and</strong> low endowment (high marginal utility)<br />
in the states with low probability. This intuition is very important when we<br />
discuss the Capital Asset Pricing Model later in the course.<br />
A market where we are able to separate out the financial decisions as<br />
above is the one we will have in our mind throughout this course. But do keep<br />
in mind that this leaves out many interesting issues in the interaction between<br />
real markets <strong>and</strong> financial markets. For example, it is easy to imagine that an<br />
incomplete financial market (i.e. one which does not allow any distribution<br />
of wealth across states <strong>and</strong> time periods) makes it impossible <strong>for</strong> agents to<br />
realize consumption plans that they would find optimal in a complete market.<br />
This in turn may change equilibrium prices on real markets because it changes<br />
investment behavior. For example, returning to the house market, the fact<br />
that financial markets allows young agents to borrow against future income,<br />
makes it possible <strong>for</strong> more consumers to buy a house early in their lives. If<br />
all of a sudden we removed the possibility of borrowing we could imagine<br />
that house prices would drop significantly, since the dem<strong>and</strong> would suddenly<br />
decrease.
Chapter 5<br />
Arbitrage pricing in the<br />
multi-period model<br />
5.1 An appetizer<br />
It is fair to argue that to get realism in a model with finite state space we<br />
need the number of states to be large. After all, why would the stock take<br />
on only two possible values at the expiration date of the option? On the<br />
other h<strong>and</strong>, we know from the previous section that in a model with many<br />
states we need many securities to have completeness, which (in arbitrage-free<br />
models) is a requirement <strong>for</strong> pricing every claim. And if we want to price<br />
an option using only the underlying stock <strong>and</strong> a money market account, we<br />
only have two securities to work with. Fortunately, there is a clever way out<br />
of this.<br />
Assume that over a short time interval the stock can only move to two<br />
different values <strong>and</strong> split up the time interval between 0 <strong>and</strong> T (the expiry<br />
date of an option) into small intervals in which the stock can be traded.<br />
Then it turns out that we can have both completeness <strong>and</strong> there<strong>for</strong>e arbitrage<br />
pricing even if the number of securities is much smaller than the number of<br />
states. Again, be<strong>for</strong>e we go into the mathematics, we give an example to<br />
help with the intuition.<br />
Assume that Ω = {ω1, ω2, ω3, ω4} <strong>and</strong> that there are three dates: t ∈<br />
{0, 1, 2}. We specify the behavior of the stock <strong>and</strong> the money market account<br />
as follows: Assume that 0 < d < R < u <strong>and</strong> that S > 0. Consider the<br />
following graph:<br />
51<br />
multi-period<br />
model
call option,<br />
European<br />
52CHAPTER 5. ARBITRAGE PRICING IN THE MULTI-PERIOD MODEL<br />
� 1<br />
S<br />
�<br />
� R<br />
uS<br />
✜ ✜✜✜✜<br />
❭<br />
❭❭❭❭<br />
�<br />
R<br />
dS<br />
�<br />
�<br />
� R 2<br />
u 2 S<br />
★ ★★★<br />
❝<br />
❝❝❝ �<br />
2 R<br />
duS<br />
★ ★★★<br />
❝<br />
❝❝❝ �<br />
2 R<br />
�<br />
�<br />
udS<br />
�<br />
2 R<br />
�<br />
d 2 S<br />
t=0 t=1 t=2<br />
�<br />
State<br />
At time 0 the stock price is S, the bank account is worth 1. At time 1,<br />
if the state of the world is ω1 or ω2, the prices are uS <strong>and</strong> R , respectively,<br />
whereas if the true state is ω3 or ω4, the prices are dS <strong>and</strong> R. And finally,<br />
at time t = 2, the prices of the two instruments are as shown in the figure<br />
above. Note that ω ∈ Ω describes a whole ”sample path” of the stock price<br />
process <strong>and</strong> the bank account, i.e. it tells us not only the final time 2 value,<br />
but the entire history of values up to time 2.<br />
Now suppose that we are interested in the price of a European call option<br />
on the stock with exercise price K <strong>and</strong> expity T = 2. At time 2, we know it<br />
is worth<br />
C2 (ω) = [S2 (ω) − K] +<br />
where S2 (ω) is the value of the stock at time 2 if the true state is ω.<br />
At time 1, if we are in state ω1 or ω2, the money market account is<br />
worth R <strong>and</strong> the stock is worth uS, <strong>and</strong> we know that there are only two<br />
possible time 2 values, namely (R 2 , u 2 S) or (R 2 , duS). But then we can use<br />
the argument of the one period example to see that at time 1 in state ω1 or<br />
ω2 we can replicate the calls payoff by choosing a suitable portfolio of stock<br />
<strong>and</strong> money market account: Simply solve the system:<br />
w1<br />
w2<br />
w3<br />
w4<br />
au 2 S + bR 2 = � u 2 S − K � + ≡ Cuu<br />
aduS + bR 2 = [duS − K] + ≡ Cdu
5.1. AN APPETIZER 53<br />
<strong>for</strong> (a, b) <strong>and</strong> compute the price of <strong>for</strong>ming the portfolio at time 1. We find<br />
The price of this portfolio is<br />
a = Cuu − Cdu<br />
uS (u − d) , b = uCdu − dCuu<br />
(u − d)R<br />
auS + bR = R (Cuu − Cdu)<br />
R<br />
= 1<br />
R<br />
2 .<br />
(u − d) + uCdu − dCuu<br />
(u − d)R<br />
�<br />
(R − d)<br />
(u − d) Cuu<br />
(u − R)<br />
+<br />
(u − d) Cud<br />
�<br />
=: Cu<br />
This is clearly what the call is worth at time t = 1 if we are in ω1<br />
or ω2, i.e. if the stock is worth uS at time 1. Similarly, we may define<br />
Cud := [udS − K] + (which is equal to Cdu) <strong>and</strong> Cdd = [d 2 S − K] + . And now<br />
we use the exact same argument to see that if we are in state ω3 or ω4, i.e.<br />
if the stock is worth dS at time 1, then at time 1 the call should be worth<br />
Cd where<br />
Cd := 1<br />
�<br />
(R − d)<br />
R (u − d) Cud<br />
(u − R)<br />
+<br />
(u − d) Cdd<br />
�<br />
.<br />
Now we know what the call is worth at time 1 depending on which state<br />
we are in: If we are in a state where the stock is worth uS, the call is worth<br />
Cu <strong>and</strong> if the stock is worth dS, the call is worth Cd.<br />
Looking at time 0 now, we know that all we need at time 1 to be able to<br />
”create the call”, is to have Cu when the stock goes up to uS <strong>and</strong> Cd when<br />
it goes down. But that we can accomplish again by using the one-period<br />
example: The cost of getting � � Cu is Cd<br />
C0 := 1<br />
�<br />
(R − d)<br />
R (u − d) Cu<br />
(u − R)<br />
+<br />
(u − d) Cd<br />
�<br />
.<br />
If we let q = R−d<br />
u−d <strong>and</strong> if we insert the expressions <strong>for</strong> Cu <strong>and</strong> Cd, noting<br />
that Cud = Cdu, we find that<br />
C0 = 1<br />
R2 �<br />
2<br />
q Cuu + 2q (1 − q)Cud + (1 − q) 2 �<br />
Cdd<br />
which the reader will recognize as a discounted expected value, just as in the<br />
one period example. (Note that the representation as an expected value does<br />
not hinge on Cud = Cdu.)<br />
The important thing to underst<strong>and</strong> in this example is the following: Starting<br />
out with the amount C0, an investor is able to <strong>for</strong>m a portfolio in the<br />
stock <strong>and</strong> the money market account which produces the payoffs Cu or Cd
eplication<br />
hedging<br />
derivative security<br />
in<strong>for</strong>mation<br />
filtration<br />
partition<br />
54CHAPTER 5. ARBITRAGE PRICING IN THE MULTI-PERIOD MODEL<br />
at time 1 depending on where the stock goes. Now without any additional<br />
costs, the investor can rearrange his/her portfolio at time 1, such that at<br />
time 2, the payoff will match that of the option. There<strong>for</strong>e, at time 0 the<br />
price of the option must be C0.<br />
This dynamic replication or hedging argument (If we create the pay-off<br />
of the call, we typically say that we replicate, when we create minus the call<br />
pay-off, we say hedge.) is the key to pricing derivative securities (another<br />
word <strong>for</strong> contingent claims) in discrete-time, finite state space models. We<br />
now want to underst<strong>and</strong> the mathematics behind this example.<br />
5.2 Price processes, trading <strong>and</strong> arbitrage<br />
Given a probability space (Ω, F, P) with Ω finite, let F := 2 Ω (i.e. the set of<br />
all subsets of Ω) <strong>and</strong> assume that P (ω) > 0 <strong>for</strong> all ω ∈ Ω. Also assume that<br />
there are T +1 dates, starting at date 0, ending at date T. To <strong>for</strong>malize how<br />
in<strong>for</strong>mation is revealed through time, we introduce the notion of a filtration:<br />
Definition 23 A filtration F = {Ft} T<br />
t=0 is an increasing sequence of σalgebras<br />
contained in F: F0 ⊆ F1 ⊆ . . . ⊆ FT.<br />
We will always assume that F0 = {∅, Ω} <strong>and</strong> FT = F. Since Ω is finite,<br />
it will be easy to think of the σ−algebras in terms of partitions:<br />
Definition 24 A partition Pt of Ω is a collection of non-empty subsets of<br />
Ω such that<br />
• � Pi∈PtPi = Ω<br />
• Pi ∩ Pj = ∅ whenever i �= j, Pi, Pj ∈ Pt.<br />
Because Ω is finite, there is a one-to-one correspondence between partitions<br />
<strong>and</strong> σ−algebras: The elements of Pt corresponds to the atoms of Ft.<br />
The concepts we have just defined are well illustrated in an event-tree:
5.2. PRICE PROCESSES, TRADING AND ARBITRAGE 55<br />
•✚ ✚✚✚•<br />
•<br />
•✓ ✓✓✓✓✓<br />
ξ<br />
•✚11<br />
❙<br />
❙❙❙❙❙<br />
✚✚✚<br />
❩<br />
❩❩❩<br />
• ξ12 ✚ ✚✚✚<br />
• •<br />
•✘ ✘✘✘<br />
•<br />
❳❳ ❳❳ •<br />
•✘ ✘✘✘<br />
•<br />
❳❳ ❳❳ •<br />
• •<br />
❩❩❩❩<br />
t = 0 t = 1 t = 2<br />
•<br />
t = 3<br />
ω1<br />
ω2<br />
ω3<br />
ω4<br />
ω5<br />
ω6<br />
ω7<br />
ω8<br />
ω9<br />
P0 P1 P2 P3<br />
The event tree illustrates the way in which we imagine in<strong>for</strong>mation about<br />
the true state being revealed over time. At time t = 1, <strong>for</strong> example, we may<br />
find ourselves in one of two nodes: ξ 11 or ξ 12. If we are in the node ξ 11, we<br />
know that the true state is in the set {ω1, ω2, . . .,ω5}, but we have no more<br />
knowledge than that. In ξ 12, we know (only) that ω ∈ {ω6, ω7, . . .,ω9}. At<br />
time t = 2 we have more detailed knowledge, as represented by the partition<br />
P2. Elements of the partition Pt are events which we can decide as having<br />
occurred or not occurred at time t, regardless of what the true ω is. At<br />
time 1, we will always know whether {ω1, ω2, . . .,ω5} has occurred or not,<br />
regardless of the true ω. If we are at node ξ 12, we would be able to rule out<br />
ω1<br />
ω2<br />
ω3<br />
ω4<br />
ω5<br />
ω6<br />
ω7<br />
ω8<br />
ω9<br />
ω1<br />
ω2<br />
ω3<br />
ω4<br />
ω5<br />
ω6<br />
ω7<br />
ω8<br />
ω9<br />
ω1<br />
ω2<br />
ω3<br />
ω4<br />
ω5<br />
ω6<br />
ω7<br />
ω8<br />
ω9<br />
ω1<br />
ω2<br />
ω3<br />
ω4<br />
ω5<br />
ω6<br />
ω7<br />
ω8<br />
ω9
measurable<br />
adapted process<br />
dividend process<br />
56CHAPTER 5. ARBITRAGE PRICING IN THE MULTI-PERIOD MODEL<br />
the event {ω1, ω2} also at time 1, but if we are at node ξ 11, we will not be<br />
able to decide whether this event has occurred or not. Hence {ω1, ω2} is not<br />
a member of the partition.<br />
Make sure you underst<strong>and</strong> the following:<br />
Remark 2 A r<strong>and</strong>om variable defined on (Ω, F, P) is measurable with respect<br />
to Ft precisely when it is constant on each member of Pt.<br />
A stochastic process X := (Xt)t=0,...,T is a sequence of r<strong>and</strong>om variables<br />
X0, X1, . . . , XT. The process is adapted to the filtration F if Xt is Ftmeasurable<br />
(which we will often write: Xt ∈ Ft) <strong>for</strong> t = 0, . . .,T. Returning<br />
to the event tree setup, it must be the case, <strong>for</strong> example, that X1(ω1) =<br />
X1(ω5) if X is adapted, but we may have X1(ω1) �= X1(ω6).<br />
Given an event tree, it is easy to construct adapted processes: Just assign<br />
the values of the process using the nodes of the tree. For example, at time<br />
1, there are two nodes ξ11 <strong>and</strong> ξ12. You can choose one value <strong>for</strong> X1 in ξ11 <strong>and</strong> another in ξ12. The value chosen in ξ11 will correspond to the value of<br />
X1 on the set {ω1, ω2, . . ., ω5}, the value chosen in ξ12 will correspond to<br />
the common value of X1 on the set {ω6, . . .,ω9}. When Xt is constant on an<br />
event At we will sometimes write Xt(At) <strong>for</strong> this value. At time 2 there are<br />
five different values possible <strong>for</strong> X2. The value chosen in the top node is the<br />
value of X2 on the set {ω1, ω2}.<br />
As we have just seen it is convenient to speak in terms of the event tree<br />
associated with the filtration. From now on we will refer to the event tree<br />
as the graph Ξ <strong>and</strong> use ξ to refer to the individual nodes. The notation<br />
p(ξ) will denote the probability of the event associated with ξ; <strong>for</strong> example<br />
P(ξ11) = P({ω1, ω2, . . .,ω5}). This graph Ξ will also allow us to identify<br />
adapted processes with vectors in RΞ . The following inner products on the<br />
space of adapted processes will become useful later: Let X, Y be adapted<br />
processes <strong>and</strong> define<br />
�<br />
�<br />
X(ξ)Y (ξ) ≡<br />
Xt(Au)Yt(Au)<br />
ξ∈Ξ<br />
{(t,Au):Au∈Pt,0≤t≤T }<br />
E �<br />
X(ξ)Y (ξ) ≡ �<br />
P(ξ)X(ξ)Y (ξ)<br />
ξ∈Ξ<br />
≡<br />
ξ∈Ξ<br />
�<br />
{(t,Au):Au∈Pt,0≤t≤T }<br />
P(Au)Xt(Au)Yt(Au)<br />
Now we are ready to model financial markets in multi-period models.<br />
Given is a vector of adapted dividend processes<br />
δ = (δ 1 , . . ., δ N )
5.2. PRICE PROCESSES, TRADING AND ARBITRAGE 57<br />
<strong>and</strong> a vector of adapted security price processes<br />
S = (S 1 , . . .,S N ).<br />
The interpretation is as follows: Si t (ω) is the price of security i at time t if the<br />
state is ω. Buying the i ′ th security at time t ensures the buyer (<strong>and</strong> obligates<br />
the seller to deliver) the remaining dividends δ i<br />
t+1<br />
, δi<br />
t+2<br />
, . . .,δi<br />
T .1 Hence the<br />
security price process is to be interpreted as an ex-dividend price process<br />
<strong>and</strong> in particular we should think of ST as 0. In all models considered in<br />
these notes we will also assume that there is a bank account which provides<br />
locally riskfree borrowing <strong>and</strong> lending. T his is modeled as follows: Given an<br />
adapted process - the short rate process<br />
ρ = (ρ 0, ρ 1, . . .,ρ T −1).<br />
To make the math work, all we need to assume about this process is that it<br />
is strictly greater than −1 at all times <strong>and</strong> in all states, but <strong>for</strong> modelling<br />
purposes it is desirable to have it non-negative. Now we may define the<br />
money market account as follows:<br />
Definition 25 The bank account has the security price process<br />
S 0 t<br />
<strong>and</strong> the dividend process<br />
δ 0<br />
= 1, t = 0, 1, . . ., T − 1<br />
S 0 T = 0.<br />
t(ω) = ρ t−1(ω) <strong>for</strong> all ω <strong>and</strong> t = 1, . . .,T − 1,<br />
δ 0<br />
T (ω) = 1 + ρ T −1(ω).<br />
This means that if you buy one unit of the money market account at time<br />
t you will receive a dividend of ρ t at time t + 1. Since ρ t is known already<br />
at time t, the dividend received on the money market account in the next<br />
period t + 1 is known at time t. Since the price is also known to be 1 you<br />
know that placing 1 in the money market account at time t, <strong>and</strong> selling the<br />
asset at time t + 1 will give you 1 + ρ t. This is why we refer to this asset as a<br />
locally riskfree asset. You may of course also choose to keep the money in the<br />
bank account <strong>and</strong> receive the stream of dividends. Reinvesting the dividends<br />
in the money market account will make this account grow according to the<br />
process R defined as<br />
Rt = (1 + ρ 0) · · ·(1 + ρ t−1).<br />
1 We will follow the tradition of probability theory <strong>and</strong> often suppress the ω in the<br />
notation.<br />
price process<br />
locally riskfree<br />
asset<br />
short rate process<br />
locally riskfree<br />
asset
trading strategy,<br />
£“phi£<br />
dividend stream;<br />
$“delta ˙0ˆ“phi$<br />
arbitrage<br />
opportunity<br />
self-financing<br />
trading strategy<br />
58CHAPTER 5. ARBITRAGE PRICING IN THE MULTI-PERIOD MODEL<br />
We will need this process to discount cash flows between arbitrary periods<br />
<strong>and</strong> there<strong>for</strong>e introduce the following notation:<br />
Rs,t ≡ (1 + ρ s) · · ·(1 + ρ t−1).<br />
Definition 26 A trading strategy is an adapted process<br />
φ = (φ 0<br />
t, . . ., φ N<br />
t )t=0,...,T −1.<br />
<strong>and</strong> the interpretation is that φ i<br />
t(ω) is the number of the i ′ th security held at<br />
time t if the state is ω. The requirement that the trading strategy is adapted<br />
is very important. It represents the idea that the strategy should not be able<br />
to see into the future. Returning again to the event tree, when st<strong>and</strong>ing in<br />
node ξ 11, a trading strategy can base the number of securities on the fact<br />
that we are in ξ 11 (<strong>and</strong> not in ξ 12), but not on whether the true state is ω1<br />
or ω2.<br />
The dividend stream generated by the trading strategy φ is denoted δ φ<br />
<strong>and</strong> it is defined as<br />
δ φ<br />
0 = −φ0 · S0<br />
δ φ<br />
t = φt−1 · (St + δt) − φt · St <strong>for</strong> t = 1, . . ., T.<br />
Definition 27 An arbitrageis a trading strategy <strong>for</strong> which δ φ<br />
t is a positive<br />
process, i.e. always nonnegative <strong>and</strong> δ φ<br />
t (ω) > 0 <strong>for</strong> some t<strong>and</strong> ω. The model<br />
is said to be arbitrage-free if it contains no arbitrage opportunities.<br />
In words, there is arbitrage if we can adopt a trading strategy which at<br />
no point in time requires us to pay anything but which at some time in some<br />
state gives us a strictly positive payout. Note that since we have included the<br />
initial payout as part of the dividend stream generated by a trading strategy,<br />
we can capture the definition of arbitrage in this one statement. This one<br />
statement captures arbitrage both in the sense of receiving money now with<br />
no future obligations <strong>and</strong> in the sense of paying nothing now but receiving<br />
something later.<br />
Definition 28 A trading strategy φ is self-financing if it satisfies<br />
φ t−1 · (St + δt) = φ t · St <strong>for</strong> t = 1, . . .,T.<br />
The interpretation is as follows: Think of <strong>for</strong>ming a portfolio φ t−1 at<br />
time t − 1. Now as we reach time t, the value of this portfolio is equal to<br />
φ t−1 · (St + δt), <strong>and</strong> <strong>for</strong> a self-financing trading strategy, this is precisely the<br />
amount of money which can be used in <strong>for</strong>ming a new portfolio at time t.<br />
We will let Φ denote the set of self-financing trading strategies.
5.3. NO ARBITRAGE AND PRICE FUNCTIONALS 59<br />
5.3 No arbitrage <strong>and</strong> price functionals<br />
We have seen in the one period model that there is equivalence between the<br />
existence of a state price vector <strong>and</strong> absence of arbitrage. In this section we<br />
show the multi-period analogue of this theorem.<br />
The goal of this section is to prove the existence of the multi-period<br />
analogue of state-price vectors in the one-period model. Let L denote the set<br />
of adapted processes on the given filtration.<br />
Definition 29 A pricing functional F is a linear functional<br />
which is strictly positive, i.e.<br />
F : L →R<br />
F(X) ≥ 0 <strong>for</strong> X ≥ 0<br />
F(X) > 0 <strong>for</strong> X > 0.<br />
Definition 30 A pricing functional F is consistent with security prices if<br />
F(δ φ ) = 0 <strong>for</strong> all trading strategies φ.<br />
Note that if there exists a consistent pricing functional we may arbitrarily<br />
assume that the value of the process 1{t=0} (i.e. the process which is 1 at time<br />
0 <strong>and</strong> 0 thereafter) is 1. By Riesz’representation theorem we can represent<br />
the functional F as<br />
F(X) = �<br />
X(ξ)f(ξ)<br />
ξ∈Ξ<br />
With the convention F(1{t=0}) = 1, we then note that if there exists a trading<br />
strategy φwhich is initiated at time 0 <strong>and</strong> which only pays a dividend of 1 in<br />
the node ξ, then<br />
φ 0 · S0 = f(ξ).<br />
Hence f(ξ) is the price at time 0 of having a payout of 1 in the node ξ.<br />
Proposition 11 The model (δ, S) is arbitrage-free if <strong>and</strong> only if there exists<br />
a consistent pricing functional.<br />
Proof. First, assume that there exists a consistent pricing functional F. Any<br />
dividend stream δ φ generated by a trading strategy which is positive must<br />
have F(δ φ ) > 0 but this contradicts consistency. Hence there is no arbitrage.<br />
The other direction requires more work:<br />
pricing<br />
functional<br />
Riesz’representation<br />
theorem
separating<br />
hyperplane<br />
complete market<br />
60CHAPTER 5. ARBITRAGE PRICING IN THE MULTI-PERIOD MODEL<br />
Define the sets<br />
L 1 � �<br />
�<br />
�<br />
�<br />
�<br />
= X ∈ L�X<br />
> 0 <strong>and</strong> X(ξ) = 1<br />
�<br />
ξ∈Ξ<br />
L 0 = � δ φ ∈ L |φ trading strategy �<br />
<strong>and</strong> think of both sets as subsets of R Ξ . Note that L 1 is convex <strong>and</strong> compact<br />
<strong>and</strong> that L 0 is a linear subspace, hence closed <strong>and</strong> convex. By the no arbitrage<br />
assumption the two sets are disjoint. There<strong>for</strong>e, there exists a separating<br />
hyperplane H(f; α) := {x ∈ R Ξ : f · x = α} which separates the two sets<br />
strictly <strong>and</strong> we may choose the direction of f such that f · x ≤ α <strong>for</strong> x ∈ L 0 .<br />
Since L 0 is a linear subspace we must have f · x = 0 <strong>for</strong> x ∈ L 0 (why?).<br />
Strict separation then gives us that f · x > 0 <strong>for</strong> x ∈ L 1 , <strong>and</strong> that in turn<br />
implies f ≫ 0 (why?). Hence the functional<br />
F(X) = �<br />
f(ξ)X(ξ)<br />
ξ∈Ξ<br />
is consistent.<br />
By using the same geometric intuition as in Chapter 2, we note that there<br />
is a connection between completeness of the market <strong>and</strong> uniqueness of the<br />
consistent price functional:<br />
Definition 31 The security model is complete if <strong>for</strong> every X ∈ L there exists<br />
a trading strategy φ such that δ φ<br />
t = Xt <strong>for</strong> t ≥ 1.<br />
If the model is complete <strong>and</strong> arbitrage-free, there can only be one consistent<br />
price functional (up to multiplication by a scalar). To see this, assume<br />
that if we have two consistent price functionals F, G both normed to have<br />
F(1{t=0}) = G(1{t=0}) = 1. Then <strong>for</strong> any trading strategy φ we have<br />
0 = −φ 0 · S0 + F(1{t>0}δ φ )<br />
= −φ 0 · S0 + G(1{t>0}δ φ )<br />
hence F <strong>and</strong> G agree on all processes of the <strong>for</strong>m 1{t>0}δ φ . But they also<br />
agree on 1{t=0} <strong>and</strong> there<strong>for</strong>e they are the same since by the assumption of<br />
completeness every adapted process can be obtained as a linear combination<br />
of these processes.<br />
Given a security price system (π, D), the converse is shown in a way<br />
very similar to the one-period case. Assume the market is arbitrage-free <strong>and</strong><br />
incomplete. Then there exists a process π in L, whose restriction to time
5.4. CONDITIONAL EXPECTATIONS AND MARTINGALES 61<br />
t ≥ 1 is orthogonal to any dividend process generated by a trading strategy.<br />
By letting π0 = 0 <strong>and</strong> choosing a sufficiently small ε > 0, the functional<br />
defined by<br />
(F + επ)(δ φ ) = �<br />
(f(ξ) + επ(ξ))δ φ (ξ)<br />
is consistent. Hence we have shown:<br />
ξ∈Ξ<br />
Proposition 12 If the market is arbitrage-free, then the model is complete<br />
if <strong>and</strong> only if the consistent price functional is unique.<br />
5.4 Conditional expectations <strong>and</strong> martingales<br />
Consistent price systems turn out to be less interesting <strong>for</strong> computation when<br />
we look at more general models, <strong>and</strong> they do not really explain the strange<br />
probability measure q which we saw earlier. We are about to remedy both<br />
problems, but first we need to make sure that we can h<strong>and</strong>le conditional<br />
expectations in our models <strong>and</strong> that we have a few useful computational<br />
rules at our disposal.<br />
Definition 32 The conditional expectation of an Fu−measurable r<strong>and</strong>om<br />
variable Xu given Ft,where Ft ⊆ Fu, is given by<br />
E(Xu |Ft)(ω) = 1<br />
P(At)<br />
�<br />
Av∈Pu:Av⊆At<br />
P(Av)Xu(Av) <strong>for</strong> ω ∈ At<br />
where we have written Xu(Av) <strong>for</strong> the value of Xu(ω) on the set Av <strong>and</strong><br />
where At ∈ Pt.<br />
We will illustrate this definition in the exercises. Note that we obtain<br />
an Ft−measurable r<strong>and</strong>om variable since it is constant over elements of the<br />
partition Pt. The definition above does not work when the probability space<br />
becomes uncountable. Then one has to adopt a different definition which we<br />
give here <strong>and</strong> which the reader may check is satisfied by the r<strong>and</strong>om variable<br />
given above in the case of finite sample space:<br />
Definition 33 The conditional expectation of an Fu−measurable r<strong>and</strong>om<br />
variable Xu given Ft is a r<strong>and</strong>om variable E(Xu |Ft) whichis Ft−measurable<br />
<strong>and</strong> satisfies �<br />
�<br />
E(Xu |Ft)dP = XudP<br />
<strong>for</strong> all At ∈ Ft.<br />
At<br />
At<br />
conditional<br />
expectation
martingale<br />
equivalent<br />
probability<br />
measures<br />
62CHAPTER 5. ARBITRAGE PRICING IN THE MULTI-PERIOD MODEL<br />
It is easy to see that the conditional expectation is linear, i.e. if Xu, Yu ∈<br />
Fu <strong>and</strong> a, b ∈ R, then<br />
E(aXu + bYu |Ft) = aE(Xu |Ft) + bE(Yu |Ft).<br />
We will also need the following computational rules <strong>for</strong> conditional expectations:<br />
E(E(Xu |Ft)) = EXu<br />
(5.1)<br />
E(ZtXu |Ft) = ZtE(Xu |Ft) whenever Zt ∈ Ft (5.2)<br />
E(E(Xu |Ft) |Fs) = E(Xu |Fs) whenever s < t < u (5.3)<br />
Note that a consequence of (5.2) obtained by letting Xu = 1, is that<br />
E(Zt |Ft) = Zt whenever Zt ∈ Ft. (5.4)<br />
Now we can state the important definition:<br />
Definition 34 A stochastic process X is a martingale with respect to the<br />
filtration F if it satisfies<br />
E(Xt |Ft−1) = Xt−1 all t = 1, . . ., T.<br />
You can try out the definition immediately by showing:<br />
Lemma 13 A stochastic process defined as<br />
Xt = E(X |Ft) t = 0, 1, . . .,T<br />
where X ∈ FT, is a martingale.<br />
Let EP (Y ; A) ≡ �<br />
Y dP <strong>for</strong> any r<strong>and</strong>om variable Y <strong>and</strong> A ∈ F.Using<br />
A<br />
this notation <strong>and</strong> the definition (33) of a martingale, this lemma says that<br />
E(X; A) = E(Xt; A) <strong>for</strong> all t <strong>and</strong>A ∈ Ft<br />
When there can be no confusion about the underlying filtration we will<br />
often write Et(X) instead of E(X |Ft).<br />
Two probability measures are said to be equivalent when they assign zero<br />
probability to the same sets <strong>and</strong> since we have assumed that P(ω) > 0 <strong>for</strong> all<br />
ω, the measures equivalent to P will be the ones which assign strictly positive<br />
probability to all events.<br />
We will need a way to translate conditional expectations under one measure<br />
to conditional expectations under an equivalent measure. To do this we<br />
need the density process:
5.5. EQUIVALENT MARTINGALE MEASURES 63<br />
Definition 35 Let the density (or likelihood) process Z be defined as<br />
<strong>and</strong><br />
ZT(ω) = Q(ω)<br />
P(ω)<br />
Zt = E P (ZT | Ft) t = 0, 1, . . .,T.<br />
We will need (but will not prove) the following result of called the Abstract<br />
Bayes Formula.<br />
Proposition 14 Let X be a r<strong>and</strong>om variable on (Ω, F). Then<br />
E Q (X| Ft) = 1<br />
E P (XZT | Ft).<br />
5.5 Equivalent martingale measures<br />
Zt<br />
In this section we state <strong>and</strong> prove what is sometimes known as the fundamental<br />
theorems of asset pricing. These theorems will explain the mysterious<br />
q−probabilities which arose earlier <strong>and</strong> they will provide an indispensable<br />
tool <strong>for</strong> constructing arbitrage-free models <strong>and</strong> pricing contingent claims in<br />
these models.<br />
We maintain the setup with a bank account generated by the short rate<br />
process ρ <strong>and</strong> N securitieswith price- <strong>and</strong> dividend processes S = (S 1 , . . .,S N ), δ =<br />
(δ 1 , . . .,δ N ). Define the corresponding discounted processes � S, � δ by defining<br />
<strong>for</strong> each i = 1, . . .,N<br />
�S i t = Si t<br />
� δ i<br />
t<br />
R0,t<br />
= δi<br />
t<br />
R0,t<br />
t = 0, . . ., T,<br />
t = 1, . . ., T.<br />
Definition 36 A probability measure Qon F is an equivalent martingale<br />
measure (EMM) if Q(ω) > 0all ω <strong>and</strong> <strong>for</strong> all i = 1, . . ., N<br />
�S i t<br />
= EQ<br />
t<br />
� T�<br />
j=t+1<br />
�<br />
i<br />
�δ j<br />
t = 0, . . ., T − 1. (5.5)<br />
The term martingale measure has the following explanation: Given a<br />
(one-dimensional) security price process S whose underlying dividend process<br />
abstract Bayes<br />
<strong>for</strong>mula<br />
price process<br />
dividend process<br />
equivalent<br />
martingale<br />
measure
fundamental<br />
theorem of asset<br />
pricing, first<br />
64CHAPTER 5. ARBITRAGE PRICING IN THE MULTI-PERIOD MODEL<br />
only pays dividend δT at time T. Then the existence of an EMM gives us<br />
that<br />
�St = E Q<br />
� �<br />
�δT<br />
t t = 0, . . .,T − 1.<br />
<strong>and</strong> there<strong>for</strong>e Lemma 13 tell us that the discounted price process ( � S0, � S1, . . ., � ST −1, �δT) is<br />
a martingale, which we may more tellingly write as<br />
� �<br />
St+1<br />
.<br />
St = E Q<br />
t<br />
1 + ρ t<br />
Another easy-to-remember way to rewrite Equation (5.5) (<strong>for</strong> a specific <strong>and</strong><br />
the notationally suppressed i) is as<br />
�<br />
T�<br />
�<br />
St δt+1<br />
+ .<br />
R0,t<br />
= E Q<br />
t<br />
R0,t+1<br />
j=t+2<br />
Now use linearity of conditional expectation, iterated expectations to write<br />
“E Q<br />
t = E Q<br />
t E Q<br />
t+1” the definition of R (a couple of times), <strong>and</strong> finally Equation<br />
(5.5) (“<strong>for</strong> t + 1”). This leads to<br />
St = E Q<br />
t<br />
� St+1 + δt+1<br />
1 + ρ t<br />
We are now ready to <strong>for</strong>mulate <strong>and</strong> prove what is sometimes known as<br />
the first fundamental theorem of asset pricing in a version with discrete time<br />
<strong>and</strong> finite state space:<br />
Theorem 15 In our security market model the following statements are<br />
equivalent:<br />
1. There are no arbitrage opportunities.<br />
� δj<br />
�<br />
.<br />
2. There exists an equivalent martingale measure.<br />
Proof. We have already seen that no arbitrage is equivalent to the existence<br />
of a consistent price functional F. There<strong>for</strong>e, what we show in the following<br />
is that there is a one-to-one correspondence between consistent price functionals<br />
(up to multiplication by a positive scalar) <strong>and</strong> equivalent martingale<br />
measures. We will need the following notation <strong>for</strong> the restriction of F to an<br />
Ft−measurable r<strong>and</strong>om variable:Let δ X be a dividend process whose only<br />
payout is X at time t. Define<br />
Ft(X) = F(δ X ).
5.5. EQUIVALENT MARTINGALE MEASURES 65<br />
If we assume (as we do from now on) that F0(1) = 1, we may think of<br />
Ft(1A) as the price a time 0 of a claim (if it trades) paying off 1 at time t if<br />
ω ∈ A. Note that since we have a assumed the existence of a money market<br />
account, we have<br />
FT(R0,T) = 1 (5.6)<br />
First, assume there is no arbitrage <strong>and</strong> let F be a consistent price functional.<br />
Our c<strong>and</strong>idate as equivalent martingale measure is defined as follows:<br />
Q(A) = FT(1AR0,T) A ∈ F ≡ FT. (5.7)<br />
By the strict positivity, linearity <strong>and</strong> (5.6) we see that Q is a probability<br />
measure which is strictly positive on all ω.We may write (5.7) as<br />
E Q 1A = FT(1AR0,T) A ∈ F ≡ FT<br />
<strong>and</strong> by writing a r<strong>and</strong>om variable X as a sum of constants times indicator<br />
functions, we note that<br />
E Q (X) = FT(XR0,T) (5.8)<br />
Now we want to check the condition (5.5). By definition (33) this is equivalent<br />
to showing that <strong>for</strong> every security we have<br />
E Q (1A � S i �<br />
T�<br />
�<br />
i<br />
t ) = EQ 1A<br />
�δ j t = 1, . . .,T. (5.9)<br />
j=t+1<br />
Consider <strong>for</strong> given A ∈ Ft the following trading strategy φ:<br />
• Buy one unit of stock i at time 0 (this costs Si t ). Invest all dividends<br />
be<strong>for</strong>e time t in the money market account <strong>and</strong> keep them there at<br />
least until time t.<br />
• At time t, if ω ∈ A (<strong>and</strong> this we know at time t since A ∈ Ft) sell the<br />
security <strong>and</strong> invest the proceeds in the money market account, i.e. buy<br />
S i t units of the 0 ′ th security <strong>and</strong> roll over the money until time T.<br />
• If ω /∈ A, then hold the i ′ th security to time T.<br />
This strategy clearly only requires an initial payment of Si 0 . The dividend<br />
process generated by this strategy is non-zero only at time 0 <strong>and</strong> at time<br />
T. At time T the dividend is<br />
� �<br />
δ φ<br />
T<br />
= 1ARt,T<br />
= 1AR0,T<br />
�<br />
S i t +<br />
�S i t +<br />
t�<br />
j=1<br />
t�<br />
j=1<br />
δ i<br />
jRj,t<br />
�<br />
i<br />
�δ j + 1Ac + 1A c<br />
T�<br />
j=1<br />
T�<br />
j=1<br />
δ i<br />
j Rj,T<br />
δ i<br />
jRj,T
66CHAPTER 5. ARBITRAGE PRICING IN THE MULTI-PERIOD MODEL<br />
One could also choose to just buy the i’th security <strong>and</strong> then roll over the<br />
dividends to time T. Call this strategy ψ.This would generate a terminal<br />
dividend which we may write in a complicated but useful way as<br />
δ ψ<br />
T<br />
= 1A<br />
T�<br />
j=1<br />
= 1AR0,T<br />
δ i<br />
j Rj,T + 1A c<br />
T�<br />
j=1<br />
� δ i<br />
j + 1A c<br />
T�<br />
j=1<br />
T�<br />
j=1<br />
δ i<br />
j Rj,T<br />
δ i<br />
jRj,T<br />
The dividend stream of both strategies at time 0 is −Si 0 . We there<strong>for</strong>e have<br />
which in turn implies<br />
�<br />
i.e.<br />
FT<br />
1AR0,T<br />
FT<br />
�<br />
�<br />
�S i t +<br />
1AR0,T � S i t<br />
Now use (5.8) to conclude that<br />
FT(δ φ ψ<br />
T ) = FT(δT )<br />
t�<br />
j=1<br />
�� �<br />
i<br />
�δ j = FT 1AR0,T<br />
�<br />
�<br />
= FT<br />
E Q (1A � S i t) = E Q (1A<br />
1AR0,T<br />
T�<br />
j=t+1<br />
T�<br />
j=t+1<br />
� δ i<br />
j)<br />
T�<br />
j=1<br />
�<br />
i<br />
�δ j .<br />
�<br />
i<br />
�δ j<br />
<strong>and</strong> that is what we needed to show. Q is an equivalent martingale measure.<br />
Now assume that Q is an equivalent martingale measure. Define <strong>for</strong> an<br />
arbitrary dividend process δ<br />
F(δ) = E Q<br />
Clearly, F is linear <strong>and</strong> strictly positive. Now consider the dividend process<br />
δ φ generated by some trading strategy φ. To show consistency we need to<br />
show that<br />
φ 0 · � S0 = E Q<br />
T�<br />
j=0<br />
T�<br />
j=1<br />
� δj<br />
� δ φ<br />
j .
5.5. EQUIVALENT MARTINGALE MEASURES 67<br />
Notice that we know that <strong>for</strong> individual securities we have<br />
�S i 0 = E Q<br />
We only need to extend that to portfolios. We do some calculations (where<br />
we make good use of the iterated expectations rule E Q E Q<br />
j = EQ E Q<br />
j−1 )<br />
E Q<br />
T�<br />
j=1<br />
� δ φ<br />
j<br />
T�<br />
j=1<br />
� δ i<br />
j.<br />
�<br />
T�<br />
= EQ φj−1 · ( � Sj + �δj) − φj · � �<br />
Sj<br />
j=1<br />
= E Q<br />
�<br />
T�<br />
�<br />
φj−1 ·<br />
j=1<br />
= E Q<br />
�<br />
T�<br />
�<br />
φj−1 ·<br />
= E Q<br />
�<br />
j=1<br />
φ 0 ·<br />
�<br />
E Q<br />
0<br />
= E Q<br />
�<br />
φ0 · � �<br />
S0<br />
= φ 0 · � S0<br />
E Q<br />
j<br />
E Q<br />
j−1<br />
T�<br />
k=1<br />
� δk<br />
� T�<br />
k=j<br />
� δk<br />
� T�<br />
��<br />
k=j<br />
��<br />
� δk<br />
��<br />
− φ j · E Q<br />
j<br />
−<br />
T�<br />
j=2<br />
� T�<br />
k=j+1<br />
� δk<br />
φ j−1 · E Q<br />
j−1<br />
��<br />
� T�<br />
Earlier, we established a one-to-one correspondence between consistent<br />
price functionals (normed to 1 at date 0) <strong>and</strong> equivalent martingale measures.<br />
There<strong>for</strong>e we have also proved the following second fundamental theorem of<br />
asset pricing:<br />
Corollary 16 Assume the security model is arbitrage-free. Then the market<br />
is complete if <strong>and</strong> only if the equivalent martingale measure is unique.<br />
Another immediate consequence from the definition of consistent price<br />
functionals <strong>and</strong> equivalent martingale measures is the following<br />
Corollary 17 Let the security model defined by (S, δ) (including the money<br />
market account) on (Ω, P, F, F) be arbitrage-free <strong>and</strong> complete. Then the<br />
augmented model obtained by adding a new pair (SN+1 , δ N+1 ) of security price<br />
<strong>and</strong> dividend processes is arbitrage-free if <strong>and</strong> only if<br />
= E Q<br />
�<br />
T�<br />
�<br />
N+1<br />
�<br />
t δj (5.10)<br />
�S N+1<br />
t<br />
j=t+1<br />
k=j<br />
� δk<br />
��<br />
fundamental<br />
theorem of asset<br />
pricing, second
splitting index i.e.<br />
68CHAPTER 5. ARBITRAGE PRICING IN THE MULTI-PERIOD MODEL<br />
S N+1<br />
t<br />
R0,t<br />
= E Q<br />
t<br />
� T�<br />
j=t+1<br />
δ N+1<br />
j<br />
R0,j<br />
where Q is the unique equivalent martingale measure <strong>for</strong> (S, δ).<br />
In the special case where the discount rate is deterministic the expression<br />
simplifies somewhat. For ease of notation assume that the spot interest rate<br />
is not only deterministic but also constant <strong>and</strong> let R = 1 + ρ. Then (5.10)<br />
becomes<br />
S N+1<br />
t<br />
= R t E Q<br />
t<br />
= E Q<br />
t<br />
� T�<br />
� T�<br />
j=t+1<br />
j=t+1<br />
5.6 One-period submodels<br />
�<br />
δ N+1<br />
j<br />
R0,j<br />
δ N+1<br />
j<br />
R j−t<br />
�<br />
�<br />
(5.11)<br />
Be<strong>for</strong>e we turn to applications we note a few results <strong>for</strong> which we do not<br />
give proofs. The results show that the one-period model which we analyzed<br />
earlier actually is very useful <strong>for</strong> analyzing multi-period models as well.<br />
Given the market model with the N−dimensional security price process<br />
S <strong>and</strong> dividend process δ <strong>and</strong> assume that a money market account exists as<br />
well. Let At ∈ Pt <strong>and</strong> let<br />
N (At) ≡ |{B ∈ Pt+1 : B ⊆ At}| .<br />
This number is often referred to as the splitting index at At. In our<br />
graphical representation where the set At is represented as a node in a graph,<br />
the splitting index at At is simply the number of vertices leaving that node.<br />
At each such node we can define a one-period submodel as follows: Let<br />
π(t, At) ≡ � 1, S 1 t (At), . . ., S N t (At) � .<br />
Denote by B1, . . .,BN(At) the members of Pt+1 which are subsets of At <strong>and</strong><br />
define<br />
⎛<br />
1 + ρt(At) ⎜ S<br />
D(t, At) ≡ ⎜<br />
⎝<br />
· · · 1 + ρt(At) 0 t+1(B1) + δ 0<br />
t+1(B1) . S0 t+1(BN(At)) + δ 0<br />
.<br />
t+1(BN(At)).<br />
.<br />
SN t+1 (B1) + δ N<br />
t+1 (B1) · · · SN t+1 (BN(At)) + δ N<br />
t+1 (BN(At))<br />
⎞<br />
⎟<br />
⎠ .
5.7. THE MULTI-PERIOD MODEL ON MATRIX FORM 69<br />
Then the following results hold:<br />
Proposition 18 The security market model is arbitrage-free if <strong>and</strong> only if<br />
the one-period model (π(t, At), D(t, At)) is arbitrage-free <strong>for</strong> all (t, At) where<br />
At ∈ Pt.<br />
Proposition 19 The security market model is complete if <strong>and</strong> only if the<br />
one-period model (π(t, At), D(t, At)) is complete <strong>for</strong> all (t, At) where At ∈<br />
Pt.<br />
In the complete, arbitrage-free case we obtain from each one-period submodel<br />
a unique state price vector ψ(t, At) <strong>and</strong> by following the same procedure<br />
as outlined in chapter (4) we may decompose this into a discount factor,<br />
which will be 1+ρ t(At), <strong>and</strong> a probability measure q1, . . .,qN(At). The probabilities<br />
thus obtained are then the conditional probabilities qi = Q(Bi |At)<br />
<strong>for</strong> i = 1, . . .,N(At). From these conditional probabilities the martingale<br />
measure can be obtained.<br />
The usefulness of these local results is that we often build multi-period<br />
models by repeating the same one-period structure.We may then check absence<br />
of arbitrage <strong>and</strong> completeness by looking at a one-period submodel<br />
instead of the whole tree.<br />
5.7 The multi-period model on matrix <strong>for</strong>m<br />
As a final curiosity we note that it is in fact possible to embed a multi-period<br />
model into one giant one-period model by stacking the one-period submodels<br />
defined above into a giant matrix. Instead of giving the abstract notation<br />
<strong>for</strong> how this is done, we indicate <strong>for</strong> the two-period model of chapter (5) how<br />
this is done. Consider the following table in which we have defined a set of<br />
’elementary securities’:<br />
0 1,1 1,2 2,1 2,2 2,3 2,4<br />
S 0 1 −1 R R 0 0 0 0<br />
S 1 1 −S uS dS 0 0 0 0<br />
S 0 ({ω1,ω2}) 0 −R 0 R 2 R 2 0 0<br />
S 1 ({ω1, ω2}) 0 −uS 0 u 2 S duS 0 0<br />
S 0 ({ω3, ω4}) 0 0 −R 0 0 R 2 R 2<br />
S 1 ({ω3, ω4}) 0 0 −dS 0 0 udS d 2 S<br />
Each elementary security is to be thought of as arising from buying the<br />
security at one node <strong>and</strong> selling at the successor nodes. The pairs 1,1 ; 1,2 etc.
70CHAPTER 5. ARBITRAGE PRICING IN THE MULTI-PERIOD MODEL<br />
in the top row are to be read as date 1, partition element 1; date 1 partition<br />
element 2, etc. Note that the setup is very much as in the application of<br />
Stiemke’s lemma to one-period models in that we include negative prices <strong>for</strong><br />
one date <strong>and</strong> positive prices <strong>for</strong> the subsequent date. Define<br />
⎛<br />
⎜<br />
Dbig = ⎜<br />
⎝<br />
−1 R R 0 0 0 0<br />
−S uS dS 0 0 0 0<br />
0 −R 0 R 2 R 2 0 0<br />
0 −uS 0 u 2 S duS 0 0<br />
0 0 −R 0 0 R 2 R 2<br />
0 0 −dS 0 0 udS d 2 S<br />
What you can check <strong>for</strong> yourself now is that we can define a trading<br />
strategy as a vector θ ∈ R6 <strong>and</strong> then interpret D top<br />
bigθ as the dividend process<br />
generated by the trading strategy. A self-financing strategy would be one <strong>for</strong><br />
which the dividend process was non-zero at all dates 1, . . .,T − 1 (although<br />
this could easily be relaxed to a definition of self-financing up to a liquidation<br />
date t < T). Arbitrage may then be defined as a trading strategy generating<br />
a positive, non-zero dividend stream. If the market is arbitrage-free, the<br />
corresponding vector of state prices is an element of R7 <strong>and</strong> if we normalize<br />
the first component to be 1, the state prices correspond to time-zero prices<br />
of securities delivering one unit of account at nodes of the tree.<br />
We will not go further into this but note that it may be a useful way of<br />
representing a multi-period model when one wants to introduce short-selling<br />
constraints into the model.<br />
⎞<br />
⎟<br />
⎠
Chapter 6<br />
Option pricing<br />
The classical application of the arbitrage pricing machinery we have developed<br />
is to the pricing of options. The pricing models we obtain are used<br />
with minor modifications all over the world as the basis <strong>for</strong> trading billions<br />
of dollars worth of contracts every day. For students planning to become<br />
traders of financial derivatives this of course gives plenty of motivation <strong>for</strong><br />
learning these models. But recent collapses of financial institutions have also<br />
reminded us that financial managers <strong>and</strong> executives must underst<strong>and</strong> the way<br />
the derivatives markets work. A manager who underst<strong>and</strong>s the markets well<br />
may use them <strong>for</strong> effective risk management <strong>and</strong> will be able to implement<br />
effective control mechanisms within a firm to make sure that traders use the<br />
markets in accordance with the firm’s overall objectives.<br />
From a theoretical perspective, options are very important in several areas<br />
of finance. We will see later in the course how they are indispensable <strong>for</strong><br />
our underst<strong>and</strong>ing of a firm’s choice of capital structure. Also, a modern<br />
theory of capital budgeting relies critically on recognizing options involved<br />
in projects, so-called real options. And in actuarial science options appear<br />
when modelling reinsurance contracts.<br />
6.1 Terminology<br />
A European (American) call option on an underlying security S, with strike<br />
price K <strong>and</strong> expiration date T, gives the owner the right, but not the obligation,<br />
to buy S at a price of K at (up to <strong>and</strong> including) time T.<br />
A European (American) put option on an underlying security S, with<br />
strike price K <strong>and</strong> expiration date T, gives the owner the right, but not the<br />
obligation, to sell S at a price of K at (up to <strong>and</strong> including) time T.<br />
The strike price is also referred to as the exercise price, <strong>and</strong> using the<br />
71<br />
option pricing<br />
put option,<br />
European<br />
put option,<br />
American
put-call parity<br />
frictionless market<br />
72 CHAPTER 6. OPTION PRICING<br />
right to buy or sell is referred to as exercising the option.<br />
There is no good reason <strong>for</strong> the American/European terminology - both<br />
types are traded in America <strong>and</strong> Europe.<br />
In the definition above, we think of the person selling a call option (say),<br />
often referred to as the person writing an option, as actually delivering the<br />
underlying security to the option holder if the option holder decides to exercise.<br />
This is referred to as physical delivery. In reality, options are often cash<br />
settled. This means that instead of the option holder paying K to the writer<br />
of the call <strong>and</strong> the writer delivering the stock, the holder merely receives an<br />
amount ST − K from the option writer.<br />
Some common examples of options are stock options in which the underlying<br />
security is a stock, currency options in which the underlying security<br />
is a <strong>for</strong>eign currency <strong>and</strong> where the strike price is to be thought of as an<br />
exchange rate, bond options which have bonds as underlying security <strong>and</strong><br />
index options whose underlying security is not really a security but a stock<br />
market index (<strong>and</strong> where the contracts are then typically cash settled.) It<br />
will always be assumed that the underlying security has non-negative value.<br />
6.2 Diagrams, strategies <strong>and</strong> put-call parity<br />
Be<strong>for</strong>e we venture into constructing exact pricing models we develop some<br />
feel <strong>for</strong> how these instruments work. In this section we focus on what can<br />
be said about options if all we assume is that all securities (stocks, bonds,<br />
options) can be bought <strong>and</strong> sold in arbitrary quantities at the given prices<br />
with no transactions costs or taxes. This assumption we will refer to as an<br />
assumption of frictionless markets. We will also assume that at any time t<br />
<strong>and</strong> <strong>for</strong> any date T > t, there exists a zero coupon bond with maturity T in<br />
the market whose price at time t is d(t, T).<br />
An immediate consequence of our frictionless markets assumption is the<br />
following<br />
Proposition 20 The value of an American or European call option at the<br />
expiration date T is equal to CT = max(ST − K, 0), where ST is the price<br />
of the underlying security at time T.The value of an American or European<br />
put option at the expiration date T is equal to max(K − ST, 0).<br />
Proof. Consider the call option. If ST < K, we must have CT = 0, <strong>for</strong><br />
if CT > 0 you would sell the option, receive a positive cash flow, <strong>and</strong> there<br />
would be no exercise. 1 If ST ≥ K, we must have CT = ST − K. For if<br />
1 Actually, here we need to distinguish between whether the person who bought the
6.2. DIAGRAMS, STRATEGIES AND PUT-CALL PARITY 73<br />
CT > ST − K you would sell the option <strong>and</strong> buy the stock. After the option<br />
has been exercised, you are left with a total cash flow of CT −ST +K > 0, <strong>and</strong><br />
you would have no future obligations arising from this trade. If CT < ST −K,<br />
buy the option, exercise it immediately, <strong>and</strong> sell the stock. The total cash<br />
flow is −CT + ST − K > 0, <strong>and</strong> again there would be no future obligations<br />
arising from this trade. The argument <strong>for</strong> the put option is similar.<br />
We often represent payoffs of options at an exercise date using payoff<br />
diagrams, which show the value of t he option as a function of the value of<br />
the underlying:<br />
C T<br />
✻<br />
45<br />
✲<br />
◦<br />
� �������<br />
K S T<br />
K<br />
P T<br />
✻<br />
❅<br />
❅ ❅❅❅<br />
option is an idiot or a complete idiot. Both types are not very smart to pay something <strong>for</strong><br />
the option at time T. The idiot, however, would realize that there is no reason to pay K<br />
to receive the stock which can be bought <strong>for</strong> less in the market. The complete idiot would<br />
exercise the option. Then you as the person having sold the option would have to buy the<br />
stock in the market <strong>for</strong> ST , but that would be more than financed by the K you received<br />
from the complete idiot.<br />
K<br />
✲<br />
S T<br />
pay-off diagram
74 CHAPTER 6. OPTION PRICING<br />
moneyness Of course, you can turn these hockey sticks around in which case you are<br />
looking at the value of a written option:<br />
C T<br />
✻<br />
K<br />
S T<br />
✲<br />
45 ◦ ❅<br />
❅❅❅❅❅❅<br />
K<br />
P T<br />
✻<br />
K<br />
� ����<br />
Note that we are only looking at the situation at an exercise date (i.e.<br />
date T <strong>for</strong> a European option). Sometimes we wish to take into account that<br />
the option had an initial cost at date 0, c0 <strong>for</strong> a call, p0 <strong>for</strong> a put, in which<br />
case we get the following profit diagrams:<br />
−c0<br />
C T<br />
✻<br />
K<br />
� ��<br />
� ����<br />
✲<br />
S T<br />
K − p0<br />
P T<br />
✻<br />
❅<br />
❅❅❅❅<br />
K<br />
Of course, we are slightly allergic to subtracting payments occurring at different<br />
dates without per<strong>for</strong>ming some sort of discounting. There<strong>for</strong>e, one<br />
may also choose to represent the prices of options by their time T <strong>for</strong>ward<br />
c0 p0<br />
discounted values <strong>and</strong> d(0,T) d(0,T) .<br />
The world of derivative securities is filled with special terminology <strong>and</strong><br />
here are a few additions to your vocabulary: A call option with strike price<br />
K is said to be (deep) in-the-money at time t if St > K (St ≫ K).The<br />
opposite situation St < K (St ≪ K) is referred to as the call option being<br />
(deep) out-of-the-money. If St ≈ K, the option is said to be at-the-money.<br />
The same terminology applies to put options but with ’opposite signs’: A<br />
S T<br />
✲<br />
✲<br />
S T
6.2. DIAGRAMS, STRATEGIES AND PUT-CALL PARITY 75<br />
put option is in-the-money if St < K.<br />
The diagrams we have seen so far considered positions consisting of just<br />
one option. We considered a long position, i.e. a position corresponding<br />
to holding the option, <strong>and</strong> we considered a short position, i.e. a position<br />
corresponding to having written an option. One of the attractive features<br />
of options is that they can be combined with positions in other options, the<br />
underlying security <strong>and</strong> bonds to produce more complicated payoffs than<br />
those illustrated in the profit diagrams above. We will see examples of this<br />
in the exercises. Note that you should think of the payoff diagram <strong>for</strong> holding<br />
the stock <strong>and</strong> the diagram <strong>for</strong> holding the bond as being represented by:<br />
S T<br />
✻<br />
� �������<br />
✲<br />
S T<br />
d(T, T)<br />
Until further notice we will assume that the stock does not pay any dividends<br />
in the time interval [0, T]. This means that if you own the stock you will not<br />
receive any cash unless you decide to sell the stock. With this assumption<br />
<strong>and</strong> the maintained assumption of frictionless markets we will give some restrictions<br />
on option prices which follow solely from arbitrage considerations.<br />
The most important relation is the so-called put-call parity <strong>for</strong> European<br />
options. Consider the portfolio strategy depicted in the table below <strong>and</strong> the<br />
associated cash flows at time t <strong>and</strong> time T. Assume that both options are<br />
European, expire at date T <strong>and</strong> have strike price equal to K :<br />
strategy\cashflow date t date T, ST ≤ K date T, ST > K<br />
sell 1 call ct 0 K − ST<br />
buy 1 put −pt K − ST 0<br />
buy stock −St ST ST<br />
sell K bonds Kd(t, T) −K −K<br />
total cash flow must be 0 0 0<br />
Note that we have constructed a portfolio which gives a payoff of 0 at time<br />
T no matter what the value of ST. Since the options are European we need<br />
not consider any time points in (t, T). This portfolio must have price 0, or else<br />
there would be an obvious arbitrage strategy. If, <strong>for</strong> example, the portfolio<br />
1<br />
✻<br />
✲<br />
S T
put-call parity<br />
<strong>for</strong>ward price<br />
<strong>for</strong>ward contract<br />
76 CHAPTER 6. OPTION PRICING<br />
had positive value, we would sell the portfolio (corresponding to reversing<br />
the strategy in the table) <strong>and</strong> have no future obligations. In other words<br />
we have proved that in a frictionless market we have the following<br />
Proposition 21 (Put-call parity) The price ct of a European call <strong>and</strong> the<br />
price pt of a European put option with expiration date T <strong>and</strong> exercise price<br />
K must satisfy<br />
ct − pt = St − Kd(t, T).<br />
Note one simple but powerful consequence of this result: When deciding<br />
which parameters may influence call <strong>and</strong> put prices the put-call parity gives<br />
a very useful way of testing intuitive arguments. If St, K <strong>and</strong> d(t, T) are<br />
fixed, then a change in a parameter which produces a higher call price, must<br />
produce a higher put-price as well. One would easily <strong>for</strong> example be tricked<br />
into believing that in a model where ST is stochastic, a higher mean value of<br />
ST given St would result in a highercall price since the call option is more<br />
likely to finish in-the-money <strong>and</strong> that it would result in a lower put price since<br />
the put is more likely then to finish out-of-the money. But if we assume that<br />
St <strong>and</strong> the interest rate are held fixed, put-call parity tells us that this line<br />
of reasoning is wrong.<br />
Also note that <strong>for</strong> K = St<br />
d(t,T) we have ct = pt. This expresses the fact that<br />
the exercise price <strong>for</strong> which ct = pt is equal to the <strong>for</strong>ward price of S at time<br />
t. A <strong>for</strong>ward contract is an agreement to buy the underlying security at the<br />
expiration date T of the contract at a price of Ft. Note that Ft is specified<br />
at time t <strong>and</strong> that the contract unlike an option <strong>for</strong>ces the holder to buy. In<br />
other words you can lose money at expiration on a <strong>for</strong>ward contract. The<br />
<strong>for</strong>ward price Ft is decided so that the value of the <strong>for</strong>ward contract at date<br />
t is 0. Hence the <strong>for</strong>ward price is not a price to be paid <strong>for</strong> the contract at<br />
date t. It is more like the exercise price of an option. Which value of Ft then<br />
gives the contract a value of 0 at date t? Consider the following portfolio<br />
argument:<br />
strategy\cashflow date t date T<br />
buy 1 stock −St ST<br />
St sell d(t,T) bonds St − St<br />
d(t,T)<br />
sell 1 <strong>for</strong>ward 0 Ft − ST<br />
total cash flow 0 Ft − St<br />
d(t,T)<br />
Note that the cash flow at timeT is known at time t <strong>and</strong> since the cash flow<br />
by definition of the <strong>for</strong>ward price is equal to 0 at date t, the cash flow at
6.3. RESTRICTIONS ON OPTION PRICES 77<br />
date T must be 0 as well. Hence<br />
Ft = St<br />
d(t, T) .<br />
Note that buying a call <strong>and</strong> selling a put, both with exercise price K <strong>and</strong><br />
expiration date T, is equivalent to buying <strong>for</strong>ward at the price K. There<strong>for</strong>e<br />
the convention that the <strong>for</strong>ward contract has value 0 at date t is exactly<br />
equivalent to specifying K so that ct = pt.<br />
6.3 Restrictions on option prices<br />
In this section we derive some bounds on call prices which much be satisfied<br />
in frictionless markets. The line of reasoning used may of course be used on<br />
put options as well.<br />
Consider a European call option with expiration date T <strong>and</strong> exercise price<br />
K. Assume that the underlying security does not pay any dividends during<br />
the life of the option. Thenthe value of the option ct satisfies<br />
St ≥ ct ≥ max (0, St − Kd(t, T)), (6.1)<br />
which is sometimes called Merton’s tunnel.<br />
Proof. Clearly, ct ≥ 0. Also, the corresponding put option satisfies pt ≥ 0.<br />
Hence<br />
ct ≥ ct − pt = St − Kd(t, T) (6.2)<br />
where we have used put-call parity. To see that St ≥ ct, assume that St < ct<br />
<strong>and</strong> consider the strategy of buying the stock <strong>and</strong> selling the option. That<br />
gives a positive cash flow at time t. If at time T, ST > K <strong>and</strong> the option is<br />
exercised the stock is delivered to the option holder <strong>and</strong> K is received. If<br />
the option is not exercised, the stock can be sold at non-negative value.<br />
It is clear that an American option is more valuable than the corresponding<br />
European option, hence we note that the price Ct of an American option<br />
also satisfies Ct ≥ St −Kd(t, T). If interest rates are positive, i.e. d(t, T) < 1,<br />
this produces the interesting result that the value of the American call is always<br />
strictly greater than the immediate exercise value St − K when t < T.<br />
This shows the important result that an American option on a non-dividend<br />
paying stock should never be exercised early. Our inequalities above show<br />
that it will be better to sell the option. A corresponding result does not hold<br />
<strong>for</strong> put options. This is perhaps not so surprising considering that postponing<br />
the exercise of a put postpones the receipt of K, whereas delaying the<br />
exercise of a call delays the payment of K.<br />
Merton’s tunnel<br />
call option,<br />
American
78 CHAPTER 6. OPTION PRICING<br />
Typically, stocks pay dividends <strong>and</strong> it is important to take this into account<br />
when pricing options. It will often be the case that the option contract<br />
does not take into account whether the underlying stock pays dividends. A<br />
dividend payment will normally produce a drop in the stock price <strong>and</strong> an<br />
owner of a call option will be hurt by this drop without receiving the benefit<br />
of a dividend. A date t is denoted an ex-dividend date if purchasing the stock<br />
at time s < t gives the new owner part in the next dividend payment whereas<br />
a purchase at time t does not. For simplicity, we assume in the following<br />
that the dividend payment takes place at the ex-dividend date. Furthermore,<br />
we will assume that the size of the dividend is known some time be<strong>for</strong>e the<br />
dividend date. In a world with no taxes it ought to be the case then that<br />
the drop in the stock price around the dividend date is equal to the size of<br />
the dividend. Assume, <strong>for</strong> example, that the drop in the stock price is less<br />
than D. Then buying the stock right be<strong>for</strong>e the dividend date <strong>for</strong> a price of<br />
St− <strong>and</strong> selling it <strong>for</strong> St+ immediately after the dividend date will produce a<br />
cash flow of St+ +D −St− > 0. This resembles an arbitrage opportunity <strong>and</strong><br />
it is our explanation <strong>for</strong> assuming in the following that St− = St+ + D.<br />
Now let us consider the price at time 0 of a European call option on a<br />
stock which is known to pay one dividend D at time t. Then<br />
c0 ≥ max (0, S0 − Kd(0, T) − Dd(0, t)).<br />
Again, c0 ≥ 0 is trivial. Assume c0 < S0 − Kd(0, T) − Dd(0, t). Then<br />
buy the left h<strong>and</strong> side <strong>and</strong> sell the right h<strong>and</strong> side. At time t, we must pay<br />
dividend D on the stock we have sold, but that dividend is exactly received<br />
from the D zero coupon bonds with maturity t. At time T the value of the<br />
option we have sold is equal to max (0, ST − K) . The value of the right h<strong>and</strong><br />
side is equal to ST − K. If ST ≥ K the total position is 0.If ST < K the<br />
total position has value K − ST. Hence we have constructed a positive cash<br />
flow while also receiving money initially. This is an arbitrage opportunity<br />
<strong>and</strong> hence we rule out c0 < S0 − Kd(0, T) − Dd(0, t).<br />
There are many possible variations on the dividend theme. If dividends<br />
are not known at time 0 we may assume that they fall within a certain<br />
interval <strong>and</strong> then use the endpoints of this interval to bound calls <strong>and</strong> puts.<br />
The reader may verify that the maximal dividend is important <strong>for</strong> bounding<br />
calls <strong>and</strong> the minimum dividend <strong>for</strong> bounding put prices.<br />
However, we maintain the assumption of a known dividend <strong>and</strong> finish this<br />
section by another important observation on the early exercise of American<br />
calls on dividend paying stocks. Assume that the stock pays a dividend at<br />
time t <strong>and</strong> that we are at time 0 < t. It is then not optimal to exercise the<br />
option at time 0 whereas it may be optimal right be<strong>for</strong>e time t. To see that it
6.4. BINOMIAL MODELS FOR STOCK OPTIONS 79<br />
is not optimal at time 0, note that the American option contains as a part of<br />
its rights an option with expiration date s ∈ (0, t), <strong>and</strong> since this option is an<br />
option on a non-dividend paying stock we know that its value is larger than<br />
S0 − K, which is the value of immediate exercise. There<strong>for</strong>e, the American<br />
option is also more worth than S0 − K <strong>and</strong> there is no point in exercising<br />
be<strong>for</strong>e t. To see that it may be optimal to exercise right be<strong>for</strong>e t, consider<br />
a firm which pays a liquidating dividend to all its shareholders. The stock<br />
will be worthless after the liquidation <strong>and</strong> so will the call option. Certainly,<br />
the option holder is better off to exercise right be<strong>for</strong>e the dividend date to<br />
receive part of the liquidating dividend.<br />
The picture is much more complicated <strong>for</strong> puts. In the next section we<br />
will see how to compute prices <strong>for</strong> American puts in binomial models <strong>and</strong><br />
this will give us the optimal exercise strategy as well.<br />
6.4 Binomial models <strong>for</strong> stock options<br />
In this section we will go through the binomial model <strong>for</strong> pricing stock options.<br />
Our primary focus is the case where the underlying security is a<br />
non-dividend paying stock but it should be transparent that the binomial<br />
framework is highly flexible <strong>and</strong> will easily h<strong>and</strong>le the pricing <strong>and</strong> hedging<br />
of derivative securities with more complicated underlying securities.<br />
We consider a model with T periods <strong>and</strong> assume throughout that the<br />
following two securities trade:<br />
1. A bank account with a constant short rate process ρ, so 1 + ρ t = R,<br />
<strong>and</strong><br />
Rs,t = R t−s <strong>for</strong> s < t.<br />
2. A stock 2 S , which pays no dividends 3 , whose price at time 0 is S0 <strong>and</strong><br />
whose evolution under the measure P is described in the tree (where<br />
we have assumed that u > R > d > 0) shown below.<br />
2 Since there is only one stock we will write S instead of S 1 .<br />
3 To comply with the mathematical model of the previous chapter we should actually<br />
say that the stock pays a liquidating dividend of ST at time T. We will however speak of<br />
ST as the price at time T of the stock.<br />
binomial model<br />
binomial model<br />
stock<br />
option pricing
80 CHAPTER 6. OPTION PRICING<br />
p<br />
uS0<br />
S0 �������<br />
❅ ❅❅❅❅❅<br />
1 − p<br />
dS0<br />
p<br />
u 2 S0<br />
✟� ✟✟✟✟✟�<br />
❍<br />
❍❍❍❍❍�<br />
✟� ✟✟✟✟✟�<br />
❍<br />
❍❍❍❍❍�<br />
✏✏<br />
��<br />
1 − p ✏✏<br />
�� udS0<br />
p<br />
1 − p<br />
duS0<br />
d 2 S0<br />
✏✏<br />
��<br />
✏✏<br />
��<br />
❝ ❝ ❝<br />
�<br />
✥✥ u T S0<br />
❵❵ � T<br />
d S0<br />
t = 0 t = 1 t = 2 t = T<br />
❵❵ � T −1<br />
u dS0<br />
�<br />
✥✥ d T −1 uS0<br />
The mathematical description of the process is as follows: Let U1, . . .,UT<br />
be a sequence of i.i.d. Bernoulli variables, let p = P(U1 = 1) <strong>and</strong> define<br />
Nt =<br />
t�<br />
Ui.<br />
i=1<br />
Think of Nt as the number of up-jumps that the stock has had between<br />
time 0 <strong>and</strong> t. Clearly, this is a binomially distributed r<strong>and</strong>om variable. Let<br />
u > R > d > 0 be constants. Later, we will see how these parameters are<br />
chosen in practice. Then<br />
St = S0u Nt d t−Nt . (6.3)<br />
Using the results on one-period submodels it is clear that the model is<br />
arbitrage free <strong>and</strong> complete <strong>and</strong> that the equivalent martingale measure is<br />
given in terms of conditional probabilities as<br />
R − d<br />
Q(St = uSt−1|St−1) ≡ q =<br />
u − d<br />
u − R<br />
Q(St = dSt−1|St−1) = 1 − q =<br />
u − d .
6.5. PRICING THE EUROPEAN CALL 81<br />
6.5 Pricing the European call<br />
We now have the martingale measure Q in place <strong>and</strong> hence the value at time<br />
t of a European call with maturity T is given in an arbitrage-free model by<br />
Using this fact we get the following<br />
Ct = 1<br />
R T −tEQ (max(0, ST − K) |Ft).<br />
Proposition 22 Let the stock <strong>and</strong> money market account be as described in<br />
section 6.4. Then the price of a European call option with exercise price K<br />
<strong>and</strong> maturity date T is given as<br />
Ct = 1<br />
T −t<br />
RT −t<br />
i=0<br />
�<br />
� �<br />
T − t<br />
q<br />
i<br />
i (1 − q) T −t−i max(0, Stu i d T −t−i − K).<br />
Proof. Since the money market account <strong>and</strong> S0 are deterministic, we have<br />
that we get all in<strong>for</strong>mation by observing just stock-prices, or equivalently the<br />
U’s, i.e. Ft = σ(S1, . . .,St) = σ(U1, . . ., Ut). By using (6.3) twice we can<br />
write<br />
ST = Stu (NT −Nt) d (T −t)−(NT −Nt) = Stu Z d (T −t)−Z ,<br />
where Z = NT − Nt = �T j=t+1 Uj<br />
Q<br />
∼ bi(q; (T − t)), <strong>and</strong> Z is independent of<br />
Ft (because the U’s are independent). There<strong>for</strong>e<br />
R T −t Ct = E Q ((ST − K) + |Ft) = E Q ((Stu Z d (T −t)−Z − K) + |Ft).<br />
At this point in the narrative we need something called “the useful rule”. It<br />
states the following: Suppose we are given a function f : R 2 ↦→ R, a σ-algebra<br />
F, an F-measurable r<strong>and</strong>om variable X <strong>and</strong> a r<strong>and</strong>om variable Y that is<br />
independent of F. Define the function g : R ↦→ R by g(x) = E(f(x, Y )).<br />
Then E(f(X, Y )|F) = g(X). We then use this in the above expression with<br />
St playing the role of X, Z as Y , <strong>and</strong> f(x, y) = (xu y d (T −t)−y −K) + . By using<br />
the general trans<strong>for</strong>mation rule <strong>for</strong> discrete r<strong>and</strong>om variables E(h(Y )) =<br />
�<br />
yi h(yi)P(Y = yi), <strong>and</strong> the fact that Z is Q-binomially distributed we get<br />
in the notation of “the useful rule” that<br />
�T<br />
−t �<br />
T − t<br />
g(x) =<br />
i<br />
i=0<br />
<strong>and</strong> the desired result follows. �<br />
�<br />
q i (1 − q) (T −t)−i (xu i d (T −t)−i − K) + ,<br />
call option,<br />
European
hedging<br />
call option,<br />
European<br />
82 CHAPTER 6. OPTION PRICING<br />
We rewrite the expression <strong>for</strong> C0 using some h<strong>and</strong>y notation. Let a be<br />
the smallest number of upward jumps needed <strong>for</strong> the option to finish in the<br />
money, i.e.<br />
Letting<br />
a = min<br />
j∈N {j|S0u j d T −j > K}<br />
= min{j|j<br />
ln u + (T − j) ln d > ln(K/S0)}<br />
j∈N<br />
= min<br />
j∈N {j|j > ln(K/(S0d T ))/ ln(u/d)}<br />
⎢<br />
= ⎣ ln<br />
�<br />
K<br />
S0dT �<br />
ln � ⎥<br />
� ⎦ + 1.<br />
u<br />
d<br />
Ψ(a; T, q) =<br />
T�<br />
i=a<br />
� T<br />
i<br />
�<br />
q i (1 − q) T −i ,<br />
we may write (you may want to check the first term on the RHS)<br />
C0 = S0Ψ (a; T, q ′ ) − K<br />
Ψ (a; T, q) (6.4)<br />
RT where<br />
q ′ = u<br />
R q.<br />
Using put-call parity gives us the price of the European put:<br />
Corollary 23 The price of a European put option with T periods to maturity,<br />
exercise price T <strong>and</strong> the stocks as underlying security has a price at time<br />
0 given by<br />
P0 = K<br />
R T (1 − Ψ (a; T, q)) − S0 (1 − Ψ (a; T, q ′ ))<br />
Note that our option pricing <strong>for</strong>mulae use T to denote the number of<br />
periods until maturity. Later, we will be more explicit in relating this to<br />
actual calendar time.<br />
6.6 Hedging the European call<br />
We have already seen in a two period model how the trading strategy replicating<br />
a European call option may be constructed. In this section we simply<br />
state the result <strong>for</strong> the case with T periods <strong>and</strong> we then note an interesting
6.6. HEDGING THE EUROPEAN CALL 83<br />
way of expressing the result. We consider the case with a bank account <strong>and</strong><br />
one risky asset S <strong>and</strong> assume that the market is complete <strong>and</strong> arbitrage-free.<br />
The European call option has a payout at maturity of<br />
δ c<br />
T = max(ST − K, 0).<br />
Proposition 24 A self-financing trading strategy replicating the dividend<br />
process of the option from time 1 to T is constructed recursively as follows:<br />
Find φT −1 = (φ 0<br />
T −1 , φ1T<br />
−1 ) such that<br />
φ 0<br />
T −1R + φ 1<br />
T −1ST = δ c<br />
T.<br />
For t = T − 2, T − 3, . . ., 1 find φ t = (φ 0<br />
t, φ 1<br />
t)such that<br />
φ 0<br />
tR + φ1t<br />
St+1 = φ 0<br />
t+1 + φ1t+1<br />
St+1.<br />
The trading strategy is self-financing by definition, replicates the call<br />
<strong>and</strong> its initial price of φ 0<br />
0 + φ 1<br />
0S0 is equal to the arbitrage-free price of the<br />
option. We may easily extend to the case where both the underlying <strong>and</strong> the<br />
contingent claim have dividends other than the one dividend of the option<br />
considered above. In that case the procedure is the following: Find φT −1 =<br />
(φ 0<br />
T −1 , φ1T<br />
−1 ) such that<br />
φ 0<br />
T −1R + φ1T<br />
−1 (ST + δT) = δ c<br />
T .<br />
For t = T − 2, T − 3, . . ., 1 find φt = (φ 0<br />
t , φ1t<br />
) such that<br />
φ 0<br />
tR + φ 1<br />
t(St+1 + δt+1) = φ 0<br />
t+1 + φ 1<br />
t+1St+1 + δ c<br />
t+1. (6.5)<br />
In this case the trading strategy is not self-financing in general but it matches<br />
the dividend process of the contingent claim, <strong>and</strong> the initial price of the<br />
contingent claim is still φ 0<br />
0 + φ 1<br />
0S0.<br />
In general, Equation (6.5) is compact notation <strong>for</strong> a whole bunch of linear<br />
equations, namely one <strong>for</strong> each submodel; the number of unknowns is equal<br />
to dim(S), the number of equations is the splitting index, ie. the number of<br />
future states. And the equations most be solved recursively backwards. But<br />
in many applications things simple. If S is 1-dimensional, the splitting index<br />
is 2 (so we have simple binomial submodels; refer to their states as “up” <strong>and</strong><br />
“down”), <strong>and</strong> neither S nor the derivative pay dividends, then<br />
• The RHSs of (6.5) are just the option’s price in different states, say π u<br />
<strong>and</strong> π d .<br />
self-financing<br />
trading strategy<br />
replication<br />
splitting index
84 CHAPTER 6. OPTION PRICING<br />
delta hedging • Subtract the up-equation from the down-equation to get the replication<br />
portfolio(’s stock holdings)<br />
φ 1<br />
t = πu − πd Su = “∆π “ := ∆.<br />
− Sd ∆S<br />
• This procedure/technique is called delta hedging. A very good mnemomic.<br />
The ∆ is the equation above is called the option’s (delta) hedge ratio.<br />
Further insight into the hedging strategy is given by the proposition below.<br />
Recall the notation<br />
�St = St<br />
<strong>for</strong> the discounted price process of the stock. Let Ct denote the price process<br />
of a contingent claim whose dividend process is δ c <strong>and</strong> let<br />
R0,t<br />
�Ct = Ct<br />
� δ c<br />
t<br />
R0,t<br />
= δc<br />
t<br />
R0,t<br />
denote the discounted price <strong>and</strong> dividend processes of the contingent claim.<br />
Define the conditional covariance under the martingale measure Q as follows:<br />
Cov Q (Xt+1, Yt+1 |Ft) = E Q ((Xt+1 − Xt)(Yt+1 − Yt)| Ft)<br />
The following can be shown (but we omit the proof):<br />
Proposition 25 Assume that the stock pays no dividends during the life of<br />
the option. The hedging strategy which replicates δ c is computed as follows:<br />
φ 1<br />
t =<br />
Cov Q<br />
�<br />
�St+1, � Ct+1 + �δ c<br />
� �<br />
�<br />
t+1�<br />
Ft<br />
VAR Q<br />
� � t = 0, 1, . . ., T − 1<br />
�St+1 |Ft<br />
φ 0<br />
t = � Ct − φ 1<br />
t � St<br />
t = 0, 1, . . ., T − 1<br />
Note the similarity with regression analysis. We will not go further into<br />
this at this stage. But this way of looking at hedging is important when<br />
defining so-called risk minimal trading strategies in incomplete markets.
6.7. RECOMBINING TREE REPRESENTATION 85<br />
S0<br />
✟ ✟✟✟✟✟✟✟✟✟✟✟✟✟✟✟✟✟✟✟✟✟✟✟✟✟<br />
�<br />
�<br />
�<br />
�<br />
�<br />
�<br />
�<br />
�<br />
�<br />
� ✟ ✟✟✟✟✟✟✟✟✟✟✟✟✟✟✟✟✟✟✟✟✟✟<br />
�<br />
�<br />
�<br />
�<br />
�<br />
�<br />
�<br />
�<br />
� ✟ ✟✟✟✟✟✟✟✟✟✟✟✟✟✟✟✟✟✟✟<br />
�<br />
�<br />
�<br />
�<br />
�<br />
�<br />
�<br />
� ✟ ✟✟✟✟✟✟✟✟✟✟✟✟✟✟✟✟<br />
�<br />
� �<br />
✟<br />
� �<br />
� �<br />
� �<br />
� �<br />
✟✟✟✟✟✟✟✟✟✟✟✟<br />
� ✟� ✟ ✟✟✟✟✟✟✟✟✟✟✟<br />
�<br />
�<br />
�<br />
�<br />
� ✟ ✟✟✟✟✟✟✟✟<br />
�<br />
�<br />
�<br />
� ✟ ✟✟✟✟✟<br />
�<br />
�<br />
� ✟ ✟✟<br />
u<br />
uS0<br />
�<br />
� �<br />
2 S0<br />
udS0<br />
dS0<br />
d 2 S0<br />
u T S0<br />
d T S0<br />
Figure 6.1: A lattice, i.e. a recombining tree.<br />
6.7 Recombining tree representation<br />
If the number of time periods T is large it the tree representing the stock<br />
price evolution grows very rapidly. The number of nodes at time t is equal<br />
to 2 t , <strong>and</strong> since <strong>for</strong> example 2 20 = 1048576 we see that when you implement<br />
this model in a spreadsheet <strong>and</strong> you wish to follow Ct <strong>and</strong> the associated<br />
hedging strategy over time, you may soon run out of space. Fortunately, in<br />
many cases there is a way around this problem: If your security price process<br />
is Markov <strong>and</strong> the contingent claim you wish to price is path-independent,<br />
you can use a recombining tree to do all of your calculations. Let us look<br />
at each property in turn 4 : The process S is a Markov chain under Q if it<br />
satisfies<br />
Q(St+1 = st+1 |St = st, . . .S1 = s1, S0 = s0) = Q(St+1 = st+1 |St = st)<br />
<strong>for</strong> all t <strong>and</strong> all (st+1, st, . . .,s1, s0). Intuitively, st<strong>and</strong>ing at time t, the current<br />
value of the process st is sufficient <strong>for</strong> describing the distribution of the<br />
4 These properties are interesting to consider <strong>for</strong> the stock only since the money market<br />
account trivially has all nice properties discussed in the following.<br />
Markov property
86 CHAPTER 6. OPTION PRICING<br />
S0� �����<br />
✟<br />
q<br />
�<br />
❅<br />
❅<br />
❅<br />
1 − q<br />
❅❅❅<br />
✟✟✟✟✟<br />
uS0<br />
�<br />
❍<br />
❍❍❍❍❍<br />
✟ ✟✟✟✟✟<br />
�<br />
dS0 ❍ ✘✘<br />
u<br />
�✘✘✘✘<br />
❍<br />
❍❍❍❍<br />
2 S0<br />
❳❳ ❳❳❳❳<br />
q<br />
S0<br />
✘✘✘ ✘✘✘<br />
�❳<br />
❳❳ ❳❳❳<br />
1 − q<br />
✘✘✘✘✘✘ q<br />
S0<br />
�❳<br />
❳❳❳❳❳<br />
′<br />
1 − q ′<br />
✘✘✘ ✘✘✘<br />
�<br />
d 2 �<br />
�<br />
�<br />
�<br />
�<br />
�<br />
�<br />
❳ ❳❳ S0 ❳❳❳�<br />
Figure 6.2: A tree that’s not a lattice.<br />
processat time t+1. The binomial model of this chapter is clearly a Markov<br />
chain. An important consequence of this is that when Ft = σ(S0, . . ., St)<br />
then <strong>for</strong> any (measurable) function f <strong>and</strong> time points t < u there existsa<br />
function g such that<br />
E Q (f(Su) |Ft) = g(St). (6.6)<br />
In other words, conditional expectations of functions of future values given<br />
everything we know at time t can be expressed as a function of the value<br />
of St at time t. The way S arrived at St is not important. We used this<br />
fact in the <strong>for</strong>mula <strong>for</strong> the price of the European call: There, the conditional<br />
expectation given time t in<strong>for</strong>mation became a function of St. The past did<br />
not enter into the <strong>for</strong>mula. We can there<strong>for</strong>e represent the behavior of the<br />
process S in a recombining tree, also known as a lattice, as shown in Figure<br />
6.1 in which one node at time t represents exactly one value of St. Another<br />
way of stating this is to say that the tree keeps track of the number of upjumps<br />
that have occurred, not the order in which they occurred. A full event<br />
tree would keep track of the exact timing of the up-jumps.<br />
To see what can go wrong, Figure 6.2 shows a process that is not Markov.<br />
The problem is at time 2 when the value of the process is S0, we need to<br />
know the pre-history of S to decide whether the probability of going up to<br />
uS is equal to q or q ′ . In st<strong>and</strong>ard binomial models such behavior is normally<br />
precluded.
6.7. RECOMBINING TREE REPRESENTATION 87<br />
Note that now the number of nodes required at time t is only t + 1, <strong>and</strong><br />
then using several hundred time periods is no problem <strong>for</strong> a spreadsheet.<br />
A technical issue which we will not address here is the following: Normally<br />
we specify the process under the measure P, <strong>and</strong> it need not be the case that<br />
the Markov property is preserved under a change of measure. However,<br />
one may show that if the price process is Markov under P <strong>and</strong> the model<br />
is complete <strong>and</strong> arbitrage-free, then the price process is Markov under the<br />
equivalent martingale measure Q as well.<br />
A second condition <strong>for</strong> using a recombining tree to price a contingent<br />
claim is a condition on the contingent claim itself:<br />
Definition 37 A contingent claim with dividend process δ c is path independent<br />
if δt = ft(St) <strong>for</strong> some (measurable) function f.<br />
Indeed if the claim is path independent <strong>and</strong> the underlying process is<br />
Markov, we have<br />
� �<br />
T�<br />
�<br />
�<br />
c<br />
Ct = R0,tE � �<br />
δ �<br />
= R0,tE<br />
= R0,tE<br />
i=t+1<br />
� T�<br />
i=t+1<br />
� T�<br />
i=t+1<br />
i<br />
� Ft<br />
�<br />
�<br />
�<br />
fi(Si) �<br />
�<br />
�<br />
�<br />
fi(Si) �<br />
<strong>and</strong> the last expression is a function of St by the Markov property. A European<br />
option with expiration date T is path-independent since its only dividend<br />
payment is at time T <strong>and</strong> is given as max(ST − K, 0).<br />
The Asian option is an example of a contingent claim which is not pathindependent.<br />
An Asian option on the stock, initiated at time 0, expiration<br />
date T <strong>and</strong> exercise price K has a payoff at date T given by<br />
C asian<br />
� �<br />
T�<br />
� �<br />
1<br />
T = max 0, St − K<br />
T + 1<br />
Hence the average of the stock price over the period determines the option<br />
price. Clearly, ST is not sufficient to describe the value of the Asian option<br />
at maturity. To compute the average value one needs the whole path of S.<br />
As noted above, even in a binomial model keeping track of the whole path<br />
<strong>for</strong>, say, 50 periods becomes intractable.<br />
t=0<br />
� Ft<br />
� St<br />
�<br />
�<br />
contingent claim<br />
Asian option“seecontingent<br />
claim, path<br />
dependent<br />
contingent claim,<br />
path dependent
put option,<br />
American<br />
88 CHAPTER 6. OPTION PRICING<br />
6.8 The binomial model <strong>for</strong> American puts<br />
We describe in this section a simple way of pricing the American put option<br />
in a binomial model. Strictly speaking, an American put is not a contingent<br />
claim in the sense we have thought of contingent claims earlier. Generally, we<br />
have thought of contingent claims as r<strong>and</strong>om variables or sometimes as processes<br />
but a put is actually not specified until an exercise policy is associated<br />
with the put. What we will do in the following is to simultaneously solve<br />
<strong>for</strong> the optimal exercise policy, i.e. the one that maximizes the expected,<br />
discounted value of the cash flows under the martingale measure, <strong>and</strong> the<br />
price of the option. The argument given is not a proof but should be enough<br />
to convince the reader that the right solution is obtained (it is fairly easy to<br />
show that another exercise policy will create arbitrage opportunities <strong>for</strong> the<br />
option writer).<br />
The value of an American put at its maturity is easy enough: 5<br />
PT = max(0, K − ST). (6.7)<br />
Now consider the situation one period be<strong>for</strong>e maturity. If the put has not<br />
been exercised at that date, the put option holder has two possibilities: Exercise<br />
the put at time T −1 or hold the put to maturity. The value of holding<br />
the put to maturity is given as the discounted (back to time T − 1) value of<br />
(6.7), whereas the value at time T −1 of exercising immediately is K −ST −1<br />
something only to be considered of course if K > ST −1. Clearly, the put<br />
option holder has a contract whose value is given by the maximal value of<br />
these two strategies, i.e. 6<br />
PT −1 = max<br />
�<br />
K − ST −1, E Q<br />
�<br />
PT<br />
R<br />
�<br />
�<br />
�<br />
� FT −1<br />
��<br />
.<br />
Continue in this fashion by working backwards through the tree to obtain<br />
the price process of the American put option given by the recursion<br />
�<br />
Pt−1 = max K − St−1, E Q<br />
� �<br />
Pt�<br />
�<br />
R � Ft−1<br />
��<br />
t = 1, . . .,T.<br />
Once this price process is given we see that the optimal exercise strategy is<br />
to exercise the put the first time t <strong>for</strong> which<br />
K − St > E Q<br />
� �<br />
Pt+1�<br />
�<br />
R � Ft<br />
�<br />
.<br />
5 Or is it? As it st<strong>and</strong>s Pt is really the value at time t given that the put has not been<br />
exercised at times 0, 1, t − 1. But that will most often be exactly what we are interested<br />
in; if we exercised the put to years ago, we really don’t care about it anymore.<br />
6 We do not need 0 in the list of arguments of max since positivity is assured by PT ≥ 0.
6.9. IMPLIED VOLATILITY 89<br />
This way of thinking is easily translated to American call options on dividend<br />
paying stocks <strong>for</strong> which early exercise is something to consider.<br />
6.9 Implied volatility<br />
We assume in this section that the Black-Scholes <strong>for</strong>mula is known to the<br />
reader: The price at time t of a European call option maturing at time T,<br />
when the exercise price is K <strong>and</strong> the underlying security is a non-dividend<br />
paying stock with a price of St, is given in the Black-Scholes framework by<br />
where<br />
<strong>and</strong><br />
Ct = StΦ (d1) − Ke −r(T −t) Φ (d2)<br />
d1 = log � � �<br />
St 1 + r + K 2σ2� (T − t)<br />
σ √ T − t<br />
d2 = d1 − σ √ T − t<br />
where Φ is the cumulative distribution function of a st<strong>and</strong>ard normal distribution.<br />
Consider the Black-Scholes <strong>for</strong>mula <strong>for</strong> the price of a European call on an<br />
underlying security whose value at time 0 is S0: Recall that Φ is a distribution<br />
function, hence Φ(x) → 1 as x → ∞ <strong>and</strong> Φ(x) → 0 as x → −∞. Assume<br />
throughout that T > 0. From this it is easy to see that c0 → S0 as σ →<br />
∞. By considering the cases S0 < K exp(−rT) , S0 = K exp(−rT) <strong>and</strong><br />
S0 > K exp(−rT) separately, it is easy to see that as σ → 0, we have<br />
c0 → max (0, S0 − K exp(−rT)). By differentiating c0 with respect to σ,<br />
one may verify that c0 is strictly increasing in σ. There<strong>for</strong>e, the following<br />
definition makes sense:<br />
Definition 38 Given a security with price S0. Assume that the risk free<br />
rate (i.e. the rate of the money market account) is equal to r. Assume that<br />
the price of a call option on the security with exercise price K <strong>and</strong> time to<br />
maturity T is observed to have a price of c obs with<br />
max(0, S0 − K exp(−rT)) < c obs < S0.<br />
Then the implied volatility of the option is the unique value of σ <strong>for</strong> which<br />
c0(S0, K, T, σ, r) = c obs . (6.8)<br />
implied<br />
volatility<br />
Black-Scholes<br />
<strong>for</strong>mula
90 CHAPTER 6. OPTION PRICING<br />
In other words, the implied volatility is the unique value of the volatility<br />
which makes the Black-Scholes model ’fit’ c obs . Clearly, we may also associate<br />
an implied volatility to a put option whose observed price respects the<br />
appropriate arbitrage bounds.<br />
There is no closed-<strong>for</strong>m expression <strong>for</strong> implied volatility; Equation 6.8<br />
must be solved numerically. Bisection works nicely (whereas a Newton-<br />
Raphson search without safety checks may diverge <strong>for</strong> deep out-of-the money<br />
options).<br />
A very important reason <strong>for</strong> the popularity of implied volatility is the<br />
way in which it allows a trans<strong>for</strong>mation of option prices which are hard to<br />
compare into a common scale. Assume that the price of a stock is 100 <strong>and</strong><br />
the riskfree rate is 0.1. If one observed a price of 9.58 on a call option on the<br />
stock with exercise price 100 <strong>and</strong> 6 months to maturity <strong>and</strong> a price of 2.81<br />
on a put option on the stock with exercise price 95 <strong>and</strong> 3 months to maturity<br />
then it would require a very good knowledge of the Black-Scholes model to<br />
see if one price was in some way higher than the other.However, if we are<br />
told that the implied volatility of the call is 0.25 <strong>and</strong> the implied volatility<br />
of the put is 0.30, then at least we know that compared to the Black-Scholes<br />
model, the put is more expensive than the call. This way of comparing is in<br />
fact so popular that traders in option markets typically do not quote prices<br />
in (say) dollars, but use ’vols’ instead.<br />
If the Black-Scholes model were true the implied volatility of all options<br />
written on the same underlying security should be the same, namely equal<br />
to the volatility of the stock <strong>and</strong> this volatility would be a quantity we could<br />
estimate from historical data. In short, in a world where the Black-Scholes<br />
model holds, historical volatility (of the stock) is equal to implied volatility<br />
(of options written on the stock). In practice this is not the case - after<br />
all the Black-Scholes model is only a model. The expenses of hedging an<br />
option depend on the volatility of the stock during the life of the option.<br />
If, <strong>for</strong> example, it is known that, after a long <strong>and</strong> quiet period, important<br />
news about the underlying stock will arrive during the life of the option, the<br />
option price should reflect the fact that future fluctuations in the stock price<br />
might be bigger than the historical ones. In this case the implied volatility<br />
would be higher than the historical.<br />
However, taking this knowledge of future volatility into account one could<br />
still imagine that all implied volatilities of options on the same underlying<br />
were the same (<strong>and</strong> equal to the ’anticipated’ volatility). In practice this is<br />
not observed either. To get an idea of why, we consider the notion of portfolio<br />
insurance.
6.10. PORTFOLIO INSURANCE, IMPLIED VOLATILITY AND CRASH FEARS91<br />
6.10 Portfolio insurance, implied volatility <strong>and</strong><br />
crash fears<br />
Consider a portfolio manager who manages a portfolio which is diversified<br />
so that the value of her portfolio follows that of the market stock index.<br />
Assume that the value of her portfolio is 1000 times the value of the index<br />
which is assumed to be at 110. The portfolio manager is very worried about<br />
losing a large portion of the value of the portfolio over the next year - she<br />
thinks that there is a distinct possibility that the market will crash. On the<br />
other h<strong>and</strong> she is far from certain. If she were certain, she could just move<br />
the money to a bank at a lower but safer expected return than in the stock<br />
market. But she does not want to exclude herself from the gains that a surge<br />
in the index would bring. She there<strong>for</strong>e decides to buy portfolio insurance<br />
in such a way that the value of her portfolio will never fall below a level of<br />
(say) 90.000. <strong>More</strong> specifically, she decides to buy 1000 put options with one<br />
year to maturity <strong>and</strong> an exercise price of 90 on the underlying index. Now<br />
consider the value of the portfolio after a year as a function of the level of<br />
the index ST :<br />
value of index ST ≥ 90 ST < 90<br />
value of stocks ST × 1000 ST × 1000<br />
value of puts 0 1000 × (90 − ST)<br />
total value ST × 1000 > 90.000 90.000<br />
Although it has of course not been costless to buy put options, the portfolio<br />
manager has succeeded in preventing the value of her portfolio from<br />
falling below 90.000. Since the put options are far out-of-the-money (such<br />
contracts are often called “lottery tickets”) at the time of purchase they are<br />
probably not that expensive. And if the market booms she will still be a<br />
successful portfolio manager.<br />
But what if she is not alone with her fear of crashes. We may then imagine<br />
a lot of portfolio managers interested in buying out-of-the-money put options<br />
hence pushing up the price of these contracts. This is equivalent to saying<br />
that the implied volatility goes up <strong>and</strong> we may experience the scenario shown<br />
in the graph below, in which the implied volatility of put options is higher<br />
<strong>for</strong> low exercise price puts:<br />
portfolio<br />
insurance<br />
implied<br />
volatility<br />
crash fear
volatility smile<br />
firm<br />
debt<br />
equity<br />
92 CHAPTER 6. OPTION PRICING<br />
Imp . BS-vol.<br />
✻<br />
S0<br />
✲<br />
exercise price<br />
This phenomenon is called a “smirk”. If (as it is often seen from data) the<br />
implied volatility is increasing (the dotted part of the curve) <strong>for</strong> puts that are<br />
in the money, then we have what is known as a “smile”. Actually options that<br />
are deeply in-the-money are rarely traded, so the implied volatility figures<br />
used to draw “the other half” of the smile typically comes from out-of-themoney<br />
calls. (Why/how? Recall the put-call parity.)<br />
A smirk has been observed be<strong>for</strong>e crashes <strong>and</strong> it is indicative of a situation<br />
where the Black-Scholes model is not a good model to use. The typical<br />
modification allows <strong>for</strong> stock prices to jump discontinuously but you will<br />
have to wait <strong>for</strong> future courses to learn about this.<br />
6.11 Debt <strong>and</strong> equity as options on firm value<br />
In this section we consider a very important application of option pricing.<br />
Our goal is to learn a somewhat simplified but extremely useful way of thinking<br />
about a firm which is financed by debt <strong>and</strong> equity (see below). A fundamental<br />
assumption in this section is that a firm has a market value given by<br />
a stochastic process V . In economies with Arrow-Debreu securities in which<br />
we know prices <strong>and</strong> production plans adopted by the firms, it is easy to define<br />
the value of a firm as the (net) value of its production. In reality things are<br />
of course a lot more complicated. It is hard to know, <strong>for</strong> example, what the<br />
value of NovoNordisk is - i.e. what is the market value of the firm’s assets<br />
(including know-how, goodwill etc.). Part of the problem is of course that it<br />
is extremely difficult to model future prices <strong>and</strong> production levels. But in a<br />
sense the actual value does not matter <strong>for</strong> this section in that the ’sign’ of<br />
the results that we derive does not depend on what the value of the firm is -<br />
only the ”magnitude’ does.
6.11. DEBT AND EQUITY AS OPTIONS ON FIRM VALUE 93<br />
The fundamental simplification concerns the capital structure of the firm.<br />
Assume that the firm has raised capital to finance its activities in two ways:<br />
It has issued stocks (also referred to as equity)<strong>and</strong> debt The debt consists<br />
of zero coupon bonds with face value D maturing at time T. Legally what<br />
distinguishes the debt holders from the stock holders is the following: The<br />
stock holders control the firm <strong>and</strong> they decide at time T whether the firm<br />
should repay its debt to the bondholders. If the bondholders are not repaid<br />
in full they can <strong>for</strong>ce the firm into bankruptcy <strong>and</strong> take over the remaining<br />
assets of the firm (which means both controlling <strong>and</strong> owning it). The stocks<br />
will then be worthless. If the stockholders pay back D at maturity to the<br />
bondholders, they own the firm entirely. They may then of course decide to<br />
issue new debt to finance new projects but we will not worry about that now.<br />
It is clear that the stockholders will have an interest in repaying the<br />
bondholders precisely when VT > D. Only then will the expense in paying<br />
back the debt be more than outweighed by the value of the firm. If VT < D<br />
(<strong>and</strong> there are no bankruptcy costs) the stockholders will default on their<br />
debt, the firm will go into bankruptcy <strong>and</strong> the bondholders will take over.<br />
In short, we may write the value of debt <strong>and</strong> equity at time T as<br />
BT = min (D, VT) = D − max (D − VT, 0)<br />
ST = max(VT − D, 0).<br />
In other words, we may think of equity as a call option on the value of<br />
the firm <strong>and</strong> debt as a zero coupon bond minus a put option on the value<br />
of the firm. Assuming then that V behaves like the underlying security in<br />
the Black-Scholes model <strong>and</strong> that there exists a money market account with<br />
interest rate r, we can use the Black-Scholes model to price debt <strong>and</strong> equity<br />
at time 0 :<br />
B0 = D exp(−rT) − p0(V0, D, T, σ, r)<br />
S0 = c0(V0, D, T, σ, r)<br />
where p0, c0 are Black-Scholes put <strong>and</strong> call functions.<br />
Let us illustrate a potential conflict between stockholders <strong>and</strong> bondholders<br />
in this model. Assume that at time 0 the firm has the possibility of adopting<br />
a project which will not alter the value of the firm at time 0, but which will<br />
have the effect of increasing the volatility of the process V. Since both the<br />
value of the call <strong>and</strong> the put increases when σ increases we see that the<br />
stockholders will like this project since it increases the value of the equity<br />
whereas the bondholders will not like the project since the put option which<br />
they have in a sense written will be a greater liability to them. This is a very<br />
capital structure<br />
equity<br />
debt
94 CHAPTER 6. OPTION PRICING<br />
clear <strong>and</strong> very important illustration of so-called asset substitution, a source<br />
of conflict which exists between stock-<strong>and</strong> bondholders of a firm. This setup<br />
of analyzing the value of debt <strong>and</strong> equity is useful in a number of contexts<br />
<strong>and</strong> you should make sure that you underst<strong>and</strong> it completely. We will return<br />
to this towards the end of the course when discussing corporate finance.
Chapter 7<br />
The Black-Scholes <strong>for</strong>mula<br />
7.1 Black-Scholes as a limit of binomial models<br />
So far we have not specified the parameters p, u, d <strong>and</strong> R which are of course<br />
critical <strong>for</strong> the option pricing model. Also, it seems reasonable that if we<br />
want the binomial model to be a realistic model <strong>for</strong> stock prices over a certain<br />
interval of time we should use a binomial model which divides the (calendar)<br />
time interval into many sub-periods. In this chapter we will first show that if<br />
one divides the interval into finer <strong>and</strong> finer periods <strong>and</strong> choose the parameters<br />
carefully, the value of the option converges to a limiting <strong>for</strong>mula, the Black-<br />
Scholes <strong>for</strong>mula, which was originally derived in a continuous time framework.<br />
We then describe that framework <strong>and</strong> show how to derive the <strong>for</strong>mula in it.<br />
Our starting point is an observed stock price whose logarithmic return<br />
satisfies<br />
E P<br />
� � ��<br />
St<br />
ln = µ<br />
<strong>and</strong><br />
V P<br />
St−1<br />
� � ��<br />
St<br />
ln = σ<br />
St−1<br />
2 ,<br />
where St is the price of the stock t years after the starting date 0. Also,<br />
assume that the bank account has a continuously compounded interest rate<br />
of r, i.e. an amount of 1 placed in the bank grows to exp(r) in one year. Note<br />
that since R T = exp (T ln (R)), a yearly rate of R = 1.1 (corresponding to<br />
a yearly rate of 10%) translates into the continuous compounding analogue<br />
r = ln (1.1) <strong>and</strong> this will be a number smaller than 0.1.<br />
Suppose we construct a binomial model covering T years, <strong>and</strong> that we<br />
divide each year into n periods. This gives a binomial model with nT periods.<br />
95<br />
binomial model<br />
Black-Scholes<br />
<strong>for</strong>mula<br />
stock<br />
logarithmic return<br />
continuously<br />
compounded<br />
interest rate
96 CHAPTER 7. THE BLACK-SCHOLES FORMULA<br />
In each 1-period submodel choose<br />
Further, let us put<br />
un = exp � σ/ √ n � ,<br />
dn = exp � −σ √ n � = u −1<br />
n ,<br />
�<br />
r<br />
�<br />
Rn = exp .<br />
n<br />
pn = 1<br />
2<br />
1 µ<br />
+<br />
2 σ √ n ,<br />
not that it matters much <strong>for</strong> our purposes. With the setup in the nth model<br />
specified above you may show by simple computation that the one-year logarithmic<br />
return satisfies<br />
E P<br />
� � ��<br />
S1<br />
ln = n {pn ln (un) + (1 − pn)ln (dn)} = µ<br />
<strong>and</strong><br />
S0<br />
V P<br />
�<br />
ln<br />
� S1<br />
S0<br />
��<br />
= σ 2 − 1<br />
n µ2 ,<br />
so the log-return of the price process has the same mean <strong>and</strong> almost the same<br />
variance as the process we have observed. And since<br />
V P<br />
� � ��<br />
S1<br />
ln → σ 2 <strong>for</strong> n → ∞,<br />
S0<br />
it is presumably so that large values of n brings us closer to to “desired”<br />
model.<br />
Let us now investigate precisely what happens to stock <strong>and</strong> call prices<br />
when n tends to infinity. For each n we may compute the price of an expiry-<br />
T call option the binomial model <strong>and</strong> we know that it is given as<br />
where<br />
C n �<br />
= S0Ψ an; nT; q ′<br />
�<br />
n − K<br />
(Rn) T Ψ (an; nT; qn) (7.1)<br />
qn = Rn − dn<br />
, q<br />
un − dn<br />
′ un<br />
n = qn<br />
Rn<br />
<strong>and</strong> an is the smallest integer larger than ln � K/(S0d Tn<br />
n ) � / ln(un/dn). Note<br />
that alternatively we may write(7.1) as<br />
C n = S0Q ′ (Sn(T) > K) − Ke −rT Q(Sn(T) > K) (7.2)
7.1. BLACK-SCHOLES AS A LIMIT OF BINOMIAL MODELS 97<br />
where Sn(T) = S0u j n dTn−j<br />
n<br />
to see that<br />
<strong>and</strong> j Q ∼ bi(Tn, qn) <strong>and</strong> j Q′<br />
∼ bi(Tn, q ′ n ). It is easy<br />
M Q n := E Q (ln Sn(T)) = lnS0 + Tn(qn ln un + (1 − qn) lndn)<br />
V Q<br />
n := V Q (lnSn(T)) = Tnqn(1 − qn)(ln un − ln dn) 2 ,<br />
<strong>and</strong> that similar expressions (with q ′ n instead of qn) hold <strong>for</strong> Q ′ -moments.<br />
Now rewrite the expression <strong>for</strong> M Q n in the following way:<br />
M Q �<br />
σ√n<br />
n − ln S0 = Tn<br />
e r/n − e −σ/√ n<br />
e σ/√ n − e r/n<br />
eσ/√n − e−σ/ √ n − σ √<br />
n eσ/√n − e−σ/ √ n<br />
= T √ � r/n σ/ 2e − e<br />
nσ<br />
√ n −σ/ − e √ � n<br />
.<br />
e σ/√ n − e −σ/ √ n<br />
Recall the Taylor-expansion to the second order <strong>for</strong> the exponential function:<br />
exp(±x) = 1 ± x + x 2 /2 + o(x 2 ). From this we get<br />
e r/n = 1 + r/n + o(1/n)<br />
e ±σ/√ n = 1 ± σ/ √ n + σ 2 /(2n) + o(1/n).<br />
Inserting this in the M Q n expression yields<br />
M Q n − ln S0 = T √ � 2 2r/n − σ /n + o(1/n)<br />
nσ<br />
2σ/ √ �<br />
n + o(1/n)<br />
� 2 2r − σ + o(1)<br />
= Tσ<br />
2σ + o(1/ √ �<br />
n)<br />
�<br />
→ T r − σ2<br />
�<br />
<strong>for</strong> n → ∞.<br />
2<br />
Similar Taylor expansions <strong>for</strong> V Q n<br />
V Q n → σ2 T,<br />
M Q′<br />
n − ln S0 → T<br />
V Q′<br />
n → σ 2 T.<br />
�<br />
r + σ2<br />
2<br />
, MQ′<br />
n<br />
�<br />
<strong>and</strong> V Q′<br />
n show that<br />
(note the change of sign on σ 2 ),<br />
So now we know what the Q/Q ′ moments converge to. Yet another way<br />
to think of ln Sn(T) is as a sum of Tn independent Bernoulli-variables with<br />
possible outcomes (lndn, ln un) <strong>and</strong> probability parameter qn (or q ′ n). This<br />
means that we have a sum of (well-behaved) independent r<strong>and</strong>om variables<br />
<strong>for</strong> which the first <strong>and</strong> second moments converge. There<strong>for</strong>e we can use a<br />
�
Central Limit<br />
Theorem<br />
Black-Scholes<br />
<strong>for</strong>mula<br />
98 CHAPTER 7. THE BLACK-SCHOLES FORMULA<br />
version of the Central Limit Theorem 1 to conclude that the limit of the sum<br />
is normally distributed, i.e.<br />
ln Sn(T) Q/Q′<br />
→ N(ln S0 + (r ± σ 2 /2)T, σ 2 T).<br />
This means (almost by definition of the <strong>for</strong>m of convergence implied by CLT)<br />
that when determining the limit of the probabilities on the right h<strong>and</strong> side of<br />
(7.2) we can (or: have to) substitute lnSn(T) by a r<strong>and</strong>om variable X such<br />
that<br />
X Q/Q′<br />
∼ N(ln S0+(r ±σ 2 /2)T, σ 2 T) ⇔ X − ln S0 − (r ± σ2 /2)T<br />
σ √ T<br />
Q/Q ′<br />
∼ N(0, 1).<br />
The final analysis:<br />
�<br />
S0Q ′ (ln Sn(T) > ln K) − Ke −rT Q(ln Sn(T) > ln K) �<br />
lim<br />
n→∞ Cn = lim<br />
n→∞<br />
= S0Q ′ (X > ln K) − Ke −rT Q(X > ln K)<br />
= S0Q ′<br />
�<br />
X − lnS0 − (r + σ2 /2)T<br />
σ √ ><br />
T<br />
ln K − ln S0 − (r + σ2 /2)T<br />
σ √ �<br />
T<br />
−Ke −rT �<br />
X − ln S0 − (r − σ<br />
Q<br />
2 /2)T<br />
σ √ ><br />
T<br />
ln K − ln S0 − (r − σ2 /2)T<br />
σ √ T<br />
Now multiply by −1 inside the Q’s (hence reversing the inequalities), use that<br />
the N(0, 1)-variables on the left h<strong>and</strong> sides are symmetric <strong>and</strong> continuous,<br />
<strong>and</strong> that ln(x/y) = ln x − lny. This shows that<br />
lim<br />
n→∞ Cn = S0Φ (d1) − Ke −rT Φ (d2),<br />
where Φ is the st<strong>and</strong>ard normal distribution function <strong>and</strong><br />
d1 = ln � S0<br />
K<br />
d2 = ln � S0<br />
K<br />
� + � r + 1<br />
2 σ2� T<br />
σ √ T<br />
� + � r − 1<br />
2 σ2� T<br />
σ √ T<br />
,<br />
= d1 − σ √ T.<br />
This <strong>for</strong>mula <strong>for</strong> the call price is called the Black-Scholes <strong>for</strong>mula.<br />
So far we can see it just as an artifact of going to the limit in a particular<br />
way in a binomial model. But the <strong>for</strong>mula is so strikingly beautiful <strong>and</strong> simple<br />
1 Actually, the most basic De Moivre-version will not quite do because we do not have a<br />
scaled sum of identically distributed r<strong>and</strong>om variables; the two possible outcomes depend<br />
on n. You need the notion of a triangular array <strong>and</strong> the Lindeberg-Feller-version of the<br />
Central Limit Theorem.<br />
�
7.2. THE BLACK-SCHOLES MODEL 99<br />
that there must be more to it than that. In particular, we are interested in<br />
the question: Does that exist a “limiting” model in which the above <strong>for</strong>mula<br />
is the exact call option price? The answer is: Yes. In the next section we<br />
describe what this “limiting” model looks like, <strong>and</strong> show that the Black-<br />
Scholes <strong>for</strong>mula gives the exact call price in the model. That does involve<br />
a number of concepts, objects <strong>and</strong> results that we cannot possibly make<br />
rigorous in this course, but the reader should still get a “net benefit” <strong>and</strong><br />
hopefully an appetite <strong>for</strong> future courses in financial mathematics.<br />
7.2 The Black-Scholes model<br />
The Black-Scholes <strong>for</strong>mula <strong>for</strong> the price of a call option on a non-dividend<br />
paying stock is one of the most celebrated results in financial economics. In<br />
this section we will indicate how the <strong>for</strong>mula is derived, or with the previous<br />
limiting argument in mind: A different way to derive the <strong>for</strong>mula. A rigorous<br />
derivation requires some fairly advanced mathematics which is beyond the<br />
scope of this course. Fortunately, the <strong>for</strong>mula is easy to interpret <strong>and</strong> to<br />
apply. Even if there are some technical details left over <strong>for</strong> a future course,<br />
the rigorous underst<strong>and</strong>ing we have from our discrete-time models of how<br />
arbitrage pricing works will allow us to apply the <strong>for</strong>mula safely.<br />
The <strong>for</strong>mula is <strong>for</strong>mulated in a continuous time framework with r<strong>and</strong>om<br />
variables that have continuous distribution. The continuous-time <strong>and</strong> infinite<br />
state space setup will not be used elsewhere in the course. 2 But let us mention<br />
that if one wants to develop a theory which allows r<strong>and</strong>om variables with<br />
continuous distribution <strong>and</strong> if one wants to obtain results similar to those of<br />
the previous chapters, then one has to allow continuous trading as well. By<br />
’continuous trading’ we mean that agents are allowed to readjust portfolios<br />
continuously through time.<br />
If X is normally distributed X ∼ N (α, σ2 ), then we say that Y :=<br />
exp(X) is lognormally distributed <strong>and</strong> write Y ∼ LN(α, σ2 ). There is one<br />
thing you must always remember about lognormal distributions:<br />
If Y ∼ LN(α, σ 2 �<br />
) then E(Y ) = exp α + σ2<br />
�<br />
.<br />
2<br />
If you have not seen this be<strong>for</strong>e, then you are strongly urged to check it.<br />
(With that result you should also be able to see why there is no need to<br />
2 A setup which combines discrete time <strong>and</strong> continuous distributions will be encountered<br />
later when discussing CAPM <strong>and</strong> APT, but the primary focus of these models will be to<br />
explain stock price behavior <strong>and</strong> not – as we are now doing – determining option prices<br />
<strong>for</strong> a given behavior of stock prices<br />
lognormal<br />
distribution
100 CHAPTER 7. THE BLACK-SCHOLES FORMULA<br />
Brownian motion use “brain RAM” remembering the variance of a lognormally distributed<br />
variable.) Often the lognormal distribution is preferred as a model <strong>for</strong> stock<br />
price distributions since it con<strong>for</strong>ms better with the institutional fact that<br />
prices of a stock are non-negative <strong>and</strong> the empirical observation that the<br />
logarithm of stock prices seem to show a better fit to a normal distribution<br />
than do prices themselves. However, specifying a distribution of the stock<br />
price at time t, say, is not enough. We need to specify the whole process of<br />
stock prices, i.e. we need to state what the joint distribution (St1, . . .,StN )<br />
is <strong>for</strong> any 0 ≤ t1 < . . . < tN. To do this the following object is central.<br />
Definition 39 A Brownian motion (BM) is a stochastic process B = (Bt) t∈[0;∞[<br />
-i.e. a sequence of r<strong>and</strong>om variables indexed by t such that:<br />
1. B0 = 0<br />
2. Bt − Bs ∼ N (0, t − s) ∀ s < t<br />
3. B has independent increments, i.e. <strong>for</strong> every N <strong>and</strong> a set of N time<br />
points t1 < . . . < tN, Bt1, Bt2 − Bt1, Bt3 − Bt2, . . .,BtN − BtN−1 are<br />
independent r<strong>and</strong>om variables.<br />
That these dem<strong>and</strong>s on a process can be satisfied simultaneously is not trivial.<br />
But don’t worry, Brownian motion does exist. It is, however, a fairly<br />
“wild” object. The sample paths (<strong>for</strong>mally the mapping t ↦→ Bt <strong>and</strong> intuitively<br />
simply the graph you get by plotting “temperature/stock price/. . .”<br />
against time) of Brownian motion are continuous everywhere but differentiable<br />
nowhere. The figure shows a simulated sample path of a BM <strong>and</strong><br />
should give an indication of this.<br />
A useful fact following from the independent increment property is that<br />
<strong>for</strong> any measurable f : R→R <strong>for</strong> which E [|f (Bt − Bs)|] < ∞ we have<br />
where Fs = σ {Bu : 0 ≤ u ≤ s}.<br />
E [f (Bt − Bs)| Fs] = E [f (Bt − Bs)] (7.3)
7.2. THE BLACK-SCHOLES MODEL 101<br />
B(t)<br />
-1.0 -0.5 0.0 0.5 1.0 1.5<br />
Brownian motion<br />
0 2 4 6 8 10<br />
The fundamental assumption of the Black-Scholes model is that the stock<br />
price can be represented by<br />
t<br />
St = S0 exp (αt + σBt) (7.4)<br />
where Bt is a Brownian motion. Such a process is called a geometric Brownian<br />
motion. Furthermore, it assumes that there exists a riskfree bank account<br />
that behaves like<br />
β t = exp(rt) (7.5)<br />
where r is a constant (typically r > 0). Hence βt is the continuous time<br />
analogue of R0,t.<br />
What does (7.4) mean? Note that since Bt ∼ N (0, t), St has a lognormal<br />
distribution <strong>and</strong> � �<br />
St1<br />
ln = αt1 + σBt1,<br />
ln<br />
� St2<br />
St1<br />
S0<br />
�<br />
= α (t2 − t1) + σ (Bt2 − Bt1)<br />
� St1<br />
� � �<br />
St2<br />
Since αt, α (t2 − t1), <strong>and</strong> σ are constant, we see that ln <strong>and</strong> ln<br />
S0<br />
St1 are independent. The return, defined in this section as the logarithm of the<br />
price relative, that the stock earns between time t1 <strong>and</strong> t2 is independent<br />
Black-Scholes<br />
model<br />
geometric<br />
Brownian<br />
motion
102 CHAPTER 7. THE BLACK-SCHOLES FORMULA<br />
volatility of the return earned between time 0 <strong>and</strong> time t1, <strong>and</strong> both are normally<br />
distributed. We refer to σ as the volatility of the stock - but note that it<br />
really describes a property of the logarithmic return of the stock. There are<br />
several reasons <strong>for</strong> modelling the stock price as geometric BM with drift or<br />
equivalently all logarithmic returns as independent <strong>and</strong> normal. First of all,<br />
unless it is blatantly unreasonable, modelling “r<strong>and</strong>om objects” as “niid”<br />
is the way to start. Empirically it is often a good approximation to model<br />
the logarithmic returns as being normal with fixed mean <strong>and</strong> fixed variance<br />
through time. 3 From a probabilistic point of view, it can be shown that if<br />
we want a stock price process with continuous sample paths <strong>and</strong> we want<br />
returns to be independent <strong>and</strong> stationary (but not necessarily normal from<br />
the outset), then geometric BM is the only possibility. And last but not<br />
least: It gives rise to beautiful financial theory.<br />
If you invest one dollar in the money market account at time 0, it will<br />
grow as β t = exp(rt). Holding one dollar in the stock will give an uncertain<br />
amount at time t of exp(αt+σBt) <strong>and</strong> this amount has an expected value of<br />
E exp(αt + σBt) = exp(αt + 1<br />
2 σ2 t).<br />
The quantity µ = α + 1<br />
2 σ2 is often referred to as the drift of the stock. We<br />
have not yet discussed (even in our discrete models) how agents determine µ<br />
<strong>and</strong> σ 2 , but <strong>for</strong> now think of it this way: Risk averse agents will dem<strong>and</strong> µ<br />
to be greater than r to compensate <strong>for</strong> the uncertainty in the stock’s return.<br />
The higher σ 2 is, the higher should µ be.<br />
7.3 A derivation of the Black-Scholes <strong>for</strong>mula<br />
In this section we derive the Black-Scholes model taking as given some facts<br />
from continuous time finance theory. The main assertion is that the fundamental<br />
theorem of asset pricing holds in continuous time <strong>and</strong>, in particular,<br />
in the Black-Scholes setup:<br />
St = S0 exp (αt + σBt)<br />
β t = exp(rt)<br />
What you are asked to believe in this section are the following facts:<br />
• There is no arbitrage in the model <strong>and</strong> there<strong>for</strong>e there exists an equivalent<br />
martingale measure Q such that the discounted stock price St is βt 3 But skeptics would say many empirical analyses of financial data is a case of “believing<br />
is seeing”rather than the other way around.
7.3. A DERIVATION OF THE BLACK-SCHOLES FORMULA 103<br />
a martingale under Q. (Recall that this means that EQ � �<br />
St |Fs βt The probabilistic behavior of St under Q is given by<br />
St = S0 exp<br />
��<br />
r − 1<br />
2 σ2<br />
where � Bt is a SBM under the measure Q.<br />
�<br />
t + σ � Bt<br />
= Ss).<br />
βs �<br />
, (7.6)<br />
• To compute the price of a call option on S with expiration date T<br />
<strong>and</strong> exercise price K, we take the discounted expected value of CT =<br />
[ST − K] + assuming the behavior of St given by (7.6).<br />
Recall that in the binomial model we also found that the expected return<br />
of the stock under the martingale measure was equal to that of the riskless<br />
asset.(7.6) is the equivalent of this fact in the continuous time setup. Be<strong>for</strong>e<br />
sketching how this expectation is computed note that we have not defined<br />
the notion of arbitrage in continuous time. Also we have not justified the<br />
<strong>for</strong>m of St under Q. But let us check at least that the martingale behavior<br />
of St<br />
β t<br />
seems to be OK (this may explain the ”− 1<br />
2 σ2 t”-term which is in the<br />
expression <strong>for</strong> St). Note that<br />
E Q<br />
� �<br />
St<br />
= E<br />
βt Q<br />
� �<br />
S0 exp − 1<br />
2 σ2t + σ � ��<br />
Bt<br />
�<br />
= S0 exp − 1<br />
2 σ2 �<br />
t E Q<br />
� �<br />
exp σ � ��<br />
Bt .<br />
But σ � Bt ∼ N (0, σ2t) <strong>and</strong> since we know how to compute the mean of the<br />
lognormal distribution we get that<br />
E Q<br />
� �<br />
St<br />
= S0 =<br />
βt S0<br />
, since β0 = 1.<br />
β0 By using the property (7.3) of the Brownian motion one can verify that<br />
E Q<br />
� �<br />
St�<br />
�<br />
β �<br />
t<br />
Fs<br />
�<br />
= Ss<br />
, (Fs = ”in<strong>for</strong>mation at time s”).<br />
βs but we will not do that here. 4<br />
4If you want to try it yourself, use<br />
� �<br />
St �<br />
E �<br />
β �<br />
t<br />
Fs<br />
�<br />
� �<br />
StβsSs �<br />
= E �<br />
Ssβtβ �<br />
s<br />
Fs<br />
�
104 CHAPTER 7. THE BLACK-SCHOLES FORMULA<br />
Accepting the fact that the call price at time 0 is<br />
C0 = exp (−rT)E Q<br />
� ��<br />
S0 exp r − 1<br />
2 σ2<br />
�<br />
T + σ � �<br />
BT<br />
� +<br />
− K<br />
we can get the Black-Scholes <strong>for</strong>mula: We know that σBT ∼ N (0, σ 2 T) <strong>and</strong><br />
also “the rule of the unconscious statistician”, which tells us that to compute<br />
E [f (X)] <strong>for</strong> some r<strong>and</strong>om variable X which has a density p (x), we compute<br />
� f (x) p (x) dx. This gives us<br />
C0 = e −rT<br />
�<br />
The integr<strong>and</strong> is different from 0 when<br />
i.e. when 5<br />
So<br />
C0 = e −rT<br />
� ∞<br />
d<br />
� ∞<br />
R<br />
�<br />
S0e (r−σ2 � +<br />
/2)T+x 1<br />
− K √ √ e<br />
2πσ T −1<br />
2<br />
S0e (r−σ2 /2)T+x > K<br />
x > ln(K/S0) − � r − σ 2 /2 � T ≡ d<br />
�<br />
S0e (r−1 2σ2 �<br />
)T+x<br />
− K<br />
1<br />
√ √ e<br />
2πσ T −1<br />
2<br />
x 2<br />
σ2T dx<br />
x 2<br />
σ2T dx<br />
= e −rT S0<br />
d<br />
1<br />
√ √ e<br />
2πσ T (r−1 2σ2 )T+x −<br />
e 1 x<br />
2<br />
2<br />
σ2 �<br />
T dx − Ke<br />
�� �<br />
:=A<br />
−rT<br />
d<br />
1<br />
√ √ e<br />
2πσ T −1<br />
x<br />
2<br />
2<br />
σ2 �<br />
T dx .<br />
�� �<br />
:=B<br />
� ∞<br />
It is easy to see that B = Ke −rT Prob(Z > d), where Z ∼ N(0, σ 2 T). So by<br />
using symmetry <strong>and</strong> scaling with σ √ T we get that<br />
where (as be<strong>for</strong>e)<br />
B = Ke −rT Φ (d2) ,<br />
d2 = − d<br />
σ √ T = ln � � �<br />
S0 1 + r − K 2σ2� T<br />
σ √ .<br />
T<br />
= Ss<br />
� �<br />
Stβ �<br />
s<br />
E �<br />
βs Ssβ �<br />
t<br />
Fs<br />
�<br />
<strong>and</strong> then see if you can bring (7.3)into play <strong>and</strong> use<br />
�<br />
1<br />
E [exp (σ(Bt − Bs))] = exp<br />
2 σ2 �<br />
(t − s) .<br />
5 This should bring up memories of the quantity a which we defined in the binomial<br />
model.
7.3. A DERIVATION OF THE BLACK-SCHOLES FORMULA 105<br />
So “we have half the Black-Scholes <strong>for</strong>mula”. The A-term requires a little<br />
more work. First we use the change of variable y = x/(σ √ T) to get (with<br />
a few rearrangements, a completion of the square, <strong>and</strong> a further change of<br />
variable (z = y − σ √ T))<br />
A = S0e −Tσ2 � ∞<br />
/2 1<br />
√ e<br />
−d2 2π σ√Ty−y2 /2<br />
dy<br />
= S0e −Tσ2 � ∞<br />
/2 1<br />
√ e<br />
−d2 2π −(y−σ√T) 2 /2+Tσ2 /2<br />
dy<br />
� ∞<br />
= S0<br />
−d1<br />
1<br />
√ 2π e −z2 /2 dz,<br />
where as per usual d1 = d2 + σ √ T. But the last integral we can write as<br />
Prob(Z > d1) <strong>for</strong> a r<strong>and</strong>om variable Z ∼ N(0, 1), <strong>and</strong> by symmetry we get<br />
which yields the “promised” result.<br />
A = S0Φ(d1),<br />
Theorem 26 The unique arbitrage-free price of a European call option on<br />
a non-dividend paying stock in the Black-Scholes model is given by<br />
where<br />
<strong>and</strong><br />
C0 = S0Φ (d1) − Ke −rT Φ (d2)<br />
d1 = ln � � �<br />
S0 1 + r + K 2σ2� T<br />
σ √ T<br />
d2 = d1 − σ √ T,<br />
where Φ is the distribution function of a st<strong>and</strong>ard normal distribution.<br />
As stated, the Black-Scholes <strong>for</strong>mula says only what the call price is at time<br />
0. But it is not hard to guess what happens if we want the price at some<br />
time t ∈ [0; T]: The same <strong>for</strong>mula applies with S0 substituted by St <strong>and</strong> T<br />
substituted by T − t. You may want to “try your h<strong>and</strong>” with conditional<br />
expectations <strong>and</strong> properties of Brownian motion by proving this.<br />
7.3.1 Hedging the call<br />
There is one last thing about the Black-Scholes model/<strong>for</strong>mula you should<br />
know. Just as in the binomial model the call option can be hedged in the<br />
Black-Scholes model. This means that there exists a self-financing trading
106 CHAPTER 7. THE BLACK-SCHOLES FORMULA<br />
delta-hedging strategy involving the stock <strong>and</strong> the bond such that the value of the strategy<br />
at time T is exactly equal to the payoff of the call, (ST − K) + . (This is in<br />
fact the very reason we can talk about a unique arbitrage-free price <strong>for</strong> the<br />
call.) It is a general fact that if we have a contract whose price at time t can<br />
be written as<br />
π(t) = F(t, St)<br />
<strong>for</strong> some deterministic function F, then the contract is hedged by a continuously<br />
adjusted strategy consisting of (the two last equation is just notation;<br />
deliberately deceptive as all good notation)<br />
φ 1 (t) = ∂F<br />
∂x<br />
�<br />
�<br />
(t, x) �<br />
� x=St<br />
= ∆π<br />
∆S<br />
:= ∆(t)<br />
units of the stock <strong>and</strong> φ 0 (t) = π(t) − φ 1 (t)St $ in the bank account. This is<br />
called delta hedging.<br />
For the Black-Scholes model this applies to the call with<br />
F BScall � � �<br />
x 2 ln + (r + σ /2) (T − t)<br />
K<br />
(t, x) = xΦ<br />
σ √ �<br />
T − t<br />
−Ke −r(T −t) � � �<br />
x 2 ln + (r − σ /2)(T − t)<br />
K<br />
Φ<br />
σ √ �<br />
.<br />
T − t<br />
The remarkable result (<strong>and</strong> what you must <strong>for</strong>ever remember) is that the<br />
partial derivative (wrt. x) of this lengthy expression is simple: 6<br />
∂F BScall<br />
� � �<br />
x 2 ln + (r + σ /2)(T − t)<br />
K<br />
(t, x) = Φ<br />
∂x<br />
σ √ �<br />
= Φ(d1),<br />
T − t<br />
where the last part is st<strong>and</strong>ard <strong>and</strong> underst<strong>and</strong>able but slightly sloppy notation.<br />
So to hedge the call option in a Black-Scholes economy you have to<br />
hold (at any time t) Φ(d1) units of the stock. This quantity is called the delta<br />
(or: △) hedge ratio <strong>for</strong> the call option. The “lingo” comes about because of<br />
the intimate relation to partial derivatives; △ is approximately the amount<br />
that the call price changes, when the stock price changes by 1. In this course<br />
we will use computer simulations to illustrate, justify, <strong>and</strong> hopefully to some<br />
degree underst<strong>and</strong> the result.<br />
6 At one time or another you are bound to be asked to verify this, so you may as well<br />
do it right away. Note that if you just look at the B-S <strong>for</strong>mula, <strong>for</strong>get that S0 (or x) also<br />
appears inside the Φ’s, <strong>and</strong> differentiate, then you get the right result with a wrong proof.
Chapter 8<br />
Stochastic Interest Rates<br />
8.1 Introduction<br />
After the brief encounter with continuous time modelling in Chapter 7 we<br />
now return to the discrete time, finite state space models of Chapter 5. They<br />
still have a great deal to offer.<br />
One of the most widespread applications of arbitrage pricing in the multiperiod<br />
finite state space model is in the area of term structure modelling. We<br />
saw in Chapter 3 how the term structure could be defined in several equivalent<br />
ways through the discount function, the yields of zero coupon bonds<br />
<strong>and</strong> by looking at <strong>for</strong>ward rates. In this chapter we will think of the term<br />
structure as the yield of zero coupon bonds as a function of time to maturity.<br />
In Chapter 3 we considered the term structure at a fixed point in time. In<br />
this chapter our goal is to look at dynamic modelling of the evolution of the<br />
term structure. This topic could easily occupy a whole course in itself so<br />
here we focus merely on explaining a fundamental method of constructing<br />
arbitrage-free systems of bond prices. Once this method is understood the<br />
reader will be able to build models <strong>for</strong> the evolution of the term structure<br />
<strong>and</strong> price interest rate related contingent claims.<br />
We also consider a few topics which are related to term structure modelling<br />
<strong>and</strong> which we can discuss rigorously with our arbitrage pricing technology.<br />
These topics are the difference between <strong>for</strong>wards <strong>and</strong> futures <strong>and</strong><br />
the role of ’convexity effects’ - or Jensen’s inequality - can rule out various<br />
properties of term structure evolutions. We also look briefly at so-called swap<br />
contracts which are quite important in bond markets.<br />
107<br />
stochastic<br />
interest rate<br />
zero coupon bond,<br />
ZCB<br />
term structure of<br />
interest rates
zero coupon bond,<br />
ZCB<br />
short rate process<br />
108 CHAPTER 8. STOCHASTIC INTEREST RATES<br />
8.2 Constructing an arbitrage free model<br />
Our goal is to model prices of zero coupon bonds of different maturities <strong>and</strong><br />
through time. Let P(t, Ti), 0 ≤ t ≤ Ti ≤ T , denote the price at time t of<br />
a zero coupon bond with maturity Ti. To follow the notation which is most<br />
commonly used in the literature we will deviate slightly from the notation<br />
of Chapter 5. To be consistent with Chapter 5 we should write P(t, Ti) <strong>for</strong><br />
the price of the bond prior to maturity. i.e. when t < Ti <strong>and</strong> then have<br />
a dividend payment δ(Ti) = 1 at maturity <strong>and</strong> a price process satisfying<br />
P(t, Ti) = 0 <strong>for</strong> t ≥ Ti. We will instead write the dividend into the price <strong>and</strong><br />
let<br />
P(t, t) = 1<br />
<strong>for</strong> all t. (You should have gotten used to this deceptive notation in Chapters<br />
6 <strong>and</strong> 7.)<br />
We will consider models of bond prices which use the short rate process<br />
ρ = (ρ t)t=0,...,T −1 as the fundamental modelling variable. Recall that the<br />
money market account is a process with value 1 <strong>and</strong> dividend at date t <<br />
T given by ρ t−1 <strong>and</strong> a dividend of 1 + ρ T at time T. We will need our simple<br />
notation <strong>for</strong> returns obtained by holding money over several periods in the<br />
money market account:<br />
Definition 40 The return of the bank account from period t to u is<br />
Rt,u = (1 + ρ t)(1 + ρ t+1) · · ·(1 + ρ u−1), <strong>for</strong> t < u<br />
Make sure you underst<strong>and</strong> that Rt,t+1 is known at time t, whereas Rt,t+2<br />
is not.<br />
From the fundamental theorem of asset pricing (Theorem 15) we know<br />
that the system consisting of the money market account <strong>and</strong> zero coupon<br />
bonds will be arbitrage free if <strong>and</strong> only if<br />
� �<br />
P(t, Ti)<br />
R0,t<br />
0≤t≤Ti<br />
is a martingale <strong>for</strong> every Ti under some measure Q. Here, we use the fact<br />
that the zero coupon bonds only pay one dividend at maturity <strong>and</strong> we have<br />
denoted this dividend P(Ti, Ti) <strong>for</strong> the bond maturing at date Ti. It is not<br />
easy, however, to specify a family of sensible <strong>and</strong> consistent bond prices. If<br />
T is large there are many maturities of zero coupon bonds to keep track of.<br />
They all should end up having price 1 at maturity, but that is about all we<br />
know. How do we ensure that the large system of prices admits no arbitrage<br />
opportunities?
8.2. CONSTRUCTING AN ARBITRAGE FREE MODEL 109<br />
What is often done is the following: We simply construct zero coupon<br />
bond prices as expected discounted values of their terminal price 1 under a<br />
measure Q which we specify in advance (as opposed to derived from bond<br />
prices). <strong>More</strong> precisely:<br />
Proposition 27 Given a short rate process ρ = (ρ t)t=0,...,T −1. Let<br />
For a given Q define<br />
P(t, Ti) = E Q<br />
t<br />
Ft = σ(ρ 0, ρ 1, . . .,ρ T).<br />
� 1<br />
Rt,Ti<br />
�<br />
<strong>for</strong> 0 ≤ t ≤ Ti ≤ T,<br />
where E Q<br />
t [·] is short h<strong>and</strong> <strong>for</strong> E Q [· | Ft]. Then the system consisting of the<br />
money market account <strong>and</strong> the bond price processes (P(t, Ti))t=0,...,T is arbitrage<br />
free.<br />
Proof. The proof is an immediate consequence of the definition of prices,<br />
since<br />
P(t, Ti)<br />
�<br />
1<br />
� �<br />
1<br />
�<br />
R0,t<br />
= 1<br />
E<br />
R0,t<br />
Q<br />
t<br />
Rt,Ti<br />
= E Q<br />
t<br />
R0,Ti<br />
<strong>and</strong> this we know defines a martingale <strong>for</strong> each Ti by Lemma 13. �<br />
It is important to note that we take Q as given. Another way of putting<br />
this is that a P-specification of the short rate (however well it may fit the<br />
data) is not enough to determine Q, bond prices <strong>and</strong> the Q-dynamics of the<br />
short rate. If you only have a short rate process, the only traded asset is the<br />
bank account <strong>and</strong> you cannot replicate bonds with that. Later courses will<br />
explain this in more detail.<br />
Example 11 Here is a simple illustration of the procedure in a model where<br />
the short rate follows a binomial process.<br />
short rate lattice
110 CHAPTER 8. STOCHASTIC INTEREST RATES<br />
0.5 ✑<br />
✑<br />
0.11 ✑<br />
�✑<br />
0.5 ◗<br />
◗◗<br />
0.5 ◗<br />
◗ 0.5 ✑<br />
◗◗ ✑<br />
0.5<br />
0.09 ✑<br />
◗�✑<br />
◗<br />
◗◗<br />
0.5 ◗<br />
0.10 ✑<br />
�✑<br />
✑✑✑<br />
A ρ-tree with Q-probabilties<br />
0.12<br />
�<br />
0.10<br />
�<br />
0.08<br />
�<br />
0<br />
@ 0.9091<br />
0.8265<br />
0.7516<br />
1<br />
A<br />
ZCB prices<br />
„ 0.9009<br />
0.8117<br />
„ 0.9174<br />
0.8418<br />
«<br />
«<br />
` 0.8929 ´<br />
` 0.9091 ´<br />
` 0.9259 ´<br />
The short rate at time 0 is 0.10. At time 1 it becomes 0.11 with probability<br />
1<br />
1<br />
<strong>and</strong> 0.09 with probability (both probabilities under Q) Given that it is<br />
2 2<br />
0.09 at time 1, it becomes either 0.10 or 0.08 at time 2, both with probability<br />
1.<br />
The bond prices have been computed using Proposition 27. Note that a<br />
2<br />
consequence of Proposition 27 is that (check it!)<br />
P(t, Ti) = 1<br />
E<br />
1 + ρt Q<br />
t [P(t + 1, Ti)]<br />
<strong>and</strong> there<strong>for</strong>e the way to use the proposition is to construct bond prices<br />
working backwards through the tree. For a certain maturity Ti we know<br />
P(Ti, Ti) = 1 regardless of the state. Now the price of this bond at time<br />
Ti − 1 can be computed as a function of ρ Ti−1, <strong>and</strong> so <strong>for</strong>th. The term<br />
structure at time 0 is now computed as follows<br />
r(0, 1) =<br />
1<br />
− 1 = 0.1<br />
P(0, 1)<br />
�<br />
1<br />
r(0, 2) =<br />
P(0, 2)<br />
� � 1<br />
1 3<br />
r(0, 3) =<br />
− 1 = 0.0998<br />
P(0, 3)<br />
�1<br />
2<br />
− 1 = 0.09995<br />
using definitions in Chapter 3. So the term structure in this example is<br />
decreasing in t - which is not what is normally seen in the market (but it<br />
does happen, <strong>for</strong> instance in Denmark in 1993 <strong>and</strong> in the U.S. in 2000). In<br />
fact, one calls the term structure ”inverted” in this case. Note that when the<br />
Q-behavior of r has been specified we can determine not only the current term<br />
structure, we can find the term structure in any node of the tree. (Since the<br />
model only contains two non-trivial zero-coupon bonds at time 1, the term<br />
structure only has two points at time 1.)
8.2. CONSTRUCTING AN ARBITRAGE FREE MODEL 111<br />
So Example 11 shows how the term structure is calculated from a Q-tree<br />
of the short rate. But what we (or: practitioners) are really interested in<br />
is the reverse question: Given todays (observed) term structure, how do we<br />
construct a Q-tree of the short rate that is consistent with the term structure?<br />
(By consistent we mean that if we use the tree <strong>for</strong> ρ in Example 11-fashion we<br />
match the observed term structure at the first node.) Such a tree is needed<br />
<strong>for</strong> pricing more complicated contracts (options, <strong>for</strong> instance).<br />
First, it is easy to see that generally such an “inversion” is in no way<br />
unique; a wide variety of ρ-trees give the same term structure. But that is<br />
not bad; it means that we impose a convenient structure on the ρ-process<br />
<strong>and</strong> still fit observed term structures. Two such conveniences are that the<br />
development of ρ can be represented in a recombining tree (a lattice), or in<br />
other words that ρ is Markovian, <strong>and</strong> that the Q-probability 1/2 is attached<br />
to all branches. (It may not be totally clear that we can do that, but it is<br />
easily seen from the next example/subsection.)<br />
8.2.1 Constructing a Q-tree/lattice <strong>for</strong> the short rate<br />
that fits the initial term structure<br />
Imagine a situation where two things have been thrust upon us.<br />
1. The almighty (“God “or “The Market”) has determined todays term<br />
structure,<br />
(P(0, 1), P(0, 2), . . ., P(0, T)).<br />
2. Our not-so-almighty boss has difficulties underst<strong>and</strong>ing probability beyond<br />
the tossing of a fair coin <strong>and</strong> wants answers fast, so he(s secretary)<br />
has drawn the ρ-lattice in Figure 8.1.<br />
All we have to do is “fill in the blanks’. Optimistically we start, <strong>and</strong> in<br />
the box corresponding to (t = 0, i = 0) we have no choice but to put<br />
ρ 0(0) =<br />
1<br />
− 1.<br />
P(0, 1)<br />
To fill out boxes corresponding to (t = 1, i = 0) <strong>and</strong> (t = 1, i = 1) we have<br />
the equation<br />
�<br />
1 1<br />
P(0, 2) =<br />
1 + ρ0(0) 2 ×<br />
1 1<br />
+<br />
1 + ρ1(0) 2 ×<br />
�<br />
1<br />
, (8.1)<br />
1 + ρ1(1) which of course has many solutions. (Even many sensible ones.) So we<br />
can/have to put more structure on the problem. Two very popular ways of<br />
short rate<br />
lattice,<br />
calibration
112 CHAPTER 8. STOCHASTIC INTEREST RATES<br />
� �� 1/2<br />
1/2<br />
� ��<br />
�<br />
1/2<br />
1/2<br />
�� 1/2<br />
1/2<br />
� �<br />
� �<br />
t = 0 t = 1 t = 2 t = T − 1<br />
. . .<br />
� �<br />
� �<br />
� �<br />
� �<br />
Figure 8.1: The ρ-lattice we must complete.<br />
doing this are these functional <strong>for</strong>ms: 1<br />
“level”<br />
i = T − 1<br />
i = 1<br />
i = 0<br />
Ho/Lee-specification: ρ t(i) = aimp(t) + bhisti<br />
Black/Derman/Toy-specification: ρ t(i) = aimp(t) exp(bhisti)<br />
For each t we fit by choosing an appropriate aimp, while bhist is considered a<br />
known constant. bhist is called a volatility parameter <strong>and</strong> is closely related<br />
(as you should be able to see) to the conditional variance of the short rate (or<br />
its logarithm). This means that it is fairly easy to estimate from historical<br />
time series data of the short rate. With bhist fixed, (8.1) can be solved hence<br />
determining what goes in the two “t = 1”-boxes. We may have to solve the<br />
equation determining aimp(1) numerically, but monotonicity makes this an<br />
easy task (by bisection or Newton-Raphson, <strong>for</strong> instance).<br />
And now can can do the same <strong>for</strong> t = 2, . . ., T − 1 <strong>and</strong> we can put our<br />
computer to work <strong>and</strong> go to lunch. Well, yes <strong>and</strong> no. Even though we take<br />
a long lunch there is a good chance that the computer is not finished when<br />
we get back. Why? Note that as it st<strong>and</strong>s, every time we make a guess at<br />
aimp(t) (<strong>and</strong> since a numerical solution is involved we are likely to be making a<br />
number of these) we have to work our way backward trough the lattice all the<br />
way down to 0. And this we have to do <strong>for</strong> each t. While not a computational<br />
catastrophe (a small calculation shows that the computation time grows as<br />
T 3 ), it does not seem totally efficient. We would like to go through the lattice<br />
only once (as it was the case when the initial term structure was determined<br />
1 Of course there is a reason <strong>for</strong> the names attached. As so often be<strong>for</strong>e, this is <strong>for</strong> later<br />
courses to explain.
8.2. CONSTRUCTING AN ARBITRAGE FREE MODEL 113<br />
from a known ρ-lattice). Fortunately there is a way of doing this. We need<br />
the following lemma.<br />
Lemma 28 Consider the binomial ρ-lattice in Figure 8.1. Let ψ(t, i) be the<br />
price at time 0 of a security that pays 1 at time t if state/level i occurs at<br />
that time. Then ψ(0, 0) = 1, ψ(0, i) = 0 <strong>for</strong> i > 0 <strong>and</strong> the following <strong>for</strong>ward<br />
equation holds:<br />
⎧<br />
⎪⎨<br />
ψ(t + 1, i) =<br />
⎪⎩<br />
ψ(t,i)<br />
2(1+ρt (i))<br />
ψ(t,i−1)<br />
2(1+ρt (i−1))<br />
ψ(t,i)<br />
2(1+ρt (i))<br />
+ ψ(t,i−1)<br />
2(1+ρ t (i−1))<br />
0 < i < t + 1,<br />
i = t + 1,<br />
i = 0.<br />
Proof. We do the proof only <strong>for</strong> the “0 < i < t + 1”-case, the others are<br />
similar. Recall that we can think of Ft-measurable r<strong>and</strong>om variables (of the<br />
type considered here) as vectors in in Rt+1 . Since conditional expectation<br />
is linear, we can (<strong>for</strong> s ≤ t) think of the Fs-conditional expectation of an<br />
Ft-measurable r<strong>and</strong>om variable as a linear mapping from Rt+1 to Rs+1 . In<br />
other words it can be represented by a (s+1) ×(t+1)-matrix. In particular<br />
the time t − 1 price of a contract with time t price X can be represented as<br />
�<br />
E Q<br />
t<br />
� X<br />
1 + ρ t−1<br />
= Πt−1X<br />
Now note that in the binomial model there are only two places to go from a<br />
given point, so the Πt−1-matrices have the <strong>for</strong>m<br />
⎡<br />
⎤⎫<br />
1−q q<br />
0<br />
1+ρt−1 (0) 1+ρt−1 (0)<br />
⎢<br />
1−q q<br />
⎥⎪⎬<br />
⎢<br />
Πt−1 = ⎢<br />
1+ρt−1 (1) 1+ρt−1 (1)<br />
⎥<br />
⎢<br />
.<br />
⎣<br />
.. . ..<br />
⎥ t rows<br />
⎦<br />
1−q q ⎪⎭<br />
0<br />
1+ρt−1 (t−1) 1+ρt−1 (t−1)<br />
� �� �<br />
t+1 columns<br />
Let ei(t) be the i’th vector of the st<strong>and</strong>ard base in R t . The claim that pays<br />
1 in state i at time t + 1 can be represented in the lattice by ei+1(t + 2) <strong>and</strong><br />
by iterated expectations we have<br />
ψ(t + 1, i) = Π0Π1 · · ·Πt−1Πtei+1(t + 2).<br />
But we know that multiplying a matrix by ei(t) from the right picks out the<br />
i’th column. For 0 < i < t + 1 we may write the i + 1’st column of Πt as<br />
(look at i = 1)<br />
1 − q<br />
1 + ρt(i − 1) ei(t<br />
q<br />
+ 1) +<br />
1 + ρt(i) ei+1(t + 1).
term structure<br />
of interest<br />
rates, parallel<br />
shifts<br />
114 CHAPTER 8. STOCHASTIC INTEREST RATES<br />
Hence we get<br />
ψ(t + 1, i) = Π0Π1 · · ·Πt−1<br />
=<br />
�<br />
1 − q<br />
1 + ρ t(i − 1) ei(t + 1) +<br />
1 − q<br />
1 + ρ t(i − 1) Π0Π1 · · ·Πt−1ei(t + 1)<br />
� �� �<br />
ψ(t,i−1)<br />
q<br />
+<br />
1 + ρt(i) Π0Π1 · · ·Πt−1ei+1(t + 1) ,<br />
� �� �<br />
ψ(t,i)<br />
<strong>and</strong> since q = 1/2, this ends the proof. �<br />
q<br />
1 + ρt(i) ei+1(t<br />
�<br />
+ 1)<br />
Since P(0, t) = �t i=0 ψ(t, i), we can use the following algorithm to fit the<br />
initial term structure.<br />
1. Let ψ(0, 0) = 1 <strong>and</strong> put t = 1.<br />
2. Let λt(aimp(t − 1)) = �t i=0 ψ(t, i) where ψ(t, i) is calculated from the<br />
ψ(t−1, ·)’s using the specified aimp(t−1)-value in the <strong>for</strong>ward equation<br />
from Lemma 28.<br />
Solve λt(aimp(t − 1)) = P(0, t) numerically <strong>for</strong> aimp(t − 1).<br />
3. Increase t by one. If t ≤ T then go to 2., otherwise stop.<br />
An inspection reveals that the computation time of this procedure only<br />
grows as T 2 , so we have “gained an order”, which can be quite significant<br />
when T is large. And don’t worry: There will be exercises to help you<br />
underst<strong>and</strong> <strong>and</strong> implement this algorithm.<br />
8.3 Flat shifts of flat term structures<br />
Now let us demonstrate that in our term structure modelling framework it<br />
is impossible to have only parallel shifts of a flat term structure. In other<br />
words, in a model with no arbitrage we cannot have bond prices at time 0<br />
given as<br />
<strong>for</strong> some r ≥ 0, t = 1, . . .,T <strong>and</strong><br />
P(0, t) =<br />
1<br />
(1 + r) t<br />
1<br />
P(1, t) =<br />
(1 + �r)<br />
t−1, t = 2, . . .,T,
8.3. FLAT SHIFTS OF FLAT TERM STRUCTURES 115<br />
where �r is a r<strong>and</strong>om variable (which takes on at least two different values<br />
with positive probability). To assign meaning to a ”flat term structure” at<br />
time 1 we should have T ≥ 3.<br />
Now consider the zero-coupon bonds with maturity dates 2 <strong>and</strong> 3. If the<br />
term structure is flat at time 0 we have <strong>for</strong> some r ≥ 0<br />
P(0, 2) =<br />
1<br />
2 <strong>and</strong> P(0, 3) =<br />
(1 + r)<br />
1<br />
(1 + r) 3<br />
<strong>and</strong> if it remains flat at time 1, there exist a r<strong>and</strong>om variable �r such that<br />
<strong>and</strong><br />
P(1, 2) = 1<br />
1 + �r<br />
<strong>and</strong> P(1, 3) =<br />
1<br />
(1 + �r) 2.<br />
Furthermore, in an arbitrage-free model it will be the case that<br />
P(0, 2) =<br />
=<br />
P(0, 3) =<br />
=<br />
1<br />
1 + r EQ [P(1, 2)]<br />
1<br />
1 + r EQ<br />
� �<br />
1<br />
1 + �r<br />
1<br />
1 + r EQ [P(1, 3)]<br />
1<br />
1 + r EQ<br />
�<br />
1<br />
(1 + �r) 2<br />
�<br />
Combining these results, we have<br />
� �<br />
1 1<br />
= EQ<br />
1 + r (1 + �r)<br />
<strong>and</strong><br />
�<br />
1 1<br />
2 = EQ<br />
(1 + r) (1 + �r) 2<br />
�<br />
which contradicts Jensen’s inequality, <strong>for</strong> if<br />
� �<br />
1 1<br />
= EQ<br />
1 + r (1 + �r)<br />
then since u ↦−→ u2 is strictly convex <strong>and</strong> �r not constant we must have<br />
�<br />
1 1<br />
2 < EQ<br />
(1 + r) (1 + �r) 2<br />
�<br />
.
<strong>for</strong>ward<br />
contract<br />
futures contract<br />
116 CHAPTER 8. STOCHASTIC INTEREST RATES<br />
Note that the result does not say that it is impossible <strong>for</strong> the term structure to<br />
be flat. But it is inconsistent with no arbitrage to have a flat term structure<br />
<strong>and</strong> only have the possibility of moves to other flat term structures.<br />
This explains what goes “wrong” in the example in Section 3.5.3. There<br />
the term structure was flat. We then created a position that had a value of<br />
0 at that level of interest rates, but a strictly positive value with at flat term<br />
structure at any other level. But if interest rates are really stochastic then<br />
an arbitrage-free model cannot have only flat shifts of flat structure.<br />
8.4 Forwards <strong>and</strong> futures<br />
A <strong>for</strong>ward <strong>and</strong> a futures contract are very similar contracts: The buyer<br />
(seller) of either type of contract is obligated to buy (sell) a certain asset<br />
at some specified date in the future <strong>for</strong> a price - the delivery price - agreed<br />
upon today. The <strong>for</strong>ward/futures price of a certain asset is the delivery price<br />
which makes the <strong>for</strong>ward/futures contract have zero value initially. It is very<br />
important to see that a <strong>for</strong>ward/futures price is closer in spirit to the exercise<br />
price of an option than to the price of an option contract. Whereas an option<br />
always has positive value (<strong>and</strong> usually strictly positive) initially, both futures<br />
<strong>and</strong> <strong>for</strong>wards have zero value initially because the delivery price is used as a<br />
balancing tool.<br />
The following example might clarify this: If a stock trades at $100 today<br />
<strong>and</strong> we were to consider buying a futures contract on the stock with delivery<br />
in three months <strong>and</strong> if we had an idea that this stock would not move a<br />
lot over the next three months, then we would be happy to pay something<br />
<strong>for</strong> a contract which obligated us to buy the stock in three months <strong>for</strong>, say,<br />
$50. Even though things could go wrong <strong>and</strong> the stock fall below $50 in<br />
three months we consider that a much smaller risk of loss than the chance of<br />
gaining a lot from the contract. Similarly, we would not obligate ourselves<br />
to buying the stock in three months <strong>for</strong>, say, $150 without receiving some<br />
money now. Somewhere in between $50 <strong>and</strong> $150 is a delivery price at which<br />
we would neither pay nor insist on receiving money to enter into the contract.<br />
In a market with many potential buyers <strong>and</strong> sellers there is an equilibrium<br />
price at which supply meets dem<strong>and</strong>: The number of contracts with<br />
that delivery price offered at zero initial cost equals the number of contracts<br />
dem<strong>and</strong>ed. This equilibrium price is the <strong>for</strong>ward/futures price (depending<br />
on which contract we consider). In the following we will look at this definition<br />
in a more mathematical way <strong>and</strong> we will explain in what sense futures<br />
<strong>and</strong> <strong>for</strong>wards are different. Although they produce different cash flows (see<br />
below) that only results in a price difference when interest rates are stochas-
8.4. FORWARDS AND FUTURES 117<br />
tic. There<strong>for</strong>e, we will illustrate this difference with an example involving<br />
futures/<strong>for</strong>wards on bonds. We will ignore margin payments (i.e. payments<br />
that one or both sides of the contract have to make initially to guarantee<br />
future payments) in this presentation.<br />
First, let us look at the key difference between <strong>for</strong>wards <strong>and</strong> futures by<br />
illustrating the cash flows involved in both types of contracts: Let Ft denote<br />
the <strong>for</strong>ward price at time t <strong>for</strong> delivery of an underlying asset at time T <strong>and</strong><br />
let Φt denote the futures price of the same asset <strong>for</strong> delivery at T, where<br />
t ≤ T. Strictly speaking, we should write Ft,T <strong>and</strong> Φt,T instead of Ft <strong>and</strong><br />
Φt respectively, since it is important to keep track of both the date at which<br />
the contract is entered into <strong>and</strong> the delivery date. But we have chosen to<br />
consider the particular delivery date T <strong>and</strong> then keep track of how the futures<br />
<strong>and</strong> <strong>for</strong>ward prices change as a function of t. The cash flows produced by the<br />
two types of contracts, if bought at time t, are as follows:<br />
t t+1 t+2 · · · T-1 T<br />
Forward 0 0 0 · · · 0 ST − Ft<br />
Futures 0 Φt+1 − Φt Φt+2 − Φt+1 · · · ΦT −1 − ΦT −2 ST − ΦT −1<br />
where ST is the price of the underlying asset at time T. The <strong>for</strong>ward cash<br />
flow is self-explanatory. The futures cash flow can be explained as follows:<br />
If you buy a futures contract at date t you agree to buy the underlying asset<br />
at time T <strong>for</strong> Φt. At time t + 1 markets may have changed <strong>and</strong> the price at<br />
which futures trade changed to Φt+1. What happens is now a resettlement of<br />
the futures contract. If Φt+1 is bigger than Φt you (the buyer of the futures<br />
at time t) receive the amount Φt+1 − Φt from the seller at time t+1 whereas<br />
you pay the difference between Φt+1 <strong>and</strong> Φt to the seller if Φt+1 < Φt. The<br />
story continues as shown in the figure.<br />
We have already seen that if the underlying asset trades at time t <strong>and</strong><br />
a zero coupon bond with maturity T also trades then the <strong>for</strong>ward price is<br />
given as<br />
i.e.<br />
Ft = St<br />
P(t, T)<br />
T −t<br />
Ft = St (1 + r (t, T))<br />
(8.2)<br />
where r(t, T) is the internal rate of return on the zero coupon bond.<br />
To see what Φt is requires a little more work: First of all to avoid arbitrage<br />
we must have ΦT = ST. Now consider ΦT −1. In an arbitrage free system there<br />
exists an equivalent martingale measure Q. The futures price ΦT −1 is such<br />
futures price<br />
<strong>for</strong>ward price
118 CHAPTER 8. STOCHASTIC INTEREST RATES<br />
that the cash flow promised by the contract (bought at T − 1) has value 0.<br />
We must there<strong>for</strong>e have<br />
�<br />
0 = E Q<br />
T −1<br />
� ST − ΦT −1<br />
RT −1,T<br />
but since RT −1,T is FT −1-measurable this implies<br />
i.e.<br />
i.e.<br />
0 =<br />
1<br />
RT −1,T<br />
E Q<br />
T −1 [ST − ΦT −1]<br />
Since Q is a martingale measure recall that<br />
hence we can write (8.3) as<br />
ΦT −1 = E Q<br />
T −1 [ST] (8.3)<br />
ST −1<br />
R0,T −1<br />
ST −1 =<br />
= E Q<br />
T −1<br />
1<br />
1 + ρ T −1<br />
� ST<br />
R0,T<br />
�<br />
E Q<br />
T −1 [ST]<br />
ΦT −1 = � �<br />
1 + ρT −1 ST −1<br />
<strong>and</strong> that is the same as (8.2) since the yield on a one period zero coupon bond<br />
is precisely the short rate. So we note that with one time period remaining<br />
we have ΦT −1 = FT −1. But that also follows trivially since with one period<br />
remaining the difference in cash flows between <strong>for</strong>wards <strong>and</strong> futures does not<br />
have time to materialize.<br />
Now consider ΦT −2. By definition ΦT −2 should be set such that the cash<br />
flow of the futures contract signed at T − 2 has zero value:<br />
�<br />
0 = E Q<br />
T −2<br />
� ΦT −1 − ΦT −2<br />
RT −2,T −1<br />
+ ST − ΦT −1<br />
RT −2,T<br />
(8.4)<br />
Now note that using the rule of iterated expectations <strong>and</strong> the expression <strong>for</strong><br />
ΦT −1 we find<br />
=<br />
= 0<br />
E Q<br />
T −2<br />
1<br />
RT −2,T −1<br />
� ST − ΦT −1<br />
RT −2,T<br />
E Q<br />
T −2<br />
�<br />
�<br />
E Q<br />
T −1<br />
� ST − ΦT −1<br />
RT −1,T<br />
��
8.4. FORWARDS AND FUTURES 119<br />
so (8.4) holds precisely when<br />
i.e. we have<br />
0 = E Q<br />
T −2<br />
=<br />
1<br />
RT −2,T −1<br />
� ΦT −1 − ΦT −2<br />
RT −2,T −1<br />
�<br />
E Q<br />
T −2 [ΦT −1 − ΦT −2]<br />
ΦT −2 = E Q<br />
T −2 [ΦT −1] = E Q<br />
T −2 [ST].<br />
This argument can be continued backwards <strong>and</strong> we arrive at the expression<br />
Φt = E Q<br />
t [ST] (8.5)<br />
Note that (8.5) is not in general equal to (8.2):<br />
Under Q, we have St = E Q<br />
� �<br />
ST 1<br />
t so if Rt,T Rt,T <strong>and</strong> ST are uncorrelated under<br />
Q we may write<br />
St = E Q<br />
� �<br />
1<br />
t E<br />
Rt,T<br />
Q<br />
t [ST] = P(t, T)Φt<br />
which would imply that<br />
Φt = St<br />
= Ft<br />
P(t, T)<br />
1 Hence, if Rt,T <strong>and</strong> ST are uncorrelated under Q, the <strong>for</strong>ward price Ft<br />
<strong>and</strong> the futures price Φt are the same. A special case of this is when interest<br />
rates are deterministic, i.e. all future spot rates <strong>and</strong> hence Rt,T are known at<br />
time t.<br />
Note that in general,<br />
1<br />
�<br />
Φt − Ft = P(t, T)E<br />
P(t, T)<br />
Q<br />
�<br />
t [ST] − St<br />
�<br />
1<br />
= E<br />
P(t, T)<br />
Q<br />
� �<br />
1<br />
t E<br />
Rt,T<br />
Q<br />
�<br />
t [ST] − St<br />
�<br />
1<br />
= E<br />
P(t, T)<br />
Q<br />
� �<br />
ST<br />
t − Cov<br />
Rt,T<br />
Q<br />
� � �<br />
1<br />
t , ST − St<br />
Rt,T<br />
�<br />
−1<br />
= Cov<br />
P(t, T)<br />
Q<br />
� ��<br />
1<br />
t , ST .<br />
Rt,T<br />
Note that margin payments go to the holder of a futures contract when<br />
1<br />
spot prices rise, i.e. in states where ST is high. If is negatively correlated<br />
R(t,T)<br />
with ST, then interest rates tend to be high when the spot price is high <strong>and</strong><br />
hence the holder of a futures contract will receive cash when interest rates<br />
are high. Hence a futures contract is more valuable in that case <strong>and</strong> the<br />
futures price should there<strong>for</strong>e be set higher to keep the contract value at 0.
120 CHAPTER 8. STOCHASTIC INTEREST RATES<br />
swap contract 8.5 Swap contracts<br />
A swap contract is an agreement to exchange one stream of payments <strong>for</strong><br />
another. A wide variety of swaps exists in financial markets; they are often<br />
tailor-made to the specific need of a company/an investor <strong>and</strong> can be<br />
highly complex. However, we consider only the valuation of the simplest2 interest rate swap where fixed interest payments are exchanged <strong>for</strong> floating<br />
rate interest payments.<br />
This swap you may see referred to as anything from “basis” to “<strong>for</strong>ward<br />
starting ???monthly payer swap settled in arrears”. Fortunately the payments<br />
are easier to describe. For a set of equidistant dates (Ti) n i=0 , say δ<br />
apart, it is a contract with cash flow (per unit of notational principal)<br />
⎛<br />
⎞<br />
⎜<br />
⎟<br />
⎜<br />
1<br />
⎟<br />
⎜<br />
− 1 − δκ ⎟<br />
⎝P(Ti−1,<br />
Ti) ���� ⎟<br />
� �� � fixed leg<br />
⎠<br />
floating leg<br />
at date Ti <strong>for</strong> i = 1, . . ., n,<br />
where κ is a constant (an interest rate with δ-compounding quoted on yearly<br />
basis.) You should convince yourself why the so-called floating leg does<br />
in fact correspond to receiving floating interest rate payments. The term<br />
(1/P(Ti−1, Ti) − 1)/δ is often called the (12*δ)-month LIBOR (which an<br />
acronym <strong>for</strong> London Interbank Offer Rate, <strong>and</strong> does not really mean anything<br />
nowadays, it is just easy to pronounce). Note that the payment made at Ti<br />
is known at Ti−1.<br />
It is clear that since the payments in the fixed leg are deterministic, they<br />
have a value of<br />
n�<br />
δκ P(t, Ti).<br />
i=1<br />
The payments in the floating leg are not deterministic. But despite this,<br />
we can find their value without a stochastic model <strong>for</strong> bond prices/interest<br />
rates. Consider the following simple portfolio strategy:<br />
Time Action Net cash flow<br />
t Sell 1 Ti-ZCB<br />
Buy 1 Ti−1-ZCB P(t, Ti) − P(t, Ti−1)<br />
Ti−1 Use principal received from Ti−1-ZCB<br />
to buy 1/P(Ti−1, Ti) Ti-ZCBs 0<br />
Ti Close position 1/P(Ti−1, Ti) − 1<br />
2 Simple objects are often referred to as plain vanilla objects. But what is seen as simple<br />
depends very much on who is looking.
8.5. SWAP CONTRACTS 121<br />
This means that the Ti-payment in the floating leg has a value of P(t, Ti−1)−<br />
P(t, Ti), so when summing over i see that the value of the floating leg is<br />
P(t, T0) − P(t, Tn).<br />
In the case where t = T0 this is easy to remember/interpret. A bullet-like<br />
bond that has a principal of 1 pays a coupon that is the short rate must<br />
have a price of 1 (lingo: “it is trading at par”). The only difference between<br />
this contract <strong>and</strong> the floating leg is the payment of the principal at time<br />
Tn; the time t value of this is P(t, Tn) hence the value of the floating leg is<br />
1 − P(t, Tn).<br />
All in all the swap has a value of<br />
V = P(t, T0) − P(t, Tn) − δκ<br />
n�<br />
P(t, Ti)).<br />
But there is a further twist; these basis swaps are only traded with one κ<br />
(<strong>for</strong> each length; each n), namely the one that makes the value 0. This rate<br />
is called the swap rate (at a given date <strong>for</strong> a given maturity)<br />
i=1<br />
κn(t) = P(t, T0) − P(t, Tn)<br />
δ �n . (8.6)<br />
P(t, Ti)<br />
In practice (8.6) is often used “backwards”, meaning that swap rates <strong>for</strong><br />
swaps of different lengths (called the “swap curve”) are used to infer discount<br />
factors/the term structure. Note that this is easy to do recursively if we can<br />
“get started”, which is clearly the case if t = T0. 3<br />
The main point is that the basis swap can be priced without using a<br />
full dynamic model, we only need today’s term structure. But it takes only<br />
minor changes in the contract specification <strong>for</strong> this conclusion to break down.<br />
For instance different dynamic models with same current term structure give<br />
different swap values if the ith payment in the basis swap is transferred to<br />
date Ti−1 (where it is first known; this is called settlement in advance) or if<br />
we swap every 3 months against the 6-month LIBOR.<br />
The need <strong>for</strong> a swap-market can also be motivated by the following example<br />
showing swaps can offer comparative advantages. In its swap-<strong>for</strong>mulation<br />
it is very inspired by Hull’s book, but you you should recognize the idea from<br />
introductory economics courses (or David Ricardo’s work of 1817, whichever<br />
came first). Consider two firms, A <strong>and</strong> B, each of which wants to borrow<br />
3 There should be a “don’t try this at work” disclaimer here. In the market different<br />
day count conventions are often used on the two swap legs, so things may not be quite<br />
what they seem.<br />
i=1<br />
swap rate
122 CHAPTER 8. STOCHASTIC INTEREST RATES<br />
$10M <strong>for</strong> 5 years. Firm A prefers to pay a floating rate, say one that is<br />
adjusted every year. It could be that the cash-flows generated by the investment<br />
(that it presumably needs the $10M <strong>for</strong>) depend (positively) on the<br />
interest rate market conditions. So from their point of view a floating rate<br />
loan removes risk. Firm B prefers to borrow at a fixed rate. In this way is<br />
knows in advance exactly how much it has to pay over the 5 years, which it<br />
is quite conceivable that someone would want. The firms contact their banks<br />
<strong>and</strong> receive the following loan offers: (Lingo: “bp” means basispoints (pronounced<br />
“beeps” if you’re really cool) <strong>and</strong> is one hundredth of a percentage<br />
point, i.e. “100bp = 1%” )<br />
Firm Fixed Floating<br />
A 5Y-ZCB-rate + 50bp 1Y-ZCB-rate + 30bp<br />
B 5Y-ZCB-rate + 170bp 1Y-ZCB-rate + 100bp<br />
So B gets a systematically “worse deal” than A, which could be because is of<br />
lower credit quality than A. But “less worse” <strong>for</strong> a floating rate loan, where<br />
they only have to pay 70bp more than A compared to 120bp <strong>for</strong> a fixed rate<br />
loan. So A could take the floating rate offer <strong>and</strong> B the fixed rate offer, <strong>and</strong><br />
everybody is mildly happy. But consider the following arrangement: A takes<br />
the fixed rate offer from the bank <strong>and</strong> B the floating rate. A then offers to<br />
lend B the 10M as a fixed rate loan “at the 5Y-ZCB-rate + 45bp”, whereas B<br />
offers to lend A its 10M floating rate loan “at the 1Y-ZCB-rate” (<strong>and</strong> would<br />
maybe add “flat” to indicate that there is no spread). In other words A <strong>and</strong><br />
B are exchanging, or swapping, their bank loans. The result:<br />
A: Pays (5Y-ZCB-rate + 50bp) (to bank), Pays 1Y-ZCB-rate (to B)<br />
<strong>and</strong> receives (5Y-ZCB-rate + 45bp) (from B). In net-terms: Pays 1Y-ZCBrate+5bp<br />
B: Pays (1Y-ZCB-rate + 100bp) (to bank), Pays (5Y-ZCB-rate + 45bp)<br />
(to A) <strong>and</strong> receives (1Y-ZCB-rate) (from A). In net-terms: Pays 5Y-ZCBrate+145bp<br />
So this swap-arrangement has put both A <strong>and</strong> B in a better position (by<br />
25bp) than they would have been had they only used the bank.<br />
But when used in the finance/interest rate context, there is somewhat of<br />
a snag in this story. We argued that the loans offered reflected differences in<br />
credit quality. If that is so, then it must mean that default (“going broke”) is<br />
a possibility that cannot be ignored. It is this risk that the bank is “charging<br />
extra” <strong>for</strong>. With this point of view the reason why the firms get better deals<br />
after swapping is that each chooses to take on the credit risk from the other<br />
party. If firm B defaults, firm A can <strong>for</strong>get about (at least part of) what’s<br />
in the “receives from B”-column, but will (certainly with this construction)
8.6. EXPECTATION HYPOTHESES 123<br />
only be able to get out of its obligations to B to a much lesser extent. So<br />
the firms are getting lower rates by taking on default risk, which a risk of<br />
the type “a large loss with a small probability”. One can quite sensibly ask<br />
if that is the kind of risks that individual firms want to take.<br />
One could try to remedy the problem by saying that we set up a financial<br />
institution through which the swapping takes place. This institution should<br />
ensure payments to the non-defaulting party (hence taking “credit risk” ×<br />
2), in return <strong>for</strong> a share of the possible “lower rate”-gain from the swap, <strong>and</strong><br />
hope <strong>for</strong> some “law of large numbers”-diversification effect. But that story<br />
is questionable; isn’t that what the bank is doing in the first place?<br />
So the morale is two-fold: i) If something seems to be too good to be true<br />
it usually is. Also in credit risk models. ii) The only way to see if the spreads<br />
offered to firms A <strong>and</strong> B are set such that there is no gain without extra risk,<br />
i.e. consistent with no arbitrage, is to set up a real dynamic stochastic model<br />
of the defaults (something that subsequent courses will do), just as stochastic<br />
term structure models help us realize that non-flat yield curves do not imply<br />
arbitrage.<br />
8.6 Expectation hypotheses<br />
Recall that the short rate in our term structure models is a stochastic process.<br />
At time 0 we do not know what the short rate will be at time 1. We<br />
may however from current bond prices compute the one-period <strong>for</strong>ward rate<br />
f(1, 2) <strong>and</strong> it is natural to think that this rate at least carries some in<strong>for</strong>mation<br />
about the level of the short rate at time 1. For example, one type of<br />
expectation hypothesis would argue, that the expected value of short rates is<br />
equal to the corresponding <strong>for</strong>ward rates. As we shall see shortly, there is<br />
little reason to think that this is satisfied in arbitrage-free models. There are<br />
a number of other expectation hypotheses that one can <strong>for</strong>mulate concerning<br />
future levels of interest rates, bond prices, yields <strong>and</strong> <strong>for</strong>ward rates. Although<br />
we will no go through all of these in great detail, one point should be clear<br />
after this: There is essentially only one expectation hypothesis which follows<br />
as a simple consequence of no arbitrage (<strong>and</strong> an assumption of risk neutral<br />
agents). Many other <strong>for</strong>m of expectation hypothesis have little mathematical<br />
justification, often there are inconsistent with each other, <strong>and</strong> very often the<br />
same <strong>for</strong>m of the expectation hypotheses cannot hold <strong>for</strong> different maturities.<br />
But let us begin with the good news. We know that in an arbitrage-free<br />
model, we have <strong>for</strong> any zero coupon bond with maturity Ti that<br />
P(t, Ti) = 1<br />
E<br />
1 + ρt Q<br />
t [P(t + 1, Ti)] .<br />
expectation<br />
hypotheses
124 CHAPTER 8. STOCHASTIC INTEREST RATES<br />
Hence st<strong>and</strong>ing at time t, the expected return under Q of holding a bond in<br />
one period is<br />
E Q<br />
t [P(t + 1, Ti)]<br />
− 1 = ρt P(t, Ti)<br />
<strong>and</strong> this does not depend on the maturity of the bond. Hence under Q, the<br />
one-period return on all bonds is the same. This is a mathematical consequence<br />
of no arbitrage. It becomes a hypothesis, which we may call the local<br />
expectations hypothesis, once we claim that this also holds under the measure<br />
P which governs the evolution of interest rates in the real world. This would<br />
of course be true if P = Q, something which only holds in an economy in<br />
which all agents are risk-neutral.<br />
Let us assume that P = Q <strong>and</strong> consider an extension (called the “return<br />
to maturity hypothesis”) of this local hypothesis to n periods which equates<br />
the expected return from rolling over the money market account in n periods<br />
with that of holding an n−period bond. This would be equivalent to stating<br />
that<br />
E Q<br />
t (Rt,t+n) = (1 + y(t, t + n)) n<br />
where y(t, t+n) is the yield at time t of a bond maturing at time t+n. What<br />
if we claim that this holds <strong>for</strong> all n? Then Jensen’s inequality brings us into<br />
trouble since from our fundamental pricing relationship we have<br />
P(t, t + n) =<br />
1<br />
= EQ<br />
(1 + y(t, t + n)) n t<br />
�<br />
1<br />
Rt,t+n<br />
<strong>and</strong> unless interest rates are deterministic we have<br />
�<br />
1<br />
�<br />
><br />
1<br />
.<br />
E Q<br />
t<br />
Rt,t+n<br />
E Q<br />
t Rt,t+n<br />
Finally let us consider another popular hypothesis about the term structure<br />
of interest rates, which states that <strong>for</strong>ward rates are unbiased predictors<br />
of short rates. Our discussion of this hypothesis will be much clearer if we<br />
have at our disposal the concept of <strong>for</strong>ward measures.<br />
Proposition 29 Given a term structure model with Q as the martingale<br />
measure. Define the r<strong>and</strong>om variable Z T T as<br />
Z T T =<br />
1<br />
R0,T+1P(0, T + 1) .<br />
�
8.6. EXPECTATION HYPOTHESES 125<br />
Then a new probability measure QT is defined by letting<br />
Q T (A) = E Q � Z T T 1A<br />
�<br />
, A ∈ F. (8.7)<br />
Under this measure, the <strong>for</strong>ward rate process (f(t, T))t=0,...,T is a martingale.<br />
Proof. First note that since ρ > −1, ZT T > 0. Also,<br />
E Q � Z T �<br />
T =<br />
1<br />
P(0, T + 1) EQ 1<br />
R0,T+1<br />
= 1<br />
<strong>and</strong> there<strong>for</strong>e (8.7) defines a new probability measure on Ω. Let<br />
Z T t = E Q � � T<br />
t ZT 1<br />
=<br />
R(0, t)P(0, T + 1) EQ<br />
�<br />
t<br />
1<br />
�<br />
Now note that<br />
E Q<br />
t<br />
There<strong>for</strong>e,<br />
� ρT<br />
Rt,T+1<br />
�<br />
=<br />
P(t, T + 1)<br />
R(0, t)P(0, T + 1) .<br />
= P(0, T + 1)R0,tE Q<br />
�<br />
t<br />
= P(t, T + 1)<br />
Z T t<br />
E Q �<br />
T<br />
t ZT ρT = P(t, T + 1)E QT<br />
t (ρ T) .<br />
Rt,T+1<br />
ρ T<br />
R0,T+1P(0, T + 1)<br />
E QT<br />
1<br />
t (ρT) =<br />
P(t, T + 1) EQ<br />
� �<br />
ρT<br />
t<br />
Rt,T+1<br />
1<br />
=<br />
P(t, T + 1) EQ<br />
�<br />
1 + ρT<br />
t −<br />
Rt,T+1<br />
1<br />
�<br />
Rt,T+1<br />
1<br />
=<br />
P(t, T + 1) EQ<br />
�<br />
1<br />
t −<br />
Rt,T<br />
1<br />
�<br />
Rt,T+1<br />
P(t, T)<br />
=<br />
− 1<br />
P(t, T + 1)<br />
= f(t, T).<br />
This proves the martingale property.<br />
This proposition shows that there exists a measure (<strong>and</strong> this measure<br />
is called the T −<strong>for</strong>ward measure) under which the expected short rate at<br />
�<br />
�
126 CHAPTER 8. STOCHASTIC INTEREST RATES<br />
risk-neutrality time T is equal to the <strong>for</strong>ward rate. Typically, the <strong>for</strong>ward measure is not<br />
equal to P, <strong>and</strong> it is not equal to Q unless interest rates are deterministic.<br />
Furthermore, one may check that <strong>for</strong> f(t, T) <strong>and</strong> f(t, T + 1) to be unbiased<br />
estimators of rT <strong>and</strong> rT+1,respectively, the spot interest rate at time T must<br />
be deterministic. The moral of all this, is that viewing the <strong>for</strong>ward rate as<br />
unbiased estimators of future short rates is problematic.<br />
8.7 Why P = Q means risk neutrality<br />
In this section we will keep referring to the measure P which is the measure<br />
determining the actual evolution of prices. To make sure that the meaning<br />
of P is clear, we can say that a statistician estimating parameters of prices is<br />
trying to find P. We have seen that the version of the expectations hypothesis<br />
known as the local expectations hypothesis holds under the martingale<br />
measure Q used <strong>for</strong> pricing. Recall that the measure Q is a measure which<br />
allows us to give convenient expressions <strong>for</strong> prices of claims <strong>and</strong> derivative<br />
securities but not a measure governing the actual movement of prices.<br />
We have stated earlier somewhat loosely that P <strong>and</strong> Q are actually the<br />
same when agents are risk neutral. Since we have not seen many agents this<br />
statement needs some elaboration. A quick sketch of this line of reasoning<br />
is the following: Recall that under Q all securities have the same one period<br />
returns: They are equal to the short rate. If Q = P it would be the case<br />
that actual expected returns were the same <strong>for</strong> all assets, regardless of their<br />
variances. This would only be possible in a world where agents are risk<br />
neutral <strong>and</strong> there<strong>for</strong>e do not care about risk (variance, say) but look only at<br />
expected returns <strong>and</strong> prefer more expected return to less. In fact, if there<br />
is as much as one risk neutral agent in the economy <strong>and</strong> two assets have<br />
different expected returns, then this one agent would ruin the equilibrium by<br />
dem<strong>and</strong>ing infinitely much of the asset with the high expected return <strong>and</strong><br />
financing the purchase by selling the asset with low expected return in infinite<br />
quantities. There<strong>for</strong>e, we may say that Q = P follows from risk neutrality<br />
of at least one agent. The argument can be made more precise by explicitly<br />
modelling the inter-temporal optimization problem of a representative agent<br />
who maximizes an additively separable expected utility of consumption over<br />
a certain time period. When this is done we can interpret the pricing relation<br />
P(t, Ti) = 1<br />
E<br />
1 + ρt Q<br />
t [P(t + 1, Ti)]<br />
in terms of marginal utilities. The key result is that in equilibrium the prices<br />
of bonds adjust in such a way that the increase in marginal utility <strong>for</strong> the
8.7. WHY P = Q MEANS RISK NEUTRALITY 127<br />
agent obtained by selling the bond at date t <strong>and</strong> using the proceeds <strong>for</strong><br />
consumption is exactly equal to the marginal loss of expected utility at date<br />
t + 1 resulting from the smaller amount of money <strong>for</strong> consumption available<br />
by selling the position in that bond at time t+1. Let us consider a one-period<br />
case. If we denote by C0 (known at time 0) <strong>and</strong> C1 (stochastic viewed from<br />
time 0) the optimal consumption of the agent at dates 0 <strong>and</strong> 1, it will be the<br />
case in equilibrium that the price of the i ′ th asset satisfies<br />
� i ′<br />
P (1)u (C1) �<br />
i.e.<br />
where<br />
P i (0)u ′ (C0) = E P 0<br />
P i (0) = E P 0<br />
<strong>and</strong> this we may then write as<br />
where Q is defined by<br />
= E P t<br />
Z1 =<br />
1 + ρ 0 =<br />
P i (0) = E Q<br />
t<br />
� �<br />
i ′ P (1)u (C1)<br />
u ′ (C0)<br />
� � i P (1)Z1<br />
1 + ρ 0<br />
u ′ (C1)<br />
EP 0 u′ (C1)<br />
u ′ (C0)<br />
E P t u ′ (C1)<br />
� � i P (1)<br />
1 + ρ 0<br />
Q(A) = E P (1AZ1).<br />
This establishes the connection between utility maximization <strong>and</strong> the equivalent<br />
martingale measure. An agent who is risk neutral will have an affine<br />
utility function, <strong>and</strong> hence <strong>for</strong> such an agent u ′ (C1) is constant (i.e. does not<br />
vary with ω as C1 does). In that case Z1 = 1 <strong>and</strong> P = Q.<br />
It is clear that P = Q is sufficient <strong>for</strong> the local expectation hypothesis to<br />
hold but it may seem to be too strong a requirement. After all, it is only an<br />
expectation of one r<strong>and</strong>om variable that we are referring to <strong>and</strong> one could<br />
imagine that a measure change would not alter this particular expectation.<br />
To analyze this question a little further, consider the fundamental definition<br />
of a new measure through the r<strong>and</strong>om variable Z1 :<br />
Q(A) = E P (1AZ1).
128 CHAPTER 8. STOCHASTIC INTEREST RATES<br />
For some r<strong>and</strong>om variable X, which could be the short rate at some future<br />
date, we have<br />
E Q (X) = E P (XZ)<br />
<strong>and</strong> there<strong>for</strong>e E Q (X) = E P (X) if <strong>and</strong> only if<br />
E P (X(Z − 1)) = 0.<br />
Since E(Z − 1) = 0 this is the same as requiring<br />
Cov(X, Z) = 0.<br />
There<strong>for</strong>e, <strong>for</strong> the change of measure to preserve a mean value we must have<br />
that the variable in question is uncorrelated with the change of measure<br />
variable Z, <strong>and</strong> this will typically not hold in the term structure models we<br />
consider.
Chapter 9<br />
Portfolio Theory<br />
Matrix Algebra<br />
First we need a few things about matrices. (A very useful reference <strong>for</strong><br />
mathematical results in the large class imprecisely defined as “well-known”is<br />
Berck & Sydsæter (1992), “Economists’ Mathematical Manual”, Springer.)<br />
• When x ∈ R n <strong>and</strong> V ∈ R n×n then<br />
∂<br />
∂x (x⊤ Vx) = (V + V ⊤ )x<br />
• A matrix V ∈ R n×n is said to be positive definite if z ⊤ Vz > 0 <strong>for</strong> all<br />
z �= 0. If V is positive definite then V −1 exists <strong>and</strong> is also positive<br />
definite.<br />
• Multiplying (appropriately) partitioned matrices is just like multiplying<br />
2 × 2-matrices.<br />
• Covariance is bilinear. Or more specifically: When X is an n-dimensional<br />
r<strong>and</strong>om variable with covariance matrix Σ then<br />
Cov(AX + B,CX + D) = AΣC ⊤ ,<br />
where A, B, C, <strong>and</strong> D are deterministic matrices such that the multiplications<br />
involved are well-defined.<br />
Basic Definitions <strong>and</strong> Justification of Mean/Variance Analysis<br />
We will consider an agent who wants to invest in the financial markets. We<br />
look at a simple model with only two time-points, 0 <strong>and</strong> 1. The agent has<br />
an initial wealth of W0 to invest. We are not interested in how the agent<br />
129
ate of return<br />
relative portfolio<br />
weights<br />
130 CHAPTER 9. PORTFOLIO THEORY<br />
determined this amount, it’s just there. There are n financial assets to choose<br />
from <strong>and</strong> these have prices<br />
Si,t <strong>for</strong> i = 1, . . .,n <strong>and</strong> t = 0, 1,<br />
where Si,1 is stochastic <strong>and</strong> not known until time 1. The rate of return on<br />
asset i is defined as<br />
ri = Si,1 − Si,0<br />
,<br />
Si,0<br />
<strong>and</strong> r = (r1, . . .,rn) ⊤ is the vector of rates of return. Note that r is stochastic.<br />
At time 0 the agent chooses a portfolio, that is he buys ai units of asset<br />
i <strong>and</strong> since all in all W0 is invested we have<br />
n�<br />
W0 = aiSi,0.<br />
i=1<br />
(If ai < 0 the agent is selling some of asset i; in most of our analysis shortselling<br />
will be allowed.)<br />
Rather than working with the absolute number of assets held, it is more<br />
convenient to work with relative portfolio weights. This means that <strong>for</strong> the<br />
ith asset we measure the value of the investment in that asset relative to<br />
total investment <strong>and</strong> call this wi, i.e.<br />
wi =<br />
aiSi,0<br />
� n<br />
i=1 aiSi,0<br />
= aiSi,0<br />
.<br />
W0<br />
We put w = (w1, . . .wn) ⊤ , <strong>and</strong> have that w⊤1 = 1. In fact, any vector<br />
satisfying this condition identifies an investment strategy. Hence in the following<br />
a portfolio is a vector whose coordinate sum to 1. Note that in this<br />
one period model a portfolio w is not a stochastic variable (in the sense of<br />
being unknown at time 0).<br />
The terminal wealth is<br />
n� n�<br />
n�<br />
W1 = aiSi,1 = ai(Si,1 − Si,0) +<br />
i=1<br />
= W0<br />
�<br />
1 +<br />
n�<br />
i=1<br />
i=1<br />
Si,0ai Si,1 − Si,0<br />
W0<br />
Si,0<br />
�<br />
i=1<br />
aiSi,0<br />
= W0(1 + w ⊤ r), (9.1)<br />
so if we know the relative portfolio weights <strong>and</strong> the realized rates of return,<br />
we know terminal wealth. We also see that<br />
E(W1) = W0(1 + w ⊤ E(r))
<strong>and</strong><br />
Var(W1) = W 2 0 Cov(w⊤r,w ⊤ r) = W 2 0w⊤ Cov(r) w.<br />
� �� �<br />
n×n<br />
131<br />
In this chapter we will look at how agents should choose w. We will<br />
focus on how to choose w such that <strong>for</strong> a given expected rate of return, the<br />
variance on the rate of return is minimized. This is called mean-variance<br />
analysis. Intuitively, it sounds reasonable enough, but can it be justified?<br />
An agent has a utility function, u, <strong>and</strong> let us <strong>for</strong> simplicity say that he<br />
derives utility from directly from terminal wealth. (So in fact we are saying<br />
that we can eat money.) We can exp<strong>and</strong> u in a Taylor series around the<br />
expected terminal wealth,<br />
u(W1) = u(E(W1)) + u ′ (E(W1))(W1 − E(W1))<br />
+ 1<br />
2 u′′ (E(W1))(W1 − E(W1)) 2 + R3,<br />
where the remainder term R3 is<br />
R3 =<br />
∞�<br />
i=3<br />
1<br />
i! u(i) (E(W1))(W1 − E(W1)) i ,<br />
“<strong>and</strong> hopefully small”. With appropriate (weak) regularity condition this<br />
means that expected terminal wealth can be written as<br />
E(u(W1)) = u(E(W1)) + 1<br />
2 u′′ (E(W1))Var(W1) + E(R3),<br />
where the remainder term involves higher order central moments. As usual<br />
we consider agents with increasing, concave (i.e. u ′′ < 0) utility functions<br />
who maximize expected wealth. This then shows that to a second order<br />
approximation there is a preference <strong>for</strong> expected wealth (<strong>and</strong> thus, by (9.1),<br />
to expected rate of return), <strong>and</strong> an aversion towards variance of wealth (<strong>and</strong><br />
thus to variance of rates of return).<br />
But we also see that mean/variance analysis cannot be a completely general<br />
model of portfolio choice. A sensible question to ask is: What restrictions<br />
can we impose (on u <strong>and</strong>/or on r) to ensure that mean-variance analysis is<br />
fully consistent with maximization of expected utility?<br />
An obvious way to do this is to assume that utility is quadratic. Then the<br />
remainder term is identically 0. But quadratic utility does not go too well<br />
with the assumption that utility is increasing <strong>and</strong> concave. If u is concave<br />
(which it has to be <strong>for</strong> mean-variance analysis to hold ; otherwise our interest<br />
utility function
mean/variance<br />
analysis<br />
Markowitz<br />
analysis<br />
132 CHAPTER 9. PORTFOLIO THEORY<br />
would be in maximizing variance) there will be a point of satiation beyond<br />
which utility decreases. Despite this, quadratic utility is often used with a<br />
“happy-go-lucky” assumption that when maximizing, we do not end up in<br />
an area where it is decreasing.<br />
We can also justify mean-variance analysis by putting distributional restrictions<br />
on rates of return. If rates of return on individual assets are normally<br />
distributed then the rate of return on a portfolio is also normal, <strong>and</strong><br />
the higher order moments in the remainder can be expressed in terms of the<br />
variance. In general we are still not sure of the signs <strong>and</strong> magnitudes of<br />
the higher order derivatives of u, but <strong>for</strong> large classes of reasonable utility<br />
functions, mean-variance analysis can be <strong>for</strong>mally justified.<br />
9.1 Mathematics of Minimum Variance Portfolios<br />
9.1.1 The case with no riskfree asset<br />
First we consider a market with no riskfree asset <strong>and</strong> n risky assets. Later<br />
we will include a riskfree asset, <strong>and</strong> it will become apparent that we have<br />
done things in the right order.<br />
The risky assets have a vector of rates of return of r, <strong>and</strong> we assume that<br />
E(r) = µ, (9.2)<br />
Cov(r) = Σ, (9.3)<br />
where Σ is positive definite (hence invertible) <strong>and</strong> not all coordinates of µ<br />
are equal. As a covariance matrix Σ is always positive semidefinite, the<br />
definiteness means that there does not exist an asset whose rate of return<br />
can be written as an affine function of the other n −1 assets’ rates of return.<br />
Note that the existence of a riskfree asset would violate this.<br />
Consider the following problem:<br />
1<br />
minw<br />
2 w⊤ � �� Σw�<br />
:= σ2P subject to w ⊤ µ = µ P<br />
w ⊤ 1 = 1<br />
Analysis of such a problem is called mean/variance analysis, or Markowitz<br />
analysis after Harry Markowitz who studied the problem in the 40’ies <strong>and</strong><br />
50’ies. (He won the Nobel prize in 1990 together with William Sharpe <strong>and</strong><br />
Merton Miller both of whom we’ll meet later.)
9.1. MATHEMATICS OF MINIMUM VARIANCE PORTFOLIOS 133<br />
Our assumptions on µ <strong>and</strong> Σ ensure that a unique finite solution exits<br />
<strong>for</strong> any value of µ P. The problem can be interpreted as choosing portfolio<br />
weights (the second constraint ensures that w is a vector of portfolio weights)<br />
such that the variance portfolio’s rate return (w ⊤ Σw; the “1/2” is just there<br />
<strong>for</strong> convenience) is minimized given that we want a specific expected rate of<br />
return (µ P; “P is <strong>for</strong> portfolio”).<br />
To solve the problem we set up the Lagrange-function with multipliers<br />
L(w, λ1, λ2) = 1<br />
2 w⊤ Σw − λ1(w ⊤ µ − µ P) − λ2(w ⊤ 1 − 1).<br />
The first-order conditions <strong>for</strong> optimality are<br />
∂L<br />
∂w = Σw − λ1µ − λ21 = 0, (9.4)<br />
w ⊤ µ − µ P = 0, (9.5)<br />
w ⊤ 1 − 1 = 0. (9.6)<br />
Usually we might say “<strong>and</strong> these are linear equations that can easily be<br />
solved”, but working on them algebraically leads to a deeper underst<strong>and</strong>ing<br />
<strong>and</strong> intuition about the model. Invertibility of Σ gives that we can write<br />
(9.4) as (check <strong>for</strong> yourself)<br />
<strong>and</strong> (9.5)-(9.6) as<br />
w = Σ −1 [µ 1]<br />
[µ 1] ⊤ w =<br />
� λ1<br />
� µP<br />
1<br />
λ2<br />
�<br />
, (9.7)<br />
�<br />
. (9.8)<br />
Multiplying both sides of (9.7) by [µ 1] ⊤ <strong>and</strong> using (9.8) gives<br />
� �<br />
µP<br />
= [µ 1]<br />
1<br />
⊤ w = [µ 1] ⊤ Σ −1 � �<br />
λ1<br />
[µ 1] . (9.9)<br />
� �� � λ2<br />
=:A<br />
Using the multiplication rules <strong>for</strong> partitioned matrices we see that<br />
�<br />
⊤ −1 ⊤ −1 µ Σ µ µ Σ 1<br />
A =<br />
µ ⊤Σ−11 1⊤Σ−1 � � �<br />
a b<br />
=:<br />
1 b c<br />
We now show that A is positive definite, in particular it is invertible. To this<br />
end let z⊤ = (z1, z2) �= 0 be an arbitrary non-zero vector in R2 . Then<br />
� �<br />
z1<br />
y = [µ 1] = z1µ + z21 �= 0,<br />
z2
minimum variance<br />
portfolio<br />
minimum variance<br />
portfolio<br />
134 CHAPTER 9. PORTFOLIO THEORY<br />
because the coordinates of µ are not all equal. From the definition of A we<br />
get<br />
∀z �= 0 : z ⊤ Az = y ⊤ Σ −1 y > 0,<br />
because Σ −1 is positive definite (because Σ is). In other words, A is positive<br />
definite. Hence we can solve (9.9) <strong>for</strong> the λ’s,<br />
� λ1<br />
λ2<br />
�<br />
= A −1<br />
�<br />
µP<br />
1<br />
<strong>and</strong> insert this into (9.7) in order to determine the optimal portfolio weights<br />
�w = Σ −1 [µ 1]A −1<br />
�<br />
µP<br />
1<br />
�<br />
,<br />
�<br />
. (9.10)<br />
The portfolio �w is called the minimum variance portfolio <strong>for</strong> a given mean<br />
µ P. (We usually can’t be bothered to say the correct full phrase: “minimum<br />
variance on rate of return <strong>for</strong> a given mean rate on return µ P ”.) The minimal<br />
portfolio return variance is<br />
�σ 2<br />
P = �w⊤ Σ�w<br />
= [µ P 1]A −1 [µ 1] ⊤ Σ −1 ΣΣ −1 [µ 1]A −1 [µ P 1] ⊤<br />
= [µ P 1]A −1 � [µ 1] ⊤ Σ −1 [µ 1] �<br />
A<br />
� �� �<br />
−1 [µ P 1] ⊤<br />
= [µ P 1]A −1<br />
�<br />
µP<br />
1<br />
=A by def.<br />
�<br />
,<br />
where symmetry (of Σ <strong>and</strong> A <strong>and</strong> their inverses) was used to obtain the<br />
second line. But since<br />
A −1 1<br />
=<br />
ac − b2 � �<br />
c −b<br />
,<br />
−b a<br />
we have<br />
�σ 2<br />
P = a − 2bµ P + cµ 2 P<br />
ac − b 2 . (9.11)<br />
In (9.11) the relation between the variance of the minimum variance portfolio<br />
<strong>for</strong> a given rp, �σ 2<br />
P , is expressed as a parabola <strong>and</strong> is called the minimum<br />
variance portfolio frontier or locus.<br />
Note that we have not just solved one “minimize variance” problem, but<br />
a whole bunch of them, namely one <strong>for</strong> each conceivable expected rate of<br />
return.
9.1. MATHEMATICS OF MINIMUM VARIANCE PORTFOLIOS 135<br />
In mean-st<strong>and</strong>ard deviation-space the relation is expressed as a hyperbola.<br />
Figure 9.1 illustrates what things look like in mean-variance-space.<br />
(When using graphical arguments you should be quite careful to use “the<br />
right space”; <strong>for</strong> instance lines that are straight in one space, are not straight<br />
in the other.) The upper half of the curve in Figure 9.1 (the solid line)<br />
identifies the set of portfolios that have the highest mean return <strong>for</strong> a given<br />
variance; these are called mean-variance efficient portfolios.<br />
Figure 9.1 also shows the global minimum variance portfolio, the portfolio<br />
with the smallest possible variance <strong>for</strong> any given mean return. Its mean, µ G,<br />
is found by minimizing (9.11) with respect to µ P, <strong>and</strong> is µ gmv = b.<br />
By c<br />
substituting this in the general �σ 2 -expression we obtain<br />
�σ 2<br />
gmv = a − 2bµ gmv + cµ 2 gmv<br />
ac − b 2<br />
= a − 2b(b/c) + c(b/c)2<br />
ac − b 2<br />
while the general <strong>for</strong>mula <strong>for</strong> portfolio weights gives us<br />
�wgmv = 1<br />
c Σ−1 1.<br />
= 1<br />
c ,<br />
Example 12 Consider the case with 3 assets (referred to as A, B, <strong>and</strong> C)<br />
<strong>and</strong> ⎡ ⎤<br />
0.1<br />
⎡<br />
0.25 0.10<br />
⎤<br />
−0.10<br />
µ = ⎣ 0.12 ⎦, Σ = ⎣ 0.10 0.36 −0.30 ⎦.<br />
0.15<br />
−0.10 −0.30 0.49<br />
The all-important A-matrix is then<br />
A =<br />
� 0.33236 2.56596<br />
2.565960 20.04712<br />
which means that the locus of mean-variance portfolios is given by<br />
�<br />
,<br />
�σ 2<br />
P = 4.22918 − 65.3031µ P + 255.097µ 2 P.<br />
The locus is illustrated in Figure 9.2 in both in (variance, expected return)space<br />
<strong>and</strong> (st<strong>and</strong>ard deviation, expected return)-space.<br />
An important property of the set of minimum variance portfolios is is socalled<br />
two-fund separation. This means that the minimum variance portfolio<br />
frontier can be generated by any two distinct minimum variance portfolios.<br />
efficient portfolio<br />
two-fund<br />
separation
136 CHAPTER 9. PORTFOLIO THEORY<br />
Expected<br />
Return<br />
b<br />
c<br />
✻<br />
1 c<br />
�<br />
�✠<br />
� Global Minimum Variance Portfolio<br />
Efficient Portfolios<br />
Figure 9.1: The minimum variance portfolio frontier.<br />
✲<br />
Variance<br />
of Return<br />
Proposition 30 Let xa <strong>and</strong> xb be two minimum variance portfolios with<br />
mean returns µ a <strong>and</strong> µ b, µ a �= µ b. Then every minimum variance portfolio,<br />
xc is a linear combination of xa <strong>and</strong> xb. Conversely, every portfolio that is<br />
a linear combination of xa <strong>and</strong> xb (i.e. can be written as αxa + (1 − α)xb)<br />
is a minimum variance portfolio. In particular, if xa <strong>and</strong> xb are efficient<br />
portfolios, then αxa + (1 − α)xb is an efficient portfolio <strong>for</strong> α ∈ [0; 1].<br />
Proof. To prove the first part let µ c denote the mean return on a given<br />
minimum variance portfolio xc. Now choose α such that µ c = αµ a+(1−α)µ b,<br />
that is α = (µ c − µ b)/(µ a − µ b) (which is well-defined because µ a �= µ b). But<br />
since xc is a minimum variance portfolio we know that (9.10) holds, so<br />
�<br />
xc = Σ −1 [µ 1]A −1<br />
�<br />
µc<br />
= Σ −1 [µ 1]A −1<br />
�<br />
αµa + (1 − α)µ b<br />
α + (1 − α)<br />
= αxa + (1 − α)xb,<br />
where the third line is obtained because xa <strong>and</strong> xb also fulfill (9.10). This<br />
1<br />
�
9.1. MATHEMATICS OF MINIMUM VARIANCE PORTFOLIOS 137<br />
expected return<br />
expected return<br />
0.08 0.12 0.16<br />
0.08 0.12 0.16<br />
A<br />
Min.-Var set in (var(r), E(r))-space<br />
B<br />
C<br />
0.0 0.2 0.4 0.6 0.8 1.0 1.2<br />
variance<br />
Min.-Var set in (std.dev.(r), E(r))-space<br />
A<br />
0.0 0.2 0.4 0.6 0.8 1.0 1.2<br />
std. dev.<br />
Figure 9.2: The minimum variance frontiers <strong>and</strong> individual assets<br />
proves the first statement. The second statement is proved by “reading from<br />
right to left” in the above equations. This shows that xc = αxa +(1−α)xb is<br />
the minimum variance portfolio with expected return αµ a +(1 −α)µ b. From<br />
this, the validity of the third statement is clear.<br />
Another important notion is orthogonality of portfolios. We say that two<br />
portfolios xP <strong>and</strong> xzP (“z is <strong>for</strong> zero”) are orthogonal if the covariance of<br />
their rates of return is 0, i.e.<br />
B<br />
C<br />
x ⊤ zP ΣxP = 0. (9.12)<br />
Often xzP is called xP’s 0-β portfolio (we’ll see why later).<br />
Proposition 31 For every minimum variance portfolio, except the global<br />
minimum variance portfolio, there exists a unique orthogonal minimum variance<br />
portfolio. Furthermore, if the first portfolio has mean rate of return µ P,<br />
its orthogonal one has mean<br />
µ zP = a − bµ P<br />
.<br />
b − cµ P<br />
Proof. First note that µ zP is well-defined <strong>for</strong> any portfolio except the global<br />
minimum variance portfolio. By (9.10) we know how to find the minimum<br />
zero-beta<br />
portfolio
138 CHAPTER 9. PORTFOLIO THEORY<br />
variance portfolios with means µ P <strong>and</strong> µ zP = (a−bµ P)/(b−cµ P). This leads<br />
to<br />
x ⊤ zPΣxP = [µ zP 1]A −1 [µ 1] ⊤ Σ −1 ΣΣ −1 [µ 1]A −1 [µ P 1] ⊤<br />
which was the desired result.<br />
= [µ zP 1]A −1 � [µ 1] ⊤ Σ −1 [µ 1] �<br />
� �� �<br />
=A by def.<br />
= [µ zP 1]A −1<br />
� �<br />
µP<br />
1<br />
� �<br />
a − bµP 1<br />
= 1<br />
b − cµ P ac − b2 �<br />
c −b<br />
−b a<br />
1<br />
=<br />
ac − b2 � �� �<br />
a − bµP cµP − b<br />
1<br />
b − cµ P a − bµ P<br />
= 0,<br />
A −1 [µ P 1] ⊤<br />
�� µP<br />
1<br />
�<br />
(9.13)<br />
Proposition 32 Let xmv (�= xgmv, the global minimum variance portfolio) be<br />
a portfolio on the mean-variance frontier with rate of return rmv, expected rate<br />
of return µ mv <strong>and</strong> variance σ 2 mv. Let xzmv be the corresponding orthogonal<br />
portfolio, xP be an arbitrary portfolio, <strong>and</strong> use similar notation <strong>for</strong> rates of<br />
return on these portfolios. Then the following holds:<br />
where<br />
µ P − µ zmv = β P,mv(µ mv − µ zmv),<br />
βP,mv = Cov(rP, rmv)<br />
σ2 .<br />
mv<br />
Proof. Consider first the covariance between return on asset i <strong>and</strong> xmv. By<br />
using (9.10) we get<br />
Cov(ri, rmv) = e ⊤ i Σxmv<br />
= e ⊤ i [µ 1]A −1<br />
�<br />
µmv<br />
= [µ i 1]A −1<br />
� µmv<br />
1<br />
From calculations in the proof of Proposition 31 we know that the covariance<br />
between xmv <strong>and</strong> xzvp is given by (9.13). We also know that it is 0.<br />
1<br />
�<br />
.<br />
�
9.1. MATHEMATICS OF MINIMUM VARIANCE PORTFOLIOS 139<br />
Subtracting this 0 from the above equation gives<br />
Cov(ri, rmv) = [µ i − µ zmv 0]A −1<br />
� �<br />
µmv<br />
1<br />
= (µ i − µ zmv) cµ mv − b<br />
ac − b2 , (9.14)<br />
� �� �<br />
:=γ<br />
where we have used the <strong>for</strong>mula <strong>for</strong> A −1 . Since this holds <strong>for</strong> all individual<br />
assets <strong>and</strong> covariance is bilinear, it also holds <strong>for</strong> portfolios. In particular <strong>for</strong><br />
xmv,<br />
σ 2 mv = γ(µ mv − µ zmv),<br />
so γ = σ 2 mv /(µ mv −µ zmv). By substituting this into (9.14) we get the desired<br />
result <strong>for</strong> individual assets. But then linearity ensures that it holds <strong>for</strong> all<br />
portfolios. �<br />
Proposition 32 says that the expected excess return on any portfolio (over<br />
the expected return on a certain portfolio) is a linear function of the expected<br />
excess return on a minimum variance portfolio. It also says that the expected<br />
excess return is proportional to covariance.<br />
The converse of Proposition 32 holds in the following sense: If there is a<br />
c<strong>and</strong>idate portfolio xC <strong>and</strong> a number µ zC such that <strong>for</strong> any individual asset<br />
i we have<br />
µ i − µ zC = β i,C(µ C − µ zC), (9.15)<br />
with β i,C = Cov(ri, rC)/σ 2 C , then xC is a minimum-variance portfolio. To see<br />
why, put γ i = σ 2 C (µ i−µ zC)/(µ C −µ zC), note that we have γ = ΣxC, <strong>and</strong> that<br />
that uniquely determines the c<strong>and</strong>idate portfolio. But by Proposition 32 we<br />
know that the minimum variance portfolio with expected rate of return µ C<br />
is (the then) one (<strong>and</strong> only) portfolio <strong>for</strong> which (9.15) holds.<br />
9.1.2 The case with a riskfree asset<br />
We now consider a portfolio selection problem with n + 1 assets. These are<br />
indexed by 0, 1, . . ., n, <strong>and</strong> 0 corresponds to the riskfree asset with (deterministic)<br />
rate of return µ 0. For the risky assets we let µ i e denote the excess<br />
rate of return over the riskfree asset, i.e. the actual rate of return less µ 0. We<br />
let µ e denote the mean excess rate of return, <strong>and</strong> Σ the variance (which is of<br />
course unaffected). A portfolio is now a n + 1-dimensional vector whose coordinate<br />
sum to unity. But in the calculations we let w denote the vector of<br />
weights w1, . . ., wn corresponding to the risky assets <strong>and</strong> write w0 = 1−w ⊤ 1.
capital market<br />
line, CML<br />
tangent portfolio<br />
140 CHAPTER 9. PORTFOLIO THEORY<br />
is<br />
With these conventions the mean excess rate of return on a portfolio P<br />
<strong>and</strong> the variance is<br />
µ e P = w⊤ µ e<br />
σ 2 P = w⊤ Σw.<br />
There<strong>for</strong>e the mean-variance portfolio selection problem with a riskless asset<br />
can be stated as<br />
1<br />
minw<br />
2 w⊤Σw subject to w ⊤ µ e = µ e P.<br />
Note that w ⊤ 1 = 1 is not a constraint; some wealth may be held in the<br />
riskless asset.<br />
As in the previous section we can set up the Lagrange-function, differentiate<br />
it, at solve to first order conditions. This gives the optimal weights<br />
�w =<br />
µ e P<br />
(µ e ) ⊤ Σ −1 µ eΣ−1 µ e , (9.16)<br />
<strong>and</strong> the following expression <strong>for</strong> the variance of the minimum variance portfolio<br />
with mean excess return µ P:<br />
�σ 2<br />
P =<br />
(µ e P )2<br />
(µ e ) ⊤ Σ −1 µ e.<br />
(9.17)<br />
So we have determined the efficient frontier. For required returns above<br />
the riskfree rate, the efficient frontier in st<strong>and</strong>ard deviation-mean space is a<br />
straight line passing through (0, µ 0) with a slope of � (µ e ) ⊤ Σ −1 µ e . This line<br />
is called the capital market line (CML).<br />
The tangent portfolio, x, is the minimum variance portfolio with all<br />
wealth invested in the risky assets, i.e. x ⊤ tan1 = 1. The mean excess return<br />
on the tangent portfolio is<br />
µ e tan = (µe ) ⊤Σ−1 µ e<br />
1⊤Σ−1 µ e<br />
,<br />
which may be positive or negative. It is economically plausible to assert<br />
that the riskless return is lower than the mean return of the global minimum<br />
variance portfolio of the risky assets. In this case the situation is as illustrated<br />
in Figure 9.3, <strong>and</strong> that explains why we use the term “tangency”. When<br />
µ e tan > 0, the tangent portfolio is on the capital market line. But the tangent<br />
portfolio must also be on the “risky assets only” efficient frontier. So the
9.1. MATHEMATICS OF MINIMUM VARIANCE PORTFOLIOS 141<br />
Expected<br />
Return<br />
µ 0<br />
✻<br />
µ gmv<br />
Tangent Portfolio<br />
❘<br />
✉<br />
Capital Market Line<br />
❘<br />
✉ “Risky Assets Only” Global Min. Var. Pf.<br />
✑ ✑✑✑✑✑✑✑✑✑✑✑✑✑✑✑✑✑✑✑✑✑✑<br />
Figure 9.3: The capital market line.<br />
“Risky Assets Only” Effcient Frontier Hyperbola<br />
Sharpe-ratio<br />
✲<br />
St<strong>and</strong>ard Deviation<br />
of Return<br />
straight line (the CML) <strong>and</strong> the hyperbola intersect at a point corresponding<br />
to the tangency portfolio. But clearly the CML must be above the efficient<br />
frontier hyperbola (we are minimizing variance with an extra asset). So the<br />
CML is a tangent to the hyperbola.<br />
For any portfolio, P we define the Sharpe-ratio (after William Sharpe) as<br />
excess return relative to st<strong>and</strong>ard deviation,<br />
Sharpe-ratioP = µ P − µ 0<br />
.<br />
In the case where µ e tan > 0, we see note from Figure 9.3 that the tangency<br />
portfolio is the “risky assets only”-portfolio with the highest Sharpe-ratio<br />
since the slope of the CML is the Sharpe-ratio of tangency portfolio. (Generally/”strictly<br />
algebraically” we should say that xtan has maximal squared<br />
Sharpe-ratio.) The observation that “Higher Sharpe-ratio is better. End of<br />
story.” makes it a frequently used tool <strong>for</strong> evaluating/comparing the per<strong>for</strong>mance<br />
<strong>for</strong> investment funds.<br />
Note that a portfolio with full investment in the riskfree asset is orthogonal<br />
to any other portfolio; this means that we can prove the following result<br />
σP
142 CHAPTER 9. PORTFOLIO THEORY<br />
in exactly the manner as Proposition 32 (<strong>and</strong> its converse).<br />
Proposition 33 Let xmv be a portfolio on the mean-variance frontier with<br />
rate of return rmv, expected rate of return µ mv <strong>and</strong> variance σ 2 mv. Let xP be<br />
an arbitrary portfolio, <strong>and</strong> use similar notation <strong>for</strong> rates of return on these<br />
portfolios. Then the following holds:<br />
where<br />
µ P − µ 0 = β P,mv(µ mv − µ 0),<br />
βP,mv = Cov(rP, rmv)<br />
σ2 .<br />
mv<br />
Conversely, a portfolio <strong>for</strong> which these equations hold <strong>for</strong> all individual assets<br />
is on the mean-variance frontier.<br />
9.2 The Capital Asset Pricing Model (CAPM)<br />
With the machinery of portfolio optimization in place, we are ready to <strong>for</strong>mulate<br />
one of the key results of modern finance theory, the CAPM-relation.<br />
Despite the clearly unrealistic assumptions on which the result is built it still<br />
provides invaluable intuition on what factors determine the price of assets in<br />
equilibrium. Note that until now, we have mainly been concerned with pricing<br />
(derivative) securities when taking prices of some basic securities as given.<br />
Here we try to get more insight into what determines prices of securities to<br />
begin with.<br />
We consider an economy with n risky assets <strong>and</strong> one riskless asset. Here,<br />
we let µ i denote the rate of return on the i’th risky asset <strong>and</strong> we let µ 0 = r0<br />
denote the riskless rate of return. We assume that µ 0 is strictly smaller than<br />
the return of the global minimum variance portfolio.<br />
Just as in the case of only risky assets one can show that with a riskless<br />
asset the expected return on any asset or portfolio can be expressed as a<br />
function of its beta with respect to an efficient portfolio. In particular, since<br />
the tangency portfolio is efficient we have<br />
where<br />
Eri − µ 0 = β i,tan(E(rtan) − µ 0) (9.18)<br />
β i,tan = Cov(ri, rtan)<br />
σ 2 tan<br />
(9.19)<br />
The critical component in deriving the CAPM is the identification of the<br />
tangency portfolio as the market portfolio. The market portfolio is defined
9.2. THE CAPITAL ASSET PRICING MODEL (CAPM) 143<br />
as follows: Assume that the initial supply of risky asset j at time 0 has a<br />
value of P j<br />
0. (So P j<br />
0 is the number of shares outst<strong>and</strong>ing times the price per<br />
share.) The market portfolio of risky assets then has portfolio weights given<br />
as<br />
w j =<br />
P j<br />
0<br />
� n<br />
i=1 P i 0<br />
(9.20)<br />
Note that it is quite reasonable to think of a portfolio with these weights as<br />
reflecting “the average of the stock market”.<br />
Now if all (say K) agents are mean-variance optimizers (given wealths of<br />
Wi(0) to invest), we know that since there is a riskless asset they will hold a<br />
combination of the tangency portfolio <strong>and</strong> the riskless asset since two fund<br />
separation applies. Hence all agents must hold the same mix of risky assets<br />
as that of the tangency portfolio. This in turn means that in equilibrium<br />
where market clearing requires all the risky assets to be held, the market<br />
portfolio (which is a convex combination of the individual agents’ portfolios)<br />
has the same mixture of assets as the tangency portfolio. Or in symbols: Let<br />
φ i denote the fraction of his wealth that agent i has invested in the tangency<br />
portfolio. By summing over all agents we get<br />
Total value of asset j =<br />
K�<br />
φiWi(0)xtan(j) i=1<br />
= xtan(j) × Total value of all risky assets,<br />
where we have used that market clearing condition that all risky assets must<br />
be held by the agents. This is a very weak consequence of equilibrium; some<br />
would just call it an accounting identity. The main economic assumption is<br />
that agents are mean-variance optimizers so that two fund separation applies.<br />
Hence we may as well write the market portfolio in equation (9.18). This is<br />
the CAPM:<br />
E(ri) − µ 0 = β i,m(E(rm) − µ 0) (9.21)<br />
where β i,m is defined using the market portfolio instead of the tangency<br />
portfolio. Note that the type of risk <strong>for</strong> which agents receive excess returns<br />
are those that are correlated with the market. The intuition is as follows: If<br />
an asset pays off a lot when the economy is wealthy (i.e. when the return of<br />
the market is high) that asset contributes wealth in states where the marginal<br />
utility of receiving extra wealth is small. Hence agents are not willing to pay<br />
very much <strong>for</strong> such an asset at time 0. There<strong>for</strong>e, the asset has a high return.<br />
The opposite situation is also natural at least if one ever considered buying<br />
insurance: An asset which moves opposite the market has a high pay off in<br />
states where marginal utility of receiving extra wealth is high. Agents are<br />
equilibrium<br />
capital asset<br />
pricing model,<br />
CAPM
144 CHAPTER 9. PORTFOLIO THEORY<br />
willing to pay a lot <strong>for</strong> that at time 0 <strong>and</strong> there<strong>for</strong>e the asset has a low return.<br />
Indeed it is probably the case that agents are willing to accept a return on<br />
an insurance contract which is below zero. This gives the right intuition but<br />
the analogy with insurance is actually not completely accurate in that the<br />
risk one is trying to avoid by buying an insurance contract is not linked to<br />
market wide fluctuations.<br />
Note that one could still view the result as a sort of relative pricing result<br />
in that we are pricing everything in relation to the given market portfolio.<br />
To make it more clear that there is an equilibrium type argument underlying<br />
it all, let us see how characteristics of agents help in determining the risk<br />
premium on the market portfolio. Consider the problem of agent i in the one<br />
period model. We assume that returns are multivariate normal <strong>and</strong> that the<br />
utility function is twice differentiable <strong>and</strong> concave 1 :<br />
max<br />
w E(ui(W i 1))<br />
s.t.W i 1 = W0(w ⊤ r + (1 − w ⊤ 1)r0)<br />
When <strong>for</strong>ming the Lagrangian of this problem, we see that the first order<br />
condition <strong>for</strong> optimality is that <strong>for</strong> each asset j <strong>and</strong> each agent i we have<br />
E � u ′ i (W i 1 )(rj − r0) � = 0 (9.22)<br />
Remembering that Cov(X, Y ) = EXY − EXEY we rewrite this as<br />
E � u ′ i (W i 1 )�E(rj − r0) = −Cov(u ′ i (W i 1 ), rj)<br />
A result known as Stein’s lemma says that <strong>for</strong> bivariate normal distribution<br />
(X, Y ) we have<br />
Cov(g(X), Y ) = Eg ′ (X)Cov(X, Y )<br />
<strong>and</strong> using this we have the following first order condition:<br />
i.e.<br />
E � u ′ i (W i 1 )�E(rj − r0) = −Eu ′′<br />
i (W i 1 )Cov(W i 1 , rj)<br />
−E (u ′ i (W i 1 ))E(rj − r0)<br />
Eu ′′<br />
i (W i 1)<br />
= Cov(W i 1, rj)<br />
Now define the following measure of agent i’s absolute risk aversion:<br />
θi := −Eu′′<br />
i (W i 1)<br />
Eu ′ i (W i 1) .<br />
1 This derivation follows Huang <strong>and</strong> Litzenberger: Foundations <strong>for</strong> Financial Economics.<br />
If prices are positive, then returns are bigger than −1, so normality must be<br />
an approximation.
9.2. THE CAPITAL ASSET PRICING MODEL (CAPM) 145<br />
Summation over all agents gives us<br />
E(rj − r0) =<br />
=<br />
1<br />
� K<br />
i=1<br />
1<br />
� K<br />
i=1<br />
Cov(W1, rj)<br />
1<br />
θi<br />
W0Cov(rm, rj)<br />
1<br />
θi<br />
where the total wealth at time 1 held in risky assets is W1 = �K i=1 W i 1 , W0<br />
is the total wealth in risky assets at time 0, <strong>and</strong><br />
rm = W1<br />
W0<br />
there<strong>for</strong>e is the return on the market portfolio. Note that this alternative<br />
representation tells us more about the risk premium as a function of the<br />
aggregate risk aversion across agents in the economy. By linearity we also<br />
get that<br />
− 1<br />
Erm − µ 0 = W M 0 Var(rm)<br />
1<br />
� , K 1<br />
i=1 θi<br />
which gives a statement as to the actual magnitude expected excess return<br />
on the market portfolio. A high θi corresponds to a high risk aversion <strong>and</strong><br />
this contributes to making the risk premium larger, as expected. Note that if<br />
one agent is very close to being risk neutral then the risk premium (holding<br />
that person’s initial wealth constant) becomes close to zero. Can you explain<br />
why that makes sense?<br />
The derivation of the CAPM when using returns is not completely clear<br />
in the sense that finding an equilibrium return does not separate out what<br />
is found exogenously <strong>and</strong> what is found endogenously. One should think<br />
of the equilibrium argument as determining the initial price of assets given<br />
assumptions on the distribution of the price of the assets at the end of the<br />
period. A sketch of how the equilibrium argument would run is as follows:<br />
1. Let the expected value <strong>and</strong> the covariance of end-of-period asset prices<br />
<strong>for</strong> all assets be given.<br />
2. Suppose further that we are given a utility function <strong>for</strong> each investor<br />
which depends only on mean <strong>and</strong> variance of end-of-period wealth.<br />
Assume that utility decreases as a function of variance <strong>and</strong> increases<br />
as a function of mean. Assume also sufficient differentiability<br />
3. Let investor i have an initial fraction of the total endowment of risky<br />
asset j.
146 CHAPTER 9. PORTFOLIO THEORY<br />
Roll’s cirtique 4. Assume that there is riskfree lending <strong>and</strong> borrowing at a fixed rate r.<br />
Hence the interest rate is exogenous.<br />
5. Given initial prices of all assets, agent i chooses portfolio weights on<br />
risky assets to maximize end of period utility. The difference in price<br />
between the initial endowment of risky assets <strong>and</strong> the chosen portfolio<br />
of risky assets is borrowed n/placed in the money market at the riskless<br />
rate. (In equilibrium where all assets are being held this implies zero<br />
net lending/borrowing.)<br />
6. Compute the solution as a function of the initial prices.<br />
7. Find a set of initial prices such that markets clear, i.e such that the<br />
sum of the agents positions in the risky assets sum up to the initial<br />
endowment of assets.<br />
8. The prices will reflect characteristics of the agents’ utility functions,<br />
just as we saw above.<br />
9. Now it is possible to derive the CAPM relation by computing expected<br />
returns etc. using the endogenously determined initial prices. This is<br />
a purely mathematical exercise translating the <strong>for</strong>mula <strong>for</strong> prices into<br />
<strong>for</strong>mulas involving returns.<br />
Hence CAPM is to be thought of as an equilibrium argument explaining asset<br />
prices.<br />
There are of course many unrealistic assumptions underlying the CAPM.<br />
The distributional assumptions are clearly problematic. Even if basic securities<br />
like stocks were well approximated by normal distributions there is no<br />
hope that options would be well approximated due to their truncated payoffs.<br />
An answer to this problem is to go to continuous time modelling where ’local<br />
normality’ holds <strong>for</strong> very broad classes of distributions but that is outside<br />
the scope of this course. Note also that a conclusion of CAPM is that all<br />
agents hold the same mixture of risky assets which casual inspection show is<br />
not the case.<br />
A final problem, originally raised by Roll, <strong>and</strong> thus refrerred to as Roll’s<br />
cirtique 2 , concerns the observability of the market portfolio <strong>and</strong> the logical<br />
equivalence between the statement that the market portfolio is efficient <strong>and</strong><br />
the statement that the CAPM relation holds. To see that observability is<br />
a problem think <strong>for</strong> example of human capital. Economic agents face many<br />
2 R. Roll (1977): A critique of the asset pricing theory’s test; Part I, Journal of Financial<br />
Economics, 4:pp 129 - 76
9.3. RELEVANT BUT UNSTRUCTURED REMARKS ON CAPM 147<br />
decisions over a life time related to human capital - <strong>for</strong> example whether it is<br />
worth taking a loan to complete an education, weighing off leisure against additional<br />
work which may increase human capital etc. Many empirical studies<br />
use all traded stocks (<strong>and</strong> perhaps bonds) on an exchange as a proxy <strong>for</strong> the<br />
market portfolio but clearly this is at best an approximation. And what if the<br />
test of the CAPM relation is rejected using that portfolio? At the intuitive<br />
level, the relation (9.18) tells us that this is equivalent to the inefficiency of<br />
the chosen portfolio. Hence one can always argue that the reason <strong>for</strong> rejection<br />
was not that the model is wrong but that the market portfolio is not<br />
chosen correctly (i.e. is not on the portfolio frontier). There<strong>for</strong>e, it becomes<br />
very hard to truly test the model. While we are not going to elaborate on<br />
the enormous literature on testing the CAPM, note also that even at first<br />
glance it is not easy to test what is essentially a one period model. To get<br />
estimates of the fundamental parameters (variances, covariances, expected<br />
returns) one will have to assume that the model repeats itself over time, but<br />
when firms change the composition of their balance sheets they also change<br />
their betas.<br />
Hence one needs somehow to accommodate betas which change over time<br />
<strong>and</strong> this inevitably requires some statistical compromises.<br />
9.3 Relevant but unstructured remarks on CAPM<br />
9.3.1 Systematic <strong>and</strong> non-systematic risk<br />
This section follows Huang <strong>and</strong> Litzenberger’s Chapters 3 <strong>and</strong> 4. We have<br />
two versions of the capital asset pricing model. The most “popular” version,<br />
where we assumed the existence of a riskless asset whose return is r0, states<br />
that the expected return on any asset satisfies<br />
Eri − r0 = β i,m(Erm − r0). (9.23)<br />
This version we derived in the previous section. The other version is the<br />
so-called zero-beta CAPM, which replaces the return on the riskless asset by<br />
the expected return on m ′ s zero-covariance portfolio:<br />
Eri − Erzm = β i,m(Erm − Erzm).<br />
This version is proved by assuming mean-variance optimizing agents, using<br />
that two-fund separation then applies, which means that the market portfolio<br />
is on the mean-variance locus (note that we cannot talk about a tangent<br />
portfolio in the model with no riskfree asset) <strong>and</strong> using Proposition 32. Note
148 CHAPTER 9. PORTFOLIO THEORY<br />
that both relations state that excess returns (i.e. returns in addition to the<br />
riskless returns) are linear functions of β im.<br />
From now on we will work with the case in which a riskless asset exists, but<br />
it is easy to translate to the zero-beta version also. Dropping the expectations<br />
(<strong>and</strong> writing “error terms” instead) we have also seen that if the market<br />
portfolio m is efficient, the return on any portfolio (or asset) q satisfies<br />
where<br />
rq = (1 − β q,m)rf + β q,mrm + ǫq,m<br />
Eǫq,m = Eǫq,mrm = 0.<br />
Hence<br />
Var(rq) = β 2<br />
q,mVar(rm) + Var(ǫq,m).<br />
This decomposes the variance of the return on the portfolio q into its systematic<br />
risk β 2<br />
qmVar(rm) <strong>and</strong> its non-systematic or idiosyncratic risk Var(ǫq,m).<br />
The reason behind this terminology is the following: We know that there exists<br />
a portfolio which has the same expected return as q but whose variance<br />
is β 2<br />
qmVar(rm) - simply consider the portfolio which invests 1 − βqm in the<br />
riskless asset <strong>and</strong> βq,m, in the market portfolio. On the other h<strong>and</strong>, since this<br />
portfolio is efficient, it is clear that we cannot obtain a lower variance if we<br />
want an expected return of Erq. Hence this variance is a risk which is correlated<br />
with movements in the market portfolio <strong>and</strong> which is non-diversifiable,<br />
i.e. cannot be avoided if we want an expected return of Erq. On the other<br />
h<strong>and</strong> as we have just seen the risk represented by the term VAR(ǫq,m) can<br />
be avoided simply by choosing a different portfolio which does a better job<br />
of diversification without changing expected return.<br />
9.3.2 Problems in testing the CAPM<br />
Like any model CAPM builds on simplifying assumptions. The model is<br />
popular nonetheless because of its strong conclusions. And it is interesting<br />
to try <strong>and</strong> figure out whether the simplifying assumptions on the behavior of<br />
individuals (homogeneous expectations) <strong>and</strong> on the institutional setup (no<br />
taxation, transactions costs) of trading are too unrealistic to give the model<br />
empirical relevance. What are some of the obvious problems in testing the<br />
model?<br />
First, the model is a one period model. To produce estimates of mean<br />
returns <strong>and</strong> st<strong>and</strong>ard deviations, we need to observe years of price data. Can<br />
we make sure that the distribution of returns over several years remain the<br />
same 3 ?<br />
3 Mulitiperiod versions exist, but they also face problems with time varying parameters.
9.3. RELEVANT BUT UNSTRUCTURED REMARKS ON CAPM 149<br />
Second (<strong>and</strong> this a very important problem) what is the ’market portfolio’<br />
? Since investments decisions of firms <strong>and</strong> individuals in real life are not<br />
restricted to stocks <strong>and</strong> bonds but include such things as real estate, education,<br />
insurance, paintings <strong>and</strong> stamp collections, we should include these<br />
assets as well, but prices on these assets are hard to get <strong>and</strong> some are not<br />
traded at all.<br />
A person rejecting the CAPM could always be accused of not having<br />
chosen the market portfolio properly. However, note that if ’proper choice’<br />
of the market portfolio means choosing an efficient portfolio then this is<br />
mathematically equivalent to having the CAPM hold.<br />
This point is the important element in what is sometimes referred to as<br />
Roll’s critique of the CAPM. When discussing the CAPM it is important to<br />
remember which facts are mathematical properties of the portfolio frontier<br />
<strong>and</strong> which are behavioral assumptions. The key behavioral assumption of<br />
the CAPM is that the market portfolio is efficient. This assumption gives<br />
the CAPM-relation mathematically. Hence it is impossible to separate the<br />
claim ’the portfolio m is efficient’ from the claim that ’CAPM holds with<br />
m acting as market portfolio’.<br />
9.3.3 Testing the efficiency of a given portfolio<br />
Since the question of whether CAPM holds is intimately linked with the<br />
question of the efficiency of a certain portfolio it is natural to ask whether<br />
it is possible to devise a statistical test of the efficiency of a portfolio with<br />
respect to a collection of assets. If we knew expected returns <strong>and</strong> variances<br />
exactly, this would be a purely mathematical exercise. However, in practice<br />
parameters need to be estimated <strong>and</strong> the question then takes a more statistical<br />
twist: Given the properties of estimators of means <strong>and</strong> variances, can<br />
we reject at (say) a 5% level that a certain portfolio is efficient? Gibbons,<br />
Ross <strong>and</strong> Shanken (Econometrica 1989, 1121-1152) answer this question -<br />
<strong>and</strong> what follows here is a sketch of their test.<br />
Given a portfolio m <strong>and</strong> N assets whose excess returns are recorded in T<br />
time periods. It is assumed that a sufficiently clear concept of riskless return<br />
can be defined so that we can really determine excess returns <strong>for</strong> each period.<br />
NOTE: We will change our notation in this section slightly <strong>and</strong> assume that<br />
rp, Erp <strong>and</strong> µ p refer to excess returns, mean excess returns <strong>and</strong> estimated<br />
mean excess returns of an asset or portfolio p. Hence using this notation the<br />
CAPM with a riskless asset will read<br />
Erp = β p,mErm.<br />
We want to test this relation or equivalently whether m is an efficient portfolio
150 CHAPTER 9. PORTFOLIO THEORY<br />
in a market consisting of N assets. Consider the following statistical model<br />
<strong>for</strong> the excess returns of the assets given the excess return on the portfolio<br />
m :<br />
rit = αi + γ i rmt + ǫit<br />
i = 1, . . ., N <strong>and</strong> t = 1, . . .., T<br />
where rit is the (r<strong>and</strong>om) excess return 4 of asset i in the t ′ th period, rmt<br />
is the observed excess return on the portfolio in the t ′ th period, αi, γ i are<br />
constants<strong>and</strong> the ǫit’sare normally distributed with Cov(ǫit, ǫjt) = σij <strong>and</strong><br />
Cov(ǫit, ǫis) = 0 <strong>for</strong> t �= s. Given these data a natural statistical representation<br />
of the question of whether the portfolio m is efficient is the hypothesis<br />
that α1 = · · · = αN = 0. This condition must hold <strong>for</strong> (9.23) to hold.<br />
To test this is not difficult in principle (but there are some computational<br />
tricks involved which we will not discuss here): First compute the MLE’s<br />
of the parameters. It turns out that in this model this is done merely by<br />
computing Ordinary Least Squares estimators <strong>for</strong> α, γ <strong>and</strong> the covariance<br />
matrix <strong>for</strong> each period Σ. A so-called Wald test of the hypothesis α = 0 can<br />
then be per<strong>for</strong>med by considering the test statistic<br />
W0 = �αV ar(�α)�α −1<br />
which you will learn more about in a course on econometrics. Here we simply<br />
note that the test statistic measures a distance of the estimated value of<br />
α from the origin. Normally, this type of statistics leads to an asymptotic<br />
chi squared test, but in this special model the distribution can be found<br />
explicitly <strong>and</strong> even more interesting from a finance perspective, it is shown<br />
in GRS that W0 has the following <strong>for</strong>m<br />
�<br />
W0 =<br />
(T − N − 1)<br />
N<br />
� bµ 2 q<br />
�<br />
bσ 2 q<br />
− bµ2 m<br />
bσ 2 m<br />
�<br />
1 + bµ2 m<br />
bσ 2 m<br />
where the symbols require a little explanation: In the minimum variance<br />
problem with a riskless asset we found that the excess return of any portfolio<br />
satisfies<br />
Erp = β pmErm.<br />
We refer to the quantity<br />
4 Note this change to excess returns.<br />
Erp<br />
σ(rp)
9.3. RELEVANT BUT UNSTRUCTURED REMARKS ON CAPM 151<br />
as the Sharpe ratio <strong>for</strong> portfolio p. The Sharpe ratio in words compares excess<br />
return to st<strong>and</strong>ard deviation. Note that using the CAPM relation we can<br />
write<br />
Erp<br />
σ(rp) = σ(rm)ρmp σ2 (rm) (Erm)<br />
where ρ mp is the correlation coefficient between the return of portfolios p <strong>and</strong><br />
m. From this expression we see that the portfolio which maximizes the Sharpe<br />
ratio is (proportional) to m. Only portfolios with this Sharpe ratio are efficient.<br />
Now the test statistic W0 compares two quantities: On one side, the<br />
maximal Sharpe ratio that can be obtained when using <strong>for</strong> parameters in<br />
the minimum variance problem the estimated covariance matrix <strong>and</strong> the estimated<br />
mean returns <strong>for</strong> the economy consisting of the N assets <strong>and</strong> the<br />
portfolio m. On the other side, the Sharpe ratio <strong>for</strong> the particular portfolio<br />
m (based on its estimated mean return <strong>and</strong> st<strong>and</strong>ard deviation).<br />
Large values of W0 will reject the hypothesis of efficiency <strong>and</strong> this corresponds<br />
to a case where the portfolio m has a very poor expected return per<br />
unit of st<strong>and</strong>ard deviation compared to what is obtained by using all assets.
152 CHAPTER 9. PORTFOLIO THEORY
Chapter 10<br />
Factor Models of Returns:<br />
Arbitrage Pricing Theory<br />
(APT)<br />
Although the APT st<strong>and</strong>s <strong>for</strong> ’Arbitrage Pricing Theory’ the model presented<br />
here is somewhat different from the arbitrage models presented earlier. The<br />
framework is in one sense closer to CAPM in that we consider a one-period<br />
model with risky assets whose distributions may be continuous. On the<br />
other h<strong>and</strong>, there is also a clear analogue with arbitrage pricing. We will<br />
present the basic idea of the model in two steps which will illustrate how the<br />
restriction on mean return arises.<br />
10.1 No noise: Exact APT<br />
Consider the following so-called factor model <strong>for</strong> the returns r1, . . .,rN of N<br />
risky assets:<br />
r = µ + Bf<br />
where r = (r1, . . .,rN) ⊤ is a vector of r<strong>and</strong>om returns, µ = (µ 1, . . .,µ N) ⊤ ,<br />
<strong>and</strong> B is an N × K−matrix whose entries are real numbers, <strong>and</strong> f =<br />
(f1, . . .,fK) is a vector of r<strong>and</strong>om variables (factors) which satisfies<br />
Efi = 0, i = 1, . . .,K,<br />
Cov(f) = Φ, Φ positive definite.<br />
Note that this means that Eri = µ i , i = 1, . . .,N. We will assume that<br />
N > K, <strong>and</strong> you should think of the number of assets N as being much<br />
larger than the number of factors K. The model then seeks to capture the<br />
153<br />
Arbitrage Pricing<br />
Theory, APT<br />
factor model
portfolio<br />
arbitrage<br />
opportunity<br />
APT equation<br />
154CHAPTER 10. FACTOR MODELS OF RETURNS: ARBITRAGE PRICING THEORY<br />
idea that returns on assets are correlated through a common dependence on<br />
a (small) number of factors. The goal is to use the assumption of such a<br />
common dependence to say something about the vector of mean returns µ.<br />
Assume that there is also a riskfree asset with return r0. When we talk about<br />
a portfolio, w, we mean a vector in R N where the ith coordinate measures<br />
the relative share of total wealth invested in the ith risky asset, <strong>and</strong> the rest<br />
in the riskfree asset. (So the term ’investment strategy given by w’ would<br />
probably be better). Hence the coordinates need not sum to 1, <strong>and</strong> the<br />
expected rate of return on w is<br />
E((1 − w ⊤ 1)r0 + w ⊤ r) = r0 + E(w ⊤ (r − r01))<br />
= r0 + w ⊤ (µ − r01), (10.1)<br />
where as usual 1 = (1, . . ., 1) ∈ R N .<br />
Since N > K it is possible to find a portfolio w ∈ R N of risky assets<br />
which is orthogonal to the column space of B. This we will write as w ∈ (B) ⊥ .<br />
Now the mean return is r0+w ⊤ (µ−1r0) <strong>and</strong> by using the “covariance matrix<br />
algebra rules” in the first part of Chapter 9 we see that the variance of the<br />
return on this portfolio is given as<br />
V (w ⊤ r) = Cov(w ⊤ Bf, w ⊤ Bf)<br />
= w ⊤ BΦB ⊤ w = 0.<br />
A reasonable no arbitrage condition to impose is that a portfolio whose return<br />
has zero variance should earn the same rate of return (could say “expected”,<br />
but the variance is 0) as the riskfree asset. Or put differently, its excess<br />
return is 0, ie. w ⊤ (µ − r01) = 0.<br />
What this means is that any vector which is orthogonal to the columnsof<br />
B is also orthogonal to the vector (µ − r01), <strong>and</strong> this implies 1 that µ − r01<br />
is in the column span of B. In other words, there exists λ = (λ1, . . .,λK)<br />
that satisfies the APT equation<br />
µ − r01 =Bλ. (10.2)<br />
The vector λ = (λ1, . . .,λK) is called the vector of factor risk premiaindexfactor<br />
risk premia <strong>and</strong> what the relation tells us is that the excess return is obtained<br />
by multiplying the factor loadings indexfactor loadings with the factor risk<br />
premia. This type of conclusion is of course very similar to the conclusion of<br />
CAPM, in which there is ’one factor’ (return on the market portfolio), β im<br />
plays the role of the factor loading <strong>and</strong> Erm − r0 is the factor risk premium.<br />
1 If you prefer a mathematical statement, we are merely using the fact that<br />
(B) ⊥ ⊂ (µ − r01) ⊥ =⇒ (µ − r01) ⊂ (B).
10.2. NOISE: APPROXIMATE APT 155<br />
10.2 Noise: Approximate APT<br />
We continue the intuition building by considering a modification of the model<br />
above. Some of the reasoning here is heuristic - it will be made completely<br />
rigorous below.<br />
Assume that<br />
r = µ + Bf + ǫ<br />
where r, µ, B <strong>and</strong> f are as above <strong>and</strong> ǫ = (ǫ1, . . .,ǫN) is a vector of r<strong>and</strong>om<br />
variables (noise terms or idiosyncratic risks) satisfying<br />
Eǫi = 0, i = 1, . . ., N,<br />
Cov(ǫi, fj) = 0, i = 1, . . ., N, j = 1, . . ., K,<br />
Cov(ǫ) = σ 2 I N , I N is the N × N identity matrix.<br />
Clearly, this is a more realistic model since the returns are not completely<br />
decided by the common factors but ’company specific’ deviations captured<br />
by the noise terms affect the returns also. However if the variance in the<br />
noise term is not too large then we can almost eliminate the variance arising<br />
from the noise term through diversification.<br />
Since N > K it is possible to find portfolios of risky assets v1, . . .,vN−K<br />
which are orthogonal <strong>and</strong> lie in (B) ⊥ . Let a be the maximal absolute value<br />
of the individual portfolio weights. Now consider the portfolio<br />
v =<br />
1<br />
N − K (v1 + · · · + vN−K).<br />
The variance of the return of this portfolio is<br />
V(v ⊤ r) = V(v ⊤ Bf + v ⊤ ǫ)<br />
1<br />
= 0 +<br />
(N − K) 2 V((v1 + · · · + vN−K) ⊤ ǫ)<br />
1<br />
≤<br />
(N − K) 2(N − K)a2σ 2<br />
= a2 σ 2<br />
N − K ,<br />
where the inequality follows from the orthogonality of the vi’s (<strong>and</strong> the definition<br />
of a).<br />
If we think of N as very large, this variance is very close to 0, <strong>and</strong> -<br />
entering into heuristic mode - there<strong>for</strong>e the expected return of this portfolio<br />
ought to be close to that of the riskless asset:<br />
Ev ⊤ r = v ⊤ µ ≈ r0. (10.3)
156CHAPTER 10. FACTOR MODELS OF RETURNS: ARBITRAGE PRICING THEORY<br />
By a slight modification of this argument it is possible to construct portfolios<br />
with good diversification which span (B) ⊥ <strong>and</strong> <strong>for</strong> each portfolio we derive<br />
a relation of the type (10.3). This then would lead us to expect that there<br />
exists factor risk premia such that<br />
µ − r01 ≈Bλ.<br />
The precise theorem will be given below.<br />
10.3 Noise <strong>and</strong> many assets: Asymptotic APT<br />
In this section we present a rigorous version of the APT.<br />
Given is a riskless asset with return r0 <strong>and</strong> an infinite number of risky<br />
assets with r<strong>and</strong>om returns (r1, r2, . . .). We will use the following notation<br />
repeatedly: If x = (x1, x2, . . .) is an infinite sequence of scalars or r<strong>and</strong>om<br />
variables, then x N is the column vector consisting of the first N elements of<br />
this sequence. Hence r N = (r1, . . ., rN) ⊤ .<br />
Definition 41 The returns (r1, r2, . . .) are said to have an approximate factor<br />
structure with factors (f1, . . ., fK) if <strong>for</strong> all N<br />
r N = µ N + B N f + ǫ N<br />
where B N is the N first rows of a matrix B with infinitely many rows <strong>and</strong><br />
K columns, where B N has rank K <strong>for</strong> N large,<br />
Eǫi = 0, i = 1, 2, . . .,<br />
Cov(ǫi, fj) = 0, i = 1, 2, . . ., j = 1, . . ., K,<br />
Cov(f) = I K<br />
Cov(ǫ N ) = Ω N<br />
(the K × K identity matrix)<br />
(Ω N is positive definite)<br />
<strong>and</strong> where the eigenvalues of Ω N are bounded uni<strong>for</strong>mly in N by a constant<br />
λ.<br />
In other words, the same K factors are governing the returns on an infinite<br />
collection of securities except <strong>for</strong> noise terms captured by ǫ which however are<br />
uni<strong>for</strong>mly of small variance. The simplest case would be where the elements<br />
of ǫ are independent 2 <strong>and</strong> have variance less than or equal to σ 2 in which<br />
case λ = σ 2 . Although our definition is slightly more general you can think<br />
2 In this case the returns are said to have a strict factor structure.
10.3. NOISE AND MANY ASSETS: ASYMPTOTIC APT 157<br />
of each element of ǫ as affecting only a finite number of returns <strong>and</strong> factors<br />
as affecting infinitely many of the returns.<br />
The assumption that the covariance matrix of the factors is the identity<br />
may seem very restrictive. Note however, that if we have a structure of the<br />
<strong>for</strong>m<br />
r = µ + Bf + ǫ<br />
which satisfies all the requirements of the definition of an approximate factor<br />
structure with the only exception being that<br />
Cov(f) = Φ (Φ is a positive definite, K × K-matrix)<br />
then using the representation Φ = CC ⊤ <strong>for</strong> some invertible K × K matrix<br />
we may choose g such that Cg = f. Then we have<br />
r = µ + BCg + ǫ<br />
<strong>and</strong> then this will be an approximate factor structure with g as factors <strong>and</strong><br />
BC as factor loadings. To verify this note that<br />
Cov(g) = C −1 CC ⊤ (C −1 ) ⊤ = I K .<br />
Hence in one sense nothing is lost by assuming the particular structure<br />
of f. We may represent the same distribution of returns in this way as if<br />
we allow a general positive definite matrix to be the covariance matrix of<br />
the factors. However, from a statistical viewpoint the fact that different<br />
choices of parameters may produce the same distributions is a cause <strong>for</strong><br />
alarm. This means that we must be careful in saying which parameters<br />
can be identified when estimating the model: Certainly, no observations can<br />
distinguish between parameters which produce the same distribution <strong>for</strong> the<br />
returns. We will not go further into these problems <strong>and</strong> to discussions of<br />
what restrictions can be imposed on parameters to ensure identification. We<br />
now need to introduce a modified notion of arbitrage:<br />
Definition 42 An asymptotic arbitrage opportunity is a sequence of portfolios<br />
(w N ),where w N ∈ R N , in the risky assetswhich satisfies<br />
<strong>and</strong><br />
lim<br />
N→∞ E(wN · r N ) = ∞<br />
lim<br />
N→∞ V(w N · r N ) = 0.
158CHAPTER 10. FACTOR MODELS OF RETURNS: ARBITRAGE PRICING THEORY<br />
factor risk premia The requirement that expected return goes to infinity (<strong>and</strong> not just some<br />
constant greater than the riskless return) may seem too strong, but in the<br />
models we consider this will not make any difference.<br />
The theorem we want to show, which was first stated by Ross <strong>and</strong> later<br />
proved in the way presented here by Huberman, is the following:<br />
Theorem 34 Given a riskless asset with return r0 > −1 <strong>and</strong> an infinite<br />
number of risky assets with r<strong>and</strong>om returns (r1, r2, ...).Assume that the returns<br />
have an approximate factor structure. If there is no asymptotic arbitrage<br />
then there exists a vector of factor risk premia (λ1, . . .,λK) such that<br />
we have<br />
∞�<br />
(µ i − r0 − λ1bi1 − · · · − λKbiK) 2 < ∞. (10.4)<br />
i=1<br />
This requires a few remarks: The content of the theorem is that the<br />
expected excess returns of the risky assets are in a sense close to satisfying<br />
the exact APT-relation (10.2): The sum of the squared deviations from the<br />
exact relationship is finite. Note that (un<strong>for</strong>tunately) this does not tell us<br />
much about the deviation of a particular asset. Indeed the mean return of<br />
an asset may show significant deviation from (10.2). This fact is crucial in<br />
underst<strong>and</strong>ing the discussion of whether the APT is a testable model.<br />
The proof must somehow use the same arbitrage argument as in the case<br />
with exact APT above by getting rid of the noise terms through diversification.<br />
Although this sounds easy, we discover once again that ’the devil is in<br />
the details’. To do the proof we will need the following two technical lemmas:<br />
Lemma 35 Let Ω be a symmetric positive definite N × N matrix <strong>and</strong> let λ<br />
be its largest eigenvalue. Then<br />
w ⊤ Ωw ≤ λ �w� 2 .<br />
Proof Let (v1, . . .,vN) be an orthonormal set of eigenvectors of Ω <strong>and</strong><br />
(λ1, . . .,λN) the corresponding eigenvalues. There exist α1, . . .,αN such that<br />
w = � N<br />
1 αivi <strong>and</strong> hence<br />
w ⊤ Ωw =<br />
=<br />
≤ λ<br />
N�<br />
1<br />
N�<br />
1<br />
α 2 iλiv ⊤ i vi<br />
α 2 i λi<br />
N�<br />
α 2 i = λ �w� 2 . �<br />
1
10.3. NOISE AND MANY ASSETS: ASYMPTOTIC APT 159<br />
Lemma 36 Let X be a compact set. Let (Ki)i∈I be a family of closed subsets<br />
of X which satisfy the finite intersection property<br />
�<br />
Ki �= ∅ <strong>for</strong> all finite subsets I0 ⊂ I.<br />
i∈I0<br />
Then the intersection of all sets is in fact non-empty. i.e.<br />
�<br />
Ki �= ∅.<br />
i∈I<br />
Proof If �<br />
i∈I Ki = ∅, then �<br />
i∈I Kc i is an open covering of X. Since X<br />
is compact the open cover contains a finite subcover �<br />
i∈I0 Kc i , but then we<br />
apparently have a finite set I0 <strong>for</strong> which �<br />
i∈I0 Ki = ∅, <strong>and</strong> this violates<br />
the assumption of the theorem. �<br />
The proof is in two stages. First we prove the following:<br />
Proposition 37 Given a riskless asset with return r0 > −1 <strong>and</strong> an infinite<br />
number of risky assets with r<strong>and</strong>om returns (r1, r2, ...).Assume that<br />
the returns have an approximate factor structure. If there is no asymptotic<br />
arbitrage then there exists a sequence of factor risk premia vectors (λ N ),<br />
λ N ∈ R K ,<strong>and</strong> a constant A such that <strong>for</strong> all N<br />
N�<br />
i=1<br />
(µ i − r0 − λ N<br />
1 bi1 − · · · − λ N<br />
K biK) 2 ≤ A. (10.5)<br />
Proof. Let us without loss of generality assume B N has rank K <strong>for</strong> all N.<br />
Consider <strong>for</strong> each N the regression of the expected excess returns on the<br />
columns of B N , i.e. the λ N ∈ R K that solves<br />
min<br />
λ (µ N − r01 − B N λ N ) ⊤ (µ N − r01 − B N λ N ) = min ||c N || 2<br />
where the residuals are defined by<br />
c N = µ N − r01 N − B N λ N<br />
By (matrix)-differentiating we get the first order conditions<br />
(B N ) ⊤ c N = 0
160CHAPTER 10. FACTOR MODELS OF RETURNS: ARBITRAGE PRICING THEORY<br />
But the K × K matrix (B N ) ⊤ B N is invertible (by our rank K assumption),<br />
so the unique solution is<br />
λ N = ((B N ) ⊤ B N ) −1 (B N ) ⊤ (µ N − r01).<br />
We also note from the first order condition that the residuals c N are orthogonal<br />
to the columns of B N . To reach a contradiction, assume that there is<br />
no sequence of factor risk premia <strong>for</strong> which (10.5) holds. Then we must have<br />
||c N || → ∞ (since ||c N || 2 is the left h<strong>and</strong> side of (10.5)). Now consider the<br />
sequence of portfolios given by<br />
w N = � � c N � � −3<br />
2 c N .<br />
The expected excess return is given by<br />
E(w N · (r N − r01 N )) = E(w N · (µ N − r01 N + B N f + ǫ N ))<br />
= E(w N · (B N γ N + c N + B N f + ǫ N ))<br />
= � � c N � � −3<br />
2 c N · c N<br />
= � � c N � � 1<br />
2 → ∞ as N → ∞.<br />
where in the third equality we used the fact that c N is orthogonal to the<br />
columns of B <strong>and</strong> that both factors <strong>and</strong> noise terms have expectation 0. The<br />
variance of the return on the sequence of portfolios is given by<br />
V(w N · (r N − r01 N )) = V(w N · (µ N − r01 N + B N f + ǫ N ))<br />
= V(w N · ǫ N )<br />
= � � c N � � −3 (c N ) ⊤ Ω N c N<br />
≤ � � c N � � −3 λ � � c N � � 2 → 0 as N → ∞<br />
where we have used Lemma 35 <strong>and</strong> the same orthogonality relations as in<br />
the expected return calculations. Clearly, we have constructed an asymptotic<br />
arbitrage opportunity <strong>and</strong> we conclude that there exists a constant A <strong>and</strong> a<br />
sequence of factor risk premia such that (10.5) holds.<br />
All that remains is a condensation argument.<br />
Proof of Theorem 34 Let A be as in the proposition above. Consider<br />
the sequence of sets (H N ) where<br />
H N =<br />
�<br />
λ ∈ R K :<br />
N�<br />
(µ i − r0 − λ1bi1 − · · · − λKbiK) 2 �<br />
≤ A .<br />
i=1
10.3. NOISE AND MANY ASSETS: ASYMPTOTIC APT 161<br />
By the preceding proposition, each H N is non-empty <strong>and</strong> clearly H N+1 ⊂<br />
H N . Define the functions f N : R K ↦→ R by<br />
f N (λ) = (µ−r01−Bλ) ⊤ (µ−r01−Bλ) = ||µ−r01|| 2 +(µ−r01) ⊤ Bλ+λ ⊤ B ⊤ Bλ,<br />
where some of the N-superscripts have been dropped <strong>for</strong> the ease of notation.<br />
Then f N is a convex function (because B ⊤ B is always positive semidefinite),<br />
<strong>and</strong> we see that<br />
H N = � λ ∈ R K : f(λ) ≤ A �<br />
is a closed convex set. Now pick an N so large that B has rank K. To<br />
show that H N is then compact, it suffices (by convexity) to show that <strong>for</strong><br />
all nonzero λ ∈ H N there exists a scaling factor (a real number) a such that<br />
aλ �∈ H N . But since B has full rank, there is no nonzero vector (in R K ) that<br />
is orthogonal to all of B’s (N) rows. Hence <strong>for</strong> an arbitrary nonzero λ ∈ H N<br />
we have that ||Bλ|| �= 0 <strong>and</strong><br />
f N (aλ) = ||µ − r01|| 2 + a(µ − r01) ⊤ Bλ + a 2 ||Bλ|| 2 ,<br />
so by choosing a large enough a we go outside H N , so H N is compact. Then<br />
we may use Lemma 36 to conclude that<br />
∞�<br />
N=1<br />
H N �= ∅.<br />
Any element λ = (λ1, . . .,λK) ⊤ of this non-empty intersection will satisfy<br />
10.4.
162CHAPTER 10. FACTOR MODELS OF RETURNS: ARBITRAGE PRICING THEORY
Chapter 11<br />
Corporate <strong>Finance</strong>: Firms’<br />
Financial Decisions<br />
One may think of decisions of firms as divided into two categories: real<br />
decisions <strong>and</strong> financial decisions. (Think of Fisher separation.) The real<br />
decisions focus on which projects the firms should undertake, the financial<br />
decisions deal with how the firm should raise money to undertake the desired<br />
projects. The area of corporate finance tries to explain the financial decisions<br />
of firms.<br />
This chapter gives a very short introduction to the most basic issues in this<br />
area. The goal is to underst<strong>and</strong> a couple of famous irrelevance propositions<br />
set <strong>for</strong>th by Modigliani <strong>and</strong> Miller stating conditions under which the firms<br />
financing decisions are in fact of no consequence. The conditions are very<br />
restrictive but very useful too since any discussion about optimality <strong>and</strong><br />
rationality of financing decisions must start by relaxing one or several of<br />
these conditions.<br />
We will consider only two types of securities: bonds <strong>and</strong> stocks.<br />
In reality there are many other types of securities (convertible bonds,<br />
callable bonds, warrants, . . .) <strong>and</strong> an important area of research (security<br />
design) seeks to explain why the different types of financing even exist. But<br />
we will have enough to do just learning the basic terminology <strong>and</strong> the reader<br />
will certainly see how to include more types of securities into the analysis.<br />
Finally, it should be noted that a completely rigorous way of analyzing<br />
the firm’s financing decisions requires general equilibrium theory - especially<br />
a setup with incomplete markets - but such a rigorous analysis will take far<br />
more time than we have in this introductory course.<br />
163<br />
Modigliani-Miller<br />
results
Arrow-Debreu<br />
prices<br />
debt<br />
equity<br />
bond holders<br />
stock holders<br />
value of the firm<br />
164CHAPTER 11. CORPORATE FINANCE: FIRMS’ FINANCIAL DECISIONS<br />
11.1 ’Undoing’ the firm’s financial decisions<br />
At the heart of the irrelevance propositions are the investors ability to ’undo’<br />
the firm’s financial decision: If a firm changes the payoff profile of its debt<br />
<strong>and</strong> equity, the investor can under restrictive assumptions change his portfolio<br />
<strong>and</strong> have an unchanged payoff of his investments. We illustrate all this in a<br />
one-period, finite state space model.<br />
Given two dates 0 <strong>and</strong> 1 <strong>and</strong> a finite state space with S states. Assume<br />
that markets are complete <strong>and</strong> arbitrage free. Let ps denote the price of an<br />
Arrow-Debreu security <strong>for</strong> state s, i.e. a security which pays 1 if the state<br />
at date 1 is s <strong>and</strong> 0 in all other states. Assume that an investment policy<br />
has been chosen by the firm which costs I0 to initiate at time 0 <strong>and</strong> which<br />
delivers a state contingent payoff at time 1 given by the vector (i.e. r<strong>and</strong>om<br />
variable) x = (x1, . . .,xS).<br />
The firm at date 0 may choose to finance its investment by issuing debt<br />
maturing at date 1 with face value D, <strong>and</strong> by issuing shares of stocks (called<br />
equity). You can think of the debt as money borrowed at that bank, or as<br />
raised through the issue of corporate bonds. Assuming no bankruptcy costs,<br />
the payoffs at the final date to the holders of equity <strong>and</strong> debt are given by<br />
the r<strong>and</strong>om variables<br />
E1 = max(x − D, 0)<br />
B1 = min(x, D)<br />
respectively. This is the definition, <strong>and</strong> it reflects that<br />
• Debt holders (alternatively: bond holders) get their money first . . .<br />
• . . . <strong>and</strong> them stock holders get what’s left, but have limited liability.<br />
The debt holders cannot <strong>for</strong>ce them to pay more than the firm is worth.<br />
If we assume that there are N, stocks, the payoff to each stock is given by<br />
S1 = 1<br />
N E1. Note that the entire cash flow to the firm is distributed between<br />
debt <strong>and</strong> equity holders. If we define the value of the firm at time 0 as the<br />
value at time 0 of the cash flows generated at time 1 minus the investment<br />
I0, it is clear that the value of the firm at time 0 is independent of the level of<br />
D. This statement is often presented as Modigliani-Miller theorem but as we<br />
have set it up here (<strong>and</strong> as it is often presented) it is not really a proposition<br />
but an assumption: The value of the firm is by assumption unaffected by<br />
D since by assumption the payoff on the investment is unaffected by the<br />
choice of D. As we shall see below, this changes <strong>for</strong> example when there are<br />
bankruptcy costs or taxes.
11.1. ’UNDOING’ THE FIRM’S FINANCIAL DECISIONS 165<br />
Consider two possible financing choices: One in which the firm chooses<br />
to be an all equity (unlevered) firm <strong>and</strong> have D = 0, <strong>and</strong> one in which the<br />
firm chooses a level of D > 0 (a levered firm). We let superscript U denote<br />
quantities related to the unlevered firm <strong>and</strong> let superscript L refer to the case<br />
of a levered firm. By assumption V L = V U since the assumption of leverage<br />
only results in a different distribution of the ’pie’ consisting of the firm’s<br />
cash flows, not a change in the pie’s size. Now consider an agent who in his<br />
optimal portfolio in equilibrium wants to hold a position of one stock in the<br />
unlevered firm. The payoff at date 1 of this security is given by<br />
S U 1 = 1<br />
N EU 1 = 1<br />
N x.<br />
If the firm decides to become a levered firm, the payoff of one stock in the<br />
firm becomes<br />
S L 1 = 1<br />
max(x − D, 0)<br />
N<br />
which is clearly different from the unlevered case. However note the following:<br />
Holding 1<br />
1<br />
shares in the levered firm <strong>and</strong> the fraction of the firms debt,<br />
N N<br />
produces a payoff equal to<br />
1<br />
1 1<br />
max(x − D, 0) + min(x, D) =<br />
N N N x.<br />
From this we see that even if the firm changes from an unlevered to a levered<br />
firm, the investor can adapt to his preferred payoff by changing his portfolio<br />
(something he can always do in a complete market).Similarly, we note from<br />
the algebra above that it is possible to create a position in the levered firm’s<br />
stock by holding one share of unlevered stock <strong>and</strong> selling the fraction 1<br />
N<br />
of the firm’s debt. In other words, the investor is able to undo the firm’s<br />
financial decision. In general equilibrium models this implies, that if there<br />
is an equilibrium in which the firm chooses no leverage, then there is also<br />
an equilibrium in which the firm chooses leverage <strong>and</strong> the investors choose<br />
portfolios to offset the change in the firm’s financing decision. This means<br />
that the firm’s capital structure remains unexplained in this case <strong>and</strong> more<br />
structure must be added to underst<strong>and</strong> how a level of debt may be optimal<br />
in some sense.<br />
It is important to note that something like complete markets is required<br />
<strong>and</strong> this is very restrictive. In real world terms, to imitate a levered stock in<br />
the firm, the investor must be able to borrow at the same conditions as the<br />
firm (highly unrealistic) <strong>and</strong> furthermore have the debt contract structured<br />
in such a way, that it imitates the payoffs of the firm when it is in bankruptcy.<br />
We now consider another financing decision at time 0, namely the dividend<br />
decision. We consider <strong>for</strong> simplicity a firm which is all equity financed.<br />
leverage
166CHAPTER 11. CORPORATE FINANCE: FIRMS’ FINANCIAL DECISIONS<br />
To give this a somewhat more realistic setup, imagine that we are in fact<br />
considering the last period of a firm’s life <strong>and</strong> that it carries with it an ’endowment’<br />
of cash W0 from previous periods, which you can also think of as<br />
’earnings’ from previous activity. Also, imagine that the firm has N shares<br />
of stock outst<strong>and</strong>ing initially. The value of the firm at time 0 is given by the<br />
value of the cash flows that the firm delivers to shareholders:<br />
V0 = Div0 − ∆E0 + �<br />
s<br />
psxs<br />
where Div0 is the amount of dividends paid at time 0 to the shareholders <strong>and</strong><br />
∆E0 is the amount of new shares issued (repurchased if negative) at time 0.<br />
It must be the case that<br />
W0 + ∆E0 = I0 + Div0<br />
i.e. the initial wealth plus money raised by issuing new equity is used either<br />
<strong>for</strong> investment or dividend payout. If the firm’s investment decision has<br />
been fixed at I0 <strong>and</strong> W0 is given, then Div0 − ∆E0 = W0 − I0 is fixed, <strong>and</strong><br />
substituting this into the equation <strong>for</strong> firm value tells us that firm value<br />
is independent of dividends when the investment decision is given. The<br />
dividend payment can be financed with issuing stocks. This result is also<br />
sometimes referred to as the Modigliani-Miller theorem.<br />
But you might think that if the firm issues new stock to pay <strong>for</strong> a dividend<br />
payout, it dilutes the value of the old stocks <strong>and</strong> possibly causes a loss to<br />
the old shareholders. In the world with Arrow-Debreu prices this will not<br />
happen:<br />
Consider a decision to issue new stocks to finance a dividend payment of<br />
Div0. Assume <strong>for</strong> simplicity that I0 = W0. The number of stocks issued to<br />
raise Div0 amount is given by M where<br />
Div0 = M<br />
N + M<br />
�<br />
psxs.<br />
The total number of stocks outst<strong>and</strong>ing after this operation is M + N <strong>and</strong><br />
the value that the old stockholders are left with is the sum of the dividend<br />
<strong>and</strong> the diluted value of the stocks, i.e.<br />
Div0 + N �<br />
psxs<br />
N + M<br />
M<br />
=<br />
N + M<br />
= �<br />
s<br />
psxs<br />
�<br />
s<br />
s<br />
s<br />
psxs + N<br />
N + M<br />
�<br />
s<br />
psxs
11.2. TAX SHIELD 167<br />
which is precisely the value be<strong>for</strong>e the equity financed dividend payout. This<br />
means that the agent who depends in his optimal portfolio choice on no dividends<br />
can undo the firm’s decision to pay a dividend by taking the dividend<br />
<strong>and</strong> investing it in the firms equity. Similarly, if a dividend is desired at time<br />
0 but the firm does not provide one, the investor can achieve it by selling<br />
the appropriate fraction of his stock position. The key observation is that as<br />
long as the value of the shareholders position is unchanged by the dividend<br />
policy, the investor can use complete financial markets to design the desired<br />
cash flow.<br />
A critical assumption <strong>for</strong> dividends to have no effect on the value of the<br />
firm <strong>and</strong> on the shareholder’s wealth is that income from dividend payouts<br />
<strong>and</strong> income from share repurchases are taxed equally - something which is<br />
not true in many countries. If there is a lower tax on share repurchases it<br />
would be optimal <strong>for</strong> investors to receive no dividends <strong>and</strong> have any difference<br />
between W0 <strong>and</strong> I0 paid out by a share repurchase by the firm. Historically,<br />
one has observed dividend payouts even when there is lower taxes on share<br />
repurchases. Modigliani-Miller then tells us that something must be going on<br />
in the real world which is not captured by our model. The most important<br />
real world feature which is not captured by our model is asymmetric in<strong>for</strong>mation.<br />
Our model assumes that everybody agrees on what the cash flows<br />
of the firm will be in each state in the future. In reality, there will almost always<br />
be insiders (managers <strong>and</strong> perhaps shareholders) who know more about<br />
the firm’s prospects than outsiders (potential buyers of stocks, debtholders)<br />
<strong>and</strong> both the dividend policy <strong>and</strong> the leverage may then be used to signal<br />
to the outside world what the prospects of the firm really are. Changing the<br />
outsider’s perception of the firm may then change the value of the firm.<br />
11.2 Tax shield<br />
If we change the model a little bit <strong>and</strong> assume that there are corporate<br />
taxes but that equity <strong>and</strong> debt financing are treated differently in the tax<br />
code then the capital structure becomes important. Change the model by<br />
assuming that the cash flows at time 1 are taxed at a rate of τc but that<br />
interest payments on debt can be deducted from taxable income. Let rD<br />
denote the part of the debt repayment which is regarded as ’interest’. The<br />
after tax cash flow of an unlevered firm at time 1 is given by<br />
V U<br />
1<br />
= (1 − τc)x<br />
tax shield<br />
capital structure
ankruptcy<br />
costs<br />
NPV criterion<br />
168CHAPTER 11. CORPORATE FINANCE: FIRMS’ FINANCIAL DECISIONS<br />
whereas the after tax cash flow of the levered firm (assuming full deduction<br />
of interest in all states) is given by<br />
V L<br />
1 = rD + (1 − τc)(x − rD).<br />
The difference in the cash flows is there<strong>for</strong>e<br />
V L<br />
1<br />
− V U<br />
1<br />
= τcrD<br />
which means that the levered firm gets an increased value of<br />
�<br />
= τcrD ps.<br />
V L<br />
0<br />
− V U<br />
0<br />
As D increases, so does the value of this tax shield. Hence, in this setup<br />
financing the firm’s operations with debt only would be optimal. But of<br />
course, it would be hard to convince tax authorities that a 100% debt financing<br />
was not actually a 100% equity financing! On the other h<strong>and</strong>, it should<br />
at least be the case that a significant fraction of debt was used <strong>for</strong> financing<br />
when there is a tax shield.<br />
11.3 Bankruptcy costs<br />
Using a very high level of debt also increases the probability of bankruptcy.<br />
And it would add realism to our model if we assumed that when bankruptcy<br />
occurs, lawyers <strong>and</strong> accountants receive a significant fraction of the value<br />
left in the firm. This means that the total remaining value of the firm is no<br />
longer distributed to debtholders, <strong>and</strong> the debtholders will there<strong>for</strong>e have an<br />
interest in making sure that the level of debt issued by a firm is kept low<br />
enough to reduce the risk of bankruptcy to an acceptable level.<br />
The trade-off between gains from leverage resulting from a tax shield<br />
<strong>and</strong> losses due to the increased likelihood of bankruptcy gives a first shot at<br />
defining an optimal capital structure. This is done in one of the exercises.<br />
11.4 Financing positive NPV projects<br />
We have seen earlier that in a world of certainty, one should only start a<br />
project if it has positive NPV. When uncertainty enters into our models<br />
the NPV criterion is still interesting but we need of course to define an<br />
appropriate concept of NPV. Both the arbitrage-free pricing models <strong>and</strong> the<br />
CAPM models gave us ways of defining present values of uncertain income<br />
streams.<br />
s
11.4. FINANCING POSITIVE NPV PROJECTS 169<br />
We consider a one-period, finite state space model in which there is a<br />
complete, arbitrage-free market. Denote state prices (Arrow-Debreu prices)<br />
by p = (p1, . . .,pS). Assume that a firm initially (because of previous activity,<br />
say) has a net cash flow at time 1 given by the vector x = (x1 , . . ., xS). The<br />
firm is financed partly by equity <strong>and</strong> partly by debt, <strong>and</strong> firm value, equity<br />
value <strong>and</strong> debt value at time 0 are there<strong>for</strong>e given as<br />
V0 = �<br />
s<br />
psxs<br />
E0 = �<br />
ps(xs − D) +<br />
s<br />
B0 = �<br />
ps min(xs, D).<br />
s<br />
We want to consider some issues of financing new investment projects in this<br />
very simple setup. We first note that projects with identical net present<br />
values may have very different effects on debt <strong>and</strong> equity. Indeed, a positive<br />
NPV project may have a negative effect on one of the two. This means that<br />
the ability to renegotiate the debt contract may be critical <strong>for</strong> the possibility<br />
of carrying out a positive NPV project.<br />
Consider the following setup in which three projects a, b, c are given, all<br />
assumed to cost 1$ at time 0 to initiate, <strong>and</strong> with no possibility of scaling.<br />
Also shown is the cash flow x which requires no initial investment <strong>and</strong> the<br />
corresponding values of debt <strong>and</strong> equity when the debt has a face value of<br />
30 :<br />
p a b c x E1 B1<br />
state 1 0.4 2 17 2 20 0 20<br />
state 2 0.3 -20 0 4 40 10 30<br />
state 3 0.3 30 -10 6 60 30 30<br />
PV - 3.8 3.8 3.8 38 12 26<br />
Hence there are three projects all of which have an NPV of 2.8. There<strong>for</strong>e,<br />
the increase in overall firm value will be 2.8. But how should the projects be<br />
financed? Throughout this chapter, we assume that all agents involved know<br />
<strong>and</strong> agree on all payouts <strong>and</strong> state prices. This is an important situation<br />
to analyze to develop a terminology <strong>and</strong> to get the ’competitive’ situation<br />
straight first.<br />
One possibility is to let the existing shareholders finance it out of their<br />
own pockets, i.e. pay the one dollar to initiate a project <strong>and</strong> do nothing<br />
about the terms of the debt: Here is what the value of equity looks like in<br />
the three cases at time 0:
170CHAPTER 11. CORPORATE FINANCE: FIRMS’ FINANCIAL DECISIONS<br />
E new<br />
0<br />
Enew 0 − Eold 0<br />
B new<br />
0<br />
x + a 18 6 23.8 -2.2<br />
x + b 11.8 -0.2 30 4<br />
x + c 15 3 26.8 0.8<br />
Bnew 0 − Bold 0<br />
Clearly, only projects a <strong>and</strong> c will be attractive to the existing shareholders.<br />
Project a is however not something the bondholders would want carried<br />
through since it actually redistributes wealth over to the shareholders. What<br />
if a project is instead financed by issuing new stocks to other buyers? Let<br />
us check when this will be attractive to the old shareholders: This we can<br />
h<strong>and</strong>le theoretically without actually working out the numbers:<br />
To raise one dollar by issuing new equity, the new shareholders must<br />
acquire m shares, where m satisfies<br />
m<br />
n + m Enew 0 = 1<br />
<strong>and</strong> where n is the existing number of outst<strong>and</strong>ing shares <strong>and</strong> Enew 0 is the<br />
value of the equity after a new project has been carried out. Note that in<br />
this way new shareholders are by definition given a return on their investment<br />
consistent with the state prices. The old shareholders will be happy about<br />
the project as long as<br />
n<br />
n + m Enew 0 − E old<br />
0 > 0<br />
i.e. as long as they have a capital gain on their shares. But this is equivalent<br />
to requiring that<br />
�<br />
1 − m<br />
�<br />
E<br />
n + m<br />
new<br />
0 − Eold 0<br />
E new<br />
0 − E old<br />
0<br />
> 0 i.e.<br />
> 1<br />
where we have used the definition of m to get to the last inequality. Note that<br />
this requirement is precisely the same as the one stating that in the case of<br />
financing by the old shareholders, the project should cost less to initiate than<br />
the capital gain. Note the similarity with the dividend irrelevance argument.<br />
In the argument we have just given, the shareholders decide whether to get<br />
a capital gain of E new<br />
0<br />
− Eold<br />
0 <strong>and</strong> have a negative dividend of 1$, whereas in<br />
the other case, the capital gain is n<br />
n+m Enew<br />
0 − E old<br />
0 but there is no dividend.<br />
Now consider debt financing. There are many ways one could imagine<br />
this happening: One way is to let the debtholders finance the projects by
11.4. FINANCING POSITIVE NPV PROJECTS 171<br />
having so much added to face value D that the present value of debt increases<br />
by 1. This requires three very different face values:<br />
new face value Enew 0 Bnew 0<br />
a 40.67 14.8 27<br />
b 27 14.8 27<br />
c 30,33 14.8 27<br />
An interesting special case is the following: Assume that existing bondholders<br />
are not willing to do any renegotiation of the debt terms. One could<br />
imagine <strong>for</strong> example, that the bondholders consisted of a large group of individuals<br />
who cannot easily be assembled to negotiate a new deal. Now, if<br />
project b were the only available project, then the shareholders would not<br />
enter into this project since the benefits of the project would go to the bondholders<br />
exclusively. This is the so-called debt overhang problem where it is<br />
impossible to finance a positive NPV project by issuing debt which is junior<br />
to the existing debt. To be able to carry through with project b, the shareholders<br />
would have to talk the debtholders into reducing the face value of<br />
the debt.<br />
In general, it is easy to see that if a project has positive NPV there exists<br />
a way of financing the project which will benefit both debt holders <strong>and</strong> equity<br />
holders (can you show this?).<br />
A special case which one often sees mentioned in textbooks is the case<br />
where the new project is of the same ’risk class’ as the firm be<strong>for</strong>e entering<br />
into the project. This is true of project c. Such a project can always be<br />
financed by keeping the same debt-equity ratio after the financing as be<strong>for</strong>e.<br />
This is also left to the reader to show.
172CHAPTER 11. CORPORATE FINANCE: FIRMS’ FINANCIAL DECISIONS
Chapter 12<br />
Efficient Capital Markets<br />
At the intuitive level, the efficient market hypothesis (EMH) states that it is<br />
impossible to ”beat the market”: The return you earn by investing in financial<br />
assets is proportional to the risk you assume. If certain assets had high<br />
returns compared to their risks, investors - who are constantly searching <strong>for</strong><br />
<strong>and</strong> analyzing in<strong>for</strong>mation about companies, commodities, economic indicators,<br />
etc. - would rush to buy these assets, pushing up prices until returns<br />
were ”proportional” to the risk. In this way in<strong>for</strong>mation about future returns<br />
of financial assets are quickly incorporated into prices which in other words<br />
fully <strong>and</strong> instantaneously reflect all available relevant in<strong>for</strong>mation.<br />
A first attempt to make this intuitive statement more rigorous is to elaborate<br />
a little bit on the definition of ”relevant in<strong>for</strong>mation” <strong>and</strong> to interpret<br />
’reflecting in<strong>for</strong>mation’ as an inability to earn excessive returns. This leads<br />
us to the famous degrees of efficiency:<br />
1. Weak-<strong>for</strong>m efficiency. No investor can earn excess returns developing<br />
trading rules based on historical price or return in<strong>for</strong>mation. In other words,<br />
the in<strong>for</strong>mation in past prices or returns is not useful or relevant in achieving<br />
excess returns.<br />
2. Semistrong-<strong>for</strong>m efficiency. No investor can earn excess returns from<br />
trading rules based on any publicly available in<strong>for</strong>mation. Examples of publicly<br />
available in<strong>for</strong>mation are annual reports of companies, investment advisory<br />
data such as ”Heard on the Street” in the Wall Street Journal, or ticker<br />
tape in<strong>for</strong>mation.<br />
3. Strong-<strong>for</strong>m efficiency. No investor can earn excess returns using any<br />
in<strong>for</strong>mation, whether publicly available or not.<br />
Of course, we could define efficiency with respect to any in<strong>for</strong>mation set<br />
It: No trader can earn excess returns between time t <strong>and</strong> t + 1 given the<br />
in<strong>for</strong>mation It.<br />
Once we start thinking about this definition, however, we note that it is<br />
173
174 CHAPTER 12. EFFICIENT CAPITAL MARKETS<br />
still well short of being rigorous. What do we mean by ”risk” <strong>and</strong> by return<br />
being ”proportional to risk”? And if indeed prices (in some sense) reflect all<br />
available in<strong>for</strong>mation why are banks <strong>and</strong> other financial institutions paying<br />
analysts to find in<strong>for</strong>mation, <strong>and</strong> traders to ’look <strong>for</strong> arbitrage’ in the market?<br />
In this note we will analyze the problem of defining market efficiency as<br />
follows:<br />
First, we consider the problem of defining excess return. The only ’model<br />
free’ definition of this concept would be an arbitrage opportunity. Other<br />
definitions are invariably linked to a particular model <strong>for</strong> security returns.<br />
If we are unable to find arbitrage opportunities can we then ever reject the<br />
hypothesis of ’market efficiency’?<br />
Second, we consider some statistical properties of prices which are often<br />
thought of as being consequences of EMH. We try to give some rigorous<br />
definitions of these properties <strong>and</strong> (briefly) discuss if they are in any way<br />
necessarily linked to market efficiency.<br />
Third, we look at anomalies <strong>and</strong> a very interesting challenge to market<br />
efficiency which attempts to show that stock prices are ’too volatile’ in the<br />
sense that they vary much more than accounted <strong>for</strong> by changes in economic<br />
fundamentals.<br />
Finally we mention some attempts to make the definition of market efficiency<br />
completely rigorous in a general equilibrium context.<br />
12.1 Excess returns<br />
First, we try to make ”excess returns” a little more precise: As a first attempt<br />
we could say that <strong>for</strong> any security P it must be the case that<br />
E [Rt+1 | It] = 1 + rt<br />
where rt is the riskless rate of return at time t <strong>and</strong><br />
Rt+1 = Pt+1<br />
Pt<br />
.<br />
(12.1)<br />
But having heard of CAPM <strong>and</strong> risk aversion we immediately object to<br />
the use of rt: Assets with high risk (as measured e.g. through their β’s)<br />
should (<strong>and</strong> do!) earn more than the riskless rate. So we restate (12.1) as<br />
E [Rt+1|It] = 1 + r P t<br />
(12.2)<br />
where r P t is some return which is suitable <strong>for</strong> asset P. Note that we may<br />
rewrite (12.2) as<br />
1<br />
1 + r P t<br />
E [Pt+1 | It] = Pt,
12.1. EXCESS RETURNS 175<br />
which states that the properly discounted price is a martingale. If markets<br />
are arbitrage free, such a discount factor will exist, so the requirement (12.2)<br />
is really nothing more than a statement of no arbitrage. In practice the<br />
- indeed we spent a lot of time looking<br />
problem is to find a good model <strong>for</strong> rP t<br />
at CAPM which tried to do just that. But if we have a model <strong>for</strong> rP t <strong>and</strong> we<br />
see violations of (12.2), it would seem more natural to reject our model <strong>for</strong><br />
rP t than to reject market efficiency. Assume <strong>for</strong> instance that we use CAPM<br />
. The literature often refers to a rejection of (12.2) as a rejection<br />
to model rP t<br />
of ”a joint test of CAPM <strong>and</strong> market efficiency”. Given the very strong<br />
assumptions needed to derive CAPM, this is a somewhat strange statement<br />
(although it is of course logically OK). I would argue that unless there is<br />
a truly compelling <strong>and</strong> extremely realistic model (in terms of assumptions<br />
describing markets accurately) <strong>for</strong> rP t , we should consider rejections of (12.2)<br />
as rejections of our choice of asset pricing model <strong>and</strong> not worry about the<br />
market efficiency implications. Some proponents of efficient markets would<br />
say that it is precisely the belief in efficient markets which causes us to reject<br />
our model <strong>and</strong> look further <strong>for</strong> a rational explanation of stock price returns,<br />
<strong>and</strong> this is of course a valid point. But can we ever reach a situation in which<br />
all conceivable models <strong>for</strong> rational behavior have been rejected <strong>and</strong> we have<br />
no choice but to reject the EMH?<br />
The closest to this situation would be a case where the model <strong>for</strong> rP t follows<br />
from a no arbitrage condition. If, <strong>for</strong> example, we considered a portfolio<br />
of a written call, a put (both European with same exercise price <strong>and</strong> date)<br />
<strong>and</strong> a stock (the underlying security <strong>for</strong> both options), we know from putcall-parity<br />
that its return should equal the return on a zero-coupon bond.<br />
Violations of this relation which are large enough that traders may take<br />
advantage of it should clearly not persist in well functioning security markets.<br />
In other words, no arbitrage is a necessary condition <strong>for</strong> markets to<br />
be efficient. And only this provides a test of (12.2) which is not linked to a<br />
particular choice of asset pricing model. Another way of stating this is that<br />
we can use (12.2) to test <strong>for</strong> violations of relative pricing relations which we<br />
derive from an assumption of no arbitrage. Violations would seem to indicate<br />
an inefficiency of markets.<br />
But to use (12.2) as a definition of efficiency is complicated when we are<br />
looking at ”absolute” quantities like stock prices. We will never be able to<br />
reject efficiency from this alone - critics will always (justly) be able to argue<br />
that our choice of asset pricing model is wrong. A famous paper by DeBondt<br />
<strong>and</strong> Thaler1 [1986] illustrates the problem well. They did the following:<br />
• Record the returns of a very large number of stocks over a period of<br />
1 See Journal of <strong>Finance</strong>, July 1986, pp. 793-807.
176 CHAPTER 12. EFFICIENT CAPITAL MARKETS<br />
Figure 12.1: The cumulative excess return (compared to the market) <strong>for</strong> the<br />
“winner” <strong>and</strong> “loser” portfolios.<br />
(say) 36 months.<br />
• At the end of the period, <strong>for</strong>m one portfolio of ”winners” i.e. pick (say)<br />
the 35 best per<strong>for</strong>ming stocks of the 36 month period.<br />
• Form another portfolio of ”losers” - i.e. pick (say) the 35 worst per<strong>for</strong>ming<br />
(but still alive!) stocks of the 36 month period.<br />
• Compare the returns to that of the market.<br />
The results are illustrated in Figure 12.1, which shows cumulative excess<br />
returns compared to the market <strong>for</strong> the two portfolios. We see that the loser<br />
portfolio has a (quite large) positive return over the market, whereas “the<br />
winners” are per<strong>for</strong>ming badly. Now we could be tempted to see this as a<br />
clear violation of ”weak-<strong>for</strong>m efficiency” because, intuitively, we are beating<br />
the market using only in<strong>for</strong>mation of past prices. But are we defining ”excess<br />
return” correctly then? We have seen in the exercises (in a discrete binomial<br />
version) that the beta of an option on a stock may be related to the beta of<br />
the stock. The equivalent of this in a Black-Scholes model where we model<br />
stocks as options on an underlying firm value gives us that<br />
β S = N(d1) V<br />
S β V .
12.2. MARTINGALES, RANDOM WALKS AND INDEPENDENT INCREMENTS177<br />
A ”loser” stock will typically have experienced an increase in leverage. This in<br />
turn implies an increase in β S <strong>and</strong> there<strong>for</strong>e the increased return on a ”loser”<br />
follows directly from option pricing theory <strong>and</strong> CAPM. In other words, a more<br />
careful selection of asset pricing model at least gave us a possible explanation<br />
<strong>for</strong> the results of DeBondt <strong>and</strong> Thaler. Subsequent research (see <strong>for</strong> example<br />
Chopra, Lakonishok <strong>and</strong> Ritter 2 [1992]) seems to indicate that correcting <strong>for</strong><br />
leverage effects does not destroy the result. But the controversy is far from<br />
over <strong>and</strong> the key issue is whether more advanced asset pricing models can be<br />
shown to explain the larger returns on losing stocks. Note, however, that the<br />
controversy illustrates the sense in which (12.2) is a ”hard-to-test” definition<br />
of efficiency. We will have to reject it <strong>for</strong> all conceivable (<strong>and</strong> reasonable)<br />
asset pricing models be<strong>for</strong>e an inefficiency is established. This seems to be a<br />
tough task, especially considering results of Summers 3 [1986] which indicate<br />
that many test traditionally employed do not have very large power (i.e.<br />
ability to reject a false hypothesis).<br />
12.2 Martingales, r<strong>and</strong>om walks <strong>and</strong> independent<br />
increments<br />
As a motivation <strong>for</strong> this section consider the footnote in Brealey <strong>and</strong> Myers:<br />
”When economists speak of stock prices as following a r<strong>and</strong>om walk,<br />
they are being a little imprecise. A statistician reserves the term r<strong>and</strong>om<br />
walk to describe a series thathas a constant expectedchange each period<br />
<strong>and</strong> a constant degree of variability. But market efficiency does notimply<br />
that expected risks <strong>and</strong> expectedreturns cannot shift over time.”<br />
Clearly, we need to be more precise even about the statistician’s definition<br />
if we are to discuss the notions precisely. The purpose of this section is to give<br />
precise content to such concepts as r<strong>and</strong>om walk, independent increments <strong>and</strong><br />
martingales.<br />
Definition 43 The stochastic process X = (X1, X2, . . .) is a r<strong>and</strong>om walk<br />
if it has the <strong>for</strong>m<br />
t�<br />
Xt =<br />
where ǫ1, ǫ2, . . . is a sequence of independent, identically distributed r<strong>and</strong>om<br />
variables.<br />
i=1<br />
2 Journal of Financial Economics, 1992, pp. 235-268<br />
3 Journal of <strong>Finance</strong>, July 1986, pp.591-601<br />
ǫi
178 CHAPTER 12. EFFICIENT CAPITAL MARKETS<br />
We will normally assume that ǫi has finite variance (<strong>and</strong> hence finite<br />
expectation as well). If Eǫi = 0 we say that the r<strong>and</strong>om walk is symmetric.<br />
A weaker concept is that of a process with independent increments:<br />
Definition 44 The stochastic process X = (X1, X2, . . .) is a process with<br />
independent increments if <strong>for</strong> all t, ∆Xt ≡ Xt − Xt−1 is independent of<br />
(X1, X2, . . .,Xt−1).<br />
Note that a r<strong>and</strong>om walk is a process with independent increments, but a<br />
process with independent increments may have the distribution of the increment<br />
change with time. Weaker yet is the notion of orthogonal increments<br />
where we only require increments to be uncorrelated:<br />
Definition 45 The stochastic process X = (X1, X2, . . .) is a process with<br />
orthogonal increments if <strong>for</strong> all t , EX2 t < ∞ <strong>and</strong> <strong>for</strong> all t, u<br />
Cov(∆Xt, ∆Xu) = 0.<br />
Finally a somewhat different (but as we have seen equally important)<br />
concept<br />
Definition 46 The stochastic process X = (X1, X2, . . .) is a martingale with<br />
respect to the filtration (Ft) if <strong>for</strong> all t , E |Xt| < ∞ <strong>and</strong><br />
E(Xt |Ft−1) = Xt−1.<br />
If no filtration is specified it is understood that Ft−1 = σ(X1, X2, . . .,Xt−1).<br />
A symmetric r<strong>and</strong>om walk is a martingale <strong>and</strong> so is a process with mean<br />
zero independent increments. A martingale with finite second moments has<br />
orthogonal increments, but it need not have independent increments: Think<br />
<strong>for</strong> example of the following ARCH process:<br />
Xt = ǫtσt<br />
where ǫ1, ǫ2, . . . is a sequence of i.i.d. N(0, 1) r<strong>and</strong>om variables <strong>and</strong><br />
σ 2 t = α0 + α1x 2 t−1<br />
α0, α1 > 0<br />
where xt−1 is the observed value of Xt−1. The abbreviation ARCH st<strong>and</strong>s <strong>for</strong><br />
Autoregressive Conditional Heteroskedasticity which means (briefly stated)<br />
that the conditional variance of Xt given the process up to time t−1 depends<br />
on the process up to time t − 1.
12.3. ANOMALIES 179<br />
It is clear from observation of market data, that stock prices have a drift<br />
<strong>and</strong> they are there<strong>for</strong>e not martingales. However it could be that by an<br />
appropriate choice of discount factor, as in (12.2), we get the martingale<br />
property. In fact, we know that this will be possible in an arbitrage free<br />
market (<strong>and</strong> <strong>for</strong> all types of financial securities), but then we are back to the<br />
situation discussed above in which the specification of the pricing relation<br />
becomes essential.<br />
The independent increment property is often heard as a necessary condition<br />
<strong>for</strong> efficient markets, but research over the last decade has pointed to<br />
ARCH effects in stock prices, exchange rates <strong>and</strong> other financial securities. 4<br />
Another serious problem with all the properties listed above is that it<br />
is perfectly possible to construct sensible general equilibrium models (which<br />
in particular are arbitrage free) in which prices <strong>and</strong> returns are serially correlated<br />
(<strong>for</strong> example because aggregate consumption is serially correlated).<br />
There<strong>for</strong>e, it seems unnatural to claim that r<strong>and</strong>om walks, independent increments<br />
<strong>and</strong> martingale properties of prices are in any way logical consequences<br />
of a definition of efficient markets. The most compelling consequence of an<br />
efficiency assumption of no arbitrage is that there exists an equivalent measure<br />
under which securities are martingales but this does not in general say<br />
much about how processes behave in the real world. Indeed, even in the<br />
case of futures contracts which would be very natural c<strong>and</strong>idates to being<br />
martingales, we have seen that in models where agents are risk-averse, the<br />
equivalent martingale measure will in general be different from the empirically<br />
measure <strong>and</strong> hence the martingale property of futures prices is by no<br />
means a necessary condition <strong>for</strong> efficiency.<br />
Also, note that bonds <strong>for</strong> example have predetermined ’final’ value <strong>and</strong><br />
there<strong>for</strong>e it is not at all clear that any of the above mentioned properties of<br />
price processes are even relevant <strong>for</strong> this class of securities.<br />
12.3 Anomalies<br />
Another way to challenge the EMH is to look <strong>for</strong> strange patterns in security<br />
prices which seem impossible to explain with any pricing model. Some such<br />
anomalies are week-end effects <strong>and</strong> year-end effects:<br />
Evidence found in French (1980) 5 seems to suggest that returns on Mondays<br />
were significantly negative, compared to returns on other trading days.<br />
Although the effect is difficult to exploit due to transactions costs, it is still<br />
unclear why the effect exists. Possible explanations have tried to look at<br />
4 For an collection of papers see Engle: ARCH.Ox<strong>for</strong>d University Press, 1995.<br />
5 Journal of Financial Economics, 1980, pp. 55-69.
180 CHAPTER 12. EFFICIENT CAPITAL MARKETS<br />
Figure 12.2: Percentage discount (= 100* (net asset value per share - share<br />
price of the fund)) at which Tricontinental Corporation was traded 1960-86.<br />
whether there is a tendency <strong>for</strong> firms to release bad news on Friday afternoons<br />
after trading closes. But if this were the case traders should learn this<br />
an adjust prices accordingly earlier. The week-end effect is hard to explain -<br />
after all it does seem to suggest that traders who are going to trade anyway<br />
should try to sell on Fridays <strong>and</strong> buy on Mondays.<br />
Another effect documented in several studies is the year-end effect which<br />
shows that stocks have a tendency to fall in December <strong>and</strong> rise in January.<br />
An obvious reason <strong>for</strong> such behavior could be tax considerations but it is still<br />
unclear if this explanation is sufficient or whether there is actually an effect<br />
which trading rules can take advantage of.<br />
A famous anomaly is the closed-end mutual fund discount. A closed-end<br />
fund is a mutual fund which holds publicly traded assets, but which only<br />
issues a fixed number of shares <strong>and</strong> where shareholders can only sell their<br />
shares in the market. Since the assets are so easy to determine, so should<br />
the share price be. However, throughout a long period of time mutual funds<br />
seemed to sell at a discount: The values of the funds’ assets seemed larger<br />
than the market value of shares. Small discounts could be explained by<br />
tax-considerations <strong>and</strong> illiquidity of markets, but no theory could explain a<br />
pattern (shown in Figure 12.2) like the one observed <strong>for</strong> the Tricontinental<br />
Corporation 6 during 1960-1986.<br />
6 See Lee, Shleifer <strong>and</strong> Thaler, Journal of <strong>Finance</strong> 1991, pp.75-109.
12.4. EXCESS VOLATILITY. 181<br />
It seems that finally in 1986 prices adjusted, but that prices should ”instantaneously”<br />
have reflected fundamental in<strong>for</strong>mation seems implausible.<br />
So a newer version of EMH stated in Malkiel [1990] 7 could be that ”pricing<br />
irregularities may well exist <strong>and</strong> even persist <strong>for</strong> periods of time, but the<br />
financial laws of gravity will eventually take hold <strong>and</strong> true value will come<br />
out.” Certainly a weakening of our original version of efficiency.<br />
12.4 Excess volatility.<br />
One of the most interesting challenges to EMH argues that there is too much<br />
volatility in stock markets - more than can be explained by any sensible asset<br />
pricing theory. If indeed markets reflect all relevant in<strong>for</strong>mation it should be<br />
the case that price movements <strong>and</strong> arrival of new in<strong>for</strong>mation were somehow<br />
in harmony. Trading alone ought not to generate volatility. Several pieces of<br />
evidence suggest that trading índeed creates volatility:<br />
1. October 19, 1987. The Dow Jones Industrial Average fell by more than<br />
22% - a much bigger drop than any previous one-day movement. Yet extensive<br />
surveys among investment managers seem to suggest that no important<br />
news related to stock prices arrived that day.<br />
2. In the second half of 1986 the stock exchange in New York closed <strong>for</strong> a<br />
series of Wednesdays to catch up on paperwork. Volatility between Tuesday’s<br />
close <strong>and</strong> Thursday’s opening of trade was significantly smaller than when<br />
the exchange was open on Wednesdays. As Thaler [1993] 8 puts it, traders<br />
react to each others as well as to news.<br />
3. A famous study on ”Orange juice <strong>and</strong> weather” by Roll [1984] 9 suggests<br />
that surprises in weather <strong>for</strong>ecasts <strong>for</strong> the Florida area, where 98% of oranges<br />
used <strong>for</strong> orange juice are traded, are too small to explain variations in the<br />
futures price (whose main concern is the likelihood of a freeze)<br />
But perhaps the most controversial attack on EMH is the one put <strong>for</strong>ward<br />
by Shiller, <strong>and</strong> Leroy <strong>and</strong> Porter. Their line of analysis is that what<br />
determines stock prices must ultimately be some combination of dividends<br />
<strong>and</strong> earnings of the firm. Since stock price is an expected, discounted value<br />
of future quantities, the price should fluctuate less than the quantities themselves.<br />
To underst<strong>and</strong> their line of reasoning, consider the following example:<br />
Assume that the quantity xt (which could be dividends) determines the stock<br />
7 A R<strong>and</strong>om Walk Down Wall Street.<br />
8 R. Thaler (ed.) Advances in Behavioral <strong>Finance</strong>, Russell Sage Foundation, NY 1993<br />
9 American Economic Review, December 1984, pp. 861-880.
182 CHAPTER 12. EFFICIENT CAPITAL MARKETS<br />
price through a present value relation of the <strong>for</strong>m:<br />
Yt =<br />
∞�<br />
j=0<br />
β j X e t (j),<br />
where β is some discount factor, β ∈]0, 1[, <strong>and</strong><br />
X e t (j) = E[Xt+j|It],<br />
where It can - <strong>for</strong> simplicity - be thought of as the in<strong>for</strong>mation generated by<br />
the process X up to time t. If we assume that Xt follows an autoregressive<br />
process of order one, i.e.<br />
Xt − c = φ(Xt−1 − c) + εt<br />
where c > 0, |φ| < 1 <strong>and</strong> εt’s are independent normally distributed r<strong>and</strong>om<br />
variables, then we can calculate the coefficient of dispersion of Xt,<br />
CD(Xt) = σ(Xt)<br />
E(Xt)<br />
<strong>and</strong> the similar quantity <strong>for</strong> Yt. We are interested in CD(Yt)<br />
. Using a fact<br />
CD(Xt)<br />
from time series analysis, which says that Xt be represented in the <strong>for</strong>m<br />
we find<br />
<strong>and</strong><br />
<strong>and</strong> hence<br />
Xt − c =<br />
∞�<br />
j=0<br />
ϕ j (εt−j)<br />
EXt = c V Xt = 1<br />
1 − ϕ 2<br />
EYt = c<br />
1 − β<br />
V Yt =<br />
CD(Yt) 1 − β<br />
=<br />
CD(Xt) 1 − βϕ<br />
V Xt<br />
(1 − βϕ) 2<br />
< 1<br />
by our choice of parameters. In other words, the coefficient of dispersion <strong>for</strong><br />
actual prices is less than that of Xt (dividends, earnings). What Shiller, <strong>and</strong><br />
Leroy <strong>and</strong> Porter show is that this result holds <strong>for</strong> a large class of processes<br />
<strong>for</strong> X <strong>and</strong> that the relationship is severely violated <strong>for</strong> observed data.
12.4. EXCESS VOLATILITY. 183<br />
Figure 12.3: Variability of a detrended S&P index (full curve) compared to<br />
the variability of dividends (dotted line).<br />
A useful bound also derived in these authors’ work is the variance bound<br />
on the perfect <strong>for</strong>esight price<br />
P ∗<br />
t =<br />
∞�<br />
k=0<br />
Xt+k<br />
k�<br />
γt+j (where γ t+j is the discount factor between time j <strong>and</strong> j + 1 as recorded at<br />
time t) which ”knows” all the paid dividends, <strong>and</strong> the actual price<br />
Pt = EtP ∗<br />
t<br />
Shiller argues that the bound V (Pt) ≤ V (P ∗<br />
t ) is grossly violated in practice,<br />
as illustrated in Figure 12.3.<br />
Marsh <strong>and</strong> Merton [1986] criticize the work of Shiller <strong>and</strong> argue that with<br />
non-stationary dividend policies, the variance bound relations cannot hold<br />
<strong>and</strong> should in fact be reversed. Future versions of this chapter will discuss<br />
this controversy!<br />
j=0
184 CHAPTER 12. EFFICIENT CAPITAL MARKETS<br />
12.5 In<strong>for</strong>mationally efficient markets are impossible<br />
The title of this section is the title of a paper by Grossman <strong>and</strong> Stiglitz 10<br />
(1980) Their first paragraph in that work sums up an essential problem with<br />
the assumption of in<strong>for</strong>mational efficiency:<br />
”If competitive equilibrium is defined as a situation in which prices are<br />
such that all arbitrage profits are eliminated, is it possible that a competitive<br />
economy can always be in equilibrium? Clearly not, <strong>for</strong> then those<br />
who arbitrage make no (private) return from their (privately) costly activity.<br />
Hence the assumption that all markets, including that <strong>for</strong> in<strong>for</strong>mation, are<br />
always in equilibrium <strong>and</strong> always perfectly arbitraged are inconsistent when<br />
arbitrage is costly.” Grossman <strong>and</strong> Stiglitz go on to build a model in which<br />
gathering (costly) in<strong>for</strong>mation is part of an equilibrium among in<strong>for</strong>med <strong>and</strong><br />
unin<strong>for</strong>med traders.Without going into details of their model, we note here<br />
that in equilibrium, prices reflect some but not all of the in<strong>for</strong>mation. There<br />
is a fraction of traders who are in<strong>for</strong>med <strong>and</strong> spend money to gather in<strong>for</strong>mation,<br />
<strong>and</strong> a fraction of traders who are unin<strong>for</strong>med but try to learn as<br />
much as possible by observing prices (which they know reflect partly the<br />
knowledge that the in<strong>for</strong>med traders have). If some of the in<strong>for</strong>med traders<br />
give up in<strong>for</strong>mation gathering, prices will reflect less in<strong>for</strong>mation <strong>and</strong> there<br />
will be an incentive <strong>for</strong> non-in<strong>for</strong>med traders to become in<strong>for</strong>med because<br />
the costs of in<strong>for</strong>mation gathering will more than compensated <strong>for</strong> by gains<br />
from trade. If some unin<strong>for</strong>med traders in the equilibrium situation decide<br />
to become in<strong>for</strong>med prices will reflect more in<strong>for</strong>mation <strong>and</strong> there will in fact<br />
be an incentive <strong>for</strong> some of the in<strong>for</strong>med to give up in<strong>for</strong>mation gathering<br />
<strong>and</strong> ’free-ride’ on the in<strong>for</strong>mation gathered by others which is reflected in<br />
prices. Clearly, a situation in which all in<strong>for</strong>mation is reflected in prices is<br />
impossible.<br />
This paper has a number of interesting results that we will not go into<br />
here. Suffice it to say that it contains one of the most interesting attempts to<br />
give a <strong>for</strong>mal definition of efficiency which does not have the inherent logical<br />
problems of the original definitions.<br />
There are numerous other more rigorous attempts to define efficiency. A<br />
typical line of approach is to model a situation with asymmetric in<strong>for</strong>mation<br />
<strong>and</strong> ask whether the equilibrium price (<strong>and</strong> possibly the portfolio holdings<br />
of individuals) would be altered if all of the in<strong>for</strong>mation held by traders<br />
was given to all traders simultaneously. If prices <strong>and</strong> allocations would not<br />
change in this situation, then it would be fair to say that prices reflected all<br />
10 American Economic Review, vol 70, pp. 393-408.
12.5. INFORMATIONALLY EFFICIENT MARKETS ARE IMPOSSIBLE185<br />
in<strong>for</strong>mation.<br />
These models will be discussed in a future version of the notes.
Index<br />
(·) + -notation, 41<br />
geometric Brownian motion, 101<br />
abstract Bayes <strong>for</strong>mula, 63<br />
adapted process, 56<br />
alfahage; αn⌉R, 19<br />
annuity, 18<br />
APT equation, 154<br />
arbitrage opportunity, 12, 43, 58, 154<br />
Arbitrage Pricing Theory, APT, 153<br />
Arrow-Debreu prices, 43, 164<br />
Asian optionsee contingent claim, path<br />
dependent 87<br />
bank account, 40<br />
bankruptcy costs, 168<br />
barbell strategy, 37<br />
binomial model, 39, 79, 95<br />
binomial model, one-period, 40<br />
Black-Scholes <strong>for</strong>mula, 89, 95, 98<br />
Black-Scholes model, 101<br />
bond holders, 164<br />
Brownian motion, 100<br />
bullet bond, 18, 20<br />
call option, American, 77<br />
call option, European, 40, 52, 81, 82<br />
capital asset pricing model, CAPM,<br />
143<br />
capital budgeting, 25, 28<br />
capital market line, CML, 140<br />
capital structure, 93, 167<br />
Central Limit Theorem, 98<br />
clean price, 21<br />
186<br />
complete market, 14, 45, 60<br />
compounding periods, 17<br />
conditional expectation, 61<br />
contingent claim, 45, 87<br />
contingent claim, path dependent, 87<br />
continuously compounded interest rate,<br />
17, 95<br />
convexity, 32<br />
crash fear, 91<br />
debt, 92, 93, 164<br />
delta hedging, 84<br />
delta-hedging, 106<br />
derivative security, 45, 54<br />
dirty price, 22<br />
discount factors, 13, 15<br />
dividend process, 56, 63<br />
dividend stream; δ φ<br />
0, 58<br />
duration, 36<br />
duration, Fisher-Weil, 36<br />
duration, Macaulay, 31<br />
duration, modified, 33<br />
efficient portfolio, 135<br />
equilibrium, 7, 48, 143<br />
equity, 92, 93, 164<br />
equivalent martingale measure, 63<br />
equivalent probability measures , 62<br />
expectation hypotheses, 123<br />
factor model, 153<br />
factor risk premia, 158<br />
filtration, 54<br />
financial market, 12, 43
INDEX 187<br />
firm, 92<br />
Fisher Separation, 9<br />
<strong>for</strong>ward contract, 76, 116<br />
<strong>for</strong>ward price, 76, 117<br />
<strong>for</strong>ward rates, 15<br />
frictionless market, 72<br />
fundamental theorem of asset pricing,<br />
first, 64<br />
fundamental theorem of asset pricing,<br />
second, 67<br />
futures contract, 116<br />
futures price, 117<br />
Gordon’s growth <strong>for</strong>mula, 28<br />
hedging, 54, 82<br />
immunization, 35<br />
implied volatility, 89, 91<br />
in<strong>for</strong>mation, 54<br />
internal rate of return, 25<br />
leverage, 165<br />
locally riskfree asset, 57<br />
logarithmic return, 95<br />
lognormal distribution, 99<br />
long position, 12<br />
marginal utility, 49<br />
Markov property, 85<br />
Markowitz analysis, 132<br />
martingale, 62<br />
mean/variance analysis, 132<br />
measurable, 56<br />
Merton’s tunnel, 77<br />
minimum variance portfolio, 134<br />
Modigliani-Miller results, 163<br />
money market account,<br />
seebank account40<br />
moneyness, 74<br />
multi-period model, 51<br />
net present value, NPV, 11, 25<br />
NPV criterion, 26, 168<br />
option pricing, 39, 71, 79<br />
partition, 54<br />
pay-off diagram, 73<br />
payment stream, 12<br />
portfolio, 12, 43, 154<br />
portfolio insurance, 91<br />
positivity of vectors, 11<br />
price process, 57, 63<br />
pricing functional, 59<br />
probability measure, 43<br />
put option, American, 71, 88<br />
put option, European, 71<br />
put-call parity, 72, 76<br />
rate of return, 130<br />
redundant, 44<br />
relative portfolio weights, 130<br />
replication, 41, 54, 83<br />
Riesz’representation theorem, 59<br />
risk-neutral pricing, 45<br />
risk-neutrality, 46, 126<br />
riskfree asset, 44<br />
Roll’s cirtique, 146<br />
security price system, 12, 43<br />
self-financing trading strategy, 58, 83<br />
separating hyperplane, 13, 60<br />
serial loan, 18, 20<br />
Sharpe-ratio, 141<br />
short position, 12<br />
short rate, 15<br />
short rate lattice, 109<br />
short rate lattice, calibration, 111<br />
short rate process, 57, 108<br />
splitting index, 68, 83<br />
state-price vector, 43, 48<br />
Stiemke’s lemma, 13<br />
stochastic interest rate, 107<br />
stock, 40, 79, 95
188 INDEX<br />
stock holders, 164<br />
swap contract, 120<br />
swap rate, 121<br />
tangent portfolio, 141<br />
tax shield, 167<br />
term structure of interest rates, 16,<br />
107<br />
term structure of interest rates, parallel<br />
shifts, 114<br />
trading strategy, φ, 58<br />
two-fund separation, 135<br />
utility function, 7, 48, 131<br />
value of the firm, 164<br />
volatility, 102<br />
volatility smile, 92<br />
yield to maturity, 16, 17<br />
zero coupon bond, ZCB, 15, 107, 108<br />
zero-beta portfolio, 137