Quarter 2 - Massachusetts Water Resources Authority
Quarter 2 - Massachusetts Water Resources Authority
Quarter 2 - Massachusetts Water Resources Authority
- No tags were found...

Create successful ePaper yourself
Turn your PDF publications into a flip-book with our unique Google optimized e-Paper software.
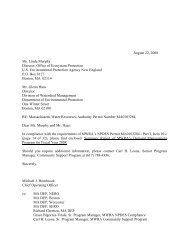
Total Power UseDeer Island Operations2nd <strong>Quarter</strong> - FY13Page 1 of 3Self-GenerationPower Use, kwhPower Generation, kwhJ A S O N D J F M A M JJ A S O N D J F M A M JSupport Primary Secondary ResidualsHydro CTGs STGs On-site Generation TargetPumping FY13 Target FY12 ActualPower generated on-site during the 2nd <strong>Quarter</strong> was within 2% of theTotal Power Use in the 2nd <strong>Quarter</strong> was 6% lower than the FY13projections due principally to lower-than-expected Power Used forpumping (as a result of lower-than-expected Total Plant Flow) andfor secondary wastewater treatment (as a result of energytarget. Generation by the STGs was 12% lower than target this quarteras the system was taken down for annual maintenance in November.Hydro Turbine generation was 9% lower due to lower-than-expectedplant flows.optimization measures in the secondary reactor process area).Total Power Use was 8% lower than in FY12 for the same period,and year to date is 7.5% less than budget.Generation by the CTGs was six times higher than target for the quartermainly due to operation during extreme storm conditions in each monthof this quarter, and for a demand response test event on December 13,in addition to operation for routine maintenance / checkout purposes.Total Energy PricingYear to date on-site generation is 11.7% less than budget.(includes fixed block, spot energy price, ancillary costs, and$0.120NSTAR's transmission & distribution costs)$0.100Self-Generation Equipment On-Line$0.080(% of Time in Operation)$0.060100%90%$0.04080%$0.02070%60%$0.00050%40%J A S O N D J F M A M J30%FY13 Energy PriceFY13 Energy Budget Price20%FY12 Energy Price10%0%Note: Only the actual energy prices are now being reported. TheJ A S O N D J F M A M JNovember and December invoices from Hess have not yet beenDiGas, % of timeSTGs, % of timereceived.Hydro, % of timeWind Turbines, % of timeAvailability TargetUnit Price ($/kwh)Overall, the total energy price in the 2nd <strong>Quarter</strong> (October price only)was 2% higher than the FY13 budget estimate. Year-to-date costs are$73,796 (-2%) less than budgeted as of the end of October due tolower than expected Power Demand, even though total energy pricesin the first four(4) months of FY13 averaged 5% higher-than-expected.# Days3028252320181513108530Sludge Detention Time in Digestersand Total Solids Destruction60%58%55%53%50%48%45%43%40%J A S O N D J F M A M JDetention Time, #Days3 Yr Avg Detention Time, #DaysTotal Solids Destroyed, % 3 Yr Avg Total Solids Destroyed, %Total solids destruction averaged 53% following anaerobic sludgedigestion during the 2nd <strong>Quarter</strong> with an average sludge detentiontime in the digesters of 20.6 days. Solids destruction was 2% higherthan the 3-year average for the quarter as the detention time was12% higher. DI operated with an average of 7.8 digesters this quarteras the 4 digesters in Module #1 were activated and the 3 digesters inModule #3 were taken out of service for maintenance resulting in 8digesters in operation by the end of the quarter.Solids destruction is dependent on sludge detention time which isdetermined by primary and secondary solids production, plant flow,and the number of active digesters in operation.1% TS DestroyedThe DiGas and Hydro Turbine systems both met their 95% AvailabilityTarget for the 2nd <strong>Quarter</strong>. The STGs and Wind Turbines fell 8.3% and4.2% below the 95% target. The STGs were taken offline duringscheduled annual maintenance and the Wind Turbines were offline due toturbulent storm conditions during several significant storm events,including sensor icing issues following the December 29 rain, ice, andsnowstorm.DiGas, SCFHDigester Gas Production and % Utilized220,000210,000200,000190,000180,000170,000160,000150,000140,000J A S O N D J F M A M J100%98%95%93%90%88%85%83%80%78%75%Avg Daily DiGas Produced, SCFH8 Yr Avg Daily DiGas Produced, SCFH% DiGas UtilizedThe Avg Daily DiGas Production during the 2nd <strong>Quarter</strong> was 3%higher than the 8 Year Avg Daily DiGas Production as Total Solidsdestruction following anaerobic digestion was also slightly higherthan average. An average of 96% of all the DiGas produced in the2nd <strong>Quarter</strong> was utilized at the Thermal Power Plant. Boilermaintenance occured in late October and early November.% Utilized