SBIG Self Guided Spectrograph (SGS) Operating ... - Sbig.com
SBIG Self Guided Spectrograph (SGS) Operating ... - Sbig.com
SBIG Self Guided Spectrograph (SGS) Operating ... - Sbig.com
- No tags were found...

You also want an ePaper? Increase the reach of your titles
YUMPU automatically turns print PDFs into web optimized ePapers that Google loves.
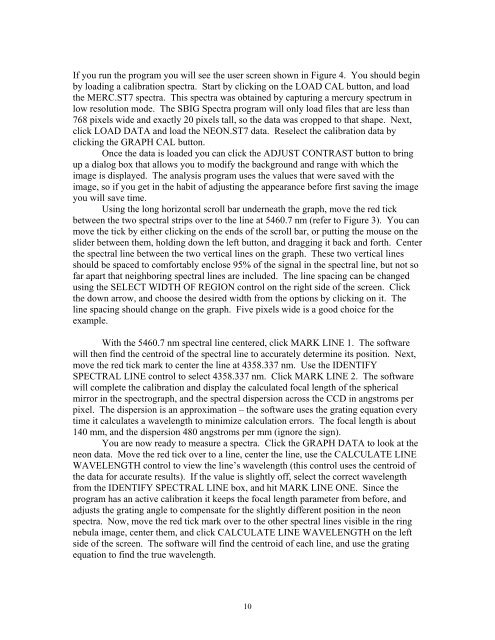
If you run the program you will see the user screen shown in Figure 4. You should beginby loading a calibration spectra. Start by clicking on the LOAD CAL button, and loadthe MERC.ST7 spectra. This spectra was obtained by capturing a mercury spectrum inlow resolution mode. The <strong>SBIG</strong> Spectra program will only load files that are less than768 pixels wide and exactly 20 pixels tall, so the data was cropped to that shape. Next,click LOAD DATA and load the NEON.ST7 data. Reselect the calibration data byclicking the GRAPH CAL button.Once the data is loaded you can click the ADJUST CONTRAST button to bringup a dialog box that allows you to modify the background and range with which theimage is displayed. The analysis program uses the values that were saved with theimage, so if you get in the habit of adjusting the appearance before first saving the imageyou will save time.Using the long horizontal scroll bar underneath the graph, move the red tickbetween the two spectral strips over to the line at 5460.7 nm (refer to Figure 3). You canmove the tick by either clicking on the ends of the scroll bar, or putting the mouse on theslider between them, holding down the left button, and dragging it back and forth. Centerthe spectral line between the two vertical lines on the graph. These two vertical linesshould be spaced to <strong>com</strong>fortably enclose 95% of the signal in the spectral line, but not sofar apart that neighboring spectral lines are included. The line spacing can be changedusing the SELECT WIDTH OF REGION control on the right side of the screen. Clickthe down arrow, and choose the desired width from the options by clicking on it. Theline spacing should change on the graph. Five pixels wide is a good choice for theexample.With the 5460.7 nm spectral line centered, click MARK LINE 1. The softwarewill then find the centroid of the spectral line to accurately determine its position. Next,move the red tick mark to center the line at 4358.337 nm. Use the IDENTIFYSPECTRAL LINE control to select 4358.337 nm. Click MARK LINE 2. The softwarewill <strong>com</strong>plete the calibration and display the calculated focal length of the sphericalmirror in the spectrograph, and the spectral dispersion across the CCD in angstroms perpixel. The dispersion is an approximation – the software uses the grating equation everytime it calculates a wavelength to minimize calculation errors. The focal length is about140 mm, and the dispersion 480 angstroms per mm (ignore the sign).You are now ready to measure a spectra. Click the GRAPH DATA to look at theneon data. Move the red tick over to a line, center the line, use the CALCULATE LINEWAVELENGTH control to view the line’s wavelength (this control uses the centroid ofthe data for accurate results). If the value is slightly off, select the correct wavelengthfrom the IDENTIFY SPECTRAL LINE box, and hit MARK LINE ONE. Since theprogram has an active calibration it keeps the focal length parameter from before, andadjusts the grating angle to <strong>com</strong>pensate for the slightly different position in the neonspectra. Now, move the red tick mark over to the other spectral lines visible in the ringnebula image, center them, and click CALCULATE LINE WAVELENGTH on the leftside of the screen. The software will find the centroid of each line, and use the gratingequation to find the true wavelength.10