APPENDIX 9: Analysis of Selous Hunting Data - wildlife-baldus.com
APPENDIX 9: Analysis of Selous Hunting Data - wildlife-baldus.com
APPENDIX 9: Analysis of Selous Hunting Data - wildlife-baldus.com
- No tags were found...

You also want an ePaper? Increase the reach of your titles
YUMPU automatically turns print PDFs into web optimized ePapers that Google loves.
CIRCULARES DDUNota: Las Circulares de la División de Desarrollo Urbano se pueden descargar en www.minvu.cl, en la sección "mi ciudad" y luego "circulares DDU"Nº Tipo Materia Fecha210 General Formularios Unicos NacionalesDistribuye formularios únicos nacionales para la aplicación del artículo 166de la LGUC, reglamentado en los artículos 5.1.4. Nº2 letras A y B, y6.1.11. de la OGUC.15 Septiembre 2008MODIFICACIONES A LA ORDENANZA GENERAL DE URBANISMO Y CONSTRUCCIONESNo se registran modificaciones a la Ordenanza en este período.Pr<strong>of</strong>esional a cargo de Informe CURBA: José Núñez Gálvez, Arquitecto - Analista Técnico, CoordinaciónTécnica - Gerencia de Estudios. Correo jnunez@cchc.cl Fono 02 - 3763384. Revisión de Informe CURBA: PilarGimenez, Arquitecta - Coordinadora Territorial. Aprobación de Informe CURBA: Javier Hurtado Cicarelli -Gerente de Estudios.
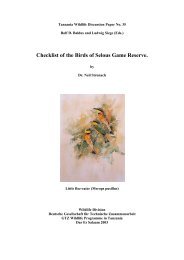
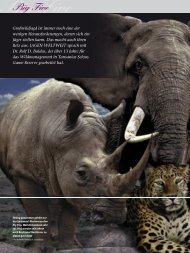
entered for the whole <strong>of</strong> Tanzania for the period from 1988 to 1993. Unfortunatelythis initiative was not maintained after 1993. <strong>Data</strong> relevant to the SGR was extractedfrom the PAWM database and added to the <strong>Selous</strong> hunting database and all additionalpermits from the <strong>Selous</strong> that could be located have been entered. The database hasbeen kept up to date by staff <strong>of</strong> the SGR. The database contains 5,845 hunting permitsfor the period 1988 to 2003. A total <strong>of</strong> 35,541 animals <strong>of</strong> 41 different species arerecorded having been hunted on these permits. <strong>Hunting</strong> quota have been entered from1996 to 2003.Accuracy and applicability <strong>of</strong> this analysisThis analysis is not intended as a replacement <strong>of</strong> the Wildlife Division’s accountingpractices, nor as a check on their system. Instead it is intended as a means <strong>of</strong> gainingan overview <strong>of</strong> the hunting activities in the SGR and thereby <strong>of</strong>fering anunderstanding <strong>of</strong> the industry. The trends presented here are more important thanactual figures.The hunting <strong>of</strong>fice in Tanzania frequently issues more than one permit to a singleclient, hence Table 12 shows a greater number <strong>of</strong> permits than clients. On someoccasions a client wishes to extend the duration <strong>of</strong> his / her safari and an additionalpermit is issued, however in most instances the reasons for issuing additional permitsis not clear. All permits are <strong>com</strong>puterized and it is necessary to manually identify theduplicate permits. Control is difficult and there is the possibility that some permits aremissed, others lost and the results <strong>of</strong> the database are therefore unlikely to provide anexact match <strong>of</strong> the financial figures <strong>of</strong> the Wildlife Division.Description <strong>of</strong> the <strong>Selous</strong> Game ReserveThe SGR is the largest game reserve administered by the Wildlife Division. It islocated in south-eastern Tanzania and covers an area <strong>of</strong> approximately 47,500 squarekilometres. The reserve is separated into 8 administrative sectors, which aresubdivided into 47 blocks as illustrated in Figure 1. Forty five blocks have for a longtime been leased to hunting <strong>com</strong>panies and 2 blocks (B1 and Z1) have been reservedfor non-consumptive photographic tourism. Blocks KY1 and Y1 have recently beenset aside for non-consumptive tourism.To understand the hunting data and some <strong>of</strong> the implications there<strong>of</strong>, it helps tounderstand the nature <strong>of</strong> some <strong>of</strong> the hunting blocks <strong>of</strong> the SGR as the areas differmarkedly from one another. Drainage is mostly south to north by a number <strong>of</strong> largerivers, i.e. Njenje, Mbarang’andu and Luegu which flow into the Kilombero whichjoins with the Ruaha to form the Rufigi which takes the waters to the Indian Ocean.The block boundaries were originally created by Nicholson in the 1960s, but manyboundary adjustments, particularly the outer boundary, have been made since.Nicholson never had an accurate overview map <strong>of</strong> the whole reserve and hisdevelopment <strong>of</strong> the hunting blocks was based on a sketch map that for many yearsbecame the blue print for hunting in the SGR. The current chief warden, Mr B.Kibonde has recorded geographic coordinates for the outer boundaries and traced all108
hunting block boundaries on standard topographic maps. It has since been possible todevelop GIS data for the hunting blocks and calculate their size.Nomenclature <strong>of</strong> hunting blocks by Nicholson follows the names <strong>of</strong> the major riverswith which the blocks are associated, i.e. the following river names:K – Kilombero: K1, K2, K3, K4, K5 MB – Mbarang’andu: MB1, MB2, MB3L – Luhombero: L1MT – Matandu: MT1, MT2LL – Llong’onya: LL1, LL2, LL3 N – Njenje: N1, N2LU – Luwegu: LU1, LU2, LU3, LU4, R – Ruaha: R1, R2, R3, R4LU5, LU6, LU7, LU8M – Msolwa: M1, M2RU – Rufigi: RU1MA – Madaba: MA1 U - Ulanga: U1, U2, U3, U4.Block LU1 in the southeast corner covers an area <strong>of</strong> rugged terrain <strong>of</strong> the MbarikaMountains. Access to this area is difficult and the possibilities for hunting aretherefore limited. Other blocks in the south <strong>of</strong> the reserve (LU8, N1, N2 and MB1)also cover areas <strong>of</strong> mountainous terrain where access is hampered, however theLuwegu, Njenje and Mbarang’andu Rivers support healthy <strong>wildlife</strong> populations andprovide good hunting opportunities.Msolwa Sector contains many small hunting blocks and is surrounded on three sidesby large rivers and on the western side by numerous human settlements and variousforms <strong>of</strong> agriculture. As a result there is thus little movement <strong>of</strong> <strong>wildlife</strong> in and out <strong>of</strong>this sector. Many small blocks are squeezed into this space and the pressure fromhunting is most felt in this area.Two blocks in the north, B1 and Z1 have for a long time been reserved for nonconsumptivetourism. Blocks KY1 and Y1 have recently been added in 2001 and2003 respectively. The other blocks in Matambwe Sector benefit from the nonconsumptiveuse <strong>of</strong> the two blocks and also the proximity <strong>of</strong> productive <strong>wildlife</strong> areasoutside, particularly Gonabis Open Area and Mikumi National Park.Vegetation consists <strong>of</strong> miombo woodland (70%) in the west and southern parts andmixed Acacia woodlands in the north and east. Central areas on sand forests, whichsupport good timber producing trees and <strong>of</strong>fer good elephant hunting.109
B1IH1K1K2K3K4K5841423780751453377807KY1L1LA1LL1LL2LL3LU15334626152,1601,2601,6952,198LU2LU3LU4LU5LU6LU7LU81,0976103715638841,4561,623Areas <strong>of</strong> blocks (km²)M1 526M2 408MA1 1,677MB1 2,152MB2 1,044MB3 1,679MH1 1,361MJ1MK1ML1MS1MT1MT2N12,4728087881,3368451,4531,912N2R1R2R3R4RU1U11,4374538793293841,691368U2U3U4Y1Z1519773780863759Figure 1: Overview map <strong>of</strong> the <strong>Selous</strong> Game Reserve showing administrative sectorsand hunting blocks.110
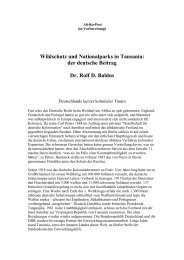
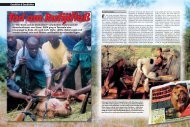
Retention schemeA retention scheme was negotiated for the SGR in 1992 and first implemented in1994. This scheme enables approximately 50% <strong>of</strong> the in<strong>com</strong>e generated within theSGR to remain with the reserve. A <strong>com</strong>plex breakdown <strong>of</strong> the in<strong>com</strong>e has beendeveloped whereby the funds are shared between the SGR, the Tanzanian WildlifeProtection Fund and Treasury <strong>of</strong> the Central Government, then back to the WildlifeDivision and to District Councils in which tourist hunting fees are generated.The breakdown is illustrated below in Figure 2 with a <strong>com</strong>parison to the disbursement<strong>of</strong> funds where retention schemes do not exist.Retention scheme:Game feesBlock feesPr<strong>of</strong>. hunters license50%25%25%35%WildlifeDivision<strong>Selous</strong>RetentionSchemeTanzanianWildlifeProtection FundTreasury40% retention25%DistrictCouncils50% 50%100%Permit feesConservation feesObserver feesTrophy handlingfeesNo Retention scheme:Permit feesConservation feesObserver fees100%Trophyhandling fees100%Game feesBlock feesPr<strong>of</strong>. hunters license25% 75%35%WildlifeDivisionTanzanianWildlifeProtection FundTreasury40% retention25%DistrictCouncilsFigure 2: Disbursement <strong>of</strong> funds between the <strong>Selous</strong> Game Reserve, TanzanianWildlife Protection Fund and the Government Treasury where retentionschemes exist, and a <strong>com</strong>parison for areas where retention schemes do notexist111
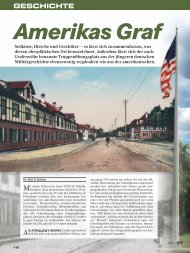
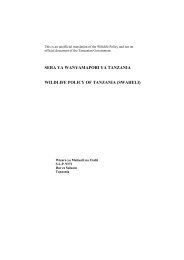
VALIDITY OF DATAWhen analysing data from the database it is crucial to initially determine whether thedata set is <strong>com</strong>plete and the extent to which it is representative <strong>of</strong> the hunting situationin the SGR. All old permits that could be located have been entered. There is apossibility that some may have been lost. To determine if gaps occur in the data, theannual distributions <strong>of</strong> hunts per block are mapped and the results presented overleafin Figure 4. Blocks B1 and Z1 in the north are reserved for photographic tourism andno hunting is conducted there. Blocks KY1 and Y1 were added to the photographicarea in 2001 and 2003 respectively. From 1996 to 2003 there does appear to be areasonably consistent spread <strong>of</strong> hunts. For the purposes <strong>of</strong> this analysis, the data from1996 to 2003 is considered representative <strong>of</strong> the hunting situation in the SGR.Figure 3 below presents the Wildlife Division’s hunting revenue per year recorded inthe database. The data shows a marked increase in in<strong>com</strong>e in 1996 followed by alimited fluctuation per year from 1996 to 2003.Wildlife Division <strong>Hunting</strong> Revenue (US$)3,000,0002,000,0001,000,000Implementation <strong>of</strong>Retention Scheme01988 1989 1990 1991 1992 1993 1994 1995 1996 1997 1998 1999 2000 2001 2002 2003YearFigure 3: Wildlife Division hunting revenues from the <strong>Selous</strong> Game Reserve ascalculated from the database for the years 1988 to 2003.A retention scheme was initiated for SGR in 1992 be<strong>com</strong>ing effective in 1994, whichresulted in a large increase in the availability <strong>of</strong> funds to manage the game reserve.Figure 3 shows a delay before the benefits <strong>of</strong> the retention scheme and the improvedmanagement realised a real improvement in the in<strong>com</strong>e generation and financialviability <strong>of</strong> the game reserve.112
Figure 4: Annual distribution <strong>of</strong> hunts as per hunting blocks113
FINANCIAL PROFILE OF THE SELOUS GAME RESERVETable 1:Approximate in<strong>com</strong>e (US$) generated by the Wildlife Division fromvarious hunting fees in and around the <strong>Selous</strong> Game ReservePermit Conservation Observer Trophy Trophy Block TotalYear Clients fees fees fees fees handling fees fees fees1988 99 56,700 177,900 ? 600,900 27,900 165,000 1,028,4001989 185 110,100 370,700 ? 1,023,365 54,900 262,500 1,821,5651990 177 104,550 348,300 ? 1,119,830 52,000 225,000 1,849,6801991 115 66,600 212,400 450 684,655 32,900 247,500 1,244,5051992 163 96,750 330,500 800 939,025 48,200 240,000 1,655,2751993 198 112,800 340,900 3,350 1,026,170 55,400 292,500 1,831,1201994 174 100,050 321,000 2,150 898,140 49,300 285,000 1,655,6401995 168 97,350 313,900 4,050 980,005 48,100 262,500 1,705,9051996 325 184,950 534,000 2,700 1,553,575 90,800 307,500 2,673,5251997 346 195,450 568,800 4,400 1,729,535 95,700 315,000 2,908,8851998 436 244,350 704,900 11,700 2,123,200 119,300 337,500 3,540,9501999 343 192,300 542,000 10,650 1,563,945 93,900 315,000 2,717,7952000 431 243,900 663,900 11,950 1,872,455 119,500 330,000 3,241,7052001 483 269,100 759,900 13,950 2,118,935 131,100 330,000 3,622,9852002 417 230,700 547,500 9,750 1,672,190 112,100 322,500 2,894,7402003 479 265,050 728,700 8,450 2,122,540 128,800 322,500 3,576,040A breakdown <strong>of</strong> the annual in<strong>com</strong>e generated by the Wildlife Division from touristhunting in the SGR is presented above in Table 1. <strong>Hunting</strong> blocks are leased to<strong>com</strong>panies with an annual quota <strong>of</strong> animals that may be hunted <strong>of</strong> which at least 40%must be utilised annually. As shown later in this document, many <strong>com</strong>paniesfrequently fail to meet the 40% minimum and the topping-up amounts paid aretherefore an important <strong>com</strong>ponent <strong>of</strong> the in<strong>com</strong>e generated. The data in Table 1 doestherefore not represent the full in<strong>com</strong>e received and has to be re-worked based on theutilisation <strong>of</strong> the available quota for the years 1996 to 2003 and the revised data arepresented in Table 2.Table 2:In<strong>com</strong>e generated by the <strong>Selous</strong> Game Reserve from hunting withapplying the 40% minimum quota utilisation rule, and in<strong>com</strong>e fromphotographic tourism.YearPermit Conservation Observer Trophy Trophy Block Totalfees fees fees fees hand fees fees fees1996 184,950 534,000 2,700 1,844,235 90,800 307,500 2,964,1851997 195,450 568,800 4,400 2,025,135 95,700 315,000 3,204,4851998 244,350 704,900 11,700 2,420,675 119,300 337,500 3,838,4251999 192,300 542,000 10,650 2,368,965 93,900 315,000 3,522,8152000 243,900 663,900 11,950 2,610,620 119,500 330,000 3,979,8702001 269,100 759,900 13,950 2,421,340 131,100 330,000 3,925,3902002 230,700 547,500 9,750 2,363,630 112,100 322,500 3,586,1802003 265,050 728,700 8,450 2,424,435 128,800 322,500 3,877,935114
Applying the 40% minimum quota utilisation rule results in a 26% increase in thein<strong>com</strong>e generated from trophy fees, but an overall increase <strong>of</strong> 13% to the total feesgenerated from the Wildlife Division from hunting over the period from 1996 to 2003.Figure 3 shows fluctuations in the in annual in<strong>com</strong>e from hunting. Tourism is affectedby external events. Figure 5 demonstrates how two separate terrorist attacks have eachcaused approximately 25% drop in in<strong>com</strong>e in the following year. <strong>Hunting</strong> quota areset by the Wildlife Division in advance <strong>of</strong> the season. Figure 6 shows that drops intourist numbers in 1999 and 2002 were not anticipated by the Wildlife Division.Wildlife Division Revenue (US$)3,500,0003,000,0002,500,0002,000,0001,500,0001,000,000500,000Maximum In<strong>com</strong>eAverage In<strong>com</strong>eMinimum In<strong>com</strong>e1 213%13%74%Risk carried by WildlifeDivision (26%)01996 1997 1998 1999 2000 2001 2002 2003YearKey:1 – Bombing <strong>of</strong> the United States Embassies, Dar es Salaam & Nairobi2 – Attack on the New York World Trade CentreFigure 5: In<strong>com</strong>e generated by the Wildlife Division from tourist hunting in the<strong>Selous</strong> Game Reserve, showing fluctuations relating to terrorist attacks andthe percentage risk carried by the Wildlife Division.115
3,500,000Quota ValueTrophy fees3,000,0002,500,000Value (US$)2,000,0001,500,0001,000,000500,00001996 1997 1998 1999 2000 2001 2002 2003YearFigure 6: Value <strong>of</strong> the annual hunting quota for the <strong>Selous</strong> Game Reserve in<strong>com</strong>parison the in<strong>com</strong>e accrued by the Wildlife Division from trophy fees.The in<strong>com</strong>e presented in Table 1 for observer fees appears to be grossly underestimated,it is possible that much <strong>of</strong> this data has not been recorded as observers arenot <strong>of</strong>ficially shown on the hunting permits.In<strong>com</strong>e is also generated from pr<strong>of</strong>essional hunter fees whereby each pr<strong>of</strong>essionalhunter is required to register at a cost <strong>of</strong> US$ 1,000 per annum (Tanzanian citizens) orUS$ 2,000 per annum (non-citizens). Prior to 1998 the registration cost was standardat US$ 1,000 per annum. A list <strong>of</strong> pr<strong>of</strong>essional hunters is provided in Table 8, butinterpretation <strong>of</strong> this data and in<strong>com</strong>e accrued by the SGR is <strong>com</strong>plicated by the factthat many pr<strong>of</strong>essional hunters operating in <strong>Selous</strong> also hunt elsewhere in Tanzaniawhere their annual registration is also valid. The actual in<strong>com</strong>e accrued by the <strong>Selous</strong>retention scheme is therefore uncertain in this analysis.116
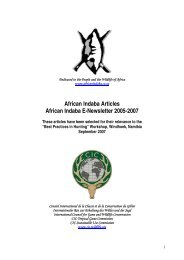
Breakdown <strong>of</strong> in<strong>com</strong>eThe in<strong>com</strong>e from tourist hunting as shown in Table 1 is heavily dependant on trophyfees, but little in<strong>com</strong>e is generated from lease <strong>of</strong> concessions (Block fees). Thepercentage breakdown <strong>of</strong> the various fees averaged from 1988 to 2003 is presentedbelow in Table 2.Table 3:Percentage breakdown <strong>of</strong> fees charged for tourist hunting calculated fromthe <strong>Selous</strong> hunting data for the years 1988 to 2003FeePercentage contributionto total in<strong>com</strong>ePermit fees 7Conservation & Observer fees 20Trophy fees 59Trophy handling fees 3Block fees 11In<strong>com</strong>e generated per hunting blockTrophy fees represent approximately 60% <strong>of</strong> the total fees. The estimated total in<strong>com</strong>eper hunting block was therefore estimated on this basis from the in<strong>com</strong>e generated forthe years 1996 to 2001. The estimated in<strong>com</strong>e generated per block is presented inFigure 8 on the following page. Many <strong>of</strong> the higher earning blocks have frontage onlarge rivers in the central and northern parts <strong>of</strong> the reserve. The large rivers attractgreater <strong>wildlife</strong> populations and increase the diversity <strong>of</strong> <strong>wildlife</strong> available.117
MH1MB3N2LU3120,000100,000Trophy feesPermit & Conservation feesBlock fees80,00060,000In<strong>com</strong>e (US$)40,00020,0000MK1K1L1LL2LL1K4MT2KY1MA1LU2LL3RU1R1MS1K2M2U4MB2R2Liwale NorthU3Y1K3Liwale SouthU2LU4LU1K5R3MB1U1IH1R4LA1LU6LU5MT1M1N1LU7LU8MJ1ML1<strong>Hunting</strong> blockFigure 7: Estimated average annual in<strong>com</strong>e for blocks in and around the <strong>Selous</strong> Game Reserve for the period (1996 – 2003)
700,000600,000500,000400,000300,000200,000100,0000Barlette Safaris LTDTanzania Game TrackerRobin Hurt Safaris (T) LTDTanganyika Wildlife SafarisLuke Samaras Safaris LTDTanzania Wildlife CorporationGerald Pasanisi Safaris LTDWengert Windrose Safaris (T) LTDMasailand <strong>Hunting</strong> Co. LTDTanzania Safaris and <strong>Hunting</strong>Ortello Business Corporation LTDUsangu <strong>Hunting</strong> SafarisVIP <strong>Hunting</strong> Safaris ClubIntercon Hunters & Adventure SafarisKiboko <strong>Hunting</strong> SafarisNorthern <strong>Hunting</strong> EnterprisesMiombo Safaris LTDTanzania Big Game SafarisOld Nyika Safaris LTDTanzania Bundu Safaris LTDGame Frontiers <strong>of</strong> TanzaniaPori Trackers <strong>of</strong> AfricaSafari Royal HoldingsTandala <strong>Hunting</strong> Safaris LTDMalagarasi <strong>Hunting</strong> SafarisIn<strong>com</strong>e (US$)Eco <strong>Hunting</strong> SafarisFoa Adventures & SafarisCoastal Wilderness (T) LTDAfrican Bush Company LTDKilombero North Safaris LTDMwanauta & I LTDAfrican Trophy <strong>Hunting</strong> Safaris LTDWild Footprints LTDKilimanjaro Game Trails LTDRungwa Game Safaris (T) LtdRoyal Frontiers <strong>of</strong> TanzaniaTraditional African Safaris LTDTanganyika Game Fishing & Photographic SafarisBright Tours and Safaris LTDFalcon International Africa LTDMilanzi Wild Animals Zoo & Tours LTDSaid Kawawa <strong>Hunting</strong> Safaris LTD<strong>Hunting</strong> <strong>com</strong>paniesFigure 8: In<strong>com</strong>e paid to the Wildlife Division by hunting outfitters in 2003119
300,000250,000200,000150,000100,00050,0000Ortello Business Corporation LTDKiboko <strong>Hunting</strong> SafarisBarlette Safaris LTDWild Footprints LTDPori Trackers <strong>of</strong> AfricaTanzania Wildlife CorporationUsangu <strong>Hunting</strong> SafarisVIP <strong>Hunting</strong> Safaris ClubIntercon Hunters & Adventure SafarisTanganyika Wildlife SafarisMiombo Safaris LTDLuke Samaras Safaris LTDRungwa Game Safaris (T) LtdRobin Hurt Safaris (T) LTDEco <strong>Hunting</strong> SafarisTanganyika Game Fishing & Photographic SafarisOld Nyika Safaris LTDWengert Windrose Safaris (T) LTDBright Tours and Safaris LTDMasailand <strong>Hunting</strong> Co. LTDTanzania Bundu Safaris LTDCoastal Wilderness (T) LTDGame Frontiers <strong>of</strong> TanzaniaSafari Royal HoldingsAfrican Bush Company LTDNorthern <strong>Hunting</strong> EnterprisesTandala <strong>Hunting</strong> Safaris LTDTanzania Big Game SafarisKilombero North Safaris LTDMalagarasi <strong>Hunting</strong> SafarisMwanauta & I LTDTanzania Game TrackerAfrican Trophy <strong>Hunting</strong> Safaris LTDIn<strong>com</strong>e per block (US$)Gerald Pasanisi Safaris LTDKilimanjaro Game Trails LTDFoa Adventures & SafarisTanzania Safaris and <strong>Hunting</strong>Traditional African Safaris LTDRoyal Frontiers <strong>of</strong> TanzaniaFalcon International Africa LTDMilanzi Wild Animals Zoo & Tours LTDSaid Kawawa <strong>Hunting</strong> Safaris LTD<strong>Hunting</strong> <strong>com</strong>paniesFigure 9: In<strong>com</strong>e generated for the Wildlife Division per hunting concession by outfitters in 2003 for all <strong>of</strong> Tanzania120
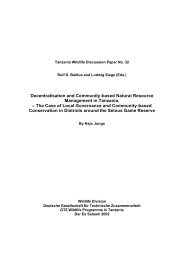
<strong>Hunting</strong> Intensity<strong>Hunting</strong> intensity is assessed here in two different ways:Firstly through a <strong>com</strong>parison <strong>of</strong> in<strong>com</strong>e generation against the size <strong>of</strong> hunting blocks.This method has an advantage <strong>of</strong> providing actual figures, which can be directly<strong>com</strong>pared to one another to develop clear trends. The method does however assumethat all hunting takes place inside the blocks as shown on the hunting permits.The second approach to measuring hunting intensity is more direct through mappingthe actual location <strong>of</strong> many hunted animals. This method does not provide clearly<strong>com</strong>parable figures, however does show that the basic assumption <strong>of</strong> the first methodis not always entirely valid.<strong>Hunting</strong> intensity assessed through in<strong>com</strong>e generationThe estimated in<strong>com</strong>e at first glance shows no correlation to the area <strong>of</strong> a block asshown in Figure 10. However a more careful inspection <strong>of</strong> the graphic relationshipbetween area and in<strong>com</strong>e generation reveals a gradient with three logical groupings,i.e. heavily utilised blocks, optimally utilised and under-utilised blocks. The sizes <strong>of</strong>the blocks used for this analysis are presented in Figure 2. Utilisation <strong>of</strong> the blocks bythe hunting <strong>com</strong>panies can be obtained from Tables 6 and 7.This analysis is prejudiced by the allocation <strong>of</strong> quota. Many <strong>of</strong> the quota allocationsare to a certain extent based on the previous season’s hunting success. As a result,those exclusive <strong>com</strong>panies bringing fewer clients but leasing large blocks tend to getlower quota allocations and hence less pressure to perform from the Wildlife Division.Similarly <strong>com</strong>panies utilising their blocks heavily tend to get higher quota allocationsthat further encourage over-utilisation <strong>of</strong> their blocks. Companies leasing many blocksdo not always stick rigorously to hunting the specific quota in a specific block. Thisleads to an apparent over-utilisation <strong>of</strong> one block and a corresponding underutilisation <strong>of</strong> another.
80,000MK1K1Heavy utilisationAverage In<strong>com</strong>e from Trophy Fees (US$)60,00040,00020,000L1LU3ML1LL2K4KY1MA1LU2 MT2 LL3R1K2MB2RU1M2MS1U4 R2AcceptableK3 U2utilisationLU4 U3 Y1R3K5IH1 LA1LU6U1 R4LU5LU7MT1N1M1LU8MH1N2MB3LL1MB1LU1MJ1Under utilisation00 500 1,000 1,500 2,000 2,500Area (km²)Figure 10: Relationship between average in<strong>com</strong>e generated from trophy fees (1996 to2003) and area <strong>of</strong> blocks to show various levels <strong>of</strong> hunting intensitygrouped into heavy, acceptable and under utilisation; Dotted lines showestimated limits <strong>of</strong> acceptable utilisation.Procedure for delimiting hunting intensity groupingsThe relationship between trophy fees and area is established;To establish a normal level <strong>of</strong> utilization, extreme levels <strong>of</strong> hunting intensity (both high and lowintensity) are excluded, which exclude the following blocks MK1, K1, L1, MJ1, MB3, N2, MH1,LU8, N1 & MB1.The remaining blocks are used to develop a regression equation between area and averagetrophy in<strong>com</strong>e. 30% above and below the normal level <strong>of</strong> utilisation is used as the upper and lowerlimits <strong>of</strong> acceptable utilisation.Blocks K1 and MK1 show excessively high levels <strong>of</strong> utilization well above what isnormal for conditions in the <strong>Selous</strong> Game Reserve. This immediately raises concernabout the sustainability <strong>of</strong> hunting in those areas, and the impacts on the surroundingareas.122
Figure 11: Location <strong>of</strong> hunts recorded with GPS in the <strong>Selous</strong> Game Reserve during2003<strong>Hunting</strong> intensity assessed through mapping <strong>of</strong> huntsFigure 11 above presents the location <strong>of</strong> 2245 hunts recorded with GPS coordinateswithin the SGR during 2003 representing 67% <strong>of</strong> the hunting that year. Recordsreveal a total <strong>of</strong> 3375 animals hunted, <strong>of</strong> which 86% have GPS coordinates. FromFigure 11 it appears that in some instances block boundaries and respective quota arenot being well respected. Blocks M1, LU1 and LU8 have little or no hunting takingplace, yet the records reveal that 22, 50 and 66 animals are listed as hunted in theseblocks respectively. There are also serious incursions into the photographic area(Blocks KY1 and B1) from block MK1, yet an unequal distribution <strong>of</strong> hunts withinthe allocated block.Little hunting takes place along the western boundary <strong>of</strong> the SGR, despite intensehunting pressure in the western parts <strong>of</strong> the reserve. <strong>Hunting</strong> in the southern parts <strong>of</strong>the SGR is focussed along the major rivers there.123
UTILISATION OF WILDLIFEPriority species for generating in<strong>com</strong>eThe 20 most important animals for generating in<strong>com</strong>e are presented in Table 3 inorder <strong>of</strong> priority and animals per client are presented as a ratio. Each client visiting theSGR hunts on average 7.75 animals. Buffalo are by far the most important species forin<strong>com</strong>e generation. Clearly the viability <strong>of</strong> the SGR as a hunting area depends onmaintaining a healthy buffalo population that will continue to provide quality huntingtrophies. In 2001 elephant rated seventh in in<strong>com</strong>e generation contributing 5.4% <strong>of</strong>in<strong>com</strong>e from trophy fees, but by 2003 have since risen to fourth position contributing7.6% <strong>of</strong> the in<strong>com</strong>e from trophy fees. The actual numbers <strong>of</strong> animals <strong>of</strong> selectedspecies hunted per block per year are presented in Table 4. The total hunting quota perspecies per year are presented in Table 5.Table 4:Ranking <strong>of</strong> the top 20 animals by contribution to in<strong>com</strong>e generation fromtrophy fees, and approximate numbers <strong>of</strong> each species hunted per client,from 1988 to 2003No. SpeciesPercentagecontribution totrophy feesApproximateratio <strong>of</strong> clients peranimal huntedAverage percentageuse <strong>of</strong> quota(1996 – 2003)1 Buffalo 21.5 3 per 2 clients 83.42 Leopard 10.4 1 per 4 clients 69.03 Lion 9.4 1 per 5 clients 52.24 Elephant 7.6 1 per 11 clients not listed on quota5 Zebra 7.0 1 per 2 clients 65.16 Hartebeest 6.0 1 per client 76.47 Hippo 5.7 1 per 3 clients 68.08 Wildebeest 4.6 2 per 3 clients 64.39 Sable 4.3 1 per 6 clients 43.610 Warthog 4.2 2 per 3 clients 70.711 Impala 3.9 1 per client 65.712 Eland 3.2 1 per 5 clients 38.813 Kudu, Greater 2.9 1 per 8 clients 31.414 Waterbuck 2.7 1 per 3 clients 50.515 Crocodile 2.7 1 per 6 clients 42.216 Reedbuck 1.3 1 per 4 clients 52.117 Hyaena 0.6 1 per 6 clients 49.918 Bushbuck 0.5 1 per 12 clients 25.319 Duiker 0.4 1 per 8 clients 31.720 Bushpig 0.4 1 per 9 clients 40.0Remainder (21 species) 0.5All species 7.8 animals per client124
Table 5:Numbers <strong>of</strong> various species hunted in and around the <strong>Selous</strong> GameReserveAnimal 1996 1997 1998 1999 2000 2001 2002 2003Buffalo 453 518 671 506 678 773 643 788Elephant 39 14 19 16 18 43 19 55Lion 86 98 115 81 63 83 81 78Leopard 100 105 106 78 80 89 71 94Hyaena 58 72 94 55 64 65 61 70Wildebeest 231 291 313 245 279 301 264 240Zebra 158 218 264 206 292 266 168 266Crocodile 44 59 89 69 84 71 63 60Sable 40 72 67 51 74 66 64 66Hippo 97 123 161 102 132 163 131 164Hartebeest 258 261 374 283 338 356 290 342Warthog 193 229 315 225 274 266 241 263Impala 241 289 350 316 331 363 322 315Bushbuck 24 29 47 20 25 42 28 43Eland 43 67 88 51 60 71 53 62Kudu, Greater 38 39 40 35 38 48 30 48Waterbuck 70 96 112 102 136 119 89 116Reedbuck 70 80 116 55 106 72 41 88Table 6:Annual hunting quota for selected species for the <strong>Selous</strong> Game Reserve(including Liwale North & South Open Areas)Species 1996 1997 1998 1999 2000 2001 2002 2003Buffalo 517 593 732 758 835 925 911 920Lion 148 140 187 179 170 177 167 167Leopard 132 123 138 119 134 141 151 166Hyaena 110 129 144 143 146 153 162Wildebeest 340 380 449 418 441 490 456 457Zebra 263 322 361 376 388 436 402 416Crocodile 108 133 167 166 186 191 172 181Sable 121 134 145 160 147 148 139 146Hippo 152 165 219 203 201 219 218 222Hartebeest 303 344 445 440 433 465 477 483Warthog 256 286 351 358 411 444 432 436Impala 367 403 506 517 516 546 509 511Bushbuck 103 116 138 164 129 138 127 131Eland 134 149 172 171 173 170 160 166Kudu, Greater 117 117 135 140 135 141 134 128Waterbuck 173 187 217 213 218 237 226 234Reedbuck 132 148 163 167 169 179 172 173Bushpig 94 103 127 133 124 133 128 130Oribi 16 15 19 22 25 25 27 27125
Trophy quality trendsTrophy quality has been collected for animals hunted in the SGR since 1995, but aserious attempt to collect data has only been implemented after 1999. <strong>Analysis</strong> <strong>of</strong> thedata is not easy as methods have not been adequately standardised. Measurementshave been taken using either metric and imperial systems without clearly indicatingwhich system is used. Also a number <strong>of</strong> clearly impossible records are presented.Prior to the analysis, data have had to be tested for a sense <strong>of</strong> normality. This has beendone by plotting one measurement against another for all individuals <strong>of</strong> a species, forexample plotting skull width against skull length for lion, or tusk circumferenceagainst tusk length for elephant. Records that do not fit a normal trend are thendeleted from the dataset.Buffalo300Tip to TipNumber <strong>of</strong> buffalo hunted800Tip-to-Tip measurement (cm)250200150600400200Number <strong>of</strong> buffalo hunted10001994 1995 1996 1997 1998 1999 2000 2001 2002 2003 2004YearFigure 12: Trends in buffalo trophy quality (tip-to-tip measurement) from 1,621records from the <strong>Selous</strong> Game Reserve from 1995 to 2003The tip-to-tip measurement is used here as an index <strong>of</strong> trophy quality for buffalo. Thisis the measurement <strong>of</strong> the full length <strong>of</strong> the horns including the curl. It is not an idealtrophy quality index as this measurement is not well correlated to age. Older animalswhich should be considered to provide better trophies typically have a lower tip-to-tipmeasurement.Buffalo trophy quality shows no correlation with levels <strong>of</strong> <strong>of</strong>ftake over the years 1995to 2003, despite a large increase in the number <strong>of</strong> animals hunted. The Buffalopopulation in the SGR exceeds … animals, and an <strong>of</strong>ftake <strong>of</strong> 800 per annumrepresents less than 1% harvest. A correlation between levels <strong>of</strong> <strong>of</strong>ftake and trophyquality would therefore not be expected.126
Lion40150Skull measurements (cm)302010Average skull length <strong>of</strong> <strong>Selous</strong> lion trophies10050Number <strong>of</strong> lions huntedNumber <strong>of</strong> lions hunted01994 1995 1996 1997 1998 1999 2000 2001 2002 2003 2004Year0Figure 13: Trends in lion trophy quality (skull length measurement) from 212 recordsfrom the <strong>Selous</strong> Game Reserve from 1995 to 2003A careful analysis <strong>of</strong> the lion trophy data, based on 212 records <strong>of</strong> skull length usingvarious statistical packages has revealed no significant trend in trophy quality over theperiod from 1995 to 2003. This provides empirical evidence that lion <strong>of</strong>ftake in the<strong>Selous</strong> Game Reserve is at a level that does not cause a decline in trophy quality andis therefore sustainable.Some minor trends can however be detected and provide some insights into thedynamics <strong>of</strong> the <strong>Selous</strong> lion population over this time. <strong>Hunting</strong> has increased and thearea used expanded in the period up to 1997. This may account for an initial increasein lion trophy quality up to 1997, as some lion prides were being hunted for the firsttime after a period <strong>of</strong> rest at that stage. 1998 was a year <strong>of</strong> heavy hunting and thenumber <strong>of</strong> lions hunted reached a maximum level that year. Trophy quality droppedas a result in 1999 but has stabilized and improved thereafter with a reduced lion<strong>of</strong>ftake. The data does suggest that lion trophy quality responds rapidly to huntingintensity and lion populations are able to recover easily. It is assumed from these datathat lion populations in the <strong>Selous</strong> are being heavily hunted, but their rapid recoveryin response to reduced hunting pressure indicates that <strong>of</strong>ftake levels are sustainable.Lion populations elsewhere have shown capacity to recover rapidly from a drop innumbers, as has been the case <strong>of</strong> the Serengeti lion recovery following the outbreak <strong>of</strong>disease.127
Leopard30180160Skull length (cm)252015105001994 1995 1996 1997 1998 1999 2000 2001 2002 2003 2004YearAverage skull lengthNumber <strong>of</strong> leopards huntedFigure 14: Trends in leopard trophy quality (based on skull length measurement) from222 records from the <strong>Selous</strong> Game Reserve from 1995 to 2003Leopard trophy quality does not show any particular trend over the period underrevue. From these data, it seems safe to assume that leopard populations in the SGRare unaffected by hunting pressure.14012010080604020Number <strong>of</strong> leopards huntedTrophy recordsanalysed: 222Elephant250Average tusk length100Tusk length (cm)20015010050Number <strong>of</strong> elephant hunted80604020Number <strong>of</strong> elephant hunted001994 1995 1996 1997 1998 1999 2000 2001 2002 2003 2004YearFigure 15: Trends in elephant trophy quality (based on tusk length measurement)from 69 records from the <strong>Selous</strong> Game Reserve from 1995 to 2003Elephant trophy quality shows an improvement over the period under revue, althoughthe number <strong>of</strong> animals for which trophy quality data are presented is limited,particularly for the early years. There is a wide range in trophy quality in later years,with some small elephants being hunted, but also some large elephants being hunted.The numbers <strong>of</strong> elephant trophies, has however increased over the period under revue.Improved trophy quality seems to correlate with increased numbers <strong>of</strong> animalshunted.128Trophy recordsanalysed: 69
Crocodile70060080Length (cm)500400300200100Average body lengthNumber <strong>of</strong> crocodiles hunted001995 1996 1997 1998 1999 2000 2001 2002 2003 2004604020Number <strong>of</strong> crocodiles huntedTrophy recordsanalysed: 195YearFigure 16: Trends in crocodile trophy quality (body length measurement) from 195records from the <strong>Selous</strong> Game Reserve from 1996 to 2003Quality <strong>of</strong> crocodile trophy records show no trend in response to levels <strong>of</strong> <strong>of</strong>ftake. Theinitial increase in trophy quality is attributed to few records in 1997. The size <strong>of</strong>crocodiles hunted shows a wide variation. Some very large crocodiles are beinghunted, but also some small ones.129
PROFILE OF HUNTING COMPANIESA total <strong>of</strong> 40 hunting <strong>com</strong>panies are recorded in the database as having brought clientsto hunt in the SGR but not all have leased blocks. The years <strong>of</strong> operation <strong>of</strong> thevarious hunting <strong>com</strong>panies leasing blocks in the SGR is presented in Table 6. Thistable shows a clear trend <strong>of</strong> longer periods <strong>of</strong> lease being allocated to <strong>com</strong>panies inthe years from 1996 to 2003 than for the preceding period. The confidence <strong>of</strong><strong>com</strong>panies and the demand for blocks has increased considerably over the period <strong>of</strong>the data presented. In 1988 half (50%) <strong>of</strong> the blocks were vacant, however from 1998no blocks have been vacant.The Wildlife Division annually sets hunting quota for many species for each blockthat is leased and the leasing <strong>com</strong>panies are required to utilise at least 40% <strong>of</strong> thevalue <strong>of</strong> the quota, but should not exceed the quota. The percentage utilisation <strong>of</strong> thequota value for the period 1996 to 2001 are presented in Table 7 together with the<strong>com</strong>panies leasing the respective blocks. Blocks where 40% <strong>of</strong> the quota value wasnot achieved are shaded, and blocks where quota values were exceeded are outlined.No hunting quota are set for elephant, however revenue generated from elephanthunting has been included in the analysis <strong>of</strong> the data presented in Table 7. This givesthe impression <strong>of</strong> a higher number <strong>of</strong> blocks where the value <strong>of</strong> quota are exceeded.The analysis was therefore repeated excluding the revenue generated from elephanthunting, and those blocks where quotas were still exceeded are marked accordinglywith a double outline.Table 8 presents a long list <strong>of</strong> approximately 350 pr<strong>of</strong>essional hunters having huntedin the SGR as revealed by the database. Some unlisted pr<strong>of</strong>essional hunters claim tohave hunted in the SGR, while others claim to have more years <strong>of</strong> experience in theSGR than shown in Table 8. Reasons for these anomalies could be due to pr<strong>of</strong>essionalhunters having bypassed licensing procedures in the past.130
Table 7:Years and areas <strong>of</strong> operation for hunting <strong>com</strong>panies in and around the <strong>Selous</strong> Game ReserveBlock 1988 1989 1990 1991 1992 1993 1994 1995 1996 1997 1998 1999 2000 2001 2002 2003GonabisMK1 Intercon Hunters & Safaris LTDKY1 PhotographicY1 Vulture <strong>Hunting</strong> Safaris Tanzania Bundu Safaris LTDLA1 Northern <strong>Hunting</strong> Tanzania Game Tracker Safaris / Miombo Safaris LTDR3 Miombo Safaris LTDK3 Game Frontiers <strong>of</strong> Tanzania (GFT)K2 TAWICO Tembo Safari Kiboko <strong>Hunting</strong> Safaris ECO GFTTarimoK1Safaris Royal Afr BushK4 Safari East Africa African African Bush Co LTD AfricanR1 Trophy TGS Trophy <strong>Hunting</strong> Safaris LTDR2 Safari East Tembo Eco <strong>Hunting</strong> Safaris LTDR4 Africa Safaris Francols (ECO)K5 Tanzanian Big Game SafarisLU1 Masailand Mwanauta & Co LTDL1 Hunters Bright Tours (T) LTDIH1 Bundu TracksLU2 Masailand <strong>Hunting</strong> Co. LTDLU5 Tanzania Game Fishing & Photographic SafarisLL3MS1 Luke Samaras Safaris LTDRU1U4Continued overleaf131
Table 7 continued..Block 1988 1989 1990 1991 1992 1993 1994 1995 1996 1997 1998 1999 2000 2001 2002 2003MA1Tanzania Wildlife CorporationU3(TAWICO)LU4 Robin Hurt Safaris TAWICOLU3 Bundu TreadAfr ECO Traditional African Safaris LTDM2 Hunters International Hunters Int. Tz. Pori Trackers <strong>of</strong> Africa (PPS)TAWICOM1Tanzania Malagarasi <strong>Hunting</strong> SafarisU1 African Bush Company LTDU2 Safari East Africa TAWICOLiwale NTAWISALiwale SLU7LL1Barlette Safaris LTDLL2LU6MT2LU8N1Tanganyika Wildlife Safaris LTDMB1(TAWISA)MB2MB3MH1MJ1Gerald Pasanisi Safaris LTDML1MT1N2132
Table 8:Percentage utilisation <strong>of</strong> hunting quotaCompanies Block 1996 1997 1998 1999 2000 2001 2002 2003Intercon Hunter & SafariKY1 69.6 52.8 41.7 36.8 0.9 PhotographicMK1 122.8 56.7 51.8 37.1 90.0 86.5 56.9 79.9Eco <strong>Hunting</strong> Safaris LTDR4 45.0 56.6 84.6 26.4 32.6 32.0 48.2 54.2R2 59.0 69.5 119.0 33.0 57.7 38.3 47.0 54.5Africa Trophy (99 – 03) R1 62.6 55.6 84.5 57.0 119.7 130.5 69.5 63.1Afr Trophy (01-03) K4 85.9 70.7 69.5 40.5 61.8 84.8 74.2 68.8African Bush Co. U2 54.7 55.6 67.6 23.1 60.3 62.7 58.8 69.6U1 44.5 34.6 58.8 37.3 33.2 44.7 34.0 65.0Bright Tours L1 0 26.1 68.5 72.2 63.3 56.1 57.1 42.5Kiboko <strong>Hunting</strong>K1 47.1 96.0 101.2 107.1 80.3 54.6 81.9 86.7K2 30.5 92.4 66.7 91.2 67.0 33.9 68.5 22.8Miombo Safaris LTD R3 69.6 73.3 38.4 52.6 76.2 41.0 51.7 70.0Tanzanian Game Tracker Saf. LA1 45.5 67.1 50.3 47.4 100.5 47.6 35.4 31.0Tanzanian Big Game Safaris K5 42.6 46.9 44.2 55.2 35.4 71.4 30.9 29.9Tanzanian Bundu Safaris Y1 31.4 43.9 45.9 41.8 31.0 72.0 Photo.RU1 65.7 76.6 75.2 84.8 41.8 69.7 62.2 79.8Luke Samaras Safaris LTDU4 49.8 87.5 73.1 69.5 NQA 69.6 60.9 60.7LL3 34.0 98.5 121.4 74.3 51.1 80.8 63.7 94.5MS1 69.8 99.9 73.6 62.4 59.9 63.2 46.8 69.7MA1 41.5 61.0 92.2 92.2 NQA 100.9 23.9 81.6U3 24.9 33.5 75.6 54.1 41.0 43.9 50.3 79.5Tanzania Wildlife Corporation(TAWICO)Gerald Pasanisi Safaris LTDBarlette Safaris LTDTanganyika Wildlife Safaris(TAWISA)LU4 Block vacant 50.9 113.6 NQA 34.2 16.9 74.3N2 80.8 74.6 62.1 36.7 10.4 57.5 15.6 61.0MJ1 175.9 112.2 66.5 18.6 12.8 114.4 83.5 24.5MH1 117.7 65.6 50.8 18.3 15.3 67.2 11.5 80.9MT1 169.1 107.7 45.0 15.2 31.0 87.4 27.0 207.8MB3 97.2 65.8 48.2 39.0 8.9 68.9 15.3 63.7ML1 86.5 74.0 76.3 35.3 2.7 105.8 12.3 100.1LL2 84.0 89.9 94.2 55.1 75.6 85.1 77.3 57.0LL1 58.0 82.8 74.3 59.3 82.5 80.3 75.0 64.1MT2 68.3 82.6 60.3 41.5 61.8 104.1 57.0 89.4Liwale North 47.2 NQA 72.8 51.5 9.0 87.5 52.4 49.6Liwale South 25.3 NQA 82.0 33.7 8.8 81.3 48.4 41.0N1 106.8 49.5 19.1 0 42.4 37.3 29.7 42.1MB2 145.0 50.3 18.9 0.7 79.5 68.3 53.3 69.6LU6 100.1 50.6 37.4 9.4 51.7 61.8 32.2 54.3LU7 89.8 50.1 60.5 20.3 45.9 37.1 10.3 57.6LU8 52.2 59.6 54.6 3.7 48.3 31.9 2.8 67.9MB1 63.7 71.9 18.0 0 6.6 45.9 54.8 58.0Game Frontiers <strong>of</strong> Tanzania K3 Vacant 22.1 134.9 51.7 92.2 95.2 43.1 25.2Malagarasi (98-03) M1 NQA Vacant 34.1 42.6 75.4 61.0 18.6 39.6HITPori Trackers (98-03) M2 NQA 55.6 82.5 41.2 58.7 51.5 55.5 87.1Masailand <strong>Hunting</strong> LTDLU2 60.3 66.7 109.7 99.0 44.8 106.8 64.0 66.3IH1 62.0 32.4 75.6 92.3 74.7 45.2 49.6 41.0Traditional African Safaris LU3 19.8 5.2 12.6 26.0 36.5 35.1 20.4 41.5Tz Game Fishing & Photo LU5 19.3 45.1 95.9 25.0 79.4 63.0 51.4 45.9Mwanauta & Company LTD LU1 Block vacant 0.3 59.7 35.4 67.8 51.2 52.2Key:NQA = No Quota AvailableUnder-utilised block (less than 40% utilisation <strong>of</strong> quota)Quota not exceeded excluding elephant huntsQuota exceed after excluding elephant huntsNo hunting taking place (Block vacant or set aside for photographic)133
Table 9 continued..Pr<strong>of</strong>essional Hunter Experience Clients Final Year Pr<strong>of</strong>essional Hunter Experience Clients Final YearGerard Ambrose 1 8 1993 Jean-Louis Masson 8 66 2003Gérard Pasanisi 7 14 2001 Jeff Covey 2 32 2001Gerrie van der Merwe 1 1 1995 Jerome M. Latrive 8 31 2003Gervas Maiko 2 13 2002 Joan Fornel 2 5 2002Godfrey Chotara 2 16 2000 Joe Coogan 1 1 2002Godson Saitabau 1 3 2002 Joe O. Bannon 2 2 2000Gordon B. Anthony 1 1 1998 John Bosch 3 8 2002Gordon Church 5 16 2001 John Du Plooy 1 9 2001Graham Jones 1 1 1996 John Miller 2 6 2003Gregory Butler 1 2 1994 John Oosthuizen 3 7 2003Guintone Wite 1 1 2002 John Pieterse 1 1 2003Guy Rowe 6 47 2003 John Reeve 1 2 1991H. Mkula 1 1 1990 John Yakas 3 3 2003H. Muller 1 2 1993 Jon Queres 5 10 2001Hakani Ponzstran 1 3 1991 Jonathan Taylor 1 4 2003Hamish Manning 2 11 2002 Jose Carlos 3 3 2003Hannes Wessels 1 1 1993 Jose Cloete 1 2 1996Hapreet S. Brar 2 16 2003 Jose Faria 3 6 1998Harry Klimer 1 1 2001 Jose Fitas 5 20 2001Hartley R. Combrink 5 43 2003 Jose Iglesias 3 8 2000Haruna Mwanauta 1 4 1999 Jose Louis Tabares 11 58 2003Hassan Mumbi 1 1 2003 Joseph O. Bannon 3 5 2000Hayden Glenn 5 19 2003 Joseph Vagner 4 8 2002Henry Malinga 1 1 1999 Joska G. Magyar 8 50 2002Hermanus Lemmer 3 39 1998 Jouf Bernard 1 5 1995Hillary Daffi 1 2 2000 Juan Fornell 4 10 2003Hubert Boulet 6 32 1998 Karl Luomakoski 1 1 2000Hugo Seia 1 4 2003 Keith Hendry 2 3 2002Hugo Seth 1 1 1999 Kissiri 1 1 1996Ian du Toit 1 1 1995 Kobus De Wet 2 10 2003Ian Lennox 1 5 1993 Kula Kavali 1 1 2002Ian Mannins 1 2 1996 Kurt J. Ziegler 9 67 2003Ian Mc Intoch 1 2 2001 L. Wayne Potterfield 1 1 2001Ian S. Bachelor 1 1 2003 Lance Ayliffe 3 6 1998Isaac Kiwia 7 36 2003 Lance Higgins 3 15 2002Issa Mohamed 1 1 1993 Larry Richard 1 2 1993Istvan Pletikosic 1 1 2001 Larry Ward 4 15 1998J. Elloci 1 2 1992 Laurent Garcia 2 5 2003J.C. Lordans 1 1 2002 Lazaro M 1 1 1994J.M. Robert 1 3 1993 Len Phillipe 1 1 1998Jabo Alex Andala 1 1 1998 Lennox 1 1 1993Jack Leumaux 1 4 1996 Leon Kachel H<strong>of</strong>fer 2 11 2003Jaco Oosthuizen 2 6 2003 Lionel Kaysler 2 5 2003Jacob Du Plessis 5 24 2002 Louis Masson 1 2 2003Jacobus De Wet 3 35 2003 Louis Pedro 2 2 1998Jacobus Steph. Smit 1 1 2000 Louis Von Putbus 1 4 2003James Kephart 1 3 1993 Lous A. Brito 1 2 1990James Maynard 2 2 1998 Luke Black Beard 1 4 2002Jason Bergman 3 10 2003 Luke Samaras 11 83 2003Jason Stone 2 8 2002 M. Fabris 1 6 2001Jasper P. L. Samaras 7 19 2002 M.A. Vickery 1 2 1993Jay Ball 1 4 1993 Maike Bartlett 1 3 1994Jay Smit 1 4 1999 Marcel Tiran 9 50 2003Jean Beguerie 3 4 2002 Mark Radl<strong>of</strong>f 1 3 2002Jean Claude De Crecy 3 3 2001 Mark Selby 4 9 2003Jean Linox 1 1 1993 Mark Sullivan 4 28 2001Jean Michel Latrive 7 31 2002 Marshal Busly 1 1 2002Jean Pierre Le Roux 9 67 2003 Marshall W. Smalling 4 25 2003Jean-Claude Gauthier 7 9 2003 Massimo De Amicis 2 2 2003135
Table 9 continued..Pr<strong>of</strong>essional Hunter Experience Clients Final Year Pr<strong>of</strong>essional Hunter Experience Clients Final YearMathew Laboureur 2 7 2000 Quintin Whitehead 2 9 2003Mauro Daulio 8 47 2002 R. Chiffroy 2 4 1994Mauro Fabris 1 1 2003 R. J. Montivoisin 1 5 1993Michel Mantheakis 8 40 2003 R. Minja 1 13 1996Michel Ommay 1 1 1995 R. Rowley 1 1 2001Mike Branham 1 1 2002 Rainer E. Joesch 1 6 2003Mike Karaiskos 1 6 1999 Raoul Ramoni 7 20 2003Mohsin Abdallah Sheni 1 1 2002 Rashid H.S 1 1 1990Moller 1 3 1992 Ray Stanley 6 49 2003Moret Polanet 1 2 1992 Reed Morian 1 1 1993Muir<strong>of</strong>f Dolf Bohwer 1 1 2002 Renzo Torrani 4 5 2003N.E. Ndonde 3 13 1995 Richard Bonham 1 2 1997Natasha I. Berg 1 2 2002 Richard Bresner 1 14 2003Natie Oel<strong>of</strong>se 6 37 2000 Richard J. Crispin 7 40 2002Neil Goss 2 15 2001 Richard Newgass 1 4 2001Nick Pretorius 3 3 2001 Richard Ramoni 10 27 2002Nicolas Dubich 5 39 2003 Richard Trappe 1 1 1998Nicolas Gazelle 2 3 2001 Rick Harleens 2 2 1997Nicolas Negre 7 47 2003 Rick Hoperaft 2 5 2000Nicolas Oubika 1 1 2002 Ridge W. Taylor 3 9 1996Nigel Archer 7 45 2003 Robin Hurt 1 8 1993Nigel Theisson 11 36 2003 Robin Voigt 2 9 2001Nodoli Torrani 4 8 2000 Roby Martin 1 1 1993Norbert Reiner 1 4 2003 Rolf Rohwer 7 36 2003O. Barton 1 2 1993 Roman Pilon 2 3 2000Oliver Edwards 1 1 2001 Ronald W. Sparrow 1 6 1998Orlando Cardoso 4 39 2003 Rory Guthrie 2 14 2003P. Waddelow 1 2 2002 Roy Carr Hartley 1 2 1993Paddy Curtis 10 49 2003 Ruby Lubin 1 1 1998Pano Calavrias 10 70 2003 Rudolf Hornig 2 16 1998Pascal Coudert 9 56 2003 Ryan Wienand 2 9 2003Pascal Mageta 1 4 1994 Saitabali 1 2 1998Patrick Mnahela 11 71 2003 Samuel Meena 2 7 2000Paulo Shanalingigwa 10 45 2003 Schalck Tait 1 1 2003Pedro De Sa E Mello 11 78 2003 Sean Combrink 1 1 2002Penn De Vries 1 4 2001 Sergio 1 1 1996Pertus Fourie 1 3 2002 Simon Evans 1 2 1994Peter Baltar 1 1 2002 Stephan Buys 5 28 2003Peter Bartosz 3 25 2003 Stéphane Cordesse 3 15 2003Peter Chipman 1 4 2001 Stephano De Amicis 3 14 2003Peter Dafner 2 5 2003 Steve Atwell 6 43 2003Peter Jason Stone 1 7 2001 Stewart F. Cooper 1 3 1996Peter Jasson 1 1 2002 Ted Gorline 2 3 2002Peter Swanepoel 4 18 2002 Tiran Marcel 3 14 1999Peter Waddelau 1 3 2003 Tony Calavrias 2 15 1997Petrus Fourie 5 26 2003 Tony Moore 2 3 1997Phillip D. Lozano 6 20 2003 Tony Sanchez Ariño 6 13 2003Phillipe Chardonette 2 3 1997 Trosky 1 2 1997Phillipe Clero 8 58 2003 U. Matomolos 1 1 1990Phillipe Lué 12 53 2003 Wade Bale 1 2 1999Pierre Caravati 10 37 2003 Wayne Clark 2 13 2003Pierre Jon Queres 2 7 2001 Wayne Stanton 1 1 2003Pierre Van Tonder 3 13 2003 Webster Kapaliswa 6 16 2001Pierre van Wyk 1 1 2000 William Cloete 3 9 1999Piet Fourie 1 1 2002 Willy Blomme 6 33 2003Piet Hougard 1 4 1993 Xavier L. 1 1 2003Placid Mgedzi 4 17 2001 Zayne Van Der Merwe 1 8 2002Quico 1 2 1997 Zdenek Vagner 4 12 2002136
PROFILE OF HUNTING CLIENTSTable 10: Nationalities <strong>of</strong> clients hunting in the <strong>Selous</strong> Game ReserveNationalityPercentage<strong>of</strong> clientsAmerican 34.2Spanish * 17.7French * 13.4Italian * 7.2German * 6.1Austrian * 3.5Hungarian 2.1Belgian * 1.8Mexican 1.7British * 1.5South African 1.4Russian 1.3Danish * 0.8Swedish * 0.8Polish 0.7Portuguese * 0.7Canadian 0.6Czechoslovakian 0.6Australian 0.4Swiss * 0.4Other nationalities 3.1* Origin EuropeClients <strong>com</strong>e from a wide range <strong>of</strong> countries to hunt in Tanzania (Table 9), withAmerican clients representing the largest single nationality. A more careful inspection<strong>of</strong> the nationalities in Table 10 reveals that the majority <strong>of</strong> clients actually <strong>com</strong>e fromEurope. This has important implications for the marketing strategies used by theTanzanian Government and hunting operators.Table 11: Breakdown <strong>of</strong> hunting clients from major countriesCountryPercentage<strong>of</strong> clientsEurope 54.2United States 34.2Other countries 11.6137
Table 12: Percentage <strong>of</strong> clients taking various lengths <strong>of</strong> hunting safari in and aroundthe <strong>Selous</strong> Game Reserve from 1988 to 2003Safari lengthPercentage <strong>of</strong>clients1 to 7 days 19.98 to 14 days 12.315 to 20 days 8.021 days 51.4Greater than 21 days 8.4Table 13: Annual numbers <strong>of</strong> clients, hunting days, permits and trend in days takenper clientYear Clients<strong>Hunting</strong>daysPermits Days / Client1988 99 1,779 150 18.01989 185 3,707 278 20.01990 177 3,483 264 19.71991 115 2,124 183 18.51992 163 3,305 254 20.31993 198 3,409 246 17.21994 174 3,210 206 18.41995 168 3,139 197 18.71996 325 5,340 364 16.41997 346 5,688 407 16.41998 436 7,049 558 16.21999 343 5,420 429 15.82000 431 6,639 600 15.42001 483 7,599 644 15.72002 417 5,475 455 13.12003 479 7,287 600 15.2Concerns are frequently raised by hunting operators that clients are showing anincreasing tendency to take shorter safaris, and that the classic 21-day safari isbe<strong>com</strong>ing difficult to sell. The above data in Table 12 does indicate a limited trend <strong>of</strong>shorter safaris over time.138
Months <strong>of</strong> safariThe most popular months to hunt are July to October as shown below in Figure 17.The relatively high demand for safaris in July suggests that the hunting season couldstart earlier to ac<strong>com</strong>modate more hunters, but extending the hunting season beyondthe New Year would not yield any benefit. Climatic conditions (inaccessibility due torain and tall grass) limit the practical possibilities <strong>of</strong> hunting earlier than July for mostareas <strong>of</strong> Tanzania, but some outfitters believe that bringing forward the season wouldbe an advantage.2520% <strong>of</strong> clients151050Jul Aug Sep Oct Nov DecMonthFigure 17: Percentage <strong>of</strong> clients hunting per monthThe best lion hunting is said to take place early in the season before fires arewidespread and while the grass is tall. At this time lions seem to have difficultyhunting possibly due to <strong>wildlife</strong> being dispersed and lions are thus more likely to beattracted to baits. Incidence <strong>of</strong> man-eating by lions tends to increase prior to the end<strong>of</strong> the rainy seasons for the same reason.139
Table 15: Comparison <strong>of</strong> human densities between the photographic and huntingareas <strong>of</strong> the <strong>Selous</strong> Game ReserveYearPhotographic Tourist huntertourist days days1997 10,452 5,6881998 11,690 7,0491999 4,156 5,4202000 9,994 6,6392001 11,263 7,5992002 10,374 5,4752003 8,642 7,287Average 9,510 6,451Area (km²) 1,600 46,055Density(Tourists / km²)5.94 0.14Human densities (tourists only) is substantially higher in the northern photographicarea <strong>of</strong> the SGR than in the hunting area. The differences are dramatic with densitiesin the northern photographic area being 42 times greater than beyond that area. Thishigh density <strong>of</strong> tourists is despite many <strong>of</strong> the lodges in the area operating at lowcapacity.Table 16: Comparison <strong>of</strong> in<strong>com</strong>e generated per square kilometer by photographicand hunting tourism in the <strong>Selous</strong> Game ReservePhotographictourism<strong>Hunting</strong>TourismIn<strong>com</strong>e (US$) 214,320 3,200,000Area (km²) 1,600 46,055In<strong>com</strong>e (US$/ km²) 133.95 69.48The in<strong>com</strong>e generated per square kilometer by photographic tourism is approximatelydouble that generated from hunting, but generated from 42 times the density <strong>of</strong>people. The higher in<strong>com</strong>e is attributed to only a small area until now having beenavailable to the tourist lodges. The actual in<strong>com</strong>e from hunting is 15 times greaterthan the in<strong>com</strong>e generated from tourism. This is the proverbial <strong>com</strong>parison <strong>of</strong> applesto pears, but it is also the <strong>com</strong>parison <strong>of</strong> a dwarf against a giant.141
SOME HUNTING ISSUES IN THE SELOUS GAME RESERVE NEEDINGATTENTIONThe hunting permits, trophy data sheets and GPS coordinates for the hunting in the<strong>Selous</strong> Game Reserve in 2003 were <strong>com</strong>puterized. Based on a picture <strong>of</strong> the data thathas emerged, the following anomalies have been noticed and need attention:1. The <strong>com</strong>pany Intercon Hunters and Safaris LTD has been hunting within thearea set aside for photographic tourism, while the block MK1 that is allocated tothis <strong>com</strong>pany is partly un-utilised.2. <strong>Hunting</strong> is not always taking place within the blocks in which it is registeredto take place. The following blocks appear to have minimal hunting taking placein contravention to what the statistics reveal:LU1LU8M1ML13. The following blocks appear to have had more hunting taking place withintheir boundaries than is shown by the hunting data:K4LU2LU3R14. Documents <strong>of</strong> the Wildlife Division indicate that block LU2 is leased toMasailand <strong>Hunting</strong> Company LTD. The hunting data however show that thisblock is utilized by both Masailand <strong>Hunting</strong> Company LTD and Mwanauta & CoLTD.5. Statistics show blocks K1 and MK1 have been exposed to particularly heavilyhunting intensity, raising concerns about the capacity <strong>of</strong> these areas to sustain suchhigh levels <strong>of</strong> <strong>of</strong>ftake.6. Observer fees are inconsistent between different <strong>com</strong>panies, as shown by thetable overleaf. Approximately 50% observers per client would seem to be normal.7. Declared wounding rates are inconsistent between different <strong>com</strong>panies, asshown by the table overleaf. Experienced hunters know that wounding rates <strong>of</strong>approx 5% are normal, less than 5% suggests that wounded animals are not beingdeclared.8. Percentages <strong>of</strong> trophy records submitted are inconsistent between different<strong>com</strong>panies, as shown by the table overleaf. Trophy records should be submittedfor every animal hunted (should = 100%). Some <strong>com</strong>panies are submittingdubious trophy records (e.g. Buffalo boss width = 50 cm).142
Figures in Table 22 below suggest that the presence <strong>of</strong> observers and woundedanimals have been under-estimated by some <strong>com</strong>panies, and none are submittingtrophy records for every animal hunted.Table 23: Percentage trophy records and wounding rates per animal hunted, andpercentage observers per client by the various <strong>com</strong>panies currentlyoperating in the <strong>Selous</strong> Game Reserve for 2003PercentageTrophy recordssubmittedPercentage animalsdeclared aswoundedPercentageObserverspresentCompanyAfrican Bush Company Ltd 76.0% 0% 45.0%African Trophy <strong>Hunting</strong> Safaris 70.6% 0.6% 105.9%Barlette Safari Ltd 67.2% 0% 36.4%Bright Tours Safaris Ltd 91.1% 0% 66.7%Eco <strong>Hunting</strong> Safaris Ltd 84.4% 2.5% 38.9%Game Frontiers <strong>of</strong> Tanzania 61.1% 5.6% 57.1%Gerald Pasanisi Safaris 55.6% 0% 0%Intercon Hunter and Safari 72.9% 0.4% 4.7%Kiboko <strong>Hunting</strong> Safaris 78.0% 2.0% 34.3%Luke Samaras Safaris Ltd 84.2% 0.9% 72.7%Malagarasi <strong>Hunting</strong> Safaris 59.6% 3.5% 8.7%Masailand <strong>Hunting</strong> Ltd 82.4% 2.2% 68.6%Miombo Safaris 84.8% 2.5% 11.8%Mwanauta & Company Ltd 69.6% 1.8% 59.1%Pori Trackers <strong>of</strong> Africa 78.0% 0% 82.4%Tanzania Big Game Safaris 70.0% 5.0% 33.3%Tanzanian Game Fishing & Photo 73.0% 4.8% 80.0%Tanzanian Game Trackers 73.0% 2.7% 14.3%TAWICO 38.5% 0% 2.1%TAWISA 73.6% 2.3% 11.6%Traditional African Safaris Ltd 77.6% 4.1% 33.3%143
<strong>APPENDIX</strong> 10: Log frame <strong>of</strong> proposals to improve Tourist <strong>Hunting</strong>Group Problem Actions to resolve associated problems1. Lowin<strong>com</strong>eReal value <strong>of</strong> huntingproduct not achieved• Implement the management plan on tourist hunting(1995) which includes:generation- Competitive bidding by operators for hunting blocks- Simplification <strong>of</strong> the hunting regulations- Involvement <strong>of</strong> rural <strong>com</strong>munities- Distribution <strong>of</strong> fees among stakeholders- Procedures to promote continuity <strong>of</strong> the lease byoperators occupying a block provided appropriatecriteria are satisfied• Revise the tourist hunting management plan using aconsultative process• Promote diversified use <strong>of</strong> the hunting areas2. Lack <strong>of</strong>standards3. Lack <strong>of</strong>information• Unethical proceduresused by hunters• Poor quality trophieshunted• Disregard <strong>of</strong> huntingregulations and falsedeclaration <strong>of</strong> results• No training facilitiesfor pr<strong>of</strong>essionalhunters• Low standard <strong>of</strong>pr<strong>of</strong>essional hunting• No external controlmechanisms on thehunting industry• Poor monitoring• Shortage <strong>of</strong> data forquota setting• Trophy quality standards and monitoring introduced• Introduce effective control on export <strong>of</strong> under-sizedtrophies• Clarification and precise mapping <strong>of</strong> all hunting blockboundaries, including DW approval on maps• Consolidation <strong>of</strong> hunting blocks / revision <strong>of</strong> boundariesin some areas• Spot checks on hunting activities conducted by <strong>Hunting</strong>Section• WD to provide a suitable area to TAHOA for training /testing <strong>of</strong> PHs• Internal control mechanisms <strong>of</strong> TAHOA authorised andpromoted• TAHOA to be responsible for licensing <strong>of</strong> PHs based ontheir experience in Tanzania• DW to approve standards established by TAHOA for PHsincluding minimum age, qualifications, procedure forapprenticeship / in-service training, skills assessment• WD to collaborate with external institutions to facilitatethe development <strong>of</strong> independent certification foroperators• Computerisation <strong>of</strong> hunting licenses and issuingprocedures including the financial aspects there<strong>of</strong>• Increased census <strong>of</strong> <strong>wildlife</strong> populations• Promote research / inventories <strong>of</strong> key species, particularlylion and buffalo populations144
4. Declining<strong>wildlife</strong>populations5. Uncertainty on theway forward6. Difficulttrends forWD tocontrol• Shortage <strong>of</strong> <strong>wildlife</strong>staff for patrol• Communities notinvolved in <strong>wildlife</strong>management• Low effectiveness <strong>of</strong>operator’sinvolvement• Over-hunting <strong>of</strong> keyspp.• Limitedunderstanding <strong>of</strong>mgmt requirementsfor hunting amongWD personnel• New ideas needed toguide reform <strong>of</strong>tourist hunting• Too much foreigncontrol <strong>of</strong> thehunting industry• Monopolisationtendencies• Significantly increase the game scout force• Boost establishment <strong>of</strong> WMAs and empowerment <strong>of</strong><strong>com</strong>munities to control who hunts what animals on WMAland and enable the <strong>com</strong>munities to accrue financialbenefits• Provide incentives to improve participation <strong>of</strong> operators inmanagement (operators encouraged to contribute /introduce technologies into antipoaching activities, WD toprovide patrol personnel)• WD to produce specific guidelines to operators and value<strong>of</strong> expected contributions for <strong>com</strong>munity support, roadconstruction etc.• Reduction <strong>of</strong> quota• Restructuring <strong>of</strong> safari package system• Each game reserve <strong>of</strong>fice to keep better (<strong>com</strong>puterised)record <strong>of</strong> hunting activities• Circulate the management plan (1995) on tourist hunting,and invite <strong>com</strong>ments• Computerise old hunting data, analyse and circulateresultsSource information / opinions from within (Mweka / UDSM/ SUA) and outside the country on the following topics:• Past hunting data e.g. <strong>Selous</strong>• Initiate market research into value and demand forhunting• Invite opinions from existing and potential operators• Invite opinions from international hunting organisations• Understand developments in hunting from other <strong>wildlife</strong>management authorities in Africa / globally• Introduce affirmative action incentives for employment <strong>of</strong>pr<strong>of</strong>essional Tanzanian staff (PHs, camp managers etc.)for example a formula for reduced lease fees• Amend regulations such that operators are required toshow at least 55% <strong>of</strong> their in<strong>com</strong>e is received intoTanzanian-based bank accounts.• Involve TRA to clarify taxation <strong>of</strong> hunting (particularlysubleasing)Amend regulations to include the following:• Restrict the maximum number <strong>of</strong> blocks leased to anoutfitter / group <strong>of</strong> <strong>com</strong>panies under <strong>com</strong>mon ownership• Stipulate a minimum number <strong>of</strong> outfitters / operatorsactive in Tanzania to ensure adequate <strong>com</strong>petition exists145
BIBLIOGRAPHYBaldus, R.D. (ed.) in preparation. Lion Conservation in Tanzania Leads to SeriousHuman–Lion Conflicts With a Case Study <strong>of</strong> Man Eating Lions. TanzaniaWildlife Discussion Paper No. 38Baldus, R.D. 1991. The Economics <strong>of</strong> Safari <strong>Hunting</strong>. Tourismus pp 361-366.Baldus, R.D., Kibonde, B. & Siege, L. 2003. Seeking Conservation Partnerships in the<strong>Selous</strong> Game Reserve, Tanzania. PARKS Vol 13 No 1. Conservation Partnershipsin Africa. Pp 50-61.Booth, V.R. 2002. Assessment <strong>of</strong> Sport <strong>Hunting</strong> in the Game Reserves in the KageraRegion <strong>of</strong> Tanzania. Report prepared to support the management planning processfor the Burigi/Biharamulo and Ibanda/Rumanyika Game Reserves. Kagera/KigomaGame Reserves Rehabilitation Project (EDF), Wildlife Division, Ministry <strong>of</strong> NaturalResources and Tourism, Dar es Salaam.Booth, V.R., Games, I. & Siege, L. 1996. Financing potential <strong>of</strong> the <strong>Selous</strong> Game Reserveand its Bufferzones. GTZ <strong>Selous</strong> Conservation Programme Discussion Paper No. 21.Broomhead, N.G. 1997. Financial Management <strong>of</strong> the Tourist <strong>Hunting</strong> Sector inTanzania. Report No 3. Confidential report from GTZ to the Wildlife Division,Ministry <strong>of</strong> Natural Resources and Tourism, Dar es Salaam.Grosse, C. et al. 2001. Trophaeenjagd auf gefaehrdete Arten im Ausland. BfN-Skripten40, Federal Agency for Nature Conservation, Bonn.Down To Earth, 2001. Certification in Indonesia: A Briefing. Document obtained fromInternet: http://dte.gn.apc.org/Ccert.htm.Games, I. And Severre, E.L.M. 2002. Leopards in Tanzania, A Review. A paper submittedto the CITES Secretariat supporting the Tanzania proposal for an increased leopardhunting quota. Wildlife Division, Dar es Salaam.GTZ <strong>Selous</strong> Conservation Programme. 1999 Proposal for Modification <strong>of</strong> Elephant<strong>Hunting</strong> Regulations. GTZ <strong>Selous</strong> Conservation Programme. Unpublished report,Dar es Salaam.Hemingway, E.M. 1935. Green Hills <strong>of</strong> Africa. Hemingway Foreign Rights Trust. Publishedby Arrow Books, 1994, Random House, London.Hurt, R and Ravn, P. 2000. <strong>Hunting</strong> and its benefits: An overview <strong>of</strong> hunting in Africawith special reference to Tanzania. In “Wildlife Conservation by Sustainable Use”.Edited by Prins, H.H.T. et al Page 295 – 313. Kluwer Academic Publishers, Norwell,MA.Kibebe, J.D. 1994. Tourist and Local <strong>Hunting</strong> in Tanzania. A Paper Presented at theWildlife Department’s Workshop in Arusha 26-28 October 1994. Ministry <strong>of</strong>Natural Resources and Tourism, Wildlife Division, Dar es Salaam.Kitwara, O. 1996. Paper Presented at the Wildlife Conservation Workshop, Arusha 11-15March 1996. Ministry <strong>of</strong> Natural Resources and Tourism, Wildlife Division, Dar esSalaam.Lamprey, R. 1995. The management <strong>of</strong> sport hunting in Tanzania. SWARA East AfricanWildlife Society Volume 18 No 2.Mantheakis, M.D. & Oel<strong>of</strong>se, I. 2003. Optimisation Proposal, Proposal to revisit thehunting permit system with the aim <strong>of</strong> increasing tourist hunting revenue byadopting a “retail” rather than the present “wholesale” approach. Unpublished146
eport: Miombo Safaris in cooperation with Wengert Windrose Safaris. Dar esSalaam.Pasanisi, G. 2001. Problems Facing the <strong>Hunting</strong> Industry on Taxation. Letter from theTanzanian <strong>Hunting</strong> Operators Association to the Minister <strong>of</strong> Finance.PAWM 1995. Revised Policy and Management Plan for Tourist <strong>Hunting</strong>. Ministry <strong>of</strong>Natural Resources and Tourism, Wildlife Division, Dar es Salaam.PAWM 1995. The Management <strong>of</strong> Sport <strong>Hunting</strong> in Tanzania. Ministry <strong>of</strong> NaturalResources and Tourism, Wildlife Division, Dar es Salaam. Unpublished Report.PAWM. 1995. Tourist <strong>Hunting</strong> in Tanzania. Proceedings <strong>of</strong> a Workshop held in July1993. Edited by N. Leader-Williams, J.A. Kayera and G.L. Overton. Planning andAssessment for Wildlife Management, AWF and WWF, Dar es Salaam.Rohwer, R.D. 1998. Letter to the Chief Warden <strong>of</strong> the <strong>Selous</strong> Game Reserve. 31October 1998. Rolf Rohwer Safaris LTD. P.O. Box 13487 Dar es Salaam.Siege, L., Baldus, R.D. 2000. From Decline to Recovery, the Elephants <strong>of</strong> the <strong>Selous</strong>.Tanzania Wildlife Discussion Paper Nr. 27.Stronach, N., Siege, L. (ed.) 1995. The Elephants <strong>of</strong> the <strong>Selous</strong> Game Reserve and theirManagement. SCP Discussion Paper Nr. 19.TAHOA. 1999. Minutes <strong>of</strong> Address to the Ministry <strong>of</strong> natural Resources & Tourism’sAnnual <strong>Hunting</strong> Meeting 2 June 1999.TRAFFIC 2001. Sport <strong>Hunting</strong> in the SADC Region Workshop. Workshop held between10-12 October 2001 in Harare, Zimbabwe. TRAFFIC East/Southern Africa sporthunting project under the USAID funded Networking and Capacity BuildingProgramme (NETCAB) – Unpublished reportULG 2001 Economic <strong>Analysis</strong> <strong>of</strong> Commercial Consumptive Use <strong>of</strong> Wildlife in Botswana.Final Report for the Botswana Wildlife Management Association, Maun.Vice Presdent’s Office 2004. Public Expenditure Review <strong>of</strong> Environment, Financial Year2004. Final Report. May 2004. The United Republic <strong>of</strong> Tanzania. The VicePresident’s Office.Whitman Karyl, Starfield, M., Quadling, S. & Packer C. 2004. Sustainable trophy hunting<strong>of</strong> African lions. Nature. Volume 428. 11 March 2004. www.nature.co./nature.Wildlife Division 1998. The Wildlife Policy <strong>of</strong> Tanzania. Ministry <strong>of</strong> Natural Resources andTourism, Wildlife Division, Dar es Salaam.Wildlife Division 2002. Safari <strong>Hunting</strong> in Tanzania. Promotional Brochure, Ministry <strong>of</strong>Natural Resources and Tourism, Wildlife Division, Dar es Salaam.Wildlife Division. 2003 Reference manual for implementing guidelines for thedesignation and management <strong>of</strong> <strong>wildlife</strong> management (WMAs) in Tanzania.Ministry <strong>of</strong> Natural Resources and Tourism, Dar es Salaam.WWF 2000 <strong>Analysis</strong> <strong>of</strong> Wildlife Markets (Sport <strong>Hunting</strong> and Tourism). WWF Programme Office, Harare,Zimbabwe. In Prep.147
INDEXAccident ............................................................................. 34Accounting ........................................................... 17, 19, 109Adaptive management ...............................25, 41, 67, 88, 89Adventure tourism.............................................................. 43Aerial census ...............................................24-25, 42, 62, 88Affirmative action.............................................................. 21Aircraft ............................................................................... 35Allocation <strong>of</strong> concessions6, 11-12, 22-23, 32, 36, 38, 39, 77,79, 80, 84-93, 98, 122<strong>Analysis</strong>10-11, 17, 20-25, 38, 41-42, 53, 58, 64, 74, 106-144Antelope ................ 13, 27, 40, 49, 56, 57, 83, 100, 102, 108Anti-poaching5, 10, 22, 25, 30, 31, 35, 39, 42, 48, 61-65, 90,94, 95Approved areas (Certification) .......................................... 63Audit......................................... 10, 39, 46, 53, 65, 86-87, 93Authorised Association.................... 7, 78, 84, 87, 90-92, 95Baboon ......................................................30, 48, 56-57, 100Baiting ........................................ 46, 65, 82-83, 96, 103, 140Bank account...........................................................39, 91-92Benefit sharing ...............................................4, 5, 32, 80, 85Bids....................................................................45, 86-88, 93Big game .................7-8, 11, 17, 34, 40, 46, 56, 80, 100-102Biharamulo Game Reserve ............................10, 11, 52, 147Biodiversity.................................................................... 4, 67Block fee ..... 9, 12, 18-19, 39, 77, 80, 85-88, 93, 94-95, 118Bombing..................................................................... 19, 116Botswana ...................................................17, 18, 28-29, 148Boundary..................5, 63, 65, 80, 84, 90, 96, 109, 124, 143Bow and arrow ........................................................... 83, 102Bow hunting....................................................................... 83Breakdown <strong>of</strong> In<strong>com</strong>e........................................................ 18Broomhead .........................................10, 15, 25, 41, 53, 147Buffalo7, 13, 23-24, 26-28, 30, 35, 40, 48, 55-57, 66, 83, 89,100-105, 125-127, 143Buffer zones ................................................................. 31, 43Burigi Game Reserve......................................10-11, 51, 147Burning............................................................................... 96Burundi............................................................................... 11Bushbuck.......................... 13, 48, 50, 56, 100-101, 125, 126Bushmeat...................................................................... 27, 36Bushpig................................13, 30, 48, 56-57, 100, 125-126Caracal.............................................. 48, 56-57, 81, 100, 102Certification 6, 34, 42, 44, 45, 46, 47, 59, 61, 62, 63, 64, 66,147Cheetah............................................................................... 81CITES..6-7, 13, 24-28, 35-36, 47, 69-74, 78-79, 91, 98, 147Civet ...............................................................48, 56, 57, 100Classic 21-day safaris .......................................... 40, 89, 139Client ..7, 12-16, 21-23, 40, 41, 58, 68, 92, 95, 98, 108, 109,125, 139, 143, 144Closed season..................................................................... 82Code <strong>of</strong> conduct ................................8, 77, 80, 85-86, 95, 96Colobus................................................................. 50, 81, 100Community conservation...........................31, 80, 83, 85, 90Compensation..................................................................... 30Competition..................................................6, 19, 22, 33, 38Computer...................................................................... 10, 25Computerisation............................. 5, 10-11, 25, 37, 41, 108Concession 9-10, 24, 39, 77-79, 84-85, 90-96, 109-115, 122Concession size .................................................................. 20Conditions <strong>of</strong> a permit ....................................................... 12Conservation fee .................... 12, 16, 18, 55-58, 92, 93, 108Consumptive use.............................................. 4, 69, 72, 110Control mechanisms........................................................... 34Corridor.........................................................................10, 31Corruption..................................................... 9, 18, 32, 34-35Crocodile....13, 30, 48, 50, 56, 58, 81, 83, 91, 100-102, 108,125-126, 130CITES restrictions.............................................13Crop-raiding..................................................................29, 30Crossbow ............................................................................83Daily fees................................... 7, 17, 19, 20, 29, 41, 54, 58Dangerous game ........................................ 30, 40, 47, 66, 97<strong>Data</strong>base.................10-11, 34, 41, 53-54, 108-109, 113, 131Dik Dik .................................................................13, 48, 100Director <strong>of</strong> Wildlife ....... 6, 10, 12, 22, 38, 78, 80, 83, 91, 98District council ...................... 10, 32, 39, 64, 90, 94, 95, 112Donors...........................................................................43, 44Dove............................................................................49, 100Drawbacks and challenges to certification.........................44Duck............................................................................49, 100Duiker .............................................. 13, 48, 56, 57, 100, 125Duration <strong>of</strong> lease.................................................................22Ecology..............................................6, 24, 61-62, 66-68, 71Ecosystem...................................6, 11, 24, 45, 61, 63, 69-70Eco-tourism ..........................................................................8Eland ................................. 13, 48, 50, 56, 100-101, 125-126Elephant6-9, 13, 23-35, 40-41, 48, 50, 55-58, 62, 66, 79, 81,98-105, 110, 125-131, 134, 147-148CITES restrictions.............................................13<strong>Hunting</strong> proposals9, 24, 28-29, 30, 32, 57, 110, 131<strong>Hunting</strong> regulations.....................................23, 29Problem animal control...............................29, 30Empowerment............................................... 5, 32-33, 46, 65Endangered species ................................ 7, 47, 69, 72, 78-79Endemic species .................................................................29Environmental standards ....................................................35Ethics ......................................... 6, 35, 45, 63, 66, 68, 83, 95Europe.........................................................................67, 138European Union...................................................... 69, 71-73Exam ................................................................. 34, 40, 94-97Exclusive outfitter ..............................................................21Export ...................... 12-13, 24-26, 35-36, 39, 71, 78, 95, 98Fees payable for tourist hunting.........................................12Fishing ........................................... 19, 43, 52, 132, 134, 144Flexible approach towards marketing ................................40Foreigner.........................................................................5, 21Forest .........9-10, 14, 43, 44, 51, 52, 77-78, 84-87, 100, 110Fourth Schedule................................................ 81-82, 92, 97Francolin.....................................................................49, 100Full pr<strong>of</strong>essional hunter.............................. 40, 46, 66, 96-98Galago.........................................................................50, 100Game Controlled Area7-11, 14, 31, 33, 39, 51-52, 77-80, 84,89-95Game ranching..............................................................17, 61Game Reserve.....................................................................31Game scout ......................................8, 12, 34-35, 91-92, 108Gazelle .............................................48, 56-57, 100-101, 137Genet....................................................... 50, 56, 57, 100-102Gerenuk............. 13, 29, 48, 50, 56-57, 79, 89, 100-101, 105German hunting associations .............................................67Giant Forest Hog ..................................................50, 81, 102Giraffe...................................................................50, 82, 100Goose ..........................................................................49, 100Government Gazette.....................................................82, 93Ground census ....................................................................88Grysbok.......................................................................48, 100GTZ.................................................4, 9-11, 25, 31, 108, 147148
Guineafowl................................................................. 49, 100Hare .................................................................... 50, 100, 102Hartebeest........................... 13, 28, 35, 48, 56, 100, 125-126Hedgehog ............................................................. 50, 81, 100Hesitation ....................................................................... 5, 33Hesitation <strong>of</strong> hunting outfitters.......................................... 33Hides............................................................................. 65, 83Hippo.......................... 13, 27, 30, 48, 56, 100-103, 125, 126Holding <strong>of</strong> concessions...................................................... 22Honey badger ..................................................48, 56-57, 100Human pressure.................................................................. 43<strong>Hunting</strong> camp........................................ 10, 34-36, 45, 63-66<strong>Hunting</strong> day...............15-16, 21, 40, 48, 54, 58, 89, 139-142<strong>Hunting</strong> intensity.................................20, 122-124, 128, 143<strong>Hunting</strong> <strong>of</strong> elephant............................................................ 23<strong>Hunting</strong> regulations................... 8, 11, 35, 81-84, 92-93, 103Hurt and Ravn .............................................................. 15, 16Hyaena...................................................13, 48, 100, 125-126Hyrax............................................................50, 83, 100, 102Ibanda Game Reserve .......................................... 11, 52, 147Immature game .................................................... 50, 81, 101Immigration.................................................................. 95, 97Impacts <strong>of</strong> hunting ............................................................. 26Impala..................... 13, 28, 46-50, 56-57, 100-101, 125-126Inadequate control.............................................................. 34In<strong>com</strong>e generation per concession..................................... 20In-service training ............................................ 40, 46, 66, 97Insurance ............................................................................ 19Interest..........................................................5, 19, 69, 83, 84Investment .........................................................21-22, 38, 80Inyonga GCA ..................................................... 9, 14, 51, 52Ivory ......................................................................... 9, 24, 28Jackal...............................................................48, 56-57, 100Kagera Region............................................................ 11, 147Katavi National Park.......................................................... 10Kenya ........................................................................... 18, 67Key species............................8, 23-24, 26-27, 40, 42, 64, 89Kilimanjaro .............................................................. 9, 25, 51Kimisi Game Reserve ........................................................ 10Klipspringer..............................................27, 48, 56, 57, 100Kudu29, 48, 50, 55-56, 79, 89, 100-101, 105, 125-126Labour .......................................................................... 32, 91Law..................................................................... 7, 34, 72, 96Learner pr<strong>of</strong>essional hunter ................................... 40, 46, 97Lease5-8, 11-18, 20-23, 29, 33, 36, 39, 42-45, 51, 77, 80, 86-92, 109, 115, 118, 122, 131, 143Lease duration ......................................11, 22, 38, 45, 85, 91Legislation...............12, 31, 45, 63-64, 66, 80, 82-83, 91, 93Length <strong>of</strong> safari ............................ 13, 40, 56-58, 89, 93, 105Leopard6-7, 13, 23-28, 30, 35, 40-41, 48, 55-58, 66, 89, 91,100-105, 125-129, 147CITES restrictions ............................................ 13Minimum requirements .................................... 26Lion7-8, 13, 18, 23-28, 30, 35, 40-41, 48, 50, 55-58, 66, 89,100-105, 125-128, 140, 147, 148Age determination ............................................ 26CITES restrictions ............................................ 13Man-eating........................................................ 30Quota settings ................................................... 26Lion quota and hunting ...................................................... 26Liparamba Game Reserve.................................................. 10Local <strong>com</strong>munity4-9, 31, 39, 43-47, 64, 69-70, 77-80, 84, 88-96Management Plan6, 10-11, 20, 25, 32, 37-39, 40, 45, 47, 61-63, 69-70, 75, 77-79, 98, 147-148Man-eating lions ........................................................ 30, 140Marine ................................................................................ 10Market value................ 4-6, 19, 22-23, 33, 36, 39, 45-47, 93Marketing strategy..........13, 19, 20, 25, 40-41, 47, 105, 138Masailand................................14, 33, 51, 132-134, 143, 144Mass tourism.......................................................................44Migration ............................................................................31Minimum trophy size .........................................................28Minimum use..12-15, 18, 23-27, 36, 42, 54, 87-88, 93, 115-116, 131, 134Minister................. 12, 22, 27, 37-39, 78, 81-84, 93, 99, 148Mkomazi Game Reserve ....................................................25Mongoose .............................................................50, 81, 100Monitoring ......6, 11, 24-25, 31, 41-42, 62-65, 69, 87-88, 98Monkey.................................................... 30, 48, 50, 81, 100Moyowosi Game Reserve ...................................... 11, 51-52Msanjesi Game Reserve ...............................................10, 51MWEKA.............................................................................46National game......................................... 48, 50, 81, 100-101National park ..........................7, 9-10, 24, 31, 70, 80, 84, 94Nationality ..........................................................41, 108, 138Negotiation ...................................................................32, 33Ngorongoro Conservation Area .7, 9-10, 24, 80, 84, 94, 103Nicholson.............................................................. 9, 109-110Nose colour.........................................................................26Observer fee.... 12, 34, 36, 39, 41, 92-93, 117-118, 143-144Open Area 7, 11-14, 22, 25, 31, 39, 51-52, 77-78, 84, 89-95,110, 126Optimisation Proposal 21, 28, 38, 40, 55, 58, 77-78, 89, 93,95, 147Oribi..................................................13, 48, 56-57, 100, 126Oryx ........................................... 13, 49, 56, 79, 89, 100, 105Ostrich.............................................. 49, 56, 57, 81, 100, 102Outfitter marketing strategies.............................................20Overshooting ......................................................................34Overview <strong>of</strong> total in<strong>com</strong>e...................................................15PAWM..................... 10, 15, 25, 37, 38, 40, 41, 53, 108, 148Payment schedule ...............................................................19Photographic tourism 11, 16, 19, 33, 43-44, 52, 109, 113-115,124, 132, 134, 141-143Photography........................................................................35Pilot area .............................................................................32Plains game..................................... 7, 13, 17, 56-57, 83, 105Poaching ...........................................9, 17, 24, 27, 55, 70-71Poison .........................................................................82, 103Police ..............................................................................9, 83Porcupine ........................................................ 49, 56-57, 100Predator.................................................... 46, 61, 65, 70, 108Pregnant game ............................................. 50, 81, 101, 103Pricing structure............................................................24, 27Primary game.............................................. 40, 41, 56-57, 58Priority species for in<strong>com</strong>e generation...............................23Private sector ....................................... 6, 7, 9, 15, 17, 31, 79Problem animal control .......................................... 29-30, 98Pr<strong>of</strong>essional hunter 6-8, 11-12, 21, 25-30, 34-35, 40-46, 66,68, 77, 79-80, 85, 87, 94-98, 108, 117, 131, 135-137Competence...........................................26, 34, 97License 8, 12, 27, 34-36, 39, 40, 46, 55, 80-81, 83-84, 91,94-98, 103, 131School................................................................46Pr<strong>of</strong>essional hunters not pr<strong>of</strong>essional ................................34Protected area .10, 31, 43, 44, 47, 61, 71, 77-78, 80, 94, 103Protected game .............................................................50, 78Public Expenditure Review..........................................4, 148Public tender....................................39, 77, 79, 85-88, 90-94Puku ............................................13, 49, 50, 56-58, 100, 101Python...................................................................50, 81, 100Quota .5-13, 18, 20-36, 39-46, 55-58, 62, 64, 67, 77, 80-85,87-95, 108-109, 115-117, 122-126, 131, 134, 147149
Rainy season......................................................... 30, 82, 140Reedbuck...................... 13, 49-50, 56-57, 100-101, 125-126Reform.................................................................6, 37-39, 47Refugee............................................................................... 11Reliability <strong>of</strong> in<strong>com</strong>e.......................................................... 18Residence status ............................................................. 5, 13Resident hunting ................................................................ 13Responsibility........ 12, 31, 34, 39, 42, 68, 70, 79, 86, 90-95Retention <strong>of</strong> funds.................... 10, 39, 78, 94, 112-113, 117Rhino ........................................................8, 50, 81, 100, 101Rifle calibre......................................12, 34, 48, 66, 102, 141Rights <strong>of</strong> access..........................................44, 80, 85, 92, 93Risk.............................................................5, 19, 20, 33, 116Roan antelope................13, 27, 49-50, 56, 89, 100-101, 105Rukwa Game Reserve.......................................10, 14, 51-52Rumanyika Game Reserve................................... 11, 52, 147Rwanda............................................................................... 11Saadani Game Reserve ............................................ 4, 10, 25Sable antelope . 13, 27-29, 49-50, 56, 89, 100-105, 125-126Safari .. 7-15, 19, 34, 40, 48, 52-57, 67, 79, 88-92, 105-109,132-134, 139-141, 144, 147-148Sale <strong>of</strong> quota....................................................................... 25School <strong>of</strong> pr<strong>of</strong>essional hunting .............................. 46, 66, 92Second Schedule ................................................................ 84Select group.............................................................. 5, 19, 33<strong>Selous</strong> Game Reserve ......... 4, 9-37, 41-42, 51-58, 106-148Serengeti National Park ............................................... 8, 128Serval.......................................................49, 56-57, 100, 102Setgun......................................................................... 82, 103Shotgun..........................................................48-49, 102, 141Sitatunga........................13, 29, 49-50, 56, 89, 100-103, 105Skull length ...............................................................127-129S<strong>of</strong>tware ....................................................................... 10, 41South Africa .............................................17, 34, 46, 70, 138Southern Africa .................................................... 16, 18, 148Splitting concessions............................................ 10, 25, 109Steinbok...........................................................49, 56-57, 100Subleasing ...........................................5, 6, 16, 20-23, 36, 54Suni..................................................................49, 56-57, 100Supervision......................................... 5, 9, 13, 34, 39, 91-92Sustainability.........................................4, 19, 25-26, 79, 123TANAPA.............................................................................. 9Tanganyika............................................ 8-9, 22, 52, 133-134Tanzania Hunters Association .... 15, 37, 46, 53, 97-98, 148Tanzania Revenue Authority ............................................. 21Tanzania Wildlife Corporation . 9, 38, 52, 78, 82, 132, 133-134, 144Tanzanian Wildlife Protection Fund...............10, 94-95, 112Taxation ................... 5, 7, 16, 21, 28, 36, 55, 65, 92, 94, 148The act .... 13, 21, 32, 34, 41, 80, 87-88, 117, 122, 125, 142Third Schedule................................................81, 82, 84, 103Threatened species........................................................39, 91Tip-to-tip (buffalo) ...........................................................127Topi..................................................... 13, 35, 49, 56-57, 100Tourist Agency Licence .....................................................97Tourist demand............................................. 17-19, 113, 116Trainee ..........................................................................40, 97Training.........................................6, 8, 10, 40, 45, 65, 97-98Transparency ....................................5, 10, 12, 22, 37-38, 79Treasury ................................................ 4, 39, 82, 93-94, 112Trophy fees7-29, 36, 39-41, 47-48, 50, 54-58, 62, 82, 87-95,100, 108, 116-118, 123, 125Trophy quality ..11, 25-26, 42, 46, 61-66, 77, 80-81, 84, 88,103, 127-130Trophy size .....................................26, 28, 50, 79, 87-89, 98Trophy-handling fee ........................... 12, 29, 55, 92-93, 118Tuskers..............................................................................108Uganda................................................................................18Under-sized trophies.....................................................28, 35United States.............................................................116, 138USAID ................................................... 10, 25, 38, 108, 148Value <strong>of</strong> concessions ....................................................21, 23Vernon Booth .......................................................................4Vice President’s Office ............................................4, 6, 148Video...................................................................................35Village scouts .....................................................................88Wandering pr<strong>of</strong>essional hunter ....................................21, 41Warthog ....................... 13, 28, 49, 56-57, 100-102, 125-126Waterbuck.................... 13, 28, 49, 50-56, 100-103, 125-126Wetland.........................................................................10, 43Wild cat........................................................... 49, 56-57, 100Wild dog .....................................................................50, 100Wildebeest .................... 13, 23, 28, 49, 56-57, 100, 125-126Wildlife Conservation Act ........................80-87, 96-97, 103Wildlife density ..................................................................20Wildlife Management Area. 4-10, 14, 17, 31-36, 39, 43, 47,78, 84-94, 148Wildlife Policy...................................... 5, 31-32, 44, 47, 148Wildlife population ........... 6-13, 24-36, 42-45, 77, 110, 118Wise-use .............................................................................78WMA regulations ...............................................................32Wounded animals12, 34-35, 68, 81, 83, 92-96, 103, 143-144Zambia ................................................................................28Zanzibar ..............................................................................36Zebra ....................... 13, 23, 28, 35, 49, 56-57, 100, 125-126Zimbabwe ............................................17-18, 28-29, 70, 148150
151