Synthesis and characterization of nanocrystalline hydroxyapatite ...
Synthesis and characterization of nanocrystalline hydroxyapatite ...
Synthesis and characterization of nanocrystalline hydroxyapatite ...
- No tags were found...

You also want an ePaper? Increase the reach of your titles
YUMPU automatically turns print PDFs into web optimized ePapers that Google loves.
Materials Science-Pol<strong>and</strong>, Vol. 28, No. 1, 2010<strong>Synthesis</strong> <strong>and</strong> <strong>characterization</strong> <strong>of</strong> <strong>nanocrystalline</strong><strong>hydroxyapatite</strong> obtained by the wet chemical techniqueH. ESLAMI, M. SOLATI-HASHJIN, M. TAHRIRI * , F. BAKHSHIAmirkabir University <strong>of</strong> Technology, Faculty <strong>of</strong> Biomedical Engineering,Biomaterial Group, P.O. Box: 15875-4413, Tehran, IranHydroxyapatite was synthesized by the wet chemical technique. Diammonium hydrogen phosphate<strong>and</strong> calcium nitrate 4-hydrate were used as starting materials <strong>and</strong> sodium hydroxide solution was used asthe agent for pH adjustment. The powder sample was characterized by the commonly used bulk techniques<strong>of</strong> scanning electron microscopy (SEM), transmission electron microscopy, Fourier transforminfra-red spectroscopy, differential thermal analysis, thermal gravimetric analysis, X-ray diffraction,atomic absorption spectroscopy <strong>and</strong> EDTA titration analyses. With respect to the results achieved fromthe above analyses, it was found that <strong>nanocrystalline</strong> <strong>hydroxyapatite</strong> can successfully be producedthrough the wet precipitation method. The bulk Ca/P molar ratio <strong>of</strong> synthesized <strong>hydroxyapatite</strong> was determinedas 1.71, which was higher than the stoichiometric ratio (1.667) that is expected for a pure HAphase. SEM investigations revealed that, there is a distribution <strong>of</strong> small particles <strong>and</strong> large agglomeratesconsisting <strong>of</strong> fine particles cold welded together. Lastly, the TEM technique demonstrated that the crystallites<strong>of</strong> the prepared powder were nanosized <strong>and</strong> had a needle-like morphology. The aspect ratio <strong>of</strong> thecrystallites was about 8.Keywords: <strong>hydroxyapatite</strong>; precipitation; <strong>nanocrystalline</strong> material; synthesis1. IntroductionIn recent years, significant effort has been devoted to developing inorganicnanocrystals because <strong>of</strong> their potential applications in biology, electronics, optics,transport <strong>and</strong> information technology. Although there have been some investigationsinto ways <strong>of</strong> fabricating such nanocrystals, ways now need to be found <strong>of</strong> controllingtheir size, shape <strong>and</strong> crystallinity. This requires the identification <strong>of</strong> the various parametersinfluencing these features [1]._________* Corresponding author, e-mail: m-tahriri@aut.ac.ir
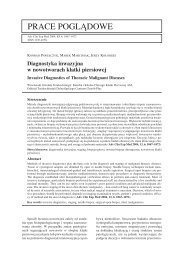
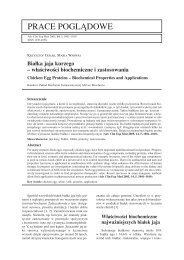
6H. ESLAMI et al.Synthetic ceramic materials based on calcium phosphates (CaP), particularly thosein the composition <strong>of</strong> tricalcium phosphate (TCP, Ca 3 (PO 4 ) 2 ) <strong>and</strong> <strong>hydroxyapatite</strong> (HA,Ca 10 (PO 4 ) 6 (OH) 2 ), have been extensively studied <strong>and</strong> clinically used. These ceramicshave been the focus <strong>of</strong> over three decades <strong>of</strong> biomaterials research in orthopedics <strong>and</strong>dentistry [2–7]. They are considered to be suitable biomaterials due to their biologicalaffinity <strong>and</strong> activity to surrounding host tissues, when implanted [5]. Furthermore,according to the literature, calcium phosphates are widely used in medicine <strong>and</strong> oralbiology, due to the apatite-like structure <strong>of</strong> enamel, dentin <strong>and</strong> bones, usually called“hard tissues”. To date, in spite <strong>of</strong> the availability <strong>of</strong> several sophisticated <strong>characterization</strong>techniques for the investigation <strong>of</strong> tooth <strong>and</strong> bone tissues, their exact composition,phase distribution <strong>and</strong> structure remain unresolved [3]. The aim <strong>of</strong> the preparation<strong>of</strong> synthetic CaP is to underst<strong>and</strong> the properties <strong>and</strong> physicochemical behaviour <strong>of</strong>biological mineral phases found in human hard tissues because they share many similarities[4]. In addition, these materials are also important in the study <strong>of</strong> biomineralization,since they are precursors <strong>and</strong> are the major components <strong>of</strong> bone <strong>and</strong> teeth [8].In order to gain insights into the complex structure found in biological mineral phases,it would be necessary to establish a well-defined system for the <strong>characterization</strong> <strong>of</strong> thesynthetic CaP, in which the composition, crystallinity <strong>and</strong> nanostructure would have tobe properly addressed. These properties play a major role in the bioactivity <strong>of</strong> CaPbased materials in terms <strong>of</strong> enhanced contact areas <strong>and</strong> degradation [5]. Detailed <strong>characterization</strong>indicates that an apatite layer is usually formed on the ceramic surfacewhen implanted. This layer consists <strong>of</strong> a carbonate-ion-containing apatite, named“bone-like” apatite, forming a bond with the human bone [2]. These ceramic materialscan also be used as coating on implants to improve the biocompatibility [1, 8] <strong>and</strong> canbe injected in bone with non-invasive surgical techniques [9]. Bioactivity <strong>of</strong> CaP materialsis dependent on many factors during the synthesis procedure, such as precursorreagents, impurities, crystal size <strong>and</strong> morphology, concentration <strong>and</strong> mixture order <strong>of</strong>reagents, pH <strong>and</strong> temperature. Also, the bioactivity response <strong>of</strong> CaP materials willdepend on the type <strong>of</strong> thermal treatment selected for drying <strong>and</strong> sintering. These conditionsare controlled by parameters <strong>of</strong> synthesis <strong>and</strong> consequently for each applicationa specific route is selected [6, 10].In this investigation we report on the synthesis <strong>of</strong> <strong>nanocrystalline</strong> <strong>hydroxyapatite</strong>by the wet precipitation technique.2. ExperimentalMaterials <strong>and</strong> methods. The flowchart for the synthesis <strong>of</strong> the <strong>hydroxyapatite</strong> isshown in Fig. 1. 0.09 M diammonium hydrogen phosphate ((NH 4 ) 2 HPO 4 , 99%,Merck; No. 1207) <strong>and</strong> 0.15 M calcium nitrate 4-hydrate (Ca(NO 3 ) 2·4H 2 O, 98%,Merck PROLABO, No. 22 384 298) were prepared <strong>and</strong> the pH <strong>of</strong> the both solutionswas brought to about 11, by adding 1 M sodium hydroxide (NaOH, 99%, Merck,No. 5 226 926). The phosphate solution was added drop-wise into the calcium ni-
Nanocrystalline <strong>hydroxyapatite</strong> obtained by the wet chemical technique 7trate solution, resulting in the precipitation <strong>of</strong> HA according to reactions (1) <strong>and</strong> /or(2) [11].10Ca 2+ + 6HPO 4 – + 2OH – → Ca 10 (PO 4 ) 6 (OH) 2 + 6H + (1)10Ca 2+ + 6H 2 PO 4 – + 2OH – → Ca 10 (PO 4 ) 6 (OH) 2 + 12H + (2)Fig. 1. Flowchart for the synthesis <strong>of</strong> the <strong>hydroxyapatite</strong> powderThe precipitate was aged for 22 h at room temperature. In the next step, the precipitatedHA was centrifuged <strong>and</strong> then washed with de-ionized water. The processes<strong>of</strong> centrifuging <strong>and</strong> washing were carried out three times. The resulting powder wasdried in a freeze-drier system (Alpha 1-2 LD, Germany) for 10 h. Lastly, dried powderwas calcined in an electrical box furnace at 900 °C for 1 h at the rate <strong>of</strong> 5 °C/minin air.Powder <strong>characterization</strong>. The powder sample was subjected to Fourier Transforminfra-red analysis with a Bomem MB 100 spectrometer. For IR analysis, at first 1 mg
8H. ESLAMI et al.<strong>of</strong> the powder sample was carefully mixed with 300 mg <strong>of</strong> KBr (infrared grade) <strong>and</strong>palletized under vacuum. The pellets were analyzed in the range <strong>of</strong> 500 to 4000 cm –1at the scan speed <strong>of</strong> 23 scan/min at the resolution <strong>of</strong> 4 cm –1 .The resulting powder was analyzed by the X-ray diffraction (XRD) with a Siemens-BruckerD5000 diffractometer. This instrument works with voltage <strong>and</strong> currentsettings <strong>of</strong> 40 kV <strong>and</strong> 40 mA, respectively, <strong>and</strong> uses CuK α radiation (1.540600 Å). Forqualitative analysis, XRD diagrams were recorded in the interval 7° ≤ 2θ ≥ 60° at thescan speed <strong>of</strong> 2 °C/min, the step size being 0.02° <strong>and</strong> the time step being 1 s.The thermal behaviour <strong>of</strong> <strong>hydroxyapatite</strong> was studied by simultaneous thermalanalysis (STA). A thermoanalyzer (Polymer Laboratories PL-STA 1640) was startedat room temperature <strong>and</strong> measurements were subsequently taken up to 1200 °C; theheating rate <strong>of</strong> 10 °C/min was used to record the conventional DTA <strong>and</strong> TGA curves.In order to calculate the Ca/P molar ratio <strong>of</strong> the precipitated powder, the contents<strong>of</strong> Ca <strong>and</strong> P were chemically analyzed by the quantitative chemical analysis via theEDTA titration technique <strong>and</strong> atomic absorption spectroscopy (AAS) with a ShimadzuUV-31005 instrument, respectively.The powder sample was coated with a thin layer <strong>of</strong> Gold (Au) by sputtering(EMITECH K450X, Engl<strong>and</strong>) <strong>and</strong> then the microstructure <strong>of</strong> the powder sample wasobserved under a scanning electron microscope (SEM, Tescan Vega 2XMU) that operatedunder the acceleration voltage <strong>of</strong> 15 kV.Transmission electron microscopy (TEM, CM200-FEG-Philips) was used forcharacterizing the particles. For this purpose, particles were deposited onto Cu grids,which support a carbon film. The particles were deposited onto the support grids bydeposition from a dilute suspension in acetone or ethanol. The particle shapes <strong>and</strong>sizes were characterized by diffraction (amplitude) contrast <strong>and</strong>, for the crystallinematerials, by high resolution (phase contrast) imaging.3. Results <strong>and</strong> discussion3.1. FTIR analysisFigure 2 shows the FT-IR spectrum <strong>of</strong> HA powders. Characteristic b<strong>and</strong>s (listed inTable 1) exhibited in the sample spectrum are as follows: Two b<strong>and</strong>s were observed at3555 cm –1 <strong>and</strong> 622 cm –1 <strong>and</strong> were due to the stretching mode <strong>of</strong> hydrogen-bondedOH – ions <strong>and</strong> liberational mode <strong>of</strong> hydrogen-bonded OH – ions, respectively. The b<strong>and</strong>at 1040 cm –1 has been attributed to ν 3 PO 4 , the b<strong>and</strong>s at 603 cm –1 <strong>and</strong> 561 cm –1 toν 4 PO 4 . The FTIR analysis showed all typical absorption b<strong>and</strong>s <strong>of</strong> <strong>hydroxyapatite</strong>. In2addition, some carbonate content also was seen ( CO − 3peak around 1600 cm –1 ), whichis an indication <strong>of</strong> the presence <strong>of</strong> carbonate apatite. This might originate from absorption<strong>of</strong> carbon dioxide from the atmosphere [12, 14]. Therefore according to this reasoning,it is obvious that the synthesized powder is certainly <strong>hydroxyapatite</strong>.
Nanocrystalline <strong>hydroxyapatite</strong> obtained by the wet chemical technique 9Fig. 2. FT-IR spectrum <strong>of</strong> the synthesized <strong>hydroxyapatite</strong>Table 1. Infrared frequenciesfor the synthesized <strong>hydroxyapatite</strong> powderFrequency [cm –1 ]56162210403555AssignmentPO 4 bending ν 4OH structuralPO 4 bending ν 3OH structural3.2. XRD analysisThe XRD analysis was performed using the X-ray diffractometer. The straightbase line <strong>and</strong> sharp peaks <strong>of</strong> the diffractogram in Fig. 3 confirmed that the product waswell crystallized. The XRD pattern indicated that <strong>hydroxyapatite</strong> was formed in thissample <strong>and</strong> traces <strong>of</strong> other calcium phosphate impurities were not detected by thistechnique. This can also be seen in this figure, secondary CaO phase was observed.Fig. 3. XRD pattern <strong>of</strong> the synthesized <strong>hydroxyapatite</strong>The intensity <strong>of</strong> the (200) CaO peaks on the XRD pattern <strong>of</strong> HA powder was usedas a direct indicator <strong>of</strong> its purity as in the research <strong>of</strong> Afshar et al. [10]. The ratio <strong>of</strong>
10H. ESLAMI et al.the peak intensities in the XRD pattern <strong>of</strong> CaO/HA (I (200) CaO/I (002) HA) was calculated.The amounts <strong>of</strong> (I (200) CaO/I (002) HA) in the sample was about 0.08. The CaOpresence, however, does not necessarily mean that HA has lower biocompatibility[15]. The control <strong>of</strong> parameters <strong>of</strong> the synthesis is the key to developing HA purityas well as to indentifying other phases in bioceramics [15].3.3. Thermal analysisExemplary DTA <strong>and</strong> TGA curves for the <strong>hydroxyapatite</strong> powder are shown in Fig. 4.The first endothermic region ranges from 90 to 295 °C with a peak at about 250 °C,which corresponds to the dehydration <strong>of</strong> the precipitating complex <strong>and</strong> loss <strong>of</strong> physicallyadsorbed water molecules <strong>of</strong> the <strong>hydroxyapatite</strong> powder. The weight loss in thisregion is 16%. With increase in temperature from 295 to 1200 °C, no peak was observed,except that a weight loss <strong>of</strong> 6% is observed in the TGA curve in the temperaturerange which is assumed to be the result <strong>of</strong> gradual dehydroxylation <strong>of</strong> <strong>hydroxyapatite</strong>powder. This can be explained by the following reaction [13]:Ca 10 (PO 4 ) 6 (OH) 2 → Ca 10 (PO 4 ) 6 (OH) 2−2x O x +xH 2 O (3)Fig. 4. DTA (a) <strong>and</strong> TGA (b) traces <strong>of</strong> the <strong>hydroxyapatite</strong> powder
Nanocrystalline <strong>hydroxyapatite</strong> obtained by the wet chemical technique 113.4. Elemental analysisThe results <strong>of</strong> measurement for the elemental composition (Ca <strong>and</strong> P content) <strong>and</strong>Ca/P molar ratio are given in Table 2.Table 2. Ca <strong>and</strong> P content in the synthesized<strong>hydroxyapatite</strong> powder <strong>and</strong> Ca/P molar ratioElement Measured content [wt%] Ca/P molar ratioCa 38.63 1.71The bulk Ca/P molar ratio was determined as 1.71. The measured Ca/P ratio forthis synthesized powder was higher than the stoichiometric ratio (1.667) expected fora pure HA phase that can arise from the local presence <strong>of</strong> carbonate apatite in whichthe Ca/P molar ratio can be as high as 3.33 [14] or from the presence <strong>of</strong> impuritiessuch as CaO. According to the XRD pattern that showed the existence <strong>of</strong> smallamounts <strong>of</strong> CaO phase, the second case is much more probable.3.5. SEM observationsThe microstructure <strong>of</strong> the powder prepared by the present process was analyzedusing SEM. SEM micrographs <strong>of</strong> synthesized powder under two magnifications areshown in Fig. 5.Fig. 5. SEM <strong>of</strong> the synthesized <strong>hydroxyapatite</strong> powder:magnification 3000× (left) <strong>and</strong> 5000× (right)As can be seen from the morphologies <strong>of</strong> particles, there is a distribution <strong>of</strong> smallparticles <strong>and</strong> large agglomerates. These agglomerates consist <strong>of</strong> fine particles that arecold welded together.
12H. ESLAMI et al.3.6. TEM observationsTEM was used to examine the <strong>hydroxyapatite</strong> crystallites. TEM micrographs <strong>of</strong>the <strong>hydroxyapatite</strong> powder under two magnifications are shown in Fig. 6. The microstructure<strong>of</strong> the <strong>hydroxyapatite</strong> crystallites was observed to be almost like a needle,with the mean crystallite size <strong>of</strong> 60 nm. The aspect ratio <strong>of</strong> needle-like <strong>hydroxyapatite</strong>was measured to be about 8.Fig. 6. TEM micrographs <strong>of</strong> the synthesized <strong>hydroxyapatite</strong> powdermagnification 3500× (left) <strong>and</strong> 100 000× (right)4. ConclusionsHydroxyapatite was synthesized by the wet precipitation method. The <strong>hydroxyapatite</strong>powder was characterized at a macroscopic level by XRD, FTIR, DTA, TGA<strong>and</strong> chemical analysis (AAS <strong>and</strong> EDTA titration technique), while SEM <strong>and</strong> TEMprovided detailed information at the microscopic (individual grain) level. The XRDanalysis showed that the prepared <strong>hydroxyapatite</strong> sample was nearly a pure <strong>hydroxyapatite</strong>.Only low levels <strong>of</strong> specific impurities (such as CaO) were detected. FTIR investigationsalso showed all typical absorption characteristics <strong>of</strong> <strong>hydroxyapatite</strong>. Thethermal behaviour <strong>of</strong> <strong>hydroxyapatite</strong> was studied by simultaneous thermal analysis(STA) which confirmed that the obtained powder was <strong>hydroxyapatite</strong>. Chemicalanalyses (for example AAS <strong>and</strong> EDTA titration) were used for the determination <strong>of</strong>Ca/P molar ratio. The bulk Ca/P molar ratio was determined as 1.71, which showedthat the measured Ca/P ratio for the synthesized powder was higher than thestoichiometric ratio (1.667) expected for a pure HA phase. SEM revealed that there isa distribution <strong>of</strong> small particles <strong>and</strong> large agglomerates, <strong>and</strong> these agglomerates consist<strong>of</strong> fine particles that are cold welded together. Finally, TEM analysis ascertainedthat the crystallites <strong>of</strong> prepared powder were nano-sized <strong>and</strong> needle-like, with an aspectratio <strong>of</strong> about 8.
Nanocrystalline <strong>hydroxyapatite</strong> obtained by the wet chemical technique 13References[1] BOSE S., SAHA S.K., Chem. Mater., 15 (2003), 4464.[2] JONES F.H., Surf. Sci. Rep., 42 (2001), 75.[3] KIKUCHI M., ITOH S., ICHINOSE S., SHINOMIYA K., TANAKA J., Biomater., 22 (2001), 1705.[4] SCHNETTLER R., ALT V., DINGELDEIN E., PFEFFERLE H.J., KILIAN O., MEYER C., HEISS C., WENISCH S.,Biomater., 24 (2003), 4603.[5] LIOU S.C., CHEN S.Y., LIU D.M., Biomater., 24 (2003), 3981.[6] MAVROPOULOS E., ROSSI A.M., ROCHA N.C.C., SOARES G.A., MOREIRA J.C., MOURE G.T., Mater.Charact., 50 (2003), 203.[7] LI Y., KLEIN C.P.A.T., J. Mater. Sci. Mater. Med., 5 (1994), 263.[8] CHUSSEI C.C., GOODMAN D.W., Anal. Chem., 71 (1999), 149.[9] WEISS P., OBADIA L., MAGNE D., BOURGS X., RAU C., WEITKAMP T., KHAIROUN I., BOULER J.M.,CHAPPARD D., GAUTHIER O., DACULSI G., Biomater., 24 (2003), 4591.[10] AFSHAR A., GHORBANI M., EHSANI N., SAERI M.R., SORRELL C.C., Mater. Design, 24 (2003), 197.[11] MORALES J.G., BURGUES J.T., BOIX T., FRAILE J., CLEMENTE R.R., Cryst. Res. Technol., 36 (2001), 15.[12] KOMATH M., VARMA H.K., Bull. Mater. Sci., 4 (2003), 415.[13] MURRAY M.G.S., WANG J., PONTOON C.B., MARQUIS P.M., J. Mater. Sci., 30 (1995), 3061.[14] WEI M., EVANS J.H., BOSTROM T., GRONDAHL L., J. Mater. Sci. Mater. Med., 14 (2003), 311.[15] RAMESHBABU N., KUMAR T.S.S., RAO K.P., Bull. Mater. Sci., 29 (2006), 611.Received 18 September 2007Revised 10 January 2008
Materials Science-Pol<strong>and</strong>, Vol. 28, No. 1, 2010Structure <strong>and</strong> optical properties<strong>of</strong> (Alq x )/Al 2 O 3 ethanol colloidsQ.-H. CHEN 1, 2* , W.-J. WANG 1 , W.-G. ZHANG 11 College <strong>of</strong> Chemistry <strong>and</strong> Materials Science, Fujian Normal University, Fuzhou 350007, P. R. China2 Fujian Key Laboratory <strong>of</strong> Polymer Materials, Fuzhou 350007, Fujian, P. R. ChinaAn investigation into the structure <strong>and</strong> chemical stability <strong>of</strong> green light emitting aluminum complexes<strong>of</strong> 8-hydroxyquinoline (Alq x )/Al 2 O 3 colloids was performed. (Alq x )/Al 2 O 3 ethanol colloid wascharacterized by the high resolution transmission electron microscopy (HRTEM), Fourier transforminfrared spectroscopy, thermogravimetric <strong>and</strong> simultaneous differential thermal analysis, <strong>and</strong> thermogravimetricanalysis coupled to Fourier transform infrared spectroscopy (TGA/FTIR). The results show thatthe (Alq x )/Al 2 O 3 nanoparticles are composed <strong>of</strong> an inner core <strong>of</strong> crystalline Al 2 O 3 <strong>and</strong> an outer layer <strong>of</strong>8-hydroxyquinoline (Q) coordinated to the surface aluminum ions <strong>of</strong> Al 2 O 3 the nanoparticles. The luminescenceintensity <strong>of</strong> the (Alq x )/Al 2 O 3 ethanol colloids decreased upon the increasing aging time, <strong>and</strong> isaccompanying by the presence <strong>of</strong> a brown material <strong>and</strong> a dark brown deposit produced in the colloids.The main component <strong>of</strong> the deposit was polystyrene. These findings can be explained by a process whereQ coordinates to the surface ions <strong>of</strong> the Al 2 O 3 particles, followed by degradation <strong>of</strong> the pyridine ring <strong>of</strong> 8-hydroquinonline, leading to the formation <strong>of</strong> polystyrene.Keywords: (Alq x )/Al 2 O 3 nanoparticles; ethanol colloids; pulsed laser ablation; optical properties; structure1. IntroductionAluminum complex <strong>of</strong> 8-hydroxyquinoline (Alq 3 ) is a stable metal complex thatcan be sublimed to yield a thin film <strong>and</strong> st<strong>and</strong>s as one <strong>of</strong> the most useful materialsused in organic light emitting devices for display applications [1–3] <strong>and</strong> panel displays[1, 4]. Organic-polymeric light emitting diodes (LEDs) exhibit many advantages overinorganic LEDs driven by low dc voltage, high luminous efficiency, high brightness<strong>and</strong> multicolour emission. Although much progress has been made in improving emissionefficiencies <strong>and</strong> brightness <strong>and</strong> in prolonging the lifetime <strong>of</strong> the devices, they stillsuffer from a limited lifetime due to degradation <strong>of</strong> Alq 3 molecules [5]. Degradation <strong>of</strong>luminescence materials in organic light emitting diodes (OLED) is an area <strong>of</strong> intense_________* Corresponding author, e-mail: qhchen@fjnu.edu.cn
16Q.-H. CHEN et al.scientific interest. Baldacchini et al. [6] suggested that accelerated failure <strong>of</strong> OLEDs atelevated temperatures was attributed to degradation <strong>of</strong> materials <strong>and</strong> electrode–organicinterfaces, together with morphological change (crystallization) <strong>of</strong> the organic layers. Papadimitrakopouloset al. [7–9] have recently published a chemical degradation mechanismfor Alq 3 , where the presence <strong>of</strong> moisture <strong>and</strong> oxygen was found to be detrimental to theproduction <strong>of</strong> luminescence quenching by-products. This was attributed to a condensationpolymerization <strong>of</strong> the freed Q (8-hydroxyquinoline), to form a dark, non-emissive residue,whose structure has not yet been fully determined. Determination <strong>of</strong> this unknown polymeris very important because it might contribute to detail degradation <strong>of</strong> the Alq 3 . Xu <strong>and</strong>his coworker [10] have systematically investigated the nature <strong>of</strong> the bright clusters, whichcan be classified as protrusion <strong>and</strong> grown grain, in/on the moisture-exposed Alq 3 thin film.The protrusion is most likely to be a hydrated Alq 3 species, whereas, the grown grain isattributed to a crystalline Alq 3 structure.Our laboratory has recently discovered that alumina 8-hydroxyquinoline complexes(Alq x )/Al 2 O 3 nanocolloids prepared by focused pulsed laser ablation at the solidAl 2 O 3 target <strong>and</strong> a flowing ethanol solution <strong>of</strong> Q can radiate intense green light underultraviolet radiation. The fluorescence intensity <strong>of</strong> the (Alq x )/Al 2 O 3 nanocolloids decreaseswith the increase in the aging time in the presence <strong>of</strong> oxygen <strong>and</strong> moisture[11]. Because <strong>of</strong> similar properties <strong>and</strong> the luminescence mechanism between Alq 3<strong>and</strong> the coordinated (Alq x )/Al 2 O 3 nanoparticles, studying the degradation <strong>of</strong> the coordinated(Alq x )/Al 2 O 3 nanoparticles may be helpful for underst<strong>and</strong>ing the detail degradation<strong>of</strong> the Alq 3 .In this paper, Fourier transform infrared spectroscopy (FTIR), thermogravimetric<strong>and</strong> simultaneously differential thermal analysis (TG/SDTA), thermogravimetricanalysis coupled to Fourier transform infrared spectroscopy (TGA/FTIR) <strong>and</strong> highresolution transmission electron microscopy (HRTEM) were used to study the structure<strong>and</strong> chemical stability <strong>of</strong> the (Alq x )/Al 2 O 3 nanocolloids. Increasing the aging time<strong>of</strong> colloids resulted in changes in the luminescence colour <strong>and</strong> produced a brownpolymer, accompanied by decrease in the photoluminescence intensity. The resultsshow that polystyrene is formed, <strong>and</strong> leads to fluorescence quenching when the coordinated(Alq x )/Al 2 O 3 nanocolloids have been deposited for five months.2. Experimental8-hydroxyquinoline (Q) (Sinopharm Chemical Reagent Co., Ltd, SCRC) in ethanolsolution (4.2×10 –4 M) was used as a flowing liquid over the submerged Al 2 O 3target. The Al 2 O 3 (SCRC) target was irradiated by a focused laser beam with 532 nmlight from a DCR-3G Nd:YAG laser (Spectra Physics Inc.), operating at 10 Hz, at thefluence <strong>of</strong> 200 mJ/pulse with a pulse width <strong>of</strong> 8 ns. The spot size <strong>of</strong> the laser beam onthe surface <strong>of</strong> the target was about 1 mm, <strong>and</strong> the flowing liquid was flowing over thetarget at the speed <strong>of</strong> about 0.05 cm 3 /s. Al 2 O 3 was submerged at the depth <strong>of</strong> 1–2 mm,thus the power density <strong>of</strong> the pulsed laser beam in the focus spot was approximately as
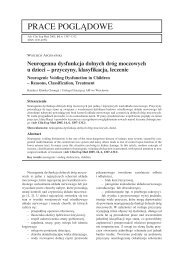
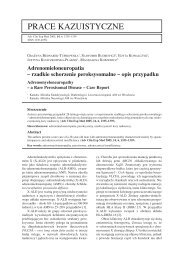
Structure <strong>and</strong> optical properties <strong>of</strong> (Alq x )/Al 2 O 3 ethanol colloids 17high as 3.18×10 9 W/cm 2 . Considering the reflection loss from the focused lens, theactual power density is still higher than 10 8 W/cm 2 . The whole preparation processwas done in a very pure nitrogen atmosphere.The light yellow granular deposit can be obtained from the (Alq x )/Al 2 O 3 ethanolcolloids by centrifugal settling <strong>and</strong> removing the supernatant liquid. The obtaineddeposit was washed with ethanol (repeated eight times), dried in vacuum, <strong>and</strong> finallya light yellow powder was obtained <strong>and</strong> used for <strong>characterization</strong> by FTIR <strong>and</strong>TG/SDTA. After aging <strong>of</strong> (Alq x )/Al 2 O 3 ethanol colloids for five months, a depositmaterial with brown colour can be found at the bottom <strong>and</strong> inner wall <strong>of</strong> the vessel.The deposit (ca. 6mg) was used for TG-FTIR <strong>characterization</strong>.The HRTEM photographs <strong>and</strong> selected area electron diffraction (SEAD) were obtainedon the FEI F20 transmission electron microscope (Philips Company). Electronmicrographs were recorded using 2 drops <strong>of</strong> (Alq x )/Al 2 O 3 nanocolloid solution, appliedonto a copper mesh coated with an amorphous carbon film. FTIR was performedon an Avata 360 FT-IR spectrometer. TG/FTIR measurements were recorded witha Mettler Toledo TGA/SDTA 851 e <strong>and</strong> Nicolet 5700 FT-IR. TG measurements wereperformed at a 10 °C/min scanning rate, employing a 50 cm 3 /min flow <strong>of</strong> dry nitrogenas a purge gas for the sample <strong>and</strong> reference cells.3. Results <strong>and</strong> discussion3.1. Structure <strong>of</strong> the nano Al 2 O 3 particlesFigure 1 shows the HRTEM image <strong>of</strong> the (Alq x )/Al 2 O 3 clusters after being preparedfor 1 h. It can be seen from Fig. 1a that the aggregated nanoparticles consist <strong>of</strong>many smaller, irregular 5–10 nm particles. It was previously shown that, over time,the particles produced by pulsed laser ablation grew in size while undergoing a changein shape, from irregular spherical forms [11]. The size <strong>of</strong> the particles in Fig. 1c isabout 5 nm <strong>and</strong> it is obvious that the nanoparticles are enwrapped by an amorphouslayer, because <strong>of</strong> the absence <strong>of</strong> sharp edges. The amorphous material is mostly composed<strong>of</strong> Q or Q on the surface <strong>of</strong> (Alq x )/Al 2 O 3 clusters. Crystal lines are visible in theenwrapped area <strong>of</strong> Fig. 1d <strong>and</strong> the calculated interplanar spacing is 0.3421 nm, whichcorresponds with the (110) (Fig. 1e) diffraction planes, revealing that the (Alq x )/Al 2 O 3clusters consist <strong>of</strong> Al 2 O 3 crystals. From Figure 1b, it is found that the SEAD pattern <strong>of</strong>the coordinated Al 2 O 3 cluster has a distinctive diffraction pattern with many diffractionpoints. These findings show that the coordinated Al 2 O 3 clusters consist <strong>of</strong> manysmaller Al 2 O 3 crystals <strong>of</strong> disordered arrangement. The interplanar spacing <strong>and</strong> diffractingplanes, together with that <strong>of</strong> JCPDS card are listed in Table 1. It was foundthat the d spacing is similar for the Al 2 O 3 <strong>and</strong> the (Alq x )/Al 2 O 3 clusters, <strong>and</strong> that the(Alq x )/Al 2 O 3 clusters have slightly higher d spacing. This also indicates that the originalparticles, produced by pulsed laser ablation <strong>of</strong> the Al 2 O 3 target immersed into
18Q.-H. CHEN et al.flowing liquid, are Al 2 O 3 crystals with the size <strong>of</strong> 5–10 nm. Original particles are coordinatedby Q in the liquid, <strong>and</strong> very soon they congregate <strong>and</strong> form larger particles.Fig. 1. HRTEM images <strong>of</strong> the (Alq x )/Al 2 O 3 clusters (a), <strong>and</strong> selected areas (b)<strong>of</strong> electron diffraction (SAED) patterns <strong>of</strong> (a), enlarged images (c) <strong>and</strong> (d) correspondingto the areas marked by the solid line in (a) <strong>and</strong> (c), <strong>and</strong> (e) is FFT image <strong>of</strong> (d)Table 1. The interplanar spacing <strong>and</strong> diffractionplanes together with that <strong>of</strong> the JCPDS cardDiffracting planesInterplanar spacing [nm]Al 2 O 3 (JCPDS card 76-0144) Alq x /Al 2 O 3 cluster(110) 0.34804 0.3835(121) 0.25515 0.2976(110) 0.23794 0.2649(222) 0.21660 0.2281(120) 0.20855 0.2171(130) 0.14046 0.1593
Structure <strong>and</strong> optical properties <strong>of</strong> (Alq x )/Al 2 O 3 ethanol colloids 19Figure 2 shows the FTIR spectra <strong>of</strong> (Alq x )/Al 2 O 3 clusters <strong>and</strong> Q from the AldrichFTIR library. As compared with the spectra <strong>of</strong> Q <strong>and</strong> Alq 3 reported in the literature[12], the (Alq x )/Al 2 O 3 cluster has much weaker absorbance peaks at about 2920 cm –1(–CH 2 ), 1200–1400 cm –1 (quinoline group) <strong>and</strong> 1580 cm –1 (–OH), but has twostronger peaks at 561 <strong>and</strong> 841 cm –1 , which can be attributed to the asymmetric vibrations<strong>of</strong> Al 2 O 3 . It is obvious that the (Alq x )/Al 2 O 3 clusters consist <strong>of</strong> Al 2 O 3 <strong>and</strong> Q.Fig. 2. FTIR spectra <strong>of</strong> the (Alq x )/Al 2 O 3 clusters <strong>and</strong> Qfrom the library <strong>of</strong> the Aldrich condensed phasesFig. 3. TG/SDTA image <strong>of</strong> the (Alq x )/Al 2 O 3 clustersFigure 3 shows the TG-SDTA image <strong>of</strong> the (Alq x )/Al 2 O 3 clusters. Above 200 °C(Alq x )/Al 2 O 3 clusters show obvious weight loss (ca. 1.5%) in the temperature range
20Q.-H. CHEN et al.over which the TG-SDTA measurements were conducted. (Alq x )/Al 2 O 3 clusters havelarge surface areas, thus they adsorb much gases (about 0.4%) at temperatures below200 °C, released at higher temperatures. Thus the weight loss originates from the absorbedgas (about 0.4%) <strong>and</strong> the thermolysis <strong>of</strong> Q coordinated to the surface ions <strong>of</strong>the (Alq x )/Al 2 O 3 clusters or simply from its sublimation [8] (1.1%).3.2. Optical properties <strong>of</strong> the (Alq x )/Al 2 O 3 ethanol colloidsThe (Alq x )/Al 2 O 3 ethanol colloids can emit strong green fluorescent light under UV irradiation;however, the fluorescence colour changed upon the increasing aging time.Table 2. The colour <strong>of</strong> the (Alq x )/Al 2 O 3 ethanol colloids withthe various aging times under strong white light <strong>and</strong> UV irradiationsAging timeThe colour understrong white lightThe colour underUV radiations1 h white green1 month white light Kelly green2 months light brown Kelly green5 months brown blackTable 2 shows the colour <strong>of</strong> the (Alq x )/Al 2 O 3 ethanol colloids corresponding to variousaging times under strong white light <strong>and</strong> UV irradiations. Under irradiation, differingin time, (Alq x )/Al 2 O 3 ethanol colloids display various colours. These findings indicate withthe increase in the aging time, a brown, non-fluorescent material is produced in the colloids,<strong>and</strong> the luminescence intensity decreases. After five months <strong>of</strong> aging, a deposit materialwith brown colour can be found at the bottom <strong>and</strong> inner walls <strong>of</strong> the vessel. Becausethe coordinated Znq 2 /ZnO ethanol colloids prepared by the same method have very stablechemical properties, <strong>and</strong> have the same fluorescent green colour during aging [13], aluminawas believed to be related to the fluorescence quenching <strong>of</strong> the coordinatedAlq x /Al 2 O 3 colloids. The subsection immediately below describes how FTIR <strong>and</strong> TG-FTIR were used to characterize the brown deposit material.Figure 4 shows the FTIR spectra <strong>of</strong> the deposits <strong>of</strong> the (Alq x )/Al 2 O 3 ethanol colloids<strong>and</strong> polystyrene (M. W. 50000) from the Aldrich FTIR library. Using patternmatchings<strong>of</strong>tware (Omnic 7.2, Thermo Electron corporation), the match value <strong>of</strong>these two spectra is as high as 95.5%, which shows that the main component <strong>of</strong> thedeposit is polystyrene. In addition, the stronger absorption peak at 3400 cm –1 can beattributed to the hydroxyl group, which indicates there is little amount <strong>of</strong> materialcontaining hydroxyl, which may be the result <strong>of</strong> Q being absorbed by the deposit.Figure 5 shows the TG/SDTA image <strong>of</strong> the deposits <strong>of</strong> the (Alq x )/Al 2 O 3 clusters,<strong>and</strong> Figure 6 shows FTIR spectra <strong>of</strong> the thermal products released at 1.1 min, 8.6 min,41.4 min <strong>and</strong> also styrene from the flavours <strong>and</strong> fragrances FTIR library. Weightlosses indicating the release <strong>of</strong> some materials occurred at 1.1, 8.6 <strong>and</strong> 41.4 min.
Structure <strong>and</strong> optical properties <strong>of</strong> (Alq x )/Al 2 O 3 ethanol colloids 21Fig. 4. FTIR spectra <strong>of</strong> the deposit <strong>of</strong> the Alq x /Al 2 O 3 ethanol colloids <strong>and</strong> polystyrene(M. W. 50000) from the Aldrich Condensed Phase SupplementFig. 5. TG/SDTA image <strong>of</strong> the deposits <strong>of</strong> the (Alq x )/Al 2 O 3 ethanol colloidsTable 3 shows the weight loss for an (Alq x )/Al 2 O 3 cluster in function <strong>of</strong> time <strong>and</strong>temperature. The materials released were identified by comparing their spectra withFT-IR spectra from the Aldrich FTIR library. As can be seen from Table 3, a closematch <strong>of</strong> the product released after 41.4 min with styrene indicates these two materialsare the same. The small quantity <strong>of</strong> water was probably absorbed during formation <strong>of</strong>the colloidal deposits, <strong>and</strong> ethanol would be expected to absorb into the colloidal depositsas well. As can be seen from Fig. 6 <strong>and</strong> Table 3, styrene was released in the
22Q.-H. CHEN et al.temperature range <strong>of</strong> 350–450 °C. It most likely originates from Q coordinated to thesurface <strong>of</strong> the Al 2 O 3 particles <strong>and</strong> also from Q in the colloids.Fig. 6. FTIR spectra <strong>of</strong> the released thermal products from the deposit at 1.1 min, 8.6 min,41.4 min <strong>and</strong> styrene spectrum from the library <strong>of</strong> flavours <strong>and</strong> fragrancesTable 3. Weight loss for (Alq x )/Al 2 O 3 clusters as a function <strong>of</strong> time <strong>and</strong> temperatureHeating time[min]Temperature[°C]Weight loss[%]Rest weight[%]Match value[%]Possible releasedproduct1.1 46 –0.34 100.34 45% water without CO 28.6 121 1.7 98.3 60% ethanol <strong>and</strong> water41.4 449 96.29 3.71 96.1 styrene61.5 650 97.33 2.673.3. Process <strong>of</strong> decreasing luminescence <strong>of</strong> the (Alq x )/Al 2 O 3 ethanol colloidsIt has been shown that (Alq x )/Al 2 O 3 nanoparticles are composed <strong>of</strong> the Al 2 O 3 crystalcore <strong>and</strong> Q coordinated with the surface ions <strong>of</strong> the Al 2 O 3 nanoparticles. The luminescenceintensity decreases with the increase in the aging time accompanied by theproduction <strong>of</strong> a brown material <strong>and</strong> a dark brown deposit in the colloids. The maincomponent <strong>of</strong> the deposit is polystyrene. These findings can be explained if Q, coordinatedto the surface <strong>of</strong> Al 2 O 3 particles, was catalysed by Al 2 O 3 nanoparticles havinghigh surface areas, to form polystyrene. As Q coordinates to the surface Al ions <strong>of</strong>nanoparticles, some inner bonding energy becomes weaker, some bonds are broken<strong>and</strong> new ones are formed. The high surface energy <strong>of</strong> nano Al 2 O 3 particles acceleratesthis change. During the bond changing process, polystyrene <strong>and</strong> a brown material areformed <strong>and</strong> Alq x vanishes. Because this brown material is still unknown, further inves-
Structure <strong>and</strong> optical properties <strong>of</strong> (Alq x )/Al 2 O 3 ethanol colloids 23tigations are presently underway to elucidate the details <strong>of</strong> luminescence attenuation in(Alq x )/Al 2 O 3 ethanol colloids.4. ConclusionsAn investigation into the structure <strong>and</strong> chemical stability <strong>of</strong> ethanol colloids <strong>of</strong> aluminum8-hydroxyquinoline complexes (Alq x )/Al 2 O 3 emitting green light under ultravioletradiation was performed. The (Alq x )/Al 2 O 3 ethanol colloid product was characterized byHRTEM, FTIR, TG/SDTA, TGA/FTIR. The HRTEM <strong>and</strong> FTIR results showed that crystallineAl 2 O 3 is the core <strong>of</strong> the (Alq x )/Al 2 O 3 nanoparticles, with Q coordinated to the surface<strong>of</strong> aluminum ions <strong>of</strong> the Al 2 O 3 nanoparticles. (Alq x )/Al 2 O 3 ethanol colloids with differentaging times show different luminescence colours under ultraviolet radiation. Theluminescence intensity decreases as the aging time increases, accompanied by the formation<strong>of</strong> a brown material <strong>and</strong> a dark brown deposit. TG-FTIR <strong>and</strong> FTIR results show thatthe main component <strong>of</strong> the deposit is polystyrene. These findings can be explained by aprocess in which Q coordinated to the surface ions <strong>of</strong> Al 2 O 3 particles, is catalysed byAl 2 O 3 nanoparticles to form polystyrene.AcknowledgementsThe authors are indebted for the financial support <strong>of</strong> the National Natural Scientific Foundation <strong>of</strong>China (Grant No. 50272014), the Key Nano Special Item <strong>of</strong> Fujian Province <strong>of</strong> China (Grant No.2005HZ01-5), the Natural Scientific Foundation <strong>of</strong> Fujian Province <strong>of</strong> China (Grant No. A0710001) <strong>and</strong>the Education Department <strong>of</strong> the Fujian Province <strong>of</strong> China (Grant No. JB07061). We also acknowledgePr<strong>of</strong>essor Richard D. Foust for helpful discussions.References[1] TANG C.W., VANSLYKE S.A., Appl. Phys. Lett., 51 (1987), 913.[2] CÖLLE M., DINNEBIER R.E., BRÜTTING W., Chem. Commun., (2002), 2908.[3] PRIESTLEY R., WALSER A.D., DORSINVILLE R., Opt. Commun., 158 (1998), 93.[4] BURROUGHES J.H., BRADLEY D.D.C., BROWN A.R., MARKS R.N., MACKAY K., FRIEND R.H.,BURNS P.L., HOLMES A.B., Nature, 347 (1990), 539.[5] YU G., SHEN D.Z., LIU Y.Q., ZHU D.B., Chem. Phys. Lett., 333 (2001), 207.[6] BALDACCHINI G., BALDACCHINI T., GAGLIARDI S., MONTEREALI R.M., PACE A., PODE R.B., ThinSolid Films, 417 (2002), 72.[7] PAPADIMITRAKOPOULOS F., ZHANG X.M., Synth. Met., 85 (1997), 1221.[8] HIGGINSON K.A., ZHANG X.M., PAPADIMITRAKOPOULOS F., Chem. Mater., 10 (1998), 1017.[9] PAPADIMITRAKOPOULOS F., ZHANG X.M., THOMSEN D.L., HIGGINSON K.A., Chem. Mater., 8 (1996),1363.[10] XU M.S., XU J.B., Synth. Met., 145 (2004), 177.[11] CHEN Q.H., ZHANG W.G., J. Colloid Interf. Sci., 309 (2006), 531.[12] LI H.R., ZHANG F.J., WANG Y.Y., ZHENG D.S., Mat. Sci. Eng. B, 100 (2003), 40.[13] CHEN Q.H., ZHANG W.G., Appl. Surf. Sci., 253 (2007), 3751.Received 16 January 2008Revised 22 January 2009
Materials Science-Pol<strong>and</strong>, Vol. 28, No. 1, 2010Methods <strong>of</strong> manufacturing <strong>of</strong> potassiumtitanate fibres <strong>and</strong> whiskers. A reviewT. ZAREMBA, D. WITKOWSKA *Silesian University <strong>of</strong> Technology, Department <strong>of</strong> Chemistry, Inorganic Technology <strong>and</strong> Fuels,ul. Krzywoustego 6, 44-100 Gliwice, Pol<strong>and</strong>Titanate fibres <strong>and</strong> whiskers are new materials with high heat resistance <strong>and</strong> good chemical stability.They have found numerous applications such as ion exchanger materials, thermal insulators, reinforcements,catalysts, photocatalysts <strong>and</strong> substitutes <strong>of</strong> asbestos. In this paper, the methods <strong>of</strong> fabricating potassiumtitanate fibres <strong>and</strong> whiskers have been discussed, e.g., calcination, hydrothermal reaction, flux growth, sol-gel technique, <strong>and</strong> others. Because asbestos fibres are known to cause fibrotic diseases in lungs we alsorefer to studies into the toxicity <strong>and</strong> carcinogenicity <strong>of</strong> potassium titanate fibres <strong>and</strong> whiskers.Keywords: potassium titanate; fibres; whiskers; production;1. IntroductionTwo types <strong>of</strong> fibres are encountered into human society: natural fibres, whichhave existed for 4 000 years or more, <strong>and</strong> synthetic fibres developed 100 years ago,when Count Chardonnet invented artificial silk, an achievement that had been only apipe-dream up to then [1].A fibre can be defined as a thin <strong>and</strong> long substance which has both strength <strong>and</strong>the capacity to be elongated to a certain extent. Because it is by definition thin, thefibre is able to bend. To characterise the thinness <strong>and</strong> the length <strong>of</strong> fibres numerically,the ratio L/D <strong>of</strong> their length L to their diameter D is commonly used to characterize thegeometry <strong>of</strong> a fibre (this is known as the aspect ratio). A fibre can be then defined asa material that has an aspect ratio <strong>of</strong> 100 or more. Fibre diameters can be used to classifyvarious fibre morphologies, which include whiskers (< 1 μm), staples (1–10 μm),continuous multifilament yarns (5–25 μm), <strong>and</strong> continuous mon<strong>of</strong>ilaments (> 100 μm).A whisker or microcrystalline fibre can be defined as a material having small diameters<strong>and</strong> minimal flaws or imperfections, which have very high strength <strong>and</strong> modulusvalues [1, 2]._________* Corresponding author, e-mail: dagmara.witkowska@polsl.pl
26T. ZAREMBA, D. WITKOWSKADuring the last thirty years important progress has been made on inorganic fibres <strong>and</strong>whiskers. This progress appertains to the synthesis <strong>of</strong> new fibres <strong>and</strong> whiskers which havea high tensile strength, tenacity, stiffness, modulus <strong>of</strong> elasticity <strong>and</strong> heat resistance. First <strong>of</strong>all, they have found application in production <strong>of</strong> metal, organic <strong>and</strong> ceramic matrix composites.Composite materials are fundamental materials for supporting the technologiesrequired for the 21st century, as dem<strong>and</strong>ed by the automobile/aircraft industries, spacetechnology <strong>and</strong> in the leisure field, such as golf, tennis, skiing <strong>and</strong> sailing. They may thereforehave a great impact on many human activities [1, 3, 4].Glass <strong>and</strong> asbestos fibres were initially inorganic fibres. The discovery that asbestoshas carcinogenic properties has motivated the search for new kinds <strong>of</strong> fibres. Thetechnical processes <strong>of</strong> fabricating fibres like aluminosilicate, alumina, boron <strong>and</strong> siliconcarbide have been developed, some <strong>of</strong> these fibres in the shape <strong>of</strong> whiskers. Fibres<strong>and</strong> whiskers are now widely applied in the field <strong>of</strong> aerospace technology, automobiletechnology, marine technology, optical networks, the leisure industry, <strong>and</strong> for the production<strong>of</strong> materials such as safety/protective garments <strong>and</strong> friction materials. Theseapplications are mainly to replace metal parts <strong>and</strong> to reduce the weight for the purpose<strong>of</strong> energy conservation [1, 3, 4].In the last decade, a new generation <strong>of</strong> inorganic fibres <strong>and</strong> whiskers – titanates –has been discovered. A series <strong>of</strong> titanates having the chemical formula M 2 O⋅nTiO 2(where M = alkali metal <strong>and</strong> n = 2–8) are well-known. All <strong>of</strong> them have tunnel or layeredcrystal structures constructed out <strong>of</strong> TiO 6 octahedra sharing edges with interlayingcations. Because <strong>of</strong> their excellent chemical <strong>and</strong> mechanical properties, they havebeen used in a wide range <strong>of</strong> applications in industry as ion exchange materials, reinforcements,heat insulators, friction materials, catalysts, photocatalysts <strong>and</strong> as substitutes<strong>of</strong> asbestos [5, 6]. The following titanates have been described:M 2 O·2TiO 2 – M 2 Ti 2 O 5 (M = Li, Na, K, Cs) [7], M 2 O·4TiO 2 – M 2 Ti 4 O 9 (M = Li,Na, K, Rb, Cs) [8], M 2 O·6TiO 2 – M 2 Ti 6 O 13 (M = Na, K, Rb, Cs) [9–11], M 2 O·8TiO 2– M 2 Ti 8 O 17 (M = K, Rb) [12], as well as KTiO 2 (OH) [12], K 3 Ti 8 O 17 [13], K 4 Ti 3 O 8 [7],Na 2 Ti 3 O 7 [14], Na 2 Ti 9 O 19 <strong>and</strong> others [15].Among alkali titanates, potassium titanates such as K 2 Ti 2 O 5 , K 2 Ti 4 O 9 , K 2 Ti 6 O 13<strong>and</strong> K 2 Ti 8 O 17 have attracted much attention, due to their specific photochemical propertiesor their artificial cage-type structure. They have been recognized as importantfunctional materials with wide applications [5, 6].Among whiskers, potassium titanate whisker has several advantages comparedwith other ceramic whiskers. One <strong>of</strong> its most desirable features is low production cost<strong>of</strong> the whisker itself, which is one <strong>of</strong> the critical factors for commercial applications <strong>of</strong>composites [16].2. Potassium titanatesThe crystal structure <strong>and</strong> properties <strong>of</strong> potassium titanates, K 2 O⋅nTiO 2 (n = 2–8),are dependent on the value <strong>of</strong> n. Characteristic feature <strong>of</strong> potassium titanates with
Manufacturing <strong>of</strong> potassium titanate fibres <strong>and</strong> whiskers 27a high potassium content (n = 2, 4) is the existence <strong>of</strong> a layer structure. They exhibita distinctive intercalation capacity <strong>and</strong> catalytic activity. However, in the case <strong>of</strong> potassiumtitanates with a low potassium content (n = 6, 8), they have a tunnel structure<strong>and</strong> exhibit good thermo-insulation properties <strong>and</strong> good chemical stability [17].Many methods have been developed to synthesize potassium titanate fibres <strong>and</strong>whiskers, including calcination, slow-cooling calcinations, hydrothermal reactions,flux growth (melting), flux evaporation <strong>and</strong> the combinative route <strong>of</strong> flux evaporation<strong>and</strong> the slow-cooling process. Among many methods <strong>of</strong> synthesis, the slow-coolingcalcination method has advantages in that it uses no flux; therefore, production costscould be reduced compared with other methods [17, 18].2.1. Potassium dititanate K 2 Ti 2 O 5Potassium dititanate K 2 Ti 2 O 5 has been the focus <strong>of</strong> intense research because <strong>of</strong> theinterchangeable crystal structure that facilitates subsequent conversions into inorganicorganic/inorganiccomposites <strong>and</strong> new layered or three-dimensionally bonded compoundswith a high photocatalytic activity [19, 20]. The crystal structure <strong>of</strong> K 2 Ti 2 O 5consists <strong>of</strong> (Ti 2 O 5 ) 2– layers in which titanium atoms have fivefold coordination, separatedby potassium ions (Fig. 1) [19, 21].Fig. 1. Idealized crystal structure <strong>of</strong> K 2 Ti 2 O 5According to Andersson <strong>and</strong> Wadsley [21], K 2 Ti 2 O 5 was obtained as colourlessneedles by melting K 2 CO 3 <strong>and</strong> TiO 2 (anatase) in a platinum crucible. Whilst the crystalswere kept for long periods in a desiccator, they decomposed on exposure to moistair. The layered structure <strong>of</strong> K 2 Ti 2 O 5 is not stable in water or acid solutions [20].Bao et al. [22] synthesized K 2 Ti 2 O 5 single crystals using K 2 CO 3 <strong>and</strong> nano TiO 2(anatase) powders as starting materials with the TiO 2 /K 2 CO 3 molar ratio <strong>of</strong> 3.0. Theprecursors were mixed, <strong>and</strong> a small amount <strong>of</strong> water <strong>and</strong> surfactants was introduced tothe mixture. The obtained paste was formed into 20 mm × 20 mm × 10 mm disks bymechanical pressing <strong>and</strong> dried in a oven at 100 °C for 10 h. The disks were then sinteredin a muffle furnace at a calcination temperature <strong>of</strong> 830 °C for 10 h, <strong>and</strong> quicklyremoved at the end <strong>of</strong> the calcination for air-cooling. Monocrystals <strong>of</strong> K 2 Ti 2 O 5 obtainedin the above way had the same size, morphology <strong>and</strong> surface; at 852 °C they
28T. ZAREMBA, D. WITKOWSKAtransformed into K 2 Ti 4 O 9 whiskers. The following steps <strong>of</strong> their synthesis have beenreported:K 2 CO 3(solid) → K 2 O (solid) + CO 2(gas) at T < 828 °C2TiO 2(solid) + K 2 O (solid) → K 2 Ti 2 O 5(solid) at T = 828 °C2K 2 Ti 2 O 5(solid) ) → K 2 Ti 4 O 9(solid) + K 2 O (liquid) at T = 952 °CSimilarly as in the previous work, hydrous titanium dioxide TiO 2·nH 2 O <strong>and</strong>K 2 CO 3 were used to fabricate K 2 Ti 2 O 5 single crystals [18]. A reactant mixture with theTiO 2 /K 2 CO 3 molar ratio <strong>of</strong> 3.0 was dried in an oven at 90 °C for 10 h, calcination wasperformed in a muffle furnace at 820 °C for 30 min. Then the sintered mixture wasremoved from the furnace <strong>and</strong> cooled in air. The synthesized K 2 Ti 2 O 5 single crystalshad the same properties as that fabricated by Bao et al. [22].Masaki et al. [23] obtained potassium dititanate by the hydrothermal method, byoxidation <strong>of</strong> titanium metal powder in concentrated potassium hydroxide solution.50 cm 3 <strong>of</strong> KOH aqueous solution <strong>and</strong> 10 g <strong>of</strong> Ti powder were placed in an autoclavewith a magnetic stirrer. After being sealed, the autoclave was set into an electric furnacefor 2 h at a desired temperature. Then it was taken out from the furnace <strong>and</strong>cooled immediately in air. The product was separated from the solution by the use <strong>of</strong>centrifuge, then rinsed with methanol, <strong>and</strong> finally dried at 105 °C for 12 h in an ovento remove the absorbed water. Well crystallized platelet crystals <strong>of</strong> hydrated K 2 Ti 2 O 5were formed as single phases having KOH concentrations ranging from 20 to 25mol/kg H 2 O at temperatures from 150 to 200 °C. Crystalline K 2 Ti 2 O 5 was also obtainedfrom the amorphous compound synthesized at KOH concentration above80 mol/kg H 2 O at 150 °C by heating at 800 °C.2.2. Potassium tetratitanate K 2 Ti 4 O 9Crystalline potassium tetratitanate (K 2 Ti 4 O 9 ), with a characteristic layered structure,consists <strong>of</strong> TiO 6 octahedra linked with K ions (Fig. 2) [24, 25]. Considering itsstrong ion exchange properties, K 2 Ti 4 O 9 can be widely used as an ion exchanger foralkali metal ions, alkali earth metal ions <strong>and</strong> divalent transition metal ions. Furthermore,K 2 Ti 4 O 9 shows good catalytic <strong>and</strong> photocatalytic activity which enables theirapplication as catalysts <strong>and</strong> photocatalysts. Potassium tetratitanate fibres <strong>and</strong> whiskershave been prepared among others by calcination, slow cooling calcination <strong>and</strong> sol- geltechnique [26].Andersen et al. [26] synthesized potassium tetratitanate by a conventional solidstate reaction. Potassium carbonate (K 2 CO 3 ) <strong>and</strong> anatase (TiO 2 ) in the molar ratio <strong>of</strong>1:4 were milled together in slurry with absolute ethanol saturated with potassium carbonate.The solid was separated, air dried, <strong>and</strong> 2 g tablets were formed by mechanicalpressing. The tablets were then heated at 900 °C for 48 h.
Manufacturing <strong>of</strong> potassium titanate fibres <strong>and</strong> whiskers 29Andersen et al. [26] also synthesized K 2 Ti 4 O 9 by the sol-gel method. The solution<strong>of</strong> titanium isopropoxide in dry n-propanol was added slowly to a solution <strong>of</strong> potassiumt-butoxide in dry methanol. The molar ratio <strong>of</strong> KOC 4 H 9 to Ti(OC 3 H 7 ) 4 was 1:2.This clear solution was hydrolyzed with a solution <strong>of</strong> water in n-propanol. The amount<strong>of</strong> water for hydrolysis was 4 mol H 2 O per mol Ti(OC 3 H 7 ) 4 plus 1 mol H 2 O per 1 molKOC 4 H 9 . The obtained gel was stirred for three days. Most <strong>of</strong> the liquid phase wasthen removed by centrifugation <strong>and</strong> decantation. The gel was dried in air at room temperatureon a glass plate. The resulting white powder was heated for 1 h at 100 °C <strong>and</strong>then at 900 °C for 60 h. K 2 Ti 4 O 9 fabricated by Andersen et al. [26] was hydrolyzed toobtain hydrous titanium(IV) oxide (H 2 Ti 4 O 9 ⋅nH 2 O) which is an ionic conductor likeother hydrous metal oxides (Sb 2 O 5 ⋅nH 2 O, ZrO 2 ⋅nH 2 O, SnO 2 ⋅nH 2 O).Fig. 2. Idealized crystal structure <strong>of</strong> K 2 Ti 4 O 9Bao et al. [18] obtained K 2 Ti 4 O 9 whiskers by the calcination process. Hydrous titaniumdioxide was mixed with K 2 CO 3 , <strong>and</strong> then the reactant mixture was dried in anoven at 90 °C for 10 h. Also, a mixture <strong>of</strong> anatase–K 2 CO 3 was applied. Calcinationwas carried out in a muffle furnace at 920 °C for 30 min. The stirred mixtures werethen removed at the corresponding calcination temperature, cooled in air <strong>and</strong> leachedin boiling water for 2 h. K 2 Ti 4 O 9 whiskers had a uniform size <strong>and</strong> good morphology.Compared with anatase, amorphous hydrous titanate lowered the phase change temperature.Another method to synthesize K 2 Ti 4 O 9 fibres is based on ion exchange <strong>and</strong> gelation<strong>of</strong> sodium alginate (C 5 H 7 O 4 COONa) x ⋅yH 2 O, which is well known as an ion exchangeableorganic polymer. This method does not require expensive reagents. Inaddition, viscous solutions <strong>of</strong> sodium alginate have an advantage in that it gel in anyshape, such as fibre, film, <strong>and</strong> bead, by ion exchange with protons or multivalent metalions. 5 g <strong>of</strong> sodium alginate was added slowly to 100 g <strong>of</strong> vigorously stirred deionizedwater. Stirring was continued for 5 h, <strong>and</strong> then the solution was degassed with a vacuumpump, after which it was left for 24 h to remove air bubbles. An aqueous solution<strong>of</strong> 5% sodium alginate was extruded from a nozzle into 1 M HCl. The extruded sodiumalginate sol turns into alginic acid gel fibre through the ion exchange <strong>of</strong> its sodiumions with protons in the HCl solution. The alginic acid (H-alginate) fibre wasrinsed in deionized water three times, dried in air for 24 h, <strong>and</strong> then immersed intoa mixture <strong>of</strong> titanium sulfate (Ti(SO 4 ) 2 ) <strong>and</strong> potassium nitrate (KNO 3 ) for more than
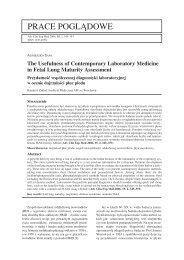
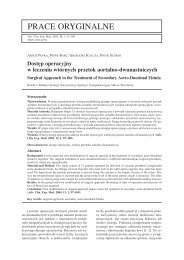
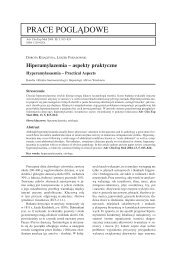
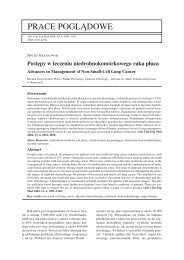
30T. ZAREMBA, D. WITKOWSKA10 h. The obtained K-Ti alginate fibre was rinsed in deionized water, dried at ambienttemperature <strong>and</strong> then heated at 800 °C for 3 h in air. The average length <strong>and</strong> thickness<strong>of</strong> the potassium tetratitanate fibres were about 2.5 cm <strong>and</strong> 150 μm, respectively [27].According to Fujiki <strong>and</strong> Yoshinori [28], K 2 Ti 4 O 9 fibres can be produced at lowcost without using any flux or catalyst. Starting materials, TiO 2 <strong>and</strong> K 2 CO 3 , are mixedat the ratio satisfying the general formula K 2 O·nTiO 2 with n ranging from 3 to 5. Themixtures <strong>of</strong> powders were then heated in the temperature range from 950 °C to1300 °C <strong>and</strong> then cooled slowly to 900–950 °C <strong>and</strong> left for decomposition for 3 to 5 h.Afterwards the crucibles were taken out <strong>of</strong> the furnace into open air, <strong>and</strong> allowed tocool to room temperature. The products were washed with cold or warm distilled water<strong>and</strong> dried at 100 °C. The production process is strongly dependent on the molarratio <strong>of</strong> TiO 2 /K 2 O, the starting materials <strong>and</strong> the cooling rate. In order to obtain potassiumtetratitanate fibres on an industrial scale, it is advisable to apply the decompositiontemperature in the range 1100–1150 °C. The product must be held at this temperaturefor at least 4 h <strong>and</strong> then cooled at a low rate <strong>of</strong> 15–35 °C per h for satisfactorygrowth rate <strong>of</strong> fibres.Recently, fibrous potassium tetratitanate was obtained at the Silesian University <strong>of</strong>Technology in the following way: The substrates, K 2 CO 3 <strong>and</strong> TiO 2 , were first groundin an agate mortar in isopropyl alcohol <strong>and</strong> dried. A powdered stoichiometric mixturewas then placed into platinum crucibles <strong>and</strong> heated to 900–1000 °C in a box furnace.Obtained K 2 Ti 4 O 9 formed short <strong>and</strong> tightly packed rod-like crystals. Further K 2 Ti 4 O 9syntheses were carried out by heating the mixture <strong>of</strong> raw materials to 1150 °C for 3 hthus, causing K 2 Ti 4 O 9 to melt incongruently. K 2 Ti 4 O 9 melts at 1114 ± 15 °C decomposingto K 2 Ti 6 O 13 stable solid phases <strong>and</strong> K 2 O-rich liquid phases, which createsK 2 Ti 2 O 5 . Then the samples were cooled to 950 °C in a furnace at the cooling ratewithin the range 50–25 °C·h –1 . On cooling, K 2 Ti 4 O 9 whiskers were formed <strong>and</strong> theassociation reaction occurred as follows:K 2 Ti 6 O 13(s) + K 2 Ti 2 O 5(l) → 2 K 2 Ti 4 O 9(s)Fig. 3. SEM <strong>of</strong> K 2 Ti 4 O 9 whiskers synthesizedby the calcination at 1150 °C for 3 h<strong>and</strong> cooled to 950°C at the rate <strong>of</strong> 35°C·h –1 [29]Fig. 4. SEM <strong>of</strong> K 2 Ti 4 O 9 whiskers synthesizedby the calcination at 1150 °C for 3 h<strong>and</strong> cooled to 950 °C at the rate <strong>of</strong> 25°C·h –1 [29]
Manufacturing <strong>of</strong> potassium titanate fibres <strong>and</strong> whiskers 31The cooling rate was found to be a determining factor <strong>of</strong> the size <strong>of</strong> K 2 Ti 4 O 9whiskers. At the cooling rate <strong>of</strong> 50 °C·h –1 , the whisker length was up to 60 μm. Thecooling at 35 °C·h –1 caused K 2 Ti 4 O 9 to decompose more quickly (Fig. 3). At the lowestcooling rate (25 °C·h –1 ), whiskers <strong>of</strong> a high aspect ratio, exceeding the minimumvalue required for whiskers, were obtained (Fig. 4) [29–32].2.3. Potassium hexatitanate K 2 Ti 6 O 13Potassium hexatitanate belongs to materials attracting a growing interest, due to itspotential economic importance. This relatively cheap, fibrous material has good thermaldurability, chemical resistivity <strong>and</strong> dispersibility <strong>and</strong> has been found to be usefulas a reinforcement material for plastic <strong>and</strong> ceramics, heat-insulating paints <strong>and</strong> automotivebrake linings [17, 25, 33–37]. The structure <strong>of</strong> this material is one in which thestructural unit <strong>of</strong> three TiO 6 octahedra forms the tunnels with sharing edges <strong>and</strong> joiningthrough the corners as shown in Fig. 5 [25]. Because potassium ions in K 2 Ti 6 O 13are enclosed by the tunnelling structure <strong>and</strong> isolated from the environment, potassiumions can not escape from the tunnelling structure in the solution [35]. This tunnelstructure has also attracted additional interest because <strong>of</strong> its possible application asa photocatalytic material [25, 33, 38].Fig. 5. Idealized crystal structure <strong>of</strong> K 2 Ti 6 O 13K 2 Ti 6 O 13 whiskers may be synthesized by the calcination <strong>and</strong> slow coolingmethod. As starting materials, K 2 CO 3 <strong>and</strong> TiO 2 were used in the molar ratio K 2 O/TiO 21:3. The powder mixture was milled for 24 h with ethanol <strong>and</strong> subsequently dried.Then a platinum crucible was filled with the mixture <strong>and</strong> heated to 1150 °C for 6 h.After having been stored for a specified time at an assigned temperature, the specimenswere slowly cooled to 950 °C at the rate <strong>of</strong> 16 °C·h –1 in a furnace <strong>and</strong> quenchedin water. During calcination at 1150 °C, rod-like K 2 Ti 6 O 13 particles were formed, <strong>and</strong>K 2 Ti 4 O 9 whiskers were formed from K 2 O-rich phase <strong>and</strong> K 2 Ti 6 O 13 during slow cooling(by the splitting <strong>of</strong> K 2 Ti 6 O 13 layers). The final K 2 Ti 6 O 13 whiskers were obtainedfrom K 2 Ti 4 O 9 after treatment with boiling distilled water for 4 h <strong>and</strong> subsequent reheatingto 1000 °C for 1 h. The K 2 Ti 6 O 13 whiskers had a clean surface <strong>and</strong> the lengthexceeding 100 μm [17].
32T. ZAREMBA, D. WITKOWSKAPotassium hexatitanate fibres were fabricated by the combinative route <strong>of</strong> fluxevaporation <strong>and</strong> slow cooling. 1 wt. % <strong>of</strong> Li 2 CO 3 was added to K 2 MoO 4 flux to enhanceevaporation <strong>of</strong> the flux, then the flux (Li 2 O–K 2 MoO 4 ) <strong>and</strong> raw materials(K 2 O:TiO 2 = 1:6) were mixed in an agate mortar. The molar ratio <strong>of</strong> flux to raw materialswas kept at 7:3, which was found to lead to the optimum growth condition. Aftercalcining at 1150 °C for 4 h, the sample was slowly cooled to 900 °C in a furnace atthe rate <strong>of</strong> 10 °C·h –1 , <strong>and</strong> then quenched in air. The product was washed with distilledhot water <strong>and</strong> dried at 110 °C. The K 2 Ti 6 O 13 fibres grown by this process had a columnartype shape with very smooth <strong>and</strong> clean surface. They had a very uniform size,1.5 mm in length <strong>and</strong> 2–3 μm in diameter [36].Yokoyama et al. [37] synthesized K 2 Ti 6 O 13 long fibres by the flux evaporationmethod using Na 2 O–K 2 O–B 2 O 3 flux fabricated from Na 2 CO 3 , K 2 CO 3 <strong>and</strong> B 2 O 3 invarious molar ratios. Non-fibrous K 2 Ti 6 O 13 was prepared by solid-state reaction <strong>of</strong>K 2 CO 3 <strong>and</strong> anatase (TiO 2 ) at 1450 °C. The mixture <strong>of</strong> K 2 Ti 6 O 13 <strong>and</strong> flux was put intoa platinum crucible, heated at 1050 °C for 1–15 h, <strong>and</strong> then rapidly cooled to roomtemperature in air. The products were separated by dissolving the flux with HCl. Itwas found that the addition <strong>of</strong> Na 2 O to 3K 2 O·5B 2 O 3 flux was highly conducive to thegrowth <strong>of</strong> long K 2 Ti 6 O 13 fibres.<strong>Synthesis</strong> <strong>of</strong> potassium hexatitanate fibres was also carried out by hydrothermalreactions by using potassium hydroxide solution <strong>and</strong> titanium tetraisopropoxide as rawmaterials in a K:Ti molar ratio <strong>of</strong> 1:2. Both reactants were thoroughly stirred for30 min to 1 h before heating in the autoclave using a nickel tube. Heating temperatures<strong>of</strong> 350 °C, 400 °C <strong>and</strong> 450 °C <strong>and</strong> heating durations <strong>of</strong> 2.5 <strong>and</strong> 25 h were employed.The products were allowed to cool slowly in an autoclave followed by filtering, washingwith distilled water <strong>and</strong> ethanol, <strong>and</strong> finally drying at 50 °C for about 24 h.K 2 Ti 6 O 13 fibres synthesized hydrothermally were stable, long, felt-like, thin, <strong>of</strong> largesurface area as compared with the fibres obtained from the solid state method. Theheating temperature <strong>and</strong> duration employed in the hydrothermal synthesis do not seemto have much effect on the crystal morphology <strong>and</strong> structure <strong>of</strong> the fibres, but do havean effect on their size [38].K 2 Ti 6 O 13 fibres were fabricated by ion exchange reaction from potassium tetratitanatefibres (K 2 Ti 4 O 9 ) based on the thermodynamic model. K 2 CO 3 <strong>and</strong> hydrous titania(TiO 2·nH 2 O) at the molar ratio <strong>of</strong> 3.0 were mixed <strong>and</strong> then dried in an oven at 90 °C for 10h. To prepare K 2 Ti 4 O 9 fibres (initial material), the mixture was sintered in a muffle furnaceat 960 °C for 10 h. The sample was then removed from the furnace <strong>and</strong> cooled in air. FibrousK 2 Ti 4 O 9 was suspended in vigorously stirred water, simultaneously while adding1 M HCl continuously, the pH value <strong>and</strong> the concentration <strong>of</strong> potassium ions were controlled,to obtain the hydration intermediates which were separated by filtration <strong>and</strong>washed with distilled water, followed by drying at room temperature in a desiccator. Thefinal product, K 2 Ti 6 O 13 fibres, were synthesized by heat treatment <strong>of</strong> intermediate(K 1.33 H 0.67 Ti 4 O 9·H 2 O) at 850 °C in a muffle furnace for 2 h. Fibres had a structure similarto that <strong>of</strong> K 2 Ti 4 O 9 which was used as a precursor [39].
Manufacturing <strong>of</strong> potassium titanate fibres <strong>and</strong> whiskers 33Liu et al. [40] also obtained potassium hexatitanate fibres by the ion exchange approachusing fibrous potassium titanate (K 4 Ti 3 O 8 ) as an initial material. <strong>Synthesis</strong> <strong>of</strong>K 4 Ti 3 O 8 was carried out by mixing TiO 2 with 80 wt. % concentrated KOH solution at220 °C for 2 h under atmospheric pressure. The hydrolytic process was carried out,while controlling the pH value from 10.9 to 12.00, to obtain the hydrolytic intermediatesfrom K 4 Ti 3 O 8 fibres, which next were heated at 610 °C in a muffle furnace for 2 h<strong>and</strong> then fibrous K 2 Ti 6 O 13 was formed. Fibres had an average length <strong>of</strong> 10–30 μm <strong>and</strong>the mean diameter <strong>of</strong> 0.3–1.0 μm.Potassium hexatitanate (K 2 Ti 6 O 13 ) whiskers were also synthesized by the calcination<strong>and</strong> slow cooling method in the Department <strong>of</strong> Chemistry, Inorganic Technology<strong>and</strong> Fuels at the Silesian University <strong>of</strong> Technology. Starting materials were dry K 2 CO 3<strong>and</strong> TiO 2 reagent grade. The molar ratio <strong>of</strong> K 2 O to TiO 2 was 1:6. After being groundin an agate mortar under isopropyl alcohol <strong>and</strong> subsequent drying, platinum crucibleswere filled with the powder mixture <strong>and</strong> heated to 1150 °C at the rate <strong>of</strong> 300 °C·h –1 ina box furnace. After calcination at 1150 °C for 3 h various methods <strong>and</strong> rates <strong>of</strong> coolingwere applied. The mixture containing an excessive amount <strong>of</strong> K 2 CO 3 was alsoexamined (molar ratio K 2 O:TiO 2 = 1:2). The samples <strong>of</strong> such mixture were also heatedto 1150 °C. After 3 h <strong>of</strong> calcinations, these samples were slowly cooled to 950 °C atan adjusted rate <strong>and</strong> quenched in water or treated in distilled boiling water (for 1 or 4 h).Then it was decanted, dried at 50 °C <strong>and</strong> reheated at 1000 °C for 1 h. The residualwater after decantation was checked for the presence <strong>of</strong> potassium ions, by conductingconventional reactions, characteristic <strong>of</strong> K + ions. The samples (K 2 O:TiO 2 = 1:6) calcinedat 1150°C proved that K 2 Ti 6 O 13 final product was created regardless <strong>of</strong> the coolingconditions. A slow cooling rate resulted in more crystalline K 2 Ti 6 O 13 in comparisonwith samples cooled rapidly.Fig. 6. SEM <strong>of</strong> K 2 Ti 6 O 13 whiskers synthesizedby the calcination <strong>and</strong> slow cooling [31]The samples <strong>of</strong> the mixture with an excess <strong>of</strong> K 2 CO 3 after heat treatment at 1150 °C,cooling <strong>and</strong> quenching in water <strong>and</strong> drying, were not homogeneous, they were partiallycompact <strong>and</strong> X-ray amorphous. Secondary heat treatment at 1000 °C causedcrystallization <strong>of</strong> K 2 Ti 6 O 13 , but the crystals had the shape <strong>of</strong> weakly split prisms. Theapplied treatment <strong>of</strong> the samples in boiling water, before secondary heating, contributedto splitting <strong>of</strong> the prisms into single whiskers. The longest K 2 Ti 6 O 13 crystals, up to550 μm long (Fig. 6), were obtained using initial heat treatment <strong>of</strong> the mixture with
34T. ZAREMBA, D. WITKOWSKAexcess <strong>of</strong> K 2 CO 3 at 1150 °C, followed by cooling to 950 °C at the rate <strong>of</strong> 25°C·h –1 ,treatment <strong>of</strong> the sample in boiling water for 4 h <strong>and</strong> subsequent reheating to 1000°Cfor 1 h [31, 33, 34, 43].2.4. Potassium octatitanate K 2 Ti 8 O 17Potassium octatitanate K 2 Ti 8 O 17 possesses a stable tunnel-like structure, i.e. it hasa framework enclosing tunnel structures formed by edge- <strong>and</strong> corner-shared TiO 2 octahedra(Fig. 7) [12]. K 2 Ti 8 O 17 exhibits characteristic properties such as a high thermalinsulating ability, chemical stability <strong>and</strong>, compared with potassium hexatitanate(K 2 Ti 6 O 13 ), high ion conductivity. K 2 Ti 8 O 17 , difficult to obtain, may be used as a novelfunctional material, also as an advanced reinforcement material, for example asa composite or friction material for braking systems.Fig. 7. Idealized crystal structure <strong>of</strong> K 2 Ti 8 O 17One <strong>of</strong> the methods to synthesize K 2 Ti 8 O 17 is the hydrolysis <strong>of</strong> K 2 Ti 4 O 9 . Thestarting material, K 2 Ti 4 O 9 , was obtained by heating a mixture <strong>of</strong> KNO 3 <strong>and</strong> TiO 2 (anatase)in the molar ratio 1:2 at 1000 °C for two days. Then the hydrolysis <strong>of</strong> potassiumtetratitanate was carried out by heating it with H 2 O at 100 °C for three days. Afterthermal treatment <strong>of</strong> KH 3 OTi 4 O 9 previously obtained at 500 °C, potassium octatitanatewas formed [12].Fibrous octatitanate (K 2 Ti 8 O 17 ) was obtained from fibres <strong>of</strong> K 2 Ti 4 O 9 , which were fabricatedby melting <strong>of</strong> a mixture <strong>of</strong> TiO 2 <strong>and</strong> KCl (molar ratio 3:1) with addition <strong>of</strong> fluxK 2 MoO 4 at 1100 °C. Then the mixture was cooled slowly at the rate <strong>of</strong> 4 °C·min –1 . Nextfibrous K 2 Ti 4 O 9 was converted into a protonated form by treatment with HCl aqueoussolution. The resulting product, H 2 Ti 4 O 9·nH 2 O, was dried <strong>and</strong> shaken with a mixedsolution <strong>of</strong> KCl <strong>and</strong> KOH to obtain KHTi 4 O 9·0.5H 2 O, which next was dehydrated byheating at 500 °C. The final product was fibrous K 2 Ti 8 O 17 with fibres 0.5–1.0 mmlong <strong>and</strong> 0.01–0.03 mm thick [42].Whiskers <strong>of</strong> potassium octatitanate were fabricated by thermal treatment <strong>of</strong>KHTi 4 O 9 ⋅nH 2 O, which was prepared by exchanging one-half <strong>of</strong> the K + ions in fibrousK 2 Ti 4 O 9 with H + ions using aqueous HCl. Pure KHTi 4 O 9 was obtained by treating <strong>of</strong>K 2 Ti 4 O 9 with 0.005 M HCl for 30 min. The thermal treatment at temperatures rangingfrom 250 °C to 500 °C for 3h, however, enables obtaining only K 2 Ti 8 O 17 . This com-
Manufacturing <strong>of</strong> potassium titanate fibres <strong>and</strong> whiskers 35pound was decomposed above 600 °C to K 2 Ti 6 O 13 <strong>and</strong> TiO 2 . The average length <strong>and</strong>diameter <strong>of</strong> the K 2 Ti 8 O 17 whiskers were 125 <strong>and</strong> 1 μm, respectively [41].In a similar way, He et al. [39] synthesized K 2 Ti 8 O 17 fibres by ion exchange, startingfrom potassium tetratitanate (K 2 Ti 4 O 9 ) fibres. To obtain K 2 Ti 4 O 9 , dried mixture <strong>of</strong>K 2 CO 3 <strong>and</strong> hydrous titania (TiO 2 ⋅nH 2 O), in a molar ratio TiO 2 /K 2 O <strong>of</strong> 3.0, was sinteredin a muffle furnace at 960 °C for 10 h. The so-produced, fibrous K 2 Ti 4 O 9 wasvigorously stirred under water while 1 M HCl was introduced continuously. pH value<strong>of</strong> the resulting solution was 0.5. The hydration intermediate was then filtered, washedwith distilled water <strong>and</strong> dried at room temperature in a desiccator. The further thermaltreatment at 500 °C for 2 h produced fibres <strong>of</strong> K 2 Ti 8 O 17 <strong>of</strong> the diameter <strong>of</strong> 0.2–1 μm<strong>and</strong> 10–30 μm long.In the Department <strong>of</strong> Chemistry, Inorganic Technology <strong>and</strong> Fuels, Silesian University<strong>of</strong> Technology, a research aimed at identifying possible routes <strong>of</strong> synthesis <strong>of</strong>potassium octatitanate was conducted [43]. It was carried out by two methods: solidstate reaction (conventional) <strong>and</strong> ion-exchange reaction. In the former case, a mixture<strong>of</strong> starting materials (K 2 CO 3 <strong>and</strong> TiO 2 ) was subject to thermal treatment in two separateways: one method was based on gradual linear heating <strong>of</strong> the precursors right upto the target temperature, at which calcinations were promptly aborted, <strong>and</strong> the otherwas based on isothermal processing <strong>of</strong> the precursors for a specified time period.Next, the samples were dried <strong>and</strong> heated at 400–700 °C. Obtaining <strong>of</strong> K 2 Ti 8 O 17 by aconventional method was not possible, pure K 2 Ti 8 O 17 could be synthesized, however,using the method based on ion-exchange reaction. Samples <strong>of</strong> K 2 Ti 4 O 9 were treatedwith hydrochloric acid to remove potassium ions from the structure. Next, the sampleswere heated in the temperature range 400–500 °C. The shape <strong>of</strong> the obtained K 2 Ti 8 O 17crystals was the same as the primary shape <strong>of</strong> K 2 Ti 4 O 9 crystals. The experiment confirmedthat K 2 Ti 8 O 17 decomposes above 600 °C.3. Nano potassium titanateIn the past decade, the design <strong>and</strong> fabrication <strong>of</strong> nanostructures (structures with one <strong>of</strong>the characteristic sizes not exceeding 100 nm) based on metal oxides has attracted muchattention because <strong>of</strong> their unique physical, mechanical <strong>and</strong> chemical properties <strong>and</strong> theirpotential applications in nanodevices. Nan<strong>of</strong>ibres, nanorods, nanotubes <strong>and</strong> nanowiresbased on alkali metal titanates have been widely used as semiconductors in dye-sensitizedsolar cells, water treatment materials, catalysts, photocatalysts, gas sensors, nanoelectronic<strong>and</strong> optoelectronic nanodevices [44, 45].K 2 Ti 6 O 13 nanowires were synthesized by a simple hydrothermal reaction betweenNa 2 Ti 3 O 7 <strong>and</strong> KOH. Sodium trititanate was made by solid state reaction at 1000 °Cusing Na 2 CO 3 <strong>and</strong> TiO 2 (anatase) as raw materials. Then aqueous solution <strong>of</strong> KOH orKCl (concentrations from 3 to 10 M) was introduced to the Na 2 Ti 3 O 7 <strong>and</strong> the obtainedpaste was heated in a furnace at 150–250 °C for 24–72 h. A large quantity <strong>of</strong>
36T. ZAREMBA, D. WITKOWSKAnanowires, with the uniform diameter around 10 nm <strong>and</strong> the length ranging from severalhundred to several thous<strong>and</strong> nanometers, were obtained by using 10 M KOH <strong>and</strong>heating the mixture at 200 °C for 72 h. A lower heating temperature (150 °C) resultedin low quantity <strong>of</strong> nanowires, while at a higher temperature (250 °C) the nanowireswere shorter. For comparison, 3 M KOH or KCl solutions were used for the reaction<strong>and</strong> the results obtained were similar [46].Potassium hexatitanate nanowires were fabricated by the hydrothermal synthesisunder supercritical conditions using a plug-flow reactor. The starting materials, sols <strong>of</strong>titanium hydroxide <strong>and</strong> potassium hydroxide, were prepared by mixing these materialsinto distilled water. Concentration <strong>of</strong> titanium ion was 0.02 M <strong>and</strong> concentration <strong>of</strong>potassium hydroxide was varied in the range <strong>of</strong> 0.002–0.4 M. Reactants <strong>and</strong> the preheateddistilled water were supplied to the reactor <strong>and</strong> mixed, <strong>and</strong> then heated rapidly(to 350, 400 <strong>and</strong> 420 °C). Residence time was 2–3 s under the pressure <strong>of</strong> 30 MPa.The resulting product was dried in an oven at 60 °C for 24 h. Well crystallizednanowires 10 nm in diameter <strong>and</strong> the length ranging from 500 to 1000 nm were obtainedat 400 °C under 30 MPa. In comparison with the conventional hydrothermalmethod which proceeds for several hours, this method enables fabrication <strong>of</strong> nanoscaledpotassium hexatitanate particles, even at nearly the same temperature <strong>and</strong> pressure,since the reaction time is limited to the order <strong>of</strong> several seconds [47].Titanate nanowires <strong>of</strong> K 2 Ti 8 O 17 were synthesized hydrothermally via a reaction <strong>of</strong>titania particles <strong>and</strong> KOH solution (the concentration <strong>of</strong> KOH solution was in therange <strong>of</strong> 4–25 M). Hydrothermal treatment was carried out in a teflon-lined autoclavefor one or two days in the temperature range <strong>of</strong> 130–240 °C. The nanowires were almostuniform with the diameter <strong>of</strong> 5–10 nm <strong>and</strong> the length in the range from severalmicrometers to several tens micrometers. During calcination in a conventional muffleabove 600 °C, K 2 Ti 8 O 17 nanowires tend to decompose to K 2 Ti 6 O 13 <strong>and</strong> TiO 2 [48, 49].K 2 Ti 8 O 17 nanowires have also been prepared in a one-step hydrothermal reactionbetween pure Ti <strong>and</strong> KOH solution. In a typical experiment, commercially availableTiO 2 powder was added to 20 ml <strong>of</strong> ca. 1 M aqueous solution <strong>of</strong> KOH. Then the mixturewas heated in a sealed autoclave at 200 °C for 3 days. After heating, the productswere filtered <strong>and</strong> washed with deionized water. Nanowires were the final product. Inanother experiment, instead <strong>of</strong> Ti powder, Ti plates were used. During the process thewhole Ti plate was consumed. The product was a brown coloured block composed <strong>of</strong>layered structures with a lot <strong>of</strong> open pores. The layers consisted <strong>of</strong> nanowires. Thelength <strong>of</strong> the nanowires ranged from several hundred nanometres to more than 8 μm<strong>and</strong> the diameter was around 40 nm [50].Alkali titanate nanorods (K 2 Ti 8 O 17 <strong>and</strong> Na 2 Ti 3 O 7 ) were fabricated by the hydrothermalsynthesis. 1.5 M HCl was used to adjust pH <strong>of</strong> distilled water to 2. Titaniumtetrachloride (TiCl 4 ) was then dissolved in 30 ml <strong>of</strong> acid solution to get a concentration<strong>of</strong> 0.04 M, to which 10 ml, 25 M AOH (A = Na <strong>and</strong> K) aqueous solution wasadded. The mixture was stirred for 10 min <strong>and</strong> then transferred into a Teflon-linedstainless autoclave, sealed <strong>and</strong> maintained at 180 °C for 48 h. The product obtained
Manufacturing <strong>of</strong> potassium titanate fibres <strong>and</strong> whiskers 37was thoroughly washed with distilled water until all the chloride was removed, <strong>and</strong>finally dried at 60 °C for 3 h. Sodium <strong>and</strong> potassium titanate nanorods had averagediameters <strong>of</strong> 50 nm <strong>and</strong> 30 nm, respectively, with the lengths <strong>of</strong> up to several micrometers[51].4. Influence <strong>of</strong> inorganic fibres on living organismsPulmonary fibrosis (asbestosis), lung cancer <strong>and</strong> mesothelioma are known to occurafter exposure to asbestos in both humans <strong>and</strong> animals. Therefore, inorganic (manmade)<strong>and</strong> natural fibres have been <strong>of</strong>ten substituted for asbestos. Although numerousinhalation studies demonstrated no significant increase in tumour incidence in animalsexposed to such substitutes, several mineral fibres (refractory ceramic fibres <strong>and</strong> fibreglass) were carcinogenic in rodent chronic inhalation studies. Moreover, in animalintraperitoneal studies, the fibre length <strong>of</strong> asbestos <strong>and</strong> other mineral fibres has beenfound to be one <strong>of</strong> the major descriptors <strong>of</strong> tumorigenicity.Fibre dimension, durability, chemical composition <strong>and</strong> surface properties arethought to be important factors in the evaluation <strong>of</strong> potential fibre toxicity. Fibre diameteris a critical determinant <strong>of</strong> respirability. Respirable fibres have a mass medianaerodynamic diameter not higher than 3.5 μm, the length over 5 μm <strong>and</strong> the ratio <strong>of</strong>the length to diameter <strong>of</strong> over 3 [52].A variety <strong>of</strong> inorganic fibres such as mineral wool, continuous filament, superfine<strong>and</strong> refractory or ceramic MMMF are known as man-made mineral fibres (MMMF).The names <strong>of</strong> these classes <strong>of</strong> materials have different origins <strong>and</strong> are not necessarilymutually exclusive.4.1. Influence <strong>of</strong> ceramic fibres on living organismsCeramic fibres comprise a wide range <strong>of</strong> amorphous or crystalline synthetic mineralfibres characterized by their refractory properties (i.e., stability at high temperatures).They are typically made <strong>of</strong> alumina, silica <strong>and</strong> other metal oxides, or lesscommonly <strong>of</strong> nonoxide materials such as silicon carbide. Since there are several types<strong>of</strong> ceramic fibres there is also a range <strong>of</strong> chemical <strong>and</strong> physical properties [53]. Theirtrade names are Zirlane, Kerlane, Pyronap, Keronap, Kaowoll, Fibrefrax, Pyroblok,Cartolane, Fibremax, Mattec, Saffil, Rubill, Nextel, aluminosilicate, aluminium oxidesilicate, aluminium silicom polder, DOT, ceramic fibre, cyanite, Disthene, Kaopolite,Kyanite, Mullite, Oil-Dri, SafeN-Dri, Silicotic, Acid Aluminium Salt, Snow Tex, UN1389, Valfor, Fybex, MAN, PKT, Langfaster, Thermowool [53].The primary route <strong>of</strong> potential human exposure to ceramic fibres is by inhalation,mainly during manufacture <strong>and</strong> formation, especially in the workplace. The workplacepopulation is exposed to potential contact with ceramic fibres mainly in the manufacturingenvironment, during installation, <strong>and</strong> during removal. Epidemiological research
38T. ZAREMBA, D. WITKOWSKAon relatively large populations exposed to ceramic fibres strongly suggests that thesefibres can act as skin irritants as well as eye irritants, affecting the conjunctiva <strong>and</strong>possibly causing focal pleura fibrosis. At present, such research has not provided convincingpro<strong>of</strong> which indicates that there is a growing risk <strong>of</strong> tumour illness associatedwith these fibres. This viewpoint is based upon consideration <strong>of</strong> a relatively short period<strong>of</strong> exposure, as well as from the fact that a significant proportion <strong>of</strong> employeesworking in this industry was exposed to asbestos previously [53–57].Results <strong>of</strong> experimental research carried out on laboratory animals (rats <strong>and</strong> hamsters)exposed via inhalation to ceramic fibres or on animals that had been given ceramicfibres via surgical implantation in trachea indicate that some ceramic fibres caninduce tumours <strong>of</strong> lungs (adenomas <strong>and</strong> cancers) <strong>and</strong> pleura (mesotheliomas). Tumours<strong>of</strong> lungs <strong>and</strong> pleura occurred principally in single animals, the number <strong>of</strong> diseasedanimals was linked to the concentration (or dose) <strong>of</strong> fibres relative to the duration<strong>of</strong> exposure. Also, some kinds <strong>of</strong> fibres that had been inserted directly into bodycavities (pleural or abdominal) did induce tumours – mesotheliomas. Research on thesolubility <strong>of</strong> the fibres has not provided convincing data that those fibres <strong>of</strong> low solubilityare strongly carcinogenic influence [53–57].Results from numerous studies lead to the conclusion that basically all types <strong>of</strong>elongated dust particles can induce tumours if they are sufficiently long, thin <strong>and</strong> durablein the tissue [54].Experts at the International Agency for Research on Cancer (IARC) maintain thata documentary evidence <strong>of</strong> the results <strong>of</strong> experimental research on animals does exist,showing that ceramic fibres do have a carcinogenic influence. However, there is noinformation about the carcinogenic influence <strong>of</strong> ceramic fibres on humans. Thus, accordingto the IARC, they have been classified to group 2B, this is possibly carcinogenicto humans [58]. However, experts at the European Union have classified refractoryceramic fibres for special purposes, for substances <strong>of</strong> category 2, this is forsubstances investigated as carcinogenic for humans with attributed expression R49which can cause cancer in repercussion <strong>of</strong> exposing respiratory tract [58].4.2. Influence <strong>of</strong> titanate fibres <strong>and</strong> whiskers on living organismsIt is well known that the inhalation <strong>of</strong> asbestos in the working environment leadsto pulmonary fibrosis, lung cancer <strong>and</strong> mesothelioma. Various kinds <strong>of</strong> asbestos substitutesare now being produced, but the fibrous nature <strong>of</strong> these substances similar toasbestos, <strong>and</strong> their health effects, are still being investigated. One <strong>of</strong> these substitutesare fibres <strong>and</strong> whiskers <strong>of</strong> potassium octatitanate. These materials have a wide range<strong>of</strong> industrial applications due to their high tensile strength, weight advantage overmetals, <strong>and</strong> stability at high temperatures [59–61].Animal studies, which were carried out in 1981, show that whiskers <strong>of</strong> potassiumoctatitanate which are used in filters, separators <strong>and</strong> catalyst carriers, cause fibrosis,suggesting fibrogenic potential similar to that <strong>of</strong> asbestos [59].
Manufacturing <strong>of</strong> potassium titanate fibres <strong>and</strong> whiskers 39Chronic inhalation toxicity/carcinogenicity studies on fibres <strong>of</strong> potassium octatitante(TISMO) have been carried out in the last few years on rats. Fibre dimensionwas mostly lower than 50 μm in length <strong>and</strong> lower than 2 μm in width. Rats were exposedvia whole-body inhalation <strong>of</strong> fibres in concentrations <strong>of</strong> 0, 20, 60, or 200 fibres/cm3 6 h/day, 5 day/week for 24 months. Some rats were killed after 3, 6, 12, 18<strong>and</strong> 24 months <strong>of</strong> exposure for lung damage evaluations. Other rats were removedfrom the exposure after 6 months <strong>and</strong> then from this group 6 rats were killed at 3, 6, 9,12 <strong>and</strong> 18 months later to study lung clearance. Results <strong>of</strong> studies have shown thatthere were no abnormalities in the fibre retention <strong>and</strong> the lung clearance rate. Therewas only negligible macrophage response to TISMO at 20 fibres/cm 3 exposure. Also,sometimes minimal collagenized pulmonary fibrosis was found at 60 or 200 fibres/cm3 for 24 month inhalation exposure, but neither pulmonary neoplasm nor pleuralmesotheliomas were present [62].Also a study was carried out <strong>of</strong> airborne concentration <strong>and</strong> the exposure-relatedpotential hazard <strong>of</strong> potassium octatitanate fibres (TISMO). The airborne fibres weremeasured at 14 designated production workplaces once a year for a period <strong>of</strong> 2 daysfrom 1994 to 1999. A health hazard evaluation was carried out on 27 current employees<strong>and</strong> 18 former employees. The average employment <strong>of</strong> the current employees was7.6 years while that <strong>of</strong> the former was 5.9 years. In 1994, the fibre concentrationsranged from 0.2 to 1.6 fibres/cm 3 <strong>and</strong> decreased to 0.10–0.14 fibres/cm 3 in 1999.There were no exposure-related abnormalities in both pulmonary function <strong>and</strong> radiolographicscreening in the fibres found in production workers. Based on the animalexperiments <strong>and</strong> medical surveys on workers, exposure to fibre concentrations nothigher than 1 fibre/cm 3 would not constitute a significant health hazard to humans inthe workplace [62].In 2005, the WHO Workshop on Mechanism <strong>of</strong> Fibre Carcinogenesis <strong>and</strong> Assessment<strong>of</strong> Chrysotile Asbestos Substitutes considered that respirable potassium octatitanatefibres are likely to pose a great hazard to humans after inhalation exposure [63].References[1] HONGU T., PHILLIPS G.O., New fibres, Woodhead Publ. Ltd, Cambridge, 1997.[2] SCHWARTZ M. M., H<strong>and</strong>book <strong>of</strong> structural ceramics, McGraw-Hill, Inc., New York, 1992.[3] COOKE T.F., J. Am. Ceram. Soc., 74 (1991), 2959.[4] WILCZEWSKA T., Materiały ogniotrwałe, 2 (1994), 66 (in Polish).[5] JANES R., KINGHTLEY L.J., J. Mater. Sci., 39 (2004), 2589.[6] MASAKI N., UCHIDA S., YAMANE H., SATO T., Chem. Mater., 14 (2002), 419.[7] BAMBERGER C.E., BEGUN G.M., MACDOUGALL C.S., Appl. Spectrosc., 44 (1990), 30.[8] REID A.F., WATTS J.A., J. Solid State Chem., 1 (1970), 310.[9] KAZAMATA, TAKASHI, INOUNE, TSUNEO, HIROTA, EIICHI, US Patent 4,064,224 (1977).[10] SHIMIZU, TADAO, HASHIMOTO, KOSHIRO, YANAGIDA, HIROAKI, US Patent 3,952,090 (1976).[11] DION M., PIFFARD Y., TOURNOUX M., J. Inorg. Nucl. Chem., 40 (1978), 917.[12] MARCHAND R., BROHAN L., TOURNOUX M., Mater. Res. Bull., 15 (1980), 1129.[13] WATTS J.A., J. Solid State Chem., 1 (1970), 319.
40T. ZAREMBA, D. WITKOWSKA[14] KENJI A., JP Patent 8,049,119 (1996).[15] CLEARFIELD A., LEPTO J., J. Solid State Chem., 73 (1988), 98.[16] LI J.H., NING X.G., YE H.Q., PAN J., FUKUNAGA H., J. Mater. Sci., 32 (1997) 543.[17] LEE J.-K., LEE K.-H., KIM H., J. Mater. Sci., 31 (1996), 5493.[18] BAO N., SHEN L., FENG X., LU X., J. Am. Ceram. Soc., 87 (2004), 326.[19] BAO N., FENG X., LU X., SHEN L., YANAGISAWA K., AIChE J., 50 (2004), 1568.[20] LIU CH., HE M., LU X., ZHANG Q., XU Z., Cryst. Growth Des., 5 (2005), 1399.[21] ANDERSSON S., WADSLEY A.D., Acta Chem. Sc<strong>and</strong>., 15 (1961), 663.[22] BAO N., FENG X., LU X., YANG Z., J. Mater. Sci., 37 (2002), 3035.[23] MASAKI N., UCHIDA S., YAMANE H., SATO T., J. Mater. Sci., 37 (2000) 3307.[24] TERASAKI K., SHIMIZU T., IGARASHI K., J. Ceram. Soc. Japan, 111 (2003), 461.[25] KANG S.O., JANG H.S., KIM Y.I., KIM K.B., JUNG M.J., Mater. Lett., 61 (2007), 473.[26] ANDERSEN E.K., ANDERSEN G.K., SKOU E., Solid State Ionic, 27 (1988), 181.[27] JUNG K.T., SHUL Y.G., MOON J.K., JUNG S.Y., PARK W.Z., OH W.Z., J. Mater. Sci. Lett., 17 (1998),1045.[28] FUJIKI, YOSHINORI, US Patent 4, 390 (1983), 513.[29] ZAREMBA T., HADRYŚ A., J. Mater. Sci., 39 (2004), 4561.[30] ZAREMBA T., J. Therm. Anal. Cal., 91 (2008), 911.[31] ZAREMBA T., KRZĄKAŁA A., Pol. J. Chem. Tech., 8 (2006) 54.[32] ZAREMBA T., 9 th European Symposium on Thermal Analysis <strong>and</strong> Calorimetry ESTAC 9, Cracow,27–31 August 2006, Book <strong>of</strong> Abstracts, 289.[33] WANG B., SHI Y., XUE D., J. Solid State Chem., 180 (2007), 1028.[34] LIU CH., LU X., YU G., FENG X., ZHANG Q., XU Z., Mater. Chem. Phys., 94 (2005), 401.[35] XIE J., LU X., ZHU Y., LIU CH., BAO N., FENG X., J. Mater. Sci., 38 (2003), 3641.[36] CHOY J.-H., HAN Y.-S., Mater. Lett., 34 (1998), 111.[37] YOKOYAMA M., OTA T., YAMAI I., J. Mater. Sci. Lett., 13 (1994), 369.[38] YAHYA R.B., EBINA T., HAYASHI H., NAGASE T., OODERA Y., SAITHO N., Chem. Mater., 13 (2001),842.[39] HE M., FENG X., LU X., JI X., LIU CH., BAO N., XIE J., J. Mater. Sci., 39 (2004), 3745.[40] LIU Y., QI T., ZHANG Y., Mater. Res. Bull., 42 (2007), 40.[41] LEE C.-T., UM M.-H., KUMAZAWA H., J. Am. Ceram. Soc., 83 (2000), 1098.[42] SASAKI T., FUJIKI Y., J. Solid State Chem., 83 (1989), 45.[43] ZAREMBA T., WITKOWSKA D., Polish Ceramic Bull., 103 (2008), 789 (in Polish).[44] MENG X., WANG D., LIU J., ZHANG S., Mater. Res. Bull., 39 (2004) 2163.[45] PAVASUPREE S., SUZUKI Y., YOSHIKAWA S., KAWAHATA R., J. Solid State Chem., 178 (2005), 3110.[46] WANG B.L., CHEN Q., WANG R.H., PENG L.-M., Chem. Phys. Lett., 376 (2003), 726.[47] HAKUTA Y., HAYASHI H., ARAI K., J. Mater. Sci., 39 (2004), 4977.[48] YUAN Z.-Y., SU B.-L., Coll. Surf. A: Physicochem. Eng. Aspects, 241 (2004), 173.[49] YUAN Z.-Y., ZHANG X.-B., SU B.-L., Mater. Sci. & Proc. Appl. Phys. A, 78 (2004), 1063.[50] WANG B.L., CHEN Q., HU J., LI H., HU Y.F., PENG L.-M., Chem. Phys. Lett., 406 (2005), 95.[51] SONG H., JIANG H., LIU T., LIU X., MENG G., Mater. Res. Bull., 42 (2007), 334.[52] OYABU T., YAMATO H., OGAMI A., MORIMOTO Y., AKIYAMA I., ISHIMATSU S., HORI H., TANAKA I.,J. Occup. Health, 46 (2004), 382.[53] IARC Monographs on the Evaluation <strong>of</strong> Carcinogenic Risks to Humans. Man-made Mineral Fibres<strong>and</strong> Radon, Lyon, 43 (1988), 39.[54] STEENLAND K., STAYNER L., Cancer Cause, Control, 8 (1997), 491.[55] OHYAMA M., OTAKE T., MORINAGA K., Environ. Health Persp., 109 (2001), 1033.[56] TANAKA I., YAMATO H., OYABU T., OGAMI A., Ind. Health, 39 (2001), 114.[57] ADAXHI S., KAWAMURA K., TAKEMOTO K., Ind. Health, 39 (2001), 168.[58] IARC Man-made Mineral Fibres. Summary <strong>and</strong> Evaluation 81 (2002).
Manufacturing <strong>of</strong> potassium titanate fibres <strong>and</strong> whiskers 41[59] DING L., MORIMOTO Y., OYABU T., KIM H., OHGAMI A., YATERA K., HIROHASHI M., YAMATO H.,HORI H., HIGASHI T., TANAKA I., J. Occup. Health, 43 (2001), 111.[60] WATANABE M., SHIBATA K., OKADA M., KUDO Y., NIITSUYA M., SATOH T., KOTANI M., AIZAWAY.,J. Occup. Health, 44 (2002), 321.[61] ISHIHARA Y., KYONO H., KOHYAMA N., OTAKI N., SERITA F., TOYA T., Inhal. Toxicol., 14 (2002),503.[62] IKEGAMI T., TANAKA A.K., TANIGUCHI M., CLARK M.L., RAGAN H.A., MAST T.J., LEE K.P., Inhal.Toxicol., 16 (2004), 291.[63] WHO Workshop on Mechanisms <strong>of</strong> Fibre Carcinogenesis <strong>and</strong> Assessment <strong>of</strong> Chrysotile AsbestosSubstitutes (Summary Consensus Report), Lyon 8–12 November 2005).Received 10 March 2008Revised 9 September 2009
Materials Science-Pol<strong>and</strong>, Vol. 28, No. 1, 2010Electronic mechanism <strong>of</strong> dehydrogenation<strong>of</strong> the Mg–Ge mixture during milling under hydrogenD.W. ZHOU 1* , J.S. LIU 2 , J. ZHANG 1 , Z.G. HUANG 1 , P. PENG 21 State Key Laboratory <strong>of</strong> Advanced Design <strong>and</strong> Manufacturing for Vehicle Body,Hunan University, Changsha, 410082, China2 School <strong>of</strong> Materials Science <strong>and</strong> Engineering, Hunan University, Changsha 410082, ChinaThe energy <strong>and</strong> electronic structure <strong>of</strong> the hydride phase are calculated by using the first-principlesplane-wave pseudopotential method to explain experimental results <strong>of</strong> milling <strong>of</strong> a Mg–Ge mixture underhydrogen. The electronic mechanism <strong>of</strong> dehydrogenation <strong>of</strong> the Ge alloying system is also considered. Bycalculating heats <strong>of</strong> formation <strong>of</strong> MgH 2 <strong>and</strong> (MgGe)H 2 solid solutions, it is found that the structural stability<strong>of</strong> the alloying system is reduced when a little Ge dissolves in MgH 2 . As the Ge content increases,Mg 2 Ge may be formed by the reaction: 2MgH 2 + Ge ↔ Mg 2 Ge + 2H 2 , at the same time, the dehydrogenatingproperties <strong>of</strong> the system are improved compared with that <strong>of</strong> MgH 2 , but are reduced by contrastwith that <strong>of</strong> (MgGe)H 2 solid solutions. Based on the analysis <strong>of</strong> the densities <strong>of</strong> states (DOS) <strong>of</strong> MgH 2before <strong>and</strong> after Ge alloying, it is found that the improvement <strong>of</strong> the dehydrogenating properties <strong>of</strong> MgH 2dissolved into a little Ge is attributed to the weakened bonding between magnesium <strong>and</strong> hydrogen causedby the interactions between Ge <strong>and</strong> Mg.Keywords: Mg–Ge mixture; heat <strong>of</strong> formation; electronic structure; first-principles calculation1. IntroductionNowadays, many efforts have been made to develop hydrogen storage materialsfor non-polluting applications. Magnesium-based hydrogen storage alloys have beenextensively researched, due to their high hydrogen storage capacity, light weight <strong>and</strong>low cost. However, the slow hydriding <strong>and</strong> dehydrogenating kinetics <strong>and</strong> high dissociationtemperature caused by its relatively high stability limits its practical applicationfor hydrogen storage. The reaction kinetics <strong>of</strong> Mg <strong>and</strong> hydrogen is strongly dependenton the method <strong>of</strong> synthesis <strong>and</strong> the presence <strong>of</strong> additives. Samples can besynthesized by melting, sintering or mechanical milling, each method having its owncharacteristics. In particular, ball milling produces special microstructures, metastablephase, modified surfaces, defects, etc., which generally improve the hydriding_________* Corresponding author, e-mail: ZDWe_mail@yahoo.com.cn
44D.W. ZHOU et al.–dehydrogenating process [1, 2]. Recent experimental investigations [1, 3–10] haveshown that the mechanical alloying <strong>of</strong> MgH 2 <strong>and</strong> 3d elements such as Ni, Co, Mn, Cu,Ti, Fe, V, non-3d elements – Ge, Nb, intermetallic compounds – LaNi 5 , FeTi,ZrFe 1.4 Cr 0.6 , effectively improves the hydriding <strong>and</strong> dehydrogenating kinetics <strong>of</strong> MgH 2at high temperature. In this work, at first, experimental results <strong>of</strong> milling <strong>of</strong> Mg–Gemixture under hydrogen as described by Gennari et al. [5], are introduced, then, theenergy <strong>and</strong> electronic structure <strong>of</strong> the hydride phases are calculated by using the firstprinciplesplane-wave pseudopotential method to explain the experimental resultsfrom Gennari et al., Moreover, the dehydrogenating properties <strong>of</strong> milling the Mg–Gemixture under hydrogen <strong>and</strong> the electronic mechanism <strong>of</strong> the Ge alloying system areanalyzed <strong>and</strong> discussed.2. Experimental resultsMg was initially milled for up to 100 h under a hydrogen atmosphere, <strong>and</strong> sequentialXRD patterns were obtained after various milling times with Ge addition, which isthe same method as that used by Gennari et al. [5]. It can be found that the tetragonalβ-MgH 2 <strong>and</strong> orthorhombic γ-MgH 2 were synthesized by RMA <strong>of</strong> Mg after 75 h, <strong>and</strong>the broadening <strong>of</strong> the β-MgH 2 <strong>and</strong> γ-MgH 2 peaks was observed for a milling time <strong>of</strong>between 75 to 100 h.Fig. 1. DSC curves from Mg milled with <strong>and</strong> without Geunder hydrogen atmosphere for different milling timeFigure 1 shows the DSC curves <strong>of</strong> Mg initially milled for up to 100 h under a hydrogenatmosphere. For 75 <strong>and</strong> 100 h <strong>of</strong> milling, the curve shows a double endother-
Dehydrogenation <strong>of</strong> the Mg–Ge mixture during milling 45mic peak located around 400 °C. When Ge (5 at. %) was added to Mg after 100 h <strong>of</strong>RMA, significant structural modifications were observed by Gennari et al. [5]. TheXRD pattern shows that after 5 h <strong>of</strong> milling, compound Mg 2 Ge appears. From theintensity <strong>of</strong> the peaks, the amount <strong>of</strong> Mg 2 Ge increases with the milling time, whereasthe amount <strong>of</strong> Ge decreases. In addition, the DSC curve (Fig. 1) shows a sharp endothermicpeak at 355 °C. Thus, Ge addition decreases the temperature for hydrogendesorption at about 50 °C compared with pure Mg after 100 h <strong>of</strong> RMA.Fig. 2. TDS hydrogen spectra <strong>of</strong> Mg–Ge after RMA for different milling timesThe Mg–Ge mixture was milled under a hydrogen atmosphere for various times.As the milling time increases, the intensity <strong>of</strong> the peaks corresponding to Mg <strong>and</strong> Gedecreases. The Mg 2 Ge <strong>and</strong> β-MgH 2 hydride appear after 5 h <strong>of</strong> milling. The intensity<strong>of</strong> the peaks associated with Mg 2 Ge grows with the milling time, whereas the peakscorresponding to the hydride initially increase <strong>and</strong> then decrease. The TDS spectrathat describe the entire evolution <strong>of</strong> the hydrogen desorption kinetics for between5 <strong>and</strong> 25 h <strong>of</strong> milling are shown in Fig. 2. For 5 to 15 h <strong>of</strong> milling, desorption peaksshift towards lower temperatures. In this range <strong>of</strong> milling time, the amount <strong>of</strong> hydridegrows <strong>and</strong> desorption improves as a consequence <strong>of</strong> better Ge <strong>and</strong> MgH 2 intermixing.After 15 h or more, such as after 20 h, the effect reverses which can be seen in Fig. 2.Desorption begins at higher temperatures. This is a consequence <strong>of</strong> the consumption <strong>of</strong>Ge to form Mg 2 Ge, as can be seen from the XRD patterns given by Gennari et al. [5].After 25 h <strong>of</strong> milling, the amount <strong>of</strong> hydride that remains on the sample is hardly detected.The above experimental results from Gennari et al. [5] show that Ge has an importanteffect on the hydrogen desorption process. This effect is enhanced with the millingtime, probably due to a better Ge intermixing or because a little Ge is dissolved in
46D.W. ZHOU et al.the magnesium hydride. As the Ge content increases, Mg 2 Ge may be formed by thereaction:2MgH 2 + Ge ↔ Mg 2 Ge + 2H 2at the same time the dehydrogenating properties <strong>of</strong> the system are improved comparedwith those <strong>of</strong> MgH 2 , but reduced by contrast with those <strong>of</strong> (MgGe)H 2 solid solutions.However, more effort is needed to explain the experimental results shown in Figs. 1<strong>and</strong> 2. Moreover, electronic mechanism on the dehydrogenating properties <strong>of</strong> Ge alloyingmagnesium hydride is also worth studying.3. Method <strong>and</strong> models <strong>of</strong> computationThe Cambridge Serial Total Energy Package (CASTEP) [11], a first-principlesplane-wave pseudopotentials method, based on density functional theory, was used inthis work. The CASTEP uses a plane-wave basis set for the expansion <strong>of</strong> single particleKohn–Sham wave functions, <strong>and</strong> pseudopotentials to describe the computationallyexpensive electron–ion interaction, in which the exchange-correlation energy with thegeneralized gradient approximation (GGA) <strong>of</strong> Perdew was used for all elements in ourmodels by adopting the Perdew–Burke–Ernzerh<strong>of</strong> parameters [12]. The ultras<strong>of</strong>tpseudopotential, represented in the reciprocal space, was used [13]. In the presentcalculations, the cut<strong>of</strong>f energy <strong>of</strong> atomic wave functions (PWs) E cut , was set at 310 eV.Sampling <strong>of</strong> the irreducible wedge <strong>of</strong> the Brillouin zone was performed with a regularMonkhorst–Pack grid <strong>of</strong> special k-points, in a 6×6×6 configuration. A finite basis setcorrection <strong>and</strong> the Pulay scheme <strong>of</strong> density mixing [14, 15] were applied for theevaluation <strong>of</strong> energy <strong>and</strong> stress. All atomic positions in our model have been relaxedaccording to the total energy <strong>and</strong> force, using the BFGS scheme [16], based on the celloptimization criterion (RMs force <strong>of</strong> 0.05e V/Å, stress <strong>of</strong> 0.1 GPa, <strong>and</strong> displacement<strong>of</strong> 0.002 Å). The calculation <strong>of</strong> the total energy <strong>and</strong> electronic structure are followedby the cell optimization with the SCF tolerance <strong>of</strong> 2.0×10 –6 eV.In this work, the unit cell, super cell model <strong>of</strong> MgH 2 <strong>and</strong> the crystal model <strong>of</strong>Mg 2 Ge are used for studying the dehydrogenating properties <strong>of</strong> milling the Mg–Gemixture under a hydrogen atmosphere <strong>and</strong> for studying the electronic mechanism <strong>of</strong>Ge alloying magnesium hydride. The lattice parameters <strong>of</strong> MgH 2 with a tetragonalsymmetry (P4 2 /mnm, Group No.136) are a = 4.501Å <strong>and</strong> c = 3.010 Å. The positions <strong>of</strong>atoms are + 2Mg(0,0,0) <strong>and</strong> + 4H(0.304,0.304,0), respectively [17], as shown Fig. 3a.Two hypothesised super cells with 3 <strong>and</strong> 5 times in c axis <strong>of</strong> MgH 2 unit cell are shownin Figs. 3b, <strong>and</strong> 3c, respectively. When a little Ge is dissolved in MgH 2 , it is thoughtthat (MgGe)H 2 solid solutions are formed. As far as the solution concentration <strong>of</strong> Gein MgH 2 is concerned, one Mg atom in threefold unit cell (Fig. 3b) or fivefold unit cell(Fig. 3c) is replaced by Ge atoms. Therefore, the corresponding super cell with Geadditions is (Mg 5 Ge)H 12 with 8.33 at. % <strong>of</strong> Ge or (Mg 9 Ge)H 20 with 5.0 at. % <strong>of</strong> Ge.
Dehydrogenation <strong>of</strong> the Mg–Ge mixture during milling 47Two Mg atoms in threefold unit cell (Fig. 3b) or fivefold unit cell (Fig. 3c) are replacedby Ge atoms. Hence, the corresponding super cells are (Mg 4 Ge 2 )H 12 with 16.67at. % <strong>of</strong> Ge or (Mg 8 Ge 2 )H 20 with 10.0 at. % <strong>of</strong> Ge.Fig. 3. Model <strong>of</strong> a unit cell <strong>of</strong> MgH 2 phase(a), threefold (b), <strong>and</strong> fivefold unit cells (c)<strong>of</strong> MgH 2 phase, cell <strong>of</strong> Mg 2 Ge (d), where the nonequivalent atoms are denoted by the numbers 1–3The lattice parameters <strong>of</strong> Mg 2 Ge with CaF 2 -type structure (Fm3m, group No. 225)are a = b = c = 6.370 Å. The positions <strong>of</strong> atoms are +8Mg (0.25,0.25,0.25) <strong>and</strong>+4Ge(0,0,0), respectively [18] (Fig. 3d). Hence, the chemical formula <strong>of</strong> Mg 2 Ge crystalcell can be expressed as Mg 8 Ge 4 . Here, it must be pointed out that when the Ge
48D.W. ZHOU et al.content <strong>of</strong> the (MgGe)H 2 solid solution is 20.0 at. %, the following reaction may proceed:2MgH 2 + Ge ↔ Mg 2 Ge + 2H 24. Results from first-principles calculations4.1. Dehydrogenating propertiesThermodynamic aspects <strong>of</strong> formation/decomposition <strong>of</strong> magnesium hydride canbe described by pressure–composition isotherms at a given temperature. The overallreaction <strong>of</strong> hydride formation consists <strong>of</strong> three steps. Firstly, the host metal dissolvessome H atoms to form a solid solution, i.e., α-Mg(H) phase. Secondly, under increasingpressure <strong>of</strong> hydrogen or oncentration <strong>of</strong> H in the host metal, the interactions betweenH atoms locally strengthen <strong>and</strong> lead to nucleation <strong>and</strong> growth <strong>of</strong> the tetragonalβ-MgH 2 phase. While the two phases <strong>of</strong> α <strong>and</strong> β coexist, the isotherms appear as a flatplateau, their lengths show how many H 2 can be stored with small pressure variations.This plateau or equilibrium pressure depends strongly on temperature <strong>and</strong> is related tothe changes <strong>of</strong> enthalpy (ΔH) <strong>and</strong> <strong>of</strong> entropy(ΔS). Finally, the concentration <strong>of</strong> H inthe host metal shows no further change if the hydrogen pressure continues to increase.The reaction <strong>of</strong> hydride decomposition is opposite to hydride formation, but occurs intime retardation compared with hydride formation. During the second step, it is <strong>of</strong>tenrelated to the equilibrium hydrogen pressure through the van’t H<strong>of</strong>f equation [19]:⎛ Δ Δln P ⎞⎜ ⎟H S = −⎝P0⎠ RT R(1)where P is a flat plateau pressure for decomposition, P° is the st<strong>and</strong>ard pressure(0.1 MPa), ΔH is the heat <strong>of</strong> formation, ΔS is the entropy change, T is temperature <strong>and</strong>R is the gas constant. The entropy change in Eq. (1) is dominated by the entropy loss<strong>of</strong> gaseous hydrogen, roughly 130.8 J/mol [19] for the MgH 2 under consideration.Hence, Eq. (1) can be expressed as⎛ P ⎞∂⎜ln⎟⎝ P°⎠ ΔH=(2)⎛ 1 ⎞ R∂ ⎜ ⎟⎝T⎠From Equation (2), it can be found that ΔH <strong>of</strong> magnesium hydride determines theflat plateau pressure <strong>of</strong> decomposition <strong>of</strong> magnesium hydride at a given temperature.The smaller the heat <strong>of</strong> formation, the lower the pressure is, which indicates the enhanceddehydrogenating properties <strong>of</strong> magnesium hydride [20, 21]. Hence, one need
Dehydrogenation <strong>of</strong> the Mg–Ge mixture during milling 49only concentrate on the heat <strong>of</strong> formation in order to underst<strong>and</strong> the dehydrogenatingproperties <strong>of</strong> magnesium hydride.4.2. Heat <strong>of</strong> formationThe lattice constants <strong>of</strong> Mg 2 Ge, MgH 2 , Ge <strong>and</strong> hcp-Mg are estimated from theminimized total energy (Table 1). It can be found that the lattice parameter a <strong>of</strong>Mg 2 Ge is 6.370Å, which is close to the experimental values (6.3849Å) in Ref. [18],<strong>and</strong> also in agreement with the calculated results (6.309Å [18], 6.12Å [22]). At thesame time, we can calculate that the lattice parameters a <strong>and</strong> c <strong>of</strong> MgH 2 are 4.533 Å<strong>and</strong> 3.022 Å, respectively, which are close to the experimental values <strong>of</strong>a = 4.501 Å <strong>and</strong> c = 3.010 Å in Ref. [17] <strong>and</strong> are also in agreement with the results(a = 4.535Å <strong>and</strong> c = 3.023Å) calculated by Song et al. [20]. Moreover, the calculatedlattice parameters a <strong>and</strong> c <strong>of</strong> hcp-Mg are 3.152 Å <strong>and</strong> 5.435 Å, respectively, which areclose to the experimental values <strong>of</strong> a = 3.211Å <strong>and</strong> c = 5.215Å in Ref. [23]. Hence itcan be concluded that the computational methods used in the present work are indeedeffective.Table 1. Equilibrium lattice constants <strong>and</strong> total energies <strong>of</strong> the crystal <strong>and</strong> super cell modelMaterialLattice parameter [Å]acTotal energy<strong>of</strong> the crystal cell [eV]Total energy<strong>of</strong> the primitive cell [eV]Mg 3.152 5.435 –977.8677Ge 5.658 – –109.2592MgH 2 4.533 3.022 –2020.1572 –1010.07864.533 9.069 –6060.4722MgH 24.533 15.104 –10100.7856(Mg 5 Ge)H 12 4.556 9.218 –5189.0300(Mg 4 Ge 2 )H 12 4.545 9.371 –4317.8333(Mg 9 Ge)H 20 4.543 15.282 –9229.3451(Mg 8 Ge 2 )H 20 4.566 15.378 –8357.9166Mg 8 Ge 4 6.370 – –8263.2466 –2065.8117The heat <strong>of</strong> formation <strong>of</strong> MgH 2 can be calculated from [20]( ) ( ) ( )ΔH = E MgH −E Mg − E H(3)MgH2tot 2 tot tot 2where E tot (MgH 2 ) is the energy <strong>of</strong> the primitive cell <strong>of</strong> MgH 2 , E tot (Mg) is a singleatomic energy <strong>of</strong> hcp-Mg in the solid state, <strong>and</strong> E tot (H 2 ) is the total energy <strong>of</strong> the hydrogenmolecule. The calculation energies <strong>of</strong> Mg atoms are also listed in Table 1 usingthe same code as for the primitive cell model. The total energy <strong>of</strong> the hydrogenmolecule was calculated as –2.320Ry (ca. –31.5652 eV) [24], using the von Barth-Hedin exchange correlation potential. The ΔH(MgH 2 ) value (–62.30 kJ/(mol H 2 )) in
50D.W. ZHOU et al.this work is slightly higher than –73.5 kJ/(mol H 2 ) deduced from the thermodynamicdata at T ≈ 673 K <strong>and</strong> reported by Bogdanovíć et al. [24]. Taking into account that thetemperature <strong>of</strong> computation is different from that <strong>of</strong> the experiment, the present results<strong>of</strong> computation should be suitable.The heat <strong>of</strong> formation <strong>of</strong> (MgGe)H 2 solid solution is calculated from [25, 26]1ΔH 1= ⎡Etot( Mg6−xGexH12) −( 6 −x) Etot( Mg) − xEtot( Ge) −6Etot( H2)⎤6⎣ ⎦ (4)1ΔH2 = ⎡Etot ( Mg10−xGe xH20 ) −( 10 −x) Etot ( Mg) −xEtot ( Ge) −10Etot( H2) ⎤10⎣ ⎦ (5)Here E tot (Mg 6–x Ge x H 12 ) <strong>and</strong> E tot (Mg 10–x Ge x H 20 ) are the energies <strong>of</strong> three or fiveMgH 2 unit cells with Ge addition, respectively. E tot (Ge) is the energy <strong>of</strong> per Ge atom,X denotes the number <strong>of</strong> atoms replaced by Ge. The total energies <strong>of</strong> the (Mg 5 Ge)H 12 ,(Mg 9 Ge)H 20 , (Mg 4 Ge 2 )H 12 , (Mg 8 Ge 2 )H 20 super cell are calculated <strong>and</strong> the results arealso listed in Table 1. The heat <strong>of</strong> formation <strong>of</strong> (MgGe)H 2 solid solutions, calculatedfrom Eq. (4) <strong>and</strong> Eq. (5), are shown in Fig. 4. When the Ge content changes from 0 to10.0 at. %, the heat <strong>of</strong> formation <strong>of</strong> the system is negative but the absolute valuegradually decreases compared with that <strong>of</strong> MgH 2 . However, when the Ge content isabove 10.0 at. %, its value is positive, which means the system is unstable.Fig. 4. Heat <strong>of</strong> formation <strong>of</strong> MgH 2 <strong>and</strong> (MgGe)H 2The change <strong>of</strong> the energy from the reaction <strong>of</strong>2MgH 2 + Ge ↔ Mg 2 Ge + 2H 2is calculated from [23]
Dehydrogenation <strong>of</strong> the Mg–Ge mixture during milling 511ΔH3 = ⎡Etot ( Mg2Ge) + 2Etot ( H2 ) −2Etot ( MgH2 ) −Etot( Ge)⎤2⎣ ⎦ (6)Here E tot (Mg 2 Ge) is the energy <strong>of</strong> the primitive cell <strong>of</strong> Mg 2 Ge. The calculated energy<strong>of</strong> Mg 2 Ge is listed in Table 1. Its value is 22.9 (kJ/mol H 2 ) from Eq. (6), whichmeans that the amount <strong>of</strong> released heat during the reaction2MgH 2 + Ge ↔ Mg 2 Ge + 2H 2is smaller than 25.5 kJ/mol H 2 <strong>of</strong> (Mg 4 Ge 2 )H 12 solid solutions containing 16.7 % Ge.Hence, as the Ge content increases, Mg 2 Ge may be formed in the above reaction.The parameter ΔE r (Mg 2 Ge) is used to estimate the influence <strong>of</strong> Mg 2 Ge on the dehydrogenatingproperties <strong>of</strong> MgH 2 . It is calculated from [20]:( ) ( ) ( ) ( ) ( )ΔE Mg Ge = E Mg Ge H −10E MgH − 2E Mg Ge + 6EMg (7)r2 tot 8 2 20 tot 2 tot 2 totHere the calculated value <strong>of</strong> ΔE r (Mg 2 Ge) is 69.3 kJ/mol H 2 .4.3. Electronic structureAnalysis <strong>of</strong> the total <strong>and</strong> partial density <strong>of</strong> states (DOS) <strong>of</strong> three- <strong>and</strong> fivefold Gealloying MgH 2 unit cells is performed to underst<strong>and</strong> the electronic mechanisms <strong>of</strong> thechange <strong>of</strong> structural stability. The total <strong>and</strong> partial DOSs <strong>of</strong> Mg 10 H 20 , (Mg 9 Ge)H 20 <strong>and</strong>(Mg 8 Ge 2 )H 20 are plotted in Figs. 5a–c, respectively. The signs <strong>of</strong> Mg, Ge, H atoms areas shown in Fig. 3c. Figure. 5a shows the DOS <strong>of</strong> MgH 2 system without Ge addition. Itis found that the main bonding peaks lie in the energy region between the Fermi energy(E F ) <strong>and</strong> –7.0 eV. The bonding peak between E F <strong>and</strong> –3.0 eV mainly originatesfrom the contribution <strong>of</strong> valence electrons <strong>of</strong> H(s), Mg(p) <strong>and</strong> a few Mg(s) orbitals.The bonding peak between –4.0 eV <strong>and</strong> –3.0 eV corresponds to the interaction betweenH(s) <strong>and</strong> Mg(s) as well as a few Mg(p) electrons. The bonding peak between–7.0 eV <strong>and</strong> –4.0 eV results from the bonding <strong>of</strong> valence electrons <strong>of</strong> H(s) <strong>and</strong> Mg(s).For Ge alloying the MgH 2 unit cell, a distinct difference in DOS between Fig. 5b <strong>and</strong>Fig. 5c can be seen:• Compared with the MgH 2 super cell without Ge addition, the gap between the –2.0e V <strong>and</strong> –1.0 eV in the MgH 2 super cell disappears.• The bonding electron numbers between –2.0 eV <strong>and</strong> 2.0 eV result mainly fromthe presence <strong>of</strong> Ge(s) orbits. For the (Mg 9 Ge)H 20 model, the bonding peaks increasethe contribution <strong>of</strong> a few Mg2(p) <strong>and</strong> H3(s). For the (Mg 8 Ge 2 )H 20 model, not includingthe contribution <strong>of</strong> Mg2(p) <strong>and</strong> H3(s), the bonding peaks increase the contribution<strong>of</strong> valence electrons <strong>of</strong> a few Mg3(p), H1(s) <strong>and</strong> H2(s) orbitals.• For the (Mg 9 Ge)H 20 model, compared with the MgH 2 super cell without Ge addition,the heights <strong>of</strong> the bonding peaks <strong>of</strong> H3 significantly increase between –9.0eV <strong>and</strong>
52D.W. ZHOU et al.–11.0eV, <strong>and</strong> the bonding peaks increase the contribution <strong>of</strong> Ge(s) orbitals. For the(Mg 8 Ge 2 )H 20 model, not including the contribution <strong>of</strong> valence electrons <strong>of</strong> Ge(s), theheight <strong>of</strong> the bonding peaks <strong>of</strong> H3 <strong>and</strong> H1 both significantly increase in the same region.In addition, the height <strong>of</strong> the bonding peaks <strong>of</strong> Mg(s), Mg(p) <strong>and</strong> H(s) decreasenear E F . Hence, when a little Ge dissolves in magnesium hydride, the weakened bondingbetween magnesium <strong>and</strong> hydrogen is caused by the interactions between Ge <strong>and</strong>Mg [20].Fig. 5. Total <strong>and</strong> partial densities <strong>of</strong> states <strong>of</strong>: a) Mg 10 H 20 , b) (Mg 9 Ge)H 20 , c) (Mg 8 Ge 2 )H 204.4. Influence <strong>of</strong> Ge on dehydrogenating properties <strong>of</strong> MgH 2In Section 4.2, it can be found that when the Ge content changes from0 to 10.0 at. %, the heat <strong>of</strong> formation <strong>of</strong> the Ge alloying system is negative but theabsolute value gradually decreases compared with that <strong>of</strong> MgH 2 . However, in case theGe content exceeds 10.0 at. %, its value is positive because the heat <strong>of</strong> formation <strong>of</strong>magnesium hydride determines the flat plateau pressure <strong>of</strong> magnesium hydride decompositionat a given temperature T. The smaller the heat <strong>of</strong> formation, the lower thepressure is. Hence, for Mg–Ge powder mixtures, with increasing milling time, a smallamount <strong>of</strong> Ge are dissolved into MgH 2 to form (MgGe)H 2 solid solutions. Hence, forMg–Ge powder mixtures, as the milling time increases, a small amount <strong>of</strong> Ge is dissolvedin the MgH 2 to form (MgGe)H 2 solid solutions. As the concentration <strong>of</strong> the Gesolution in the MgH 2 lattice increases, the dehydrogenating properties <strong>of</strong> the systemare improved compared with the system without Ge addition, which is in good agree-
Dehydrogenation <strong>of</strong> the Mg–Ge mixture during milling 53ment with the results shown in Fig.1 <strong>and</strong> Fig.2 from the analysis <strong>of</strong> Gennari et al. [5].The value 22.9 (kJ/mol H 2 ) from Eq. (6) is smaller than 25.5 (kJ/mol H 2 ) for(Mg 4 Ge 2 )H 12 solid solutions. Hence, as the Ge content increases, Mg 2 Ge may beformed by the reaction: 2MgH 2 + Ge ↔ Mg 2 Ge + 2H 2 (Fig. 4). As the Ge contentincreases, the dehydrogenating properties <strong>of</strong> the system are improved compared withthose with the system without Ge addition but not as good as those <strong>of</strong> (MgGe)H 2 solidsolutions, which is in good agreement with the results <strong>of</strong> milling for 20 h, as shown inFig. 2 from the analysis <strong>of</strong> Gennari et al. [5]. Moreover, the calculated value forΔE r (Mg 2 Ge) from Eq. (7) is 69.3 kJ/mol H 2 . Since the modified MgH 2 phase is stillthe major phase in the coexistence mixtures <strong>of</strong> two types <strong>of</strong> hydrides: β-MgH 2 <strong>and</strong>Mg 2 Ge [5], which indicates that Mg 2 Ge phase acts as a catalyst, it can therefore reducethe structural stability <strong>of</strong> MgH 2 <strong>and</strong> further improve its dehydrogenating properties,which is in good agreement with the results from the analysis <strong>of</strong> Gennari et al. [5](Fig. 3).5. ConclusionsBased on the experimental results <strong>of</strong> milling the Mg–Ge mixture under a hydrogenatmosphere, as obtained by Gennari et al., the energy <strong>and</strong> electronic structure <strong>of</strong> thehydride phase are calculated by using a first-principles plane-wave pseudopotentialmethod based on the density functional theory. The main conclusions are summarizedas follows: (1) when a little Ge dissolves in magnesium hydride, the structural stability<strong>of</strong> the alloying system is reduced compared with that <strong>of</strong> MgH 2 ; (2) as the Ge contentincreases, Mg 2 Ge may be formed in the reaction: 2MgH 2 + Ge ↔ Mg 2 Ge + 2H 2 , whileat the same time the dehydrogenating properties <strong>of</strong> the system are improved comparedwith that <strong>of</strong> MgH 2 but are reduced by contrast with that <strong>of</strong> (MgGe)H 2 solid solutions;(3) the improvement in the dehydrogenating properties <strong>of</strong> MgH 2 in which a smallquantity <strong>of</strong> Ge is dissolved, results in weakened bonding between magnesium <strong>and</strong>hydrogen caused by the interactions between Ge <strong>and</strong> Mg.AcknowledgementsThe work was supported by the Hunan University basic scientific research <strong>and</strong> operational costs <strong>of</strong>central colleges (No. 531107040038).References[1] LIANG G., HUOT J., BOILY S., SCHULZ R., J. Alloys Compd., 305 (2000), 239.[2] SELVAM P., MOHAPATRA S.K., SONAVANE S.U., JAYARAM R.V., Appl. Catal. B Environ., 49 (2004),251.[3] SHANG C.X., BOUOUDINA M., SONG Y., GUO Z.X., Int J. Hydr. En., 29(2004), 73.[4] AKIBA E., HAYAKAWA H., HUOT J., J. Alloys Compd, 248 (1997), 164.[5] GENNARI F.C., CASTRO F.J., URRETAVIZCAYA G., MEYER G., J. Alloys Compd, 334 (2002), 277.
54D.W. ZHOU et al.[6] TESSIER J.P., PALAU P., HUOT J., SCHULZ R., GUAY D., J. Alloys Compd,376 (2004), 180.[7] LIANG G., HUOT J., BOILY S., VAN N.A., SCHULZ R., J. Alloys Compd., 292 (1999), 247.[8] LIANG G., HUOT J., BOILY S., VAN N.A., SCHULZ R., J. Alloys Compd., 297 (2000), 261.[9] MANDAL P., DUTTA K., RAMAKRISHNA K., SAPRU K., SRIVASTAVA O.N., J. Alloys Compd., 184(1992), 1.[10] WANG P., WANG A.M., DING B.Z., HU Z.Q., J. Alloys Compd, 334 (2002), 243.[11] LINDAN P.L.D., SEGALL M.D., PROBERT M.J., PICKARD C.J., HASNIP P.J., CLARK S.J., PAYNE M.C.,J. Phys: Cond. Matter, 14 (2002), 2717.[12] MARLO M., MILMAN V., Phys. Rev. B, 62 (2000), 2899.[13] VANDERBILT D., Phys. Rev. B, 41 (1990), 7892.[14] HAMMER B., HANSEN L.B., NORKOV J.K., Phys. Rev. B, 59 (1999), 7413.[15] FRANCIS G.P., PAYNE M.C., J. Phys. Cond. Matter, 2 (1990), 4395.[16] MONKHORST H.J., PACK J.D., Phys. Rev. B, 13 (1976), 5188.[17] BORTZ M., BERTHEVILLE B., BÖTTGER G., YVON K., J. Alloys Compd., 287 (1999), L4.[18] GROSCH G.H., RANGE K.J., J. Alloys Compd., 235 (1996), 250.[19] NAKAMURA H., NGUYEN M.D., PETTIFOR D.G., J. Alloys Compd., 281 (1998), 81.[20] SONG Y., GUO Z.X., YANG R., Phys. Rev. B, 69 (2004), 094205.[21] NAMBU T., EZAKI H., YUKAWA H., MORINAGA M., J. Alloys Compd., 293–295 (1999), 213.[22] CORKILL J. L., COHEN M.L., Phys. Rev. B, 48 (1993), 17138.[23] HUOT J., BOILY S., AKIBA E., SCHULZ R., J. Alloys Compd., 280 (1998), 306.[24] BOGDANOVÍC B., BOHMHAMMELK., CHRIST B., REISER A., SCHLICHTE K., VEHLEN R., WOLF U.,J. Alloys Compd., 282 (1999), 84.[25] MEDVEDEVA M.I., GORNOSTYREV Y.N., NOVIKOV D.L., MRYASOV O.N., FREEMAN A.J., Acta Mater.,46 (1998), 3433.[26] SAHU B.R., Mater. Sci. Eng. B, 49, (1997), 74.Received 4 April 2008Revised 24 November 2009
Materials Science-Pol<strong>and</strong>, Vol. 28, No. 1, 2010Influence <strong>of</strong> cenospheres <strong>of</strong> fly ashon the mechanical properties <strong>and</strong> wear <strong>of</strong>permanent moulded eutectic Al–Si alloysN. SURESH 1* , S. VENKATESWARAN 1 , S. SEETHARAMU 21 Department <strong>of</strong> Mechanical Engineering, BMS Institute <strong>of</strong> Technology,Avalahalli, Doddaballapur Main Road, Bangalore-560 064, India2 Central Power Research Institute, Bangalore-560 080, IndiaIn recent years, aluminium matrix composites reinforced with ceramic particulates have attractedconsiderable interest due to their inherent good mechanical properties <strong>and</strong> low cost. In this investigation,composites have been produced with cenospheres <strong>of</strong> fly ash as a reinforcement material <strong>and</strong> eutecticAl–Si alloy as a matrix. Stir casting route has been adopted to disperse cenospheres <strong>of</strong> fly ash (from 1%to 10%) in the Al–Si alloy matrix. The results indicate that with increase the content <strong>of</strong> fly ash, hardness<strong>and</strong> ultimate tensile strength increase by 34.7% <strong>and</strong> 44.3% respectively, while the density decreases by13.2%. The wear loss decreases by 33% at the highest sliding distance. However, percentage elongationshowed only a marginal decrease for various percentages <strong>of</strong> fly ash studied in this investigation.Keywords: metal matrix composites; fly ash; cenospheres; mechanical properties; wear1. IntroductionMetal–matrix composites are materials in which tailored properties are achievedby systematic combinations <strong>of</strong> various constituents [1]. Conventional monolithic materialsgenerally have limitations in terms <strong>of</strong> their strength, stiffness, coefficient <strong>of</strong>expansion, <strong>and</strong> density. Eutectic Al–Si alloy (LM6) is one <strong>of</strong> the commonly used alloysin the non-heat treated condition for automotive engines because <strong>of</strong> its good mechanicalproperties, high strength-to-weight ratio, wear resistance <strong>and</strong> low coefficient<strong>of</strong> expansion. Apart from stress relieving <strong>and</strong> improvement in ductility, heat treatmentdoes not significantly change the properties <strong>of</strong> such alloys [2]. Several authors re-_________* Corresponding author, e-mail: suresh_n59@yahoo.co.in
56N. SURESH et al.ported that particulate reinforced composites exhibit superior mechanical propertiescompared to unreinforced alloys.Particulates such as SiC, TiC, TiB 2 <strong>and</strong> fly ash have been used to reinforce Al alloysto improve their mechanical properties <strong>and</strong> wear resistance [3–8, 16, 17]. In recentyears, the use <strong>of</strong> fly ash as a reinforcement material in Al alloys has been reportedto be desirable from both environmental <strong>and</strong> economic points <strong>of</strong> view due to its availabilityas a low cost waste material [9]. Mahendra et al. [10] reported a higher tensilestrength <strong>and</strong> hardness for Al–4.5% Cu alloy–fly ash based composites. Ramach<strong>and</strong>raet al. [11] in a study on the mechanical properties <strong>of</strong> hypoeutectic Al–Si/Fly ash compositesshowed that an increase in the percentage content <strong>of</strong> fly ash particulates resultsin an increase in the hardness <strong>and</strong> tensile strength but the density decreases as the flyash content increases.Fly ash is a byproduct <strong>of</strong> coal combustion collected from electrostatic precipitators<strong>and</strong> bottom ash at the bottom <strong>of</strong> furnaces. It is a fine-grained, powder material that iscarried <strong>of</strong>f in flue gas <strong>and</strong> usually collected by means <strong>of</strong> electrostatic precipitators, baghousings, or mechanical collection devices such as cyclones. Fly ash obtained fromelectrostatic precipitators varies in size from 5 μm to 75 μm [17]. It consists <strong>of</strong> hollowmicrospheres known as cenospheres which generally float on water in the ash collectionponds. Since the particles solidify in suspension, cenospheres <strong>of</strong> fly ash are generallyspherical in shape <strong>and</strong> more uniform in quality, shape <strong>and</strong> size compared tonormal fly ash. The density <strong>of</strong> cenospheres is 0.6–0.9 g·cm –3 .A detailed study <strong>of</strong> available literature reveals that very few systematic investigationshave been carried out to investigate the influence <strong>of</strong> fly ash particulates, especiallycenospheres, on the mechanical properties <strong>and</strong> wear <strong>of</strong> eutectic Al–Si alloys.In this investigation, an attempt has therefore been made to study the influence <strong>of</strong>cenospheres <strong>of</strong> fly ash on the hardness, density, ultimate tensile stress (UTS), elongation,surface roughness <strong>and</strong> wear <strong>of</strong> eutectic Al–Si alloys.2. ExperimentalMatrix used. Eutectic Al–Si alloy LM6 containing 12.2% Si was used as a matrix.The composition <strong>of</strong> the alloy is given in Table 1.Table 1. Composition <strong>of</strong> LM6 alloy [wt. %] designated as a base alloySi Fe Cu Mn Mg Zn Al12.2 0.32 0.002 0.62 0.065 0.021 BalA typical microphotograph <strong>of</strong> cenospheres <strong>of</strong> fly ash is shown in Fig. 1 <strong>and</strong> thecomposition <strong>of</strong> cenospheres <strong>of</strong> fly ash used in this study is shown in Table 2.
Permanent moulded eutectic Al–Si alloys 57Fig. 1. Typical microphotograph <strong>of</strong> cenospheres <strong>of</strong> fly ashTable 2. Composition <strong>of</strong> cenospheres <strong>of</strong> fly ash [wt. %]Al 2 O 3 SiO 2 Fe 2 O 3 TiO 2 Carbon/LOI29.9 56.92 8.44 2.75 1.99Reinforcement used. Cenospheres <strong>of</strong> fly ash were used as a reinforcement materialin this investigation. They are formed in the temperature range <strong>of</strong> 920–1200 °C [9].The particle size distribution <strong>and</strong> cumulative distribution <strong>of</strong> the cenospheres used inthis study was measured using ASTM st<strong>and</strong>ard sieves [18] <strong>and</strong> is shown in Table 3<strong>and</strong> Fig. 2.Table 3. Results <strong>of</strong> sieve analysis as per ASTM st<strong>and</strong>ardsASTMsieveSieveopening [μm]Cenospheresretained (R)[wt. %]Cumulativecenospheres[wt. %]MultiplierSProductRS12 1700 0.22 0.22 5 1.120 850 1.38 1.6 10 13.830 600 2.12 3.72 20 42.440 425 2.28 6 30 68.450 300 8.34 14.34 40 333.670 212 25.86 40.2 50 1293100 150 50.68 90.88 70 3547.6140 106 7 95.88 100 700200 75 1.44 97.42 140 201.6270 53 0.58 100 200 116PAN PAN 0 100 300 0Total ∑ R = 99.9 ∑ RS = 6317.5The average grain fineness number was computed from the data given in Table 3:∑ RS 6317.563.23R = 99.9=∑
58N. SURESH et al.It was found experimentally that about 75% <strong>of</strong> the cenospheres particles have particlesize in the range <strong>of</strong> 150 to 212 micrometersFig. 2. Retained <strong>and</strong> cumulative % <strong>of</strong> cenospheres vs. particle sizeMelting procedure. 2 kg <strong>of</strong> eutectic Al–Si alloy (LM6) ingots were melted in graphitecrucibles using an electric resistance furnace. When the temperature <strong>of</strong> the moltenalloy reached 850 °C, the crucible containing the melt was taken out for degassing. Fordegassing, hexachloroethane tablets, wrapped in a paper was plunged into the bottom <strong>of</strong>the crucible containing the molten metal <strong>and</strong> held at the bottom using a perforatedplunger, until the bubbling action ceased. The metal was allowed to st<strong>and</strong> for a few minutes<strong>and</strong> the dross from the surface <strong>of</strong> the molten metal was skimmed using a perforatedflat spoon. The temperature <strong>of</strong> the melt was checked using an alumel–chromel thermocouple.The molten metal was cast in a metallic die <strong>of</strong> 147×125×25 mm 3 , which waspre-heated to 200 °C <strong>and</strong> coated with a protective layer <strong>of</strong> china clay, water <strong>and</strong> sodiumsilicate to prevent contamination. The pouring was carried out at 650 °C. In orderto check for reproducibility, three sets <strong>of</strong> castings were poured under identicalconditions.Preparation <strong>of</strong> composites. The melting procedure, indicated above, was adopteduntil degassing <strong>of</strong> the molten metal. After degassing, 5 g (0.0025 wt. %) <strong>of</strong> magnesiumribbons were added to the melt to improve the wettability <strong>of</strong> the particles withthe matrix. A vortex was created by rotation <strong>of</strong> stirrer blades at an optimum speed fora predetermined time period. A vortex forming in the molten metal helps to distributethe reinforcement particles uniformly throughout the matrix. Cenospheres were slowlyadded to the molten metal while continuously stirring with a mechanical stirrer. Onceagain, three sets <strong>of</strong> castings were poured under identical conditions to check for reproducibility.Test procedure. The castings, produced as mentioned above, were taken out <strong>of</strong> thedie, cooled <strong>and</strong> then cut into 5 equal sections along the length from one end to theother as shown in Fig. 3. The samples were then machined to get st<strong>and</strong>ard test specimensfor determining hardness, UTS <strong>and</strong> percentage elongation, surface roughness
Permanent moulded eutectic Al–Si alloys 59<strong>and</strong> slide wear. The densities <strong>of</strong> the samples were determined by the well known Archimedesprinciple.Fig. 3. Casting cut into sections along its lengthHardness. A Brinnel hardness test was conducted on the specimen using a st<strong>and</strong>ardBrinnel hardness tester. A load <strong>of</strong> 500 kg was applied on the specimen for 30 s using a 10mm ball indenter <strong>and</strong> the indentation diameter was measured using a micrometer microscope.The Brinnel hardness number (BHN) was computed using the formula:2PBHN =πD D D d2 2( − − )where P is the load applied, D the diameter <strong>of</strong> the ball indenter <strong>and</strong> d the diameter <strong>of</strong>indentation.Ultimate tensile strength (UTS) <strong>and</strong> elongation. An electronic tensometer <strong>of</strong> theMonsanto type W was used for tensile testing. The tensometer specimen was loadedbetween two grips that were adjusted manually. A constantly increasing force wasapplied to the specimen by electronic means. The load <strong>and</strong> elongation were continuouslyrecorded. The UTS <strong>and</strong> percentage elongation were calculated.Surface roughness. The surface imperfections consist <strong>of</strong> a succession <strong>of</strong> hills <strong>and</strong>valleys which vary both in height <strong>and</strong> spacing. These are measured using a Tally surfinstrument. The surface roughness parameters R a (average roughness value) <strong>and</strong> R q(root mean square roughness) were selected. The stylus was moved over the surface<strong>and</strong> the readings were noted.Dry sliding wear. A dry sliding wear test was conducted at ambient temperatureusing a pin-on-disc wear testing machine with a data acquisition system. Wear wasdetermined by the weight loss method. Specimens <strong>of</strong> 6 mm diameter <strong>and</strong> 20 mm longwere used for the dry sliding wear tests. The wear tests were carried out at a constantsliding velocity <strong>of</strong> 125.6 m·min –1 (500 rpm) for a track radius <strong>of</strong> 40 mm, load <strong>of</strong> 1 kg<strong>and</strong> sliding distances <strong>of</strong> 3768 m, 5652 m <strong>and</strong> 7536 m corresponding to 30, 45 <strong>and</strong>60 min, respectively. A hardened steel disc <strong>of</strong> 60 HRC was used as the counterface.
60N. SURESH et al.3. Results <strong>and</strong> discussion3.1. HardnessFigure 4 shows an increase in hardness with the increase in the percentage <strong>of</strong> cenospheres<strong>of</strong> fly ash, when compared with the unreinforced eutectic Al–Si alloy. For instance,the hardness was found to be 50 BHN for 1% fly ash (an increase <strong>of</strong> 8.6% over thebase alloy) <strong>and</strong> 62 BHN for10% fly ash (an increase <strong>of</strong> 34.7% over the base alloy).Fig. 4. BHN vs. % cenospheres <strong>of</strong> fly ashIt has been reported that addition <strong>of</strong> ceramic particles increases the hardness <strong>of</strong>composites [3, 5–8, 10, 11]. The increase in hardness is expected because <strong>of</strong> the presence<strong>of</strong> ceramic reinforcements which are very hard, <strong>and</strong> act as barriers to the movement<strong>of</strong> dislocations within the matrix <strong>and</strong> exhibit greater resistance to indentation [8].This trend is also observed in our study.3.2. DensityThe density <strong>of</strong> the eutectic alloy was found to be 2.65 g·cm –3 . This is in agreementwith reported literature [2]. The densities <strong>of</strong> the cast composites, at various percentages<strong>of</strong> fly ash are shown in Fig. 5. The scatter <strong>of</strong> three readings was within 2%. It isobserved that the density decreases as the percentage <strong>of</strong> fly ash increases, when comparedwith the unreinforced eutectic Al–Si alloy. For example, the density <strong>of</strong> the compositewas found to be 2.62 g·cm –3 for 1% fly ash (decrease <strong>of</strong> 1.13% compared withLM6. Similarly, the density for 10% fly ash was 2.31 g·cm –3 (decrease <strong>of</strong> 13.2%).Several investigators have reported a similar trend with the addition <strong>of</strong> particulateslike fly ash [10, 11]. This can be attributed to the difference in densities <strong>of</strong> aluminium<strong>and</strong> fly ash.
Permanent moulded eutectic Al–Si alloys 61Fig. 5. Density for varying percentages <strong>of</strong> fly ash3.3. Recovery <strong>of</strong> cenospheresThe recovery <strong>of</strong> cenospheres in the laboratory made Al–Si alloy–cenosphere compositesystem was calculated using the linear interpolation method, taking into accountthe density, volume <strong>of</strong> the alloy as well as <strong>of</strong> cenospheres. Linear interpolation is the simplestmethod <strong>of</strong> reliably estimating values at positions in between the data points [19]. It isobserved that the recovery is 98.5% at 1% addition <strong>and</strong> decreases gradually as thepercentage addition <strong>of</strong> cenospheres increases, as shown in Table 4.Table 4. Recovery <strong>of</strong> cenospheresContent <strong>of</strong> cenospheres [%] 1 3 6 10Recovery [%] 98.5 95.6 93.6 83.43.4. Ultimate tensile strength <strong>and</strong> percentage elongationFigure 6 shows the variation in UTS with the increase in the percentage content <strong>of</strong>fly ash. It was noted that the UTS for 1% fly ash is 158.8 MPa (16.2 kg·mm –2 )(an 8.5% increase over the untreated alloy). Similarly the UTS for 10% fly ash is211 MPa (21.54 kg·mm –2 ) <strong>and</strong> shows an increase <strong>of</strong> 44.3% when compared with theunreinforced eutectic Al–Si alloy (LM6).This could be due to the fact that the lightermicrospheres <strong>of</strong> fly ash act as barriers to the movement <strong>of</strong> dislocation, thereby increasingthe ultimate tensile strength <strong>of</strong> the composite [7].Further, dispersion <strong>of</strong> hard ceramic particles in a s<strong>of</strong>t ductile matrix results in improvementin strength. This may be attributed to large residual stress developed duringsolidification <strong>and</strong> to the generation <strong>of</strong> density <strong>of</strong> dislocations due to mismatch <strong>of</strong>thermal expansion between hard ceramic particles <strong>and</strong> s<strong>of</strong>t Al matrix [16]. The reason
62N. SURESH et al.for the improved strength may perhaps be due to a good bonding between the cenosphereparticles <strong>and</strong> also with the matrix [18]. Thus it can be seen that our results arein agreement with those reported in the literature.Fig. 6. Variation in UTS vs. % cenospheres <strong>of</strong> fly ashFigure 7 shows that there is a marginal decrease in percentage elongation with thepercentage increase in the fly ash. For instance, it can be seen that the elongation for1% fly ash is 2.01%, while the elongation for 10% fly ash is 1.96%. This is in agreementwith literature data [1, 6].Fig. 7. Elongation vs. % cenospheres <strong>of</strong> fly ash3.5. Surface roughnessA review <strong>of</strong> the literature reveals that no investigation seems to have been carriedout to measure the surface roughness. From Figure 8 it is observed that the surfaceroughness increases as the percentage content <strong>of</strong> fly ash cenospheres increases, whencompared with the unreinforced eutectic Al–Si alloy (LM6).
Permanent moulded eutectic Al–Si alloys 63Fig. 8. Average surface roughness vs. % cenospheres <strong>of</strong> fly ashFor instance, R a increases from 0.4 μm for 1% fly ash to 1 μm for 10% fly ash <strong>and</strong>R q increases from 0.3 μm for 1% fly ash to 1.4 μm for 10% fly ash. Cenospheres <strong>of</strong> flyash are extremely hard <strong>and</strong> contain much unburnt carbon [17]. This tends to have anadverse effect on the surface roughness.3.6. WearIn general, it is observed that the wear increases with the increase in time <strong>and</strong> distance.Figure 9 depicts the wear weight loss <strong>of</strong> the composites under different slidingdistances. For instance, the weight loss is 0.06g at a sliding distance <strong>of</strong> 3768m, whilethe weight loss is 0.13g. at 7536m for 1% fly ash. A similar trend is observed for 3, 6<strong>and</strong> 10% fly ash. This is due to the fact that cenospheres are hard, abrasive particles<strong>and</strong> resist wear better than the matrix. It is observed that, for a given sliding distance,the weight loss is lower for a higher percentage <strong>of</strong> fly ash. For example, the weightloss is 0.13g for 1% fly ash <strong>and</strong> 0.1g for 10% fly ash for a sliding distance <strong>of</strong> 7536 m.Similar trends were observed by other researchers [12–16].Fig. 9. Wear at 30, 45 <strong>and</strong> 60 min
64N. SURESH et al.The results shown in Figs. 4–9 indicate that fly ash cenospheres can increasehardness <strong>and</strong> UTS, while reducing density <strong>and</strong> wear. However, the surface roughnessis found to increase, resulting in a poor surface finish, while the percentage elongationshowed only a marginal variation for the various percentages <strong>of</strong> fly ash investigated.4. ConclusionAn attempt has been made to evaluate the effect <strong>of</strong> various percentages <strong>of</strong> cenospheres<strong>of</strong> fly ash on the hardness, density, UTS, ductility, surface finish <strong>and</strong> wear,when compared with the unreinforced eutectic Al–Si alloy (LM6). The results <strong>of</strong> thisinvestigation reveal the following:It is observed that the hardness increases by 8.6% for 1% fly ash <strong>and</strong> by 34.7% for10% fly ash based composite, compared with the base alloy.Density decreases upon increasing percentage <strong>of</strong> fly ash addition. For instance, itdecreases from 1.13% for 1% fly ash to 13.2% for 10% fly ash.The ultimate tensile strength <strong>of</strong> the composite showed an increase ranging from8.5% for 1% cenospheres <strong>of</strong> fly ash to 44.3% for 10% with the addition <strong>of</strong> cenospheres<strong>of</strong> fly ash.The percentage elongation <strong>of</strong> the composite showed only a marginal decrease forthe various percentages <strong>of</strong> fly ash studied in this investigation. It is found to decreasefrom 2.01% for 1% fly ash to 1.96% for 10% fly ash.Sample analysis revealed there was a direct correspondence between the fly ashpercentage <strong>and</strong> the wear loss: the higher the fly ash percentage, the lower the wearloss, <strong>and</strong> vice versa. For instance, the wear loss was found to be 0.1g for 10% fly ashcompared with 0.13g for 1% fly ash for a sliding distance run <strong>of</strong> 7536m.The surface roughness increases with the addition <strong>of</strong> cenospheres <strong>of</strong> fly ash. R a increasesfrom 0.4μm for 1% fly ash to 1μm for 10% fly ash <strong>and</strong> R q increases from0.3μm at 1% fly ash to 1.4μm at 10% fly ash.AcknowledgementsThe authors gratefully acknowledge the support provided by the M/S Central Power Research Institute,Indian Institute <strong>of</strong> Science, Bangalore <strong>and</strong> BMS Educational Trust for providing the facilities <strong>and</strong>technical help for carrying out this work.References[1] ASM H<strong>and</strong>book Composites, ASM Int., 21 (2001) 3.[2] The Foseco Foundryman’s H<strong>and</strong>book, Pergamon Press, Oxford, 1965, p. 110.[3] SINGH M., MONDAL D.P., JHA A.K., DAS S., Composites, Part A, 32 (2001), 787.[4] VENKATESWARAN S., MALLYA R.M., SHESHADRI M.R., Cast Metals, UK, (1991), 72.[5] SARAVANAN R.A., SURAPPA M.K., PRAMILA BAI B.N., Wear, 202 (1997), 154.[6] BENAL M.M., SHIVANAND H.K., MURALIDHARA M.K., Indian Foundry J., 52 (2006), 37.[7] LEE H.S., YEO J.S., HONG S.H., YOON D.J., NA K.H., J. Mat. Proc. Techn., 113 (2001), 202.
Permanent moulded eutectic Al–Si alloys 65[8] WONG W.L.E., GUPTA M., LIM C.Y.H., Mater. Sci. And Eng. A., 423 (2006), 148.[9] NAGESHA, Preparation <strong>of</strong> Al (6061) Fly Ash Composites, B.E. Thesis, Visvesvaraya TechnologicalUniversity, Belgaum, India, 2006.[10] MAHENDRA K.V., RADHAKRISHNA K., Mater. Sci.-Pol<strong>and</strong>, 25 (2007), 57.[11] RAMACHANDRA M., RADHAKRISHNA K., Mater. Sci. Techn. 21 (2005), 1.[12] PRAMILA BAI B.N., BISWAS S.K., Characterization <strong>of</strong> Dry Sliding Wear <strong>of</strong> Aluminum–Silicon Alloys,Elsevier, Sequoia, 1987, p. 61.[13] MURALI T.P., PRASAD S.V., SURAPPA M.K., ROHATGI P.K., Wear, 80 (1982), 149.[14] PRAMILA BAI B.N., RAMASESH B.S., SURAPPA M.K., Wear, 157 (1992), 295.[15] ROHATGI P.K., GUO R.Q., IKSON H., BORCHELT E.J., ASTHANA R., Mater. Sci. Eng. A., 244 (1998),22.[16] SURESH K.R., NIRANJAN H.B., MARTIN JEBARAJ P., CHOWDIAH M.P., Wear, 255 (2003), 638.[17] PRASHANTH T., SHEKAR KUMAR., SURYANARAYAN., Intl. Conf on Advanced Materials <strong>and</strong> CompositesICAMC 2007, 24–27 October, CSIR, Triv<strong>and</strong>rum, India.[18] GUO R.Q., ROHATGI P.K., J. Mater. Sci., 32 (1997), 3971.[19] BOURKE P., Interpolation Methods, December 1999, http:// local.wasp.uwa.edu.au/~pbourke/.Received 28 March 2008Revised 11 September 2009
Materials Science-Pol<strong>and</strong>, Vol. 28, No. 1, 2010Tribological properties <strong>of</strong> oxidation modifiedcarbon fibre–reinforced polyamide 6 compositesW.Z. NIE 1 , J. LI 2 , X.H. SHENG 3*1 School <strong>of</strong> Mechanical <strong>and</strong> Automation Engineering, Shanghai Institute <strong>of</strong> Technology,Shanghai 200235, P.R. China2 School <strong>of</strong> Mechanical <strong>and</strong> Electronic Engineering, Shanghai Second Polytechnic University,Shanghai 201209, P.R. China3 Shanghai Zhuzong Company, Shanghai 200032, P.R. ChinaThe ozone modification method <strong>and</strong> air-oxidation were used for the surface treatment <strong>of</strong> polyacrylonitrile-basedcarbon fibre. The interfacial properties <strong>of</strong> carbon fibre–reinforced polyamide 6 (CF/PA6)composites were investigated by means <strong>of</strong> single fibre pull-out tests. It was found that the IFSS values <strong>of</strong>the composites with ozone treated carbon fibre are increased by 60% compared with that without treatment.The effect <strong>of</strong> surface treatment <strong>of</strong> carbon fibres on the tribological properties <strong>of</strong> CF/PA6 compositeswas also investigated for comparison. Experimental results revealed that surface treatment can effectivelyimprove the interfacial adhesion between carbon fibre <strong>and</strong> PA6 matrix. Thus the wear resistancewas significantly improved.Keywords: ozone; CF/PA6 composite; single fibre pull-out; interfacial adhesion1. IntroductionThe application <strong>of</strong> carbon fibres–polymer composites has been rising during thelast decade, mainly in the car <strong>and</strong> aerospace industry, due to the improvement <strong>of</strong> theelectrical conductivity <strong>and</strong> mechanical stiffness. Polyamide, due to its unusual propertiessuch as good thermal stability, low electric permittivity, high mechanical strength<strong>and</strong> chemical inertness, is becoming a strong competitor <strong>of</strong> matrix in the manufacture<strong>of</strong> advanced composite materials. Fibre-reinforced polyamide matrix composites withhigh performance have especial applications in aerospace, robots, sports goods, etc.Carbon fibres possess exceptional specific strength <strong>and</strong> stiffness, <strong>and</strong> hence they haveimportant applications in structural composites. The performance <strong>of</strong> such compositesdepends on the properties <strong>of</strong> the fibres which depend not only on the type <strong>of</strong>the manu-_________* Corresponding author, e-mail: shengxiaohong2@sina.com
68W.Z. NIE et al.facturing process [1–3] <strong>and</strong> the surrounding matrix, but also on the interface betweenthem [4, 5]. However, as a composite material reinforcement, the full potential <strong>of</strong> carbonfibres has not yet been realized. This is due primarily to fibre–matrix adhesion. Inorder to harness the properties <strong>of</strong> carbon fibres <strong>and</strong> ensure good stress transfer, theremust be adequate adhesion between the fibres <strong>and</strong> the matrix. Consequently, a variety<strong>of</strong> surface treatments <strong>of</strong> carbon fibres are developed such as oxidation, coating, grafting[6–11], etc. All surface treatments enhance the interfacial shear strength (IFSS) byintroducing chemically active groups on the fibre surfaces which increases the reactivitywith the matrix, enhancing surface roughness to produce better mechanical interlockingas well as increasing the surface energy for improved wetting. The ozone modificationmethod is a kind <strong>of</strong> simple <strong>and</strong> efficient method for carbon fibre modification.In this work, the ozone modification method is used for the surface treatment <strong>of</strong>carbon fibre. The purpose <strong>of</strong> this study was to examine the influence <strong>of</strong> ozone surfacetreatment methods on the interfacial adhesion properties <strong>of</strong> CF/PA6 composites <strong>and</strong>the surface characteristics <strong>of</strong> carbon fibre before <strong>and</strong> after treatment. And further researchon ozone modification method is necessary for the application <strong>of</strong> this method.2. ExperimentalMaterials. For the present investigation, the reinforcement materials were continuouspolyacrylonitrile (PAN)-based carbon fibres manufactured by Shanghai SxcarbonTechnology Co. Ltd. prior to use, <strong>and</strong> polyamide-6 supplied by YueYang Juli EngineeringPlastic Co. Hunan with the following properties: tensile strength – 85 MPa,flexural strength – 115 MPa, the density <strong>of</strong> the matrix – 1150 kg/m 3Fibre surface treatment. Oxidation <strong>of</strong> the carbon fibres was carried out at 450 °Cin an oxidation furnace for 10 min. The selected oxidation condition has been provedto be the most effective one for this kind <strong>of</strong> carbon fibre. Ozone surface treatment <strong>of</strong>the carbon fibres was carried out in a XFZ-5BI generator for 3 min [12]. The concentrationwas 10–36 mg/dm 3 .Single fibre pull-out test. A microbond test was performed to evaluate the interfacialshear strength (IFSS) between carbon fibre <strong>and</strong> matrix by pulling out a fibre froma PA6 resin droplet. The composite specimens were prepared by a screw in-line typeinjection moulding machine with the help <strong>of</strong> a special embedding machine, in whichthe fibre can be embedded perpendicular to the surface <strong>of</strong> the matrix globe with a definedembedded length.The sample for the single fibre pull-out measurement is a few millimetres long fibre,partly embedded at one end in a polymer <strong>and</strong> orientated perpendicular to thepolymer surface (Fig. 1). On a metal surface a small amount <strong>of</strong> polymer in the form <strong>of</strong>a hemisphere supported a vertically positioned fibre, which was embedded by usinga special embedding machine [13]. The embedding depth <strong>of</strong> the carbon fibre filamentin the PA6 resin was 105 μm, which is ca.15 times the size <strong>of</strong> the fibre diame-
70W.Z. NIE et al.under each test condition <strong>and</strong> the average values <strong>of</strong> the measured friction coefficient,<strong>and</strong> the specific wear rate were used for further analysis. The worn surfaces <strong>of</strong> CF/PA6composites were investigated with a scanning electron microscope (SEM).Preparation process. The hot moulding technique was employed to fabricate compositespecimens, which is the most common technique for the sintering <strong>of</strong> pure PA6without any sintering aids. In this process, the filler carbon fibres <strong>and</strong> the PA6 werechurned together in a mixer. Mixing was done for a few minutes at the addition <strong>of</strong>each component for about 20 min. Sintering powder (20 vol. % <strong>of</strong> carbon fibres <strong>and</strong>80 vol. % <strong>of</strong> PA6) was placed inside a stainless mould with its inner walls coated witha BN slurry to avoid any interaction between the powder <strong>and</strong> steel <strong>and</strong> also to facilitatethe demoulding process. The compounds were put into the QLB-D170×170 vulcanizingmachine at 280 °C for 1 h under a constant pressure <strong>of</strong> 12 MPa, then heatedfrom 280 °C to 340 °C in 1 h. When the temperature reached 340 °C, it remained constantfor 1 h. Then the compounds were cooled from 340 °C to 200 °C in 70 min. Duringthe whole process, the pressure <strong>of</strong> ozone was constant. The obtained materialswere then cooled to room temperature to get the composites.3. Results <strong>and</strong> discussion3.1. IFSS <strong>of</strong> CF/PA6 compositesFigure 2 shows that the IFSS values <strong>of</strong> the composites with ozone treated carbonfibre are increased by 60% compared with those without treatment. It is proved thatthe better interfacial adhesion can be obtained through surface modification.Fig. 2. IFSS <strong>of</strong> CF/PA6 composites
Tribological properties <strong>of</strong> oxidation modified carbon fibre–reinforced polyamide 6 composites 71The reasons attributed to this is that the ozone treatment is a method to bind oxygenfunctional groups on carbon fibre surfaces, which increase the interlock betweenthe fibre <strong>and</strong> matrix, leading to the increase <strong>of</strong> the IFSS <strong>of</strong> composites, which can effectivelytransfer the stress from matrix to the fibre, thus the fibre can provide morereinforcement. Therefore, the IFSS <strong>of</strong> the composite reinforced by ozone treated carbonfibres are considerably improved.3.2. Friction <strong>and</strong> wear propertiesFigure 3 shows the variation <strong>of</strong> the friction coefficient <strong>of</strong> the CF/PA6 compositeswith load. The friction coefficient <strong>of</strong> all PA6 composites increases as the load increasesfrom 6 N to 15 N under the same reciprocating sliding frequency 8 Hz. Thiscan be explained by the friction-induced thermal <strong>and</strong> mechanical effects, which mayincrease the actual contact area between the frictional pair as the load increases.Changes in the friction coefficient <strong>of</strong> CF/PA6 composites with reciprocating slidingfrequency are shown in Fig. 4. The friction coefficient decreases as the reciprocatingsliding frequency increases from 1 Hz to 12 Hz under the same load <strong>of</strong> 12 N. This wasattributed to the increased s<strong>of</strong>tening <strong>and</strong> plastic deformation <strong>of</strong> the polymer matrixwhich was caused by the increased reciprocating sliding frequency. The ozone treatedCF/PA6 composite exhibits the lowest friction coefficient <strong>and</strong> the untreated PA6 compositeexhibits the highest friction coefficient both under the same reciprocating slidingfrequency (Fig. 3) <strong>and</strong> at the same load (Fig. 4). The modification <strong>of</strong> the carbonfibres strengthens the combination <strong>of</strong> the interface between the fibres <strong>and</strong> the PA6matrix <strong>and</strong> increases the elastic modulus <strong>of</strong> the PA6 composites. This will be the reasonwhy the friction coefficient <strong>of</strong> the modified carbon fibre reinforced PA6 compositesis reduced.Fig. 3. Dependences <strong>of</strong> the friction coefficients on load for the PA6 composites
72W.Z. NIE et al.Fig. 4. Dependences <strong>of</strong> the friction coefficientson reciprocating sliding frequency for the PA6 compositesFig. 5. Specific wear rate <strong>of</strong> PA6 composites under the load <strong>of</strong> 12 N<strong>and</strong> a reciprocating sliding frequency <strong>of</strong> 8 HzFigure 5 gives the specific wear rate <strong>of</strong> three CF/PA6 composites under the load <strong>of</strong>12 N <strong>and</strong> reciprocating sliding frequency <strong>of</strong> 8 Hz. It is seen that the untreated compositehas the highest specific wear rate, while the ozone treated composite has the lowestone. The specific wear rate itself depends on the properties <strong>of</strong> the filler, <strong>of</strong> the matrix<strong>and</strong> <strong>of</strong> the filler/matrix bond strength. In addition, the relative hardness <strong>of</strong> the filler tothat <strong>of</strong> the counterface, the content, shape, size, distribution <strong>and</strong> orientation <strong>of</strong> thefiller, <strong>and</strong> the abrasiveness <strong>of</strong> filler against the matrix are important parameters. In this
Tribological properties <strong>of</strong> oxidation modified carbon fibre–reinforced polyamide 6 composites 73system, the difference <strong>of</strong> specific wear rate mainly comes from the bond strength betweenthe reinforcement <strong>and</strong> the matrix. It can be seen from Fig. 5 that the modification<strong>of</strong> the carbon fibres can improve the wear resistance <strong>of</strong> the PA6 composites, reflectingthe effectiveness <strong>of</strong> the modification <strong>of</strong> the carbon fibres on increasing the combiningstrength <strong>of</strong> the interface between the carbon fibres <strong>and</strong> PA6 matrix. The above experimentalresults reveal that ozone treatment greatly improves the friction-reducing <strong>and</strong>wear-resistance properties <strong>of</strong> PA6 composite under dry sliding conditions.The normal load <strong>and</strong> reciprocating sliding frequency were fixed at 12 N <strong>and</strong> 8 Hz,respectively. SEM images <strong>of</strong> the worn surfaces <strong>of</strong> PA6 composites filled with carbonfibres that had been subjected to different surface treatments are shown in Fig. 6.Fig. 6. SEM photographs <strong>of</strong> the worn surfaces<strong>of</strong> PA6 composites: a) untreated, b) air oxidation,c) ozoneFor the PA6 composite filled with untreated carbon fibres, there are many crackslocated near the carbon fibres, as shown in Fig. 6a. Deep pores exist between carbonfibres <strong>and</strong> PA6 matrix, which indicates that there is a very poor interfacial adhesionbetween the fibre <strong>and</strong> the PA6 matrix. Thus the untreated fibres are more prone to bepeeled <strong>of</strong>f due to the weak interface bonding. The fillers are easily detached from thematrix under the load <strong>of</strong> 12 N leaving cavities whose boundaries are the same shape asthe filler fibres removed. Many cavities within the matrix material structure lead to
74W.Z. NIE et al.stress concentrations in the matrix resulting in higher local stress, microcracking, <strong>and</strong>in consequence a high specific wear rate. Furthermore, the detachment <strong>of</strong> fillers causesthe adjacent matrix to be poorly supported <strong>and</strong> hence is subjected to greater stress <strong>and</strong>thus is more susceptible to fracture. Therefore, the load-carrying capability <strong>of</strong> thecomposite is reduced, resulting in a decrease in the/its wear resistance property.On the worn surfaces <strong>of</strong> the PA6 composites containing the modified fibres, thedamage became weaker, indicating how effectively surface modification <strong>of</strong> carbonfibres improves the wear resistance <strong>of</strong> the PA6 composites, as shown in Figs. 6b, c.For the air oxidated CF/PA6 composite, the worn surface is smoother than the untreatedone, as seen in Fig. 6b. There are also pores between carbon fibres <strong>and</strong> PA6.This indicates that the interfacial adhesion between carbon fibres <strong>and</strong> PA6 is notstrong enough, even though carbon fibres are air oxidated. Poor interaction leads tohigh abrasion wear due to the ease <strong>of</strong> fibre cracking or displacement. The reinforcingfibres are apt to be pulled-out if the resultant force <strong>of</strong> applied load <strong>and</strong> friction forceexceeds the interface bonding strength during wear. Microcracks are observed at thesurface either at the fibre–matrix boundary or at weak spots in the matrix <strong>and</strong> eventuallylead to delamination <strong>of</strong> the matrix material. Poor adhesion <strong>of</strong> the filler to the matrixgave rise to the initiation <strong>of</strong> these cracks <strong>and</strong> hence increased the wear rate [12].Probably, a crack follows the fibre–matrix interface <strong>and</strong> passes between the fibres attheir closest distance. The crack propagates under the original surface matrix layer <strong>and</strong>causes fragments <strong>of</strong> the matrix to be broken <strong>of</strong>f, leaving the fibres bare. The drivingforce for the crack comes from the friction forces being applied on the matrix surface.Where the fibres are close to each other the matrix between the fibres are <strong>of</strong>ten fragmented<strong>and</strong> broken <strong>of</strong>f when the crack propagates along the fibre surface. Additionally,the cavity shown in the PA6 matrix is the result <strong>of</strong> a filler carbon fibre detachingfrom the matrix due to loss <strong>of</strong> matrix around it <strong>and</strong> poor adhesion between the filler<strong>and</strong> matrix.For the composite filled with ozone treated carbon fibres, as shown in Fig. 6c, theworn surface is quite smooth <strong>and</strong> no cracks are visible. CF <strong>and</strong> PA6 are compactlybonded <strong>and</strong> no pores exist between the fibre <strong>and</strong> the matrix. This indicates that thefiller carbon fibres in ozone treated CF/PA6 have good bonding to the matrix <strong>and</strong> supportthe load from the counterbody effectively. The carbon fibres are not easily detachedfrom the PA6 matrix in the friction process, due to the improvement in theinterfacial adhesion between the carbon fibres <strong>and</strong> PA6 matrix after ozone treatment.Thus, the load is effectively supported by carbon fibres <strong>and</strong> the large-scale transfer<strong>and</strong> rub <strong>of</strong>f <strong>of</strong> PA6 will be restrained. Accordingly, the wear <strong>of</strong> the PA6 compositefilled with ozone treated carbon fibres was reduced.4. ConclusionsThe effect <strong>of</strong> ozone treatment has been investigated on interfacial <strong>and</strong> tribologicalproperties <strong>of</strong> carbon fibre–reinforced PA6 composites. The IFSS <strong>of</strong> the composites
Tribological properties <strong>of</strong> oxidation modified carbon fibre–reinforced polyamide 6 composites 75were improved by ozone treatment. Ozone treatment effectively promotes the interfacialadhesion between the carbon fibre <strong>and</strong> PA6 matrix. IFSS values <strong>of</strong> the compositeswith ozone treated carbon fibre are increased by 60% compared with those <strong>of</strong> untreatedcomposites. The friction coefficient <strong>and</strong> specific wear rate <strong>of</strong> CF/PA6 compositecan be decreased after surface treatment <strong>of</strong> carbon fibres. The ozone treated compositehas the lowest friction coefficient <strong>and</strong> specific wear rate under a given appliedload <strong>and</strong> reciprocating sliding frequency.AcknowledgementsThe authors acknowledge the help from School Fund (Project No. JD208001), Shanghai SecondPolytechnic University.References[1] JANG J., YANG H., J. Mater. Sci., 35 (2000), 2297.[2] WILSON M.A., PATNEY H.K., KALMAN J., Fuel, 81 (2002), 5.[3] KATSUMATA M., YAMANASHI H., USHIJIAMA H., Proc. SPA6E-Int. Soc. Opt. Eng., (1993), 140.[4] FITZER E., GEIGL K.H., HÜTTNER W., WEISS R., Carbon, 18 (1979), 389.[5] SHERWOOD P.M.A., Relat. Phenom., 81 (1996), 319.[6] RASHKOVAN I.A., KORABELNIKOV Y.G., Comp. Sci. Technol., 57 (1997), 1017.[7] DILSIZ N., EBERT E., WEISWEILER W., AKOVALI G., J. Colloid Interf. Sci., 170 (1995), 241.[8] YUE Z.R., JIANG W., WANG L., GARDNER S.D., PITTMAN C.U., Carbon, 37 (1999), 1785.[9] PAMULA E., ROUXHET P.G., Carbon, 41 (2003), 1905.[10] FIELDLY A., OLSEN T., RYSJEDAL J.H., BERG J.E., Composites A, 32 (2001), 373.[11] VARELIDIS P.C., MCCULLOUGH R.L., PAPASPYRIDES C.D., Comp. Sci. Technol., 59 (1999), 1813.[12] YANG Y.G., HE F., WANG M.Z., LI Z.J., ZHANG B.J., Carbon Technol., 6 (1997), 12 (in Chinese).[13] HAMPE A., KLINKA G., MERETZ S., SCHULZ E., Composites, 26 (1995), 40.[14] SHERWOOD P.M.A., in: D. Brigg, Seah MP(Eds.), Practical Surface Analysis, 2nd Ed., Wiley, NewYork, 1995, p. 555.[15] POLOVINA M., BABIĆ B., KALUDEROVIĆ B., DEKANSKI A., Carbon, 35 (1997), 1047.[16] ZHANG Z.Q., LIU Y.W., HUANG Y.D., Comp. Sci. Technol., 62 (2002), 331.Received 20 July 2008Revised 17 November 2008
Materials Science-Pol<strong>and</strong>, Vol. 28, No. 1, 2010Fabrication <strong>of</strong> core-shell Ge–GeO 2 nanoneedlesL.Z. PEI 1 , H.S. ZHAO 1 , W. TAN 2 , H.Y. YU 1 , Q.-F. ZHANG 1*1 School <strong>of</strong> Materials Science <strong>and</strong> Engineering, Institute <strong>of</strong> Molecular Engineering<strong>and</strong> Applied Chemistry, Anhui University <strong>of</strong> Technology, Ma’anshan, Anhui 243002, P.R. China2 Henkel Huawei Electronics Co. Ltd., Lianyungang, Jiangsu 222006, P.R. ChinaCore-shell Ge–GeO 2 nanoneedles were prepared by a hydrothermal deposition using Ge <strong>and</strong> GeO 2 asstarting materials. The samples were characterized by scanning electron microscopy, energy dispersive X-ray spectroscopy, transmission electron microscopy <strong>and</strong> high-resolution transmission electron microscopy.The results demonstrate that the length <strong>of</strong> the samples with typical needle structure is higher than10 μm. The obtained nanoneedles are composed <strong>of</strong> single crystalline Ge with diamond cubic structure <strong>and</strong>amorphous oxide outer layers. An explanation <strong>of</strong> the formation <strong>and</strong> growth <strong>of</strong> Ge nanoneedles is proposed,<strong>and</strong> is based on the metallic-catalyst vapour-liquid-solid <strong>and</strong> oxide-assisted growth mechanisms.Keywords: Ge–GeO 2 nanoneedles; hydrothermal deposition; <strong>characterization</strong>s1. IntroductionGermanium is an important semiconductor with a direct b<strong>and</strong> gap <strong>of</strong> 0.8 eV <strong>and</strong>an indirect b<strong>and</strong> gap <strong>of</strong> 0.66 eV. Recently, interest in germanium has intensified as themigration from silicon to other materials is contemplated for enhanced functionality <strong>of</strong>future transistors for logic <strong>and</strong> other functions. Compared with bulk silicon, bulk germanium<strong>of</strong>fers several advantages such as higher intrinsic carrier mobilities, promisingfaster switching <strong>and</strong> higher frequency devices, higher intrinsic carrier concentrations,larger bulk excitonic Bohr radii (24.3 nm for Ge versus 4.7 nm for Si), etc. Also,compatibility <strong>of</strong> germanium with the group <strong>of</strong> III–V materials (e.g., good latticematching with GaAs) <strong>and</strong> optical properties <strong>of</strong> germanium oxide allow fabrication <strong>of</strong>radical integrated optoelectronic circuitry designs [1, 2]. Therefore, the one-dimensionalnanoscale materials <strong>of</strong> Ge have many potential applications such as in nanoscaleprobes, nanoscale electron devices <strong>and</strong> nanoscale sensors. Ge nanowires <strong>and</strong>nanoneedles with core-shell structure are two kinds <strong>of</strong> one-dimensional solid forms <strong>of</strong>Ge. Ge nanowires with uniform diameter can be prepared easily by the laser ablationmethod [3], chemical vapour deposition (CVD) [4, 5], thermal evaporation [6], the_________* Corresponding author, email: zhangqf@ahut.edu.cn
78L.Z. PEI et al.template method [7, 8] <strong>and</strong> the supercritical fluid method [9, 10]. In comparison withsemiconductor Ge nanowires, Ge nanoneedles are also particularly interesting becausetheir tips exhibit a sharp curvature. Due to their tapered shapes, nanoneedles can potentiallybe applied as probe tips with high spatial resolution but any damage to probedmicrostructures should be minimal. They can also be used as field-emission tips withoutst<strong>and</strong>ing field enhancement factors [11–13]. Unlike nanowires <strong>of</strong> uniform diameter,nanoneedles with sharp tips are difficult to prepare. Only a few kinds <strong>of</strong> semiconductornanoneedles have been reported, such as silicon [14, 15], ZnO [13, 16, 17],Se [18] <strong>and</strong> ZnSe [19]. Therefore, the fabrication <strong>of</strong> Ge nanoneedles is still challenging.In this paper, we report a simple hydrothermal deposition route for the preparation<strong>of</strong> Ge nanoneedles with Ge–GeO 2 core-shell structure. The products have been characterizedby scanning electron microscopy (SEM), energy dispersive X-ray spectroscopy(EDS), transmission electron microscopy (TEM), selected area electron diffraction(SAED) <strong>and</strong> high-resolution transmission electron microscopy (HRTEM). The growthmechanism <strong>of</strong> Ge–GeO 2 core-shell nanoneedles is also discussed.2. ExperimentalThe preparation <strong>of</strong> Ge–GeO 2 core-shell nanoneedles was performed in an autoclave.The autoclave is composed <strong>of</strong> stainless steel (1Cr18Ni9Ti) with maximum pressure<strong>of</strong> 22 MPa, maximum temperature – 500 °C, volume 1000 cm 3 , power – 1.5 kW<strong>and</strong> stirring velocity <strong>of</strong> the stirrer from 0 to1000 rpm. 2 wt. % Ge <strong>and</strong> GeO 2 (purity <strong>of</strong>both ≥ 99.99%) were mixed with 48 cm 3 <strong>of</strong> distilled water. The mole ratio <strong>of</strong> Ge <strong>and</strong>GeO 2 was 1:1. Then the mixture was placed in the autoclave. The copper sample <strong>of</strong>the dimensions 4 × 2 cm 2 was cleaned in distilled water for 10 min using supersonicwave apparatus in order to ensure the cleanliness in the surface <strong>of</strong> the copper substrate.Then, the latter was fixed in the stainless steel bracket in the centre <strong>of</strong> the autoclave.After the autoclave was sealed safely, it was heated to 480 °C, subject to a pressure<strong>of</strong> 9–10 MPa, <strong>and</strong> stirred at the rate <strong>of</strong> 100 rpm. The constant temperature <strong>and</strong>pressure were maintained for 24 h. Subsequently the autoclave was cooled in air. Finally,the copper substrate with bulk deposit was obtained after the experiment. SEM<strong>and</strong> TEM confirmed that the product were Ge–GeO 2 core-shell nanoneedles.Scanning electron microscopy observations were performed using a JEOLJSM5410 scanning electron microscope with the 15 kV accelerating voltage. Chemicalanalysis was performed with an energy dispersive X-ray spectroscope attached tothe scanning electron microscope. The product was mechanically scrapped from thecopper substrate. Transmission electron microscopy <strong>and</strong> high-resolution transmissionelectron microscopy samples were prepared by putting several drops <strong>of</strong> solution containingnanoneedles onto a st<strong>and</strong>ard copper grid with a porous carbon film after thenanoneedle samples had been dispersed in distilled water <strong>and</strong> treated for about 10 minusing a supersonic wave apparatus. Transmission electron microscopy <strong>and</strong> highresolutiontransmission electron microscopy observations were performed using
Fabrication <strong>of</strong> core-shell Ge–GeO 2 nanoneedles 79a JEOL JEM-2100 transmission electron microscope operating with 1.9 Å point-topointresolution, <strong>and</strong> a 200 kV accelerating voltage, equipped with a GATAN digitalphotography system.3. Results <strong>and</strong> discussionSEM observations show an abundant number <strong>of</strong> cluster-like nanoneedles on thesubstrate. In Figure 1, typical SEM images <strong>of</strong> the nanoneedles under various magnificationsare seen. It was found that the substrate is uniformly covered by pure nanoneedlestructures.a) b)c)Fig. 1. General SEM images <strong>of</strong> the obtained nanoneedles with various magnifications (a)–(c)<strong>and</strong> the corresponding EDS spectra <strong>of</strong> the nanoneedles (d)The length <strong>of</strong> each nanoneedle exceeds 10 μm. The diameter <strong>of</strong> each nanoneedleis continuously smaller towards one end, <strong>and</strong> the average diameter <strong>of</strong> needle tips islower than 1 μm. Most nanoneedles have sharp tips <strong>and</strong> smooth surfaces, showing thattheir morphology is similar to that <strong>of</strong> other kinds <strong>of</strong> nanoneedles [14–19]. In order todetermine the components <strong>of</strong> the obtained nanoneedles, the products are analyzed withan EDS spectrometer equipped with the SEM (Fig. 1d). According to the EDS data,the obtained nanoneedles are composed <strong>of</strong> Ge, O <strong>and</strong> Cu. No other elements are observedfrom the EDS spectroscopy.
80L.Z. PEI et al.Figure 2a shows a typical TEM image <strong>of</strong> the nanoneedles, which is similar to theSEM results. The corresponding SAED is shown in the inset <strong>of</strong> Fig. 2a. The SAED displaystypical diffraction patterns <strong>of</strong> the {111}, {220} <strong>and</strong> {311} planes, which indicatethat the nanoneedles are in a single crystalline form with a cubic diamond phase. Figure 2bis a typical high magnification TEM image <strong>of</strong> a single nanoneedle, revealing a sharp tip.Fig. 2. General TEM image <strong>of</strong> the sample (a), the inset is the corresponding SAED pattern,<strong>and</strong> typical TEM image at the tip <strong>of</strong> a single nanoneedle (b)Fig. 3. HRTEM image <strong>of</strong> the sample,the inset is the corresponding diffraction patternobtained by fast Fourier transformation (FET)Figure 3 shows the HRTEM image <strong>of</strong> a single nanoneedle. The core-shell structurecan distinctly be observed <strong>and</strong> the outer layer is amorphous, measuring severaldozen nanometres. The crystalline interplanar spacing is about 0.325 nm, according tothe HRTEM measurement <strong>and</strong> the subsequent calculation using the s<strong>of</strong>tware <strong>of</strong> a digitalmicrograph (Gatan Inc., Pleasanton, CA) applied to the HRTEM, matching wellwith the {111} plane <strong>of</strong> Ge. In addition, the HRTEM image further confirms that thenanoneedles are single crystalline. The two-dimensional lattice image further reveals
Fabrication <strong>of</strong> core-shell Ge–GeO 2 nanoneedles 81that the obtained nanoneedles consist <strong>of</strong> single crystalline Ge cores <strong>and</strong> amorphousGeO 2 shell. The corresponding diffraction pattern obtained by fast Fourier transformation(FET) is shown in the inset <strong>of</strong> Fig. 3. [111] is the growth direction <strong>of</strong> the nanoneedleswhich is similar to that observed for Ge nanowires [9, 10, 20, 21].Fig. 4. SEM image <strong>of</strong> the tips <strong>of</strong> the nanoneedles (a) <strong>and</strong> the correspondingEDS spectra (designated by the black frame) (b)The growth tips <strong>of</strong> the nanoneedles are shown in Fig. 4a. Sphere structures <strong>of</strong>various sizes are observed. The sphere structures are similar to the tips <strong>of</strong> catalyst alloys<strong>of</strong> other one-dimensional nanoscale materials, such as carbon nanotubes [22],silicon nanowires [23] <strong>and</strong> germanium nanowires [20] fabricated by metallic catalystvapour-liquid-solid (VLS) growth methods. In addition, the corresponding EDS spectra(Fig. 4b) show that the sphere structures are composed <strong>of</strong> Ge, O <strong>and</strong> Cu. The content<strong>of</strong> Ge is obviously lower than that <strong>of</strong> Cu. The results show that the sphere structuresat the tips are a kind <strong>of</strong> Cu/Ge/O catalyst alloy sphere. It is well known that thepresence <strong>of</strong> solidified catalyst droplets <strong>of</strong> one-dimensional nanostructures is an evidencefor the effective operation <strong>of</strong> the VLS mechanism, <strong>and</strong> the size <strong>of</strong> the dropletcommonly governs the diameter <strong>of</strong> one-dimensional nanostructures [19]. Therefore,the formation <strong>of</strong> the Ge nanoneedles is believed to be very close to the metallic catalystVLS growth mechanism. The increase in size <strong>of</strong> catalyst droplets during thegrowth probably results in the formation <strong>and</strong> growth <strong>of</strong> Ge nanoneedles. However, thepeculiar needle-like structure <strong>of</strong> our grown products indicates that the growth <strong>of</strong> thenanoneedles does not seem to be governed solely by the VLS mechanism, althoughCu/Ge/O catalyst spheres do exist. The Cu/Ge/O catalyst droplets contain a significantamount <strong>of</strong> oxide. It is also well known that it plays a vital role in the formation <strong>and</strong>growth <strong>of</strong> one-dimensional nanomaterials, such as silicon nanowires <strong>and</strong> germaniumnanowires. The formation <strong>and</strong> growth process can be explained by the oxide-assistedgrowth (OAG) mechanism proposed by Lee et al. [6, 24–27]. Therefore, oxide is alsoconsidered to play an important role in the formation <strong>and</strong> growth <strong>of</strong> the nanoneedles.Both mechanisms show an approximately equal probability <strong>of</strong> occurrence. The possiblegrowth mechanism is proposed below.The starting materials, Ge <strong>and</strong> GeO 2 are a stable monoatomic element <strong>and</strong> oxide ina normal atmospheric environment at room temperature. The melting points <strong>of</strong> Ge <strong>and</strong>
82L.Z. PEI et al.GeO 2 are 937.4 °C <strong>and</strong> 1115 °C, respectively. Therefore, the starting materials aredifficult to be gasified, reacting each other under the ambient atmospheric pressure<strong>and</strong> at experimental temperature under consideration here. The deposition process,however, was conducted under the pressure <strong>of</strong> 9–10 MPa at the temperature <strong>of</strong> 480 °C,which is higher than the critical temperature <strong>of</strong> water (374 °C) [28]. Therefore, theexperiments are considered to be carried out under the supercritical hydrothermal conditions.Supercritical water has sufficient density to dissolve materials, a higher diffusivitythan in liquid state, low viscosity facilitating mass transport, <strong>and</strong> high compressibilityallowing easy changes in density <strong>and</strong> dissolving power [29, 30]. Thus thesupercritical hydrothermal conditions may play an essential role in the reaction <strong>and</strong>gasification <strong>of</strong> Ge <strong>and</strong> GeO 2 . The hydrothermal pressure can also enhance the reactionaccording to chemical reaction theory. Therefore, the reaction <strong>of</strong> Ge <strong>and</strong> GeO 2 shouldproceed, forming GeO under the present supercritical hydrothermal conditions.GeO is an unstable compound <strong>and</strong> disproportionates into Ge atoms <strong>and</strong> GeO 2molecules forming Ge/GeO 2 nanoscale clusters. The nanoclusters are suspended in thesupercritical hydrothermal environment under continuous stirring. The melting temperature<strong>of</strong> these nanoclusters may be reduced due to their nanoscale size <strong>and</strong> the effect<strong>of</strong> the supercritical hydrothermal environment [28–30]. The nanoclusters might beliquid-like, in a semi-molten or molten state. They deposit onto the substrates continuouslyas the air flows into the autoclave. The supercritical hydrothermal conditionsalso enhance the oxidation <strong>and</strong> melting <strong>of</strong> Cu on the surface <strong>of</strong> the substrate. Cu reactswith O in the hydrothermal environment to form a large amount <strong>of</strong> molten Cu oxidenanoclusters on the surface <strong>of</strong> the substrate. The Cu/Ge/O catalyst droplets form fromthe molten nanoscale Cu oxide <strong>and</strong> from deposited Ge, Ge oxide nanoscale clusters.Therefore, the formation <strong>and</strong> growth <strong>of</strong> Ge nanoneedles are believed to follow simultaneouslythe metallic-catalyst VLS <strong>and</strong> OAG growth mechanisms.Fig. 5. The proposed metallic catalyst VLS <strong>and</strong> OAG growth scheme <strong>of</strong> the nanoneedles:a) the nucleation <strong>of</strong> the Cu/Ge/O catalyst droplets, b) the growth <strong>of</strong> the nanoneedles according to themetallic catalyst VLS <strong>and</strong> OAG growth mechanism, c) the final formation <strong>of</strong> the nanoneedles
Fabrication <strong>of</strong> core-shell Ge–GeO 2 nanoneedles 83Figure 5 shows the metallic-catalyst VLS <strong>and</strong> OAG growth scheme <strong>of</strong> the coreshellnanoneedles. The can be divided into the nucleation <strong>and</strong> growth <strong>of</strong> liquidCu/Ge/O catalyst droplets. The Cu/Ge/O catalyst droplets form from the molten nanoscaleCu oxide <strong>and</strong> are deposited as Ge, Ge oxide nanoscale clusters (Fig. 5a). Liquidmetallic catalyst droplets limit the diameter <strong>of</strong> the Ge nanoneedles. With the furtherabsorption <strong>of</strong> Ge atoms <strong>and</strong> GeO 2 molecules into the droplets from the environment,the Ge atoms are in the supersaturation state <strong>and</strong> move across the interface betweenthe catalyst <strong>and</strong> the nanoneedles, thereby resulting in the growth <strong>of</strong> Ge nanoneedles(Figs. 5b, c). According to the VLS mechanism, the diameter <strong>of</strong> one-dimensionalnanomaterials depends on the size <strong>of</strong> the nanoclusters that are formed initially [31].The relation between the nanocluster diameters <strong>and</strong> the ambient gas pressure is governedby the inertia fluid model proposed by Yoshida et al. [32], which is as follows:n 1d ∝ p , n = (1)3Here d is the diameter <strong>of</strong> the catalyst alloy nanoclusters, p is the ambient gas pressure.Therefore, the diameter <strong>of</strong> the Cu/Ge/O nanoclusters at the top <strong>of</strong> one-dimensional Genanoscale structures increases as the ambient gas pressure p increases to 10 MPa. Finally,special nanoneedle structures with sharp tips form. In addition, similar to themetallic catalyst VLS growth mechanism, liquid-like Ge oxide in the Ge/Cu/O nucleusplays also the role <strong>of</strong> metallic catalysts, according to the OAG mechanism. TheGe/Cu/O nucleus continuously absorbs Ge atoms <strong>and</strong> Ge oxide molecules from the atmosphere<strong>and</strong> undergoes recrystallization with phase separation into Ge <strong>and</strong> Ge oxide.Crystallized Ge stays inside <strong>and</strong> amorphous Ge oxide diffuses towards the nanoneedlesurface. Subsequently, an amorphous GeO 2 shell will be formed [6]. From the thermodynamicviewpoint, recrystallization with phase separation is the result <strong>of</strong> free energy minimization<strong>of</strong> the system [6]. The crystalline structure will extend continuously in the axialdirection, due to the rapid deposition <strong>of</strong> nanoclusters at the tip resulting in the growth <strong>of</strong>the nanoneedles. Therefore, the obtained nanoneedles with the single crystalline Ge coresare covered with oxide outer layers measuring several dozen nanometres.4. ConclusionsNanoneedles with Ge–GeO 2 core-shell structure longer than 10 μm have been synthesizedby a simple hydrothermal deposition using Ge <strong>and</strong> GeO 2 as the starting materials.The obtained nanoneedles are covered with oxide outer layers measuring severaldozen nanometres, <strong>and</strong> have single crystalline Ge cores with diamond cubic structure.The nanoneedle diameters become smaller towards one end: the average diameter <strong>of</strong>the tips is lower than 1 μm. Most needles have sharp tips <strong>and</strong> smooth surfaces. Theformation <strong>and</strong> growth <strong>of</strong> the nanoneedles are believed to follow a similar pr<strong>of</strong>ile tothat <strong>of</strong> the metallic-catalyst VLS <strong>and</strong> OAG.
84L.Z. PEI et al.AcknowledgementsThis work was supported by the National Basic Research Program <strong>of</strong> China (973 Program,2008CB617605) <strong>and</strong> the Program for New Century Excellent Talents in University <strong>of</strong> China NCET-06-0556).References[1] NGUYEN P., NG H.T., MEYYAPPAN M., Adv. Mater., 17 (2005), 549.[2] WANG L., WANG X.S., TANG J.C., CUE N., Mater. Charact., 48 (2002), 189.[3] MORALS A.M., LIEBER C.M., Science, 279 (1998), 208.[4] WANG D., DAI H., Angew. Chem. Int. Ed., 41 (2002), 4783.[5] DAILEY J.W., TARACI J., CLEMENT T., SMITH D.J., DRUCKER J., PICRAUX S.T., J. Appl. Phys.,96 (2004), 7556.[6] ZHANG Y.F., TANG Y.H., WANG N., LEE C.S., BELLO I., LEE S.T., Phys. Rev. B, 61 (2001), 4518.[7] COLEMAN N.R.B., RYAN K.M., SPALDING T.R., HOLMES J.D., MORRIS M.A., Chem. Phys. Lett., 343(2001), 1.[8] HAN W.Q., WU L.J., ZHU Y.M., STRONGIN M., Microsc. Microanal., 11 (2005), 1506.[9] HANRATH T., KORGEL B.A., J. Am. Chem. Soc., 124 (2002), 1424.[10] HANRATH T., KORGEL B.A., Small, 1 (2005), 717.[11] KIM P., LIEBER C.M., Science, 286 (1999), 2148.[12] ZHU Y.W., ZHANG H.Z., SUN X.C., FENG S.Q., XU J., ZHAO Q., XIANG B., WANG R.M., Appl. Phys.Lett., 83 (2003), 144.[13] PARK W.I., YI G.G., KIM M., PENNYCOOK S.J., Adv. Mater., 14 (2002), 1841.[14] CHEN Y.W., JIANG S.H., SHAO B.X., WANG W., WANG R.C., J. Electron Mater., 37 (2008), 176.[15] JUNG S., YOO J., KIM Y., KIM K., DHUNGEL S.K., YI J., Mater. Sci. Eng. C, 26 (2006), 813.[16] LEE W., JEONG M.C., KIM M.J., MYOUNG J.M., Phys. Lett., 370 (2007), 345.[17] ZHANG J., YANG Y.D., JIANG F.H., LI J.P., Physica E, 27 (2005), 302.[18] XIONG S.L., XI B.J., WANG W.Z., WANG C.M., FEI L.F., ZHOU H.Y., QIAN Y.T., Cryst. Growth Des.,6 (2006), 1711.[19] FU H.Z., LI H.Y., JIE W.Q., YANG L., J. Cryst. Growth, 289 (2006), 440.[20] MATHUR S., SHEN H., SIVAKOV V., WERNER U., Chem. Mater., 16 (2004), 2449.[21] LU X.M., FANFAIR D.D., JOHNSTON K.P., KORGEL B.A., J. Am. Chem. Soc., 127 (2005), 15718.[22] JIANG Y., WU Y., ZHANG S.Y., XU C.Y., J. Am. Chem. Soc., 122 (2000), 12383.[23] FENG S.Q., YU D.P., ZHANG H.Z., BAI Z.G., DING Y., J. Cryst. Growth, 209 (2000), 513.[24] MA D.D.D., LEE C.S., AU F.C.K., TONG S.Y., LEE S.T., Science, 299 (2003), 1874.[25] LEE S.T., ZHANG Y.F., WANG N., TANG Y.H., BELLO I., LEE C.S., CHUNG Y.W., J. Mater. Res., 14(1999), 4503.[26] LEE S.T., WANG N., ZHANG Y.F., TANG Y.H., MRS Bull., 24 (1999), 36.[27] ZHANG Y.F., TANG Y.H., WANG N., LEE C.S., BELLO I., LEE S.T., J. Cryst. Growth, 197 (1999), 136.[28] CUMMINGS P.T., COCHRAN H.D., SIMONSON J.M., MESMER R.E., KARABORNI S., J. Chem. Phys., 94(1991), 5606.[29] TANG Y.H., PEI L.Z., CHEN Y.W., GUO C., Phys. Rev. Lett., 95 (2005), 116102.[30] PEI L.Z., TANG Y.H., ZHAO X.Q., CHEN Y.W., GUO C., J. Appl. Phys., 100 (2006), 046105.[31] YANG Y.H., WU S.J., CHIU H.S., LIN P.I., CHEN Y.T., J. Phys. Chem. B, 108 (2004), 846.[32] YOSHIDA T., TAKEYAMA S., YAMADA Y., MUTOCH K., Appl. Phys. Lett., 68 (1996), 1772.Received 8 October 2008Revised 9 November 2009
Materials Science-Pol<strong>and</strong>, Vol. 28, No. 1, 2010Fabrication <strong>of</strong> yttria stabilized zirconiananoparticles by the reverse microemulsionmethod for SOFC applicationsS. VATANSEVER 1 , F. ÖKSÜZÖMER 1* , S. NACI KOÇ,M. SOMER 2 , H. DELIGÖZ 1 , M. A. GÜRKAYNAK 11 Department <strong>of</strong> Chemical Engineering, Istanbul University, 34320, Istanbul, Turkey2 Department <strong>of</strong> Chemistry, Koç University, 34450, Istanbul, TurkeyYttria stabilized zirconia powders were synthesized by the reverse microemulsion method. Powderswere calcined from 600 °C to 1000 °C <strong>and</strong> sintered at 1450 °C. Crystalline properties <strong>and</strong> microstructure<strong>of</strong> samples were characterized by X-ray diffraction <strong>and</strong> scanning electron microscopy, respectively.Oxygen ionic conductivity was measured by electrochemical impedance spectroscopy. Sizes <strong>of</strong> yttriastabilized zirconia particles calcined at 1000 °C are lower than 100 nm, <strong>and</strong> approximately, 1 μm grainwas obtained after sintering at 1450 °C.Keywords: yttria stabilized zirconia; chemical synthesis; electron microscopy; ionic conductivity1. IntroductionHigh performance ceramic material, yttria stabilized zirkonia (YSZ) is the most commonlyused as an electrolyte. YSZ is an important material for oxygen sensors, oxygenpumps, catalysts <strong>and</strong> fuel cells. When doped with 8 mol % <strong>of</strong> yttria, the structure is stabilized<strong>and</strong> this modified electrolyte shows high ionic conductivity as well as high thermalstability, <strong>and</strong> has excellent mechanical properties. In recent decades, there has been greatinterest in the conductivity <strong>of</strong> YSZ based electrolytes [1–4].Many different methods exist for the preparation <strong>of</strong> nanosized YSZ such as sol-gel technique, precipitation, spark-plasma sintering <strong>and</strong> hydrothermal synthesis leadingto final products differing in properties. Therefore, the choice <strong>of</strong> preparation route<strong>and</strong> particular heat treatment strongly influence the synthesis, sintering <strong>and</strong> properties<strong>of</strong> the YSZ powders, <strong>and</strong> are very important for optimizing the properties <strong>of</strong> the YSZelectrolytes._________* Corresponding author, e-mail: fufu@istanbul.edu.tr
86S. VATANSEVER et al.In recent years, a relatively new microemulsion method has been used for preparation<strong>of</strong> ultrafine powders [5, 6]. It was invented in the 1980s as an effective process <strong>of</strong>fabrication <strong>of</strong> nanoparticles. Microdroplets containing solved reactants act as nanoreactorsin the microemulsion system. When the droplets collide with each other, theprecipitation occurs. A powder <strong>of</strong> spherical particles, with a uniform size distribution<strong>and</strong> good dispersibility can be obtained. The size <strong>and</strong> shape <strong>of</strong> reverse micelles wouldchange with the molar ratio <strong>of</strong> the water to surfactant value (w 0 ), the type <strong>of</strong> ions <strong>and</strong>electrolyte concentration in the aqueous phase, <strong>and</strong> the type <strong>of</strong> co-surfactant used.Droplets with spherical, ellipsoidal, rod-like, cylindrical, or planar shapes would appear,depending on the w 0 value or the electrolyte concentration in the aqueous phase.By further addition <strong>of</strong> the aqueous solution or by increasing the ionic strength in aqueousphase, a bicontinuous structure or normal micelles might even be formed [5–11].Fang et al. [6] obtained ultrafine YSZ using 1-hexanol–water–CTAB microemulsionsystem. Ultrafine powders <strong>of</strong> tetragonal crystalline zirconia having particle diameters<strong>of</strong> 40–70 nm were obtained. Ma et al. [7] employed cyclohexane–water–TritonX-100–hexyl alcohol system to fabricate ultrafine spherical particles <strong>of</strong> 30–40 nm tetragonalzirconia powders. Tai et al. [8] obtained yttria stabilized zirconia by the reverse microemulsiontechnique using a system <strong>of</strong> water–CTAB–hexanol.The aim <strong>of</strong> this study was to investigate the fabricate nanoscale uniform YSZpowder by the reverse microemulsion method. The microstructure <strong>and</strong> ionic conductivity<strong>of</strong> YSZ material were studied in detail.2. ExperimentalReverse micelles were fabricated by using Triton X-100 (Merck, 99%) asa surfactant, hexanol (Merck, 98%) as co-surfactant, isooctane (Sigma, 99.5%) as anoil phase. ZrOCl 2·8H 2 O (Merck, 99.9%), Y(NO 3 ) 3·6H 2 O (Sigma, 99.9%) were used asinorganic precursors. Two organic phases containing equal amounts <strong>of</strong> Triton X-100,hexanol <strong>and</strong> isooctane were prepared separately. The mixture <strong>of</strong> inorganic salts containing8 moles <strong>of</strong> Y 2 O 3 –92% mol ZrO 2 was dissolved in an appropriate amount <strong>of</strong>water <strong>and</strong> added dropwise into one <strong>of</strong> organic phases. NH 4 OH was added dropwiseinto the other organic phase. Finally, these two transparent microemulsions weremixed together <strong>and</strong> refluxed. The mixture was magnetically stirred at 80 °C for 3 h.The stability <strong>of</strong> the mixture was broken by adding ethanol <strong>and</strong> then centrifuging. Theresidue was washed with ethanol repeatedly until no Cl – ions could be detected withAgNO 3 solution, <strong>and</strong> sample was then dried in an oven at 180 °C for 12 h. The driedproduct was calcined at 1000 °C for 6 h. After calcination, the powders were groundusing a ball milling system (Retsch-S100).Differential <strong>and</strong> thermogravimetric analyses (DTA/TGA) <strong>of</strong> the dried productwere carried out using a thermal analyzer (Linseis) at thea heating rate <strong>of</strong> 10 °C/min inair. The phase identification was performed by X-ray diffraction (XRD) using aRigaku D/max-2200 diffractometer with CuK α radiation (λ = 0.15418 nm) <strong>and</strong>, operat-
Fabrication <strong>of</strong> yttria stabilized zirconia nanoparticles 87ing at 30 kV, 20 mA. The crystallite size <strong>of</strong> the calcined powders was calculated bythe X-ray line broadening technique, performed on the (220) diffraction pattern <strong>of</strong>YSZ, using the Scherer equation: D XRD = (0.9λ)/(βcosθ), where D XRD is the crystallitesize (nm), λ is the radiation wavelength (0.15418 nm), θ is the diffraction peak angle<strong>and</strong> β is the corrected half-width at a half-maximum (FWHM).In order to further investigate high temperature behaviour <strong>of</strong> this 8YSZ powder,a disk-shaped sample <strong>of</strong> 15 mm diameter <strong>and</strong> 1 mm thickness was obtained by coldisostatic pressing (CIP) at 95 MPa. Subsequently, the sample was sintered at 1450 °Cfor 6 h. The morphology <strong>of</strong> powders calcined at 1000 °C <strong>and</strong> <strong>of</strong> discs sintered at1450 °C were examined using a scanning electron microscope (SEM, JEOL 6335F).The oxygen conductivity measurements were performed on a sintered sample usinga two-probe ac impedance analyzer (Solartron 1260 FRA <strong>and</strong> 1296 interface) at300 °C. Pt wire <strong>and</strong> Pt paste (Alfa Aesar) were used as electrode materials. The datawere analysed in the impedance mode using a computer s<strong>of</strong>tware (Z view, ScribnerAssociates).3. Results <strong>and</strong> discussionTGA <strong>and</strong> DTA curves <strong>of</strong> the analysed samples are shown in Fig. 1. Theexothermal peak at 325 °C in DTA, <strong>and</strong> the rapid weight loss between 260 °C <strong>and</strong>380 °C in TGA can be attributed to the decomposition <strong>of</strong> organic compounds [7]. Theendothermal peak at 468 °C should be due to the dehydration process <strong>of</strong> Zr(OH) x . Thecrystallization <strong>of</strong> zirconia began with a slight exothermal peak at around 550 °C.Fig. 1. The TGA/DTA curves <strong>of</strong> as prepared YSZ samplesThe XRD patterns <strong>of</strong> samples calcined between 600 <strong>and</strong> 1000 °C are shown inFig. 2, <strong>and</strong> those sintered at 1450 °C are in Fig. 3. The peak intensities increase <strong>and</strong>
88S. VATANSEVER et al.get sharper as the calcination temperature increases. The YSZ sample shows the cubicphase <strong>of</strong> ZrO 2 Tetragonal <strong>and</strong> cubic phases can be distinguished with the characteristic(212) peak <strong>of</strong> tetragonal phase. This peak, as reported previously, has not beenobserved for any cubic samples [1, 2, 5, 12, 13]. The peaks observed in this study areattributed to the cubic phase, <strong>and</strong> it can therefore be concluded that the Y 2 O 3 wascompletely dissolved in the zirconia structure.Fig. 2. XRD results in YSZ samples calcined at 600, 800 <strong>and</strong> 1000 °CFig. 3. XRD results for an YSZ sample sintered at 1450 °C for 6 hThe lattice constants <strong>of</strong> YSZ were found to be 5.135 Å <strong>and</strong> 5.133 Å, for samplescalcined at 1000 °C <strong>and</strong> sintered at 1450 °C, respectively. It is generally known that
Fabrication <strong>of</strong> yttria stabilized zirconia nanoparticles 89the lattice parameter <strong>of</strong> ZrO 2 increases with Y 2 O 3 doping because ionic radii <strong>of</strong> Y 3+ arehigher than those <strong>of</strong> Zr 4+ . When the coordination number is equal to 8, the ionic radiiare 0.84 Å in Zr 4+ <strong>and</strong> 1.02 Å in Y 3+ [14].Fig. 4. SEM micrographs <strong>of</strong> YSZ samples calcinedat: a) 600 °C, b) 800 °C, c) 1000 °CSEM results <strong>of</strong> as-prepared samples are shown in Fig. 4. The particle size <strong>of</strong> powderscalcined between 600 °C <strong>and</strong> 1000 °C increased. In the case <strong>of</strong> 600 °C calcinations,mean particle size is below 50 nm <strong>and</strong> it is approximately 80 nm at 1000 °C .The crystal sizes were calculated from the Debye–Scherer equation <strong>and</strong> they werefound to be 10.6, 11.5, 30.9 nm for calcination temperatures <strong>of</strong> 600, 800 <strong>and</strong> 1000 °C,respectively. Consistently, both crystallite <strong>and</strong> particle sizes increased with the temperature<strong>of</strong> calcinations. It is also observed that all the calcined powders prepared withreverse-micelles have uniform <strong>and</strong> spherical particles. Powders calcined at 1000 °Cwere subjected to cold isostatic pressing at 95 MPa <strong>and</strong> were sintered at 1450 °C. Thedensity <strong>of</strong> sintered discs was measured by the Archimedes method <strong>and</strong> calculated asbeing 92% <strong>of</strong> the theoretical density. The SEM data <strong>of</strong> the disc-shape sintered samplecan be seen in Fig. 5. Sintering at 1450 °C resulted in sub-micrometer grain size. Inaddition, grains are uniform in size <strong>and</strong> shape, <strong>and</strong> there is no evidence <strong>of</strong> exaggeratedgrain growth. The grain uniformity <strong>of</strong> sintered samples is important for stable conductivity<strong>of</strong> YSZ exposed to high temperature. As is seen from Fig. 5, most <strong>of</strong> the particlesizes are approximately 1 μm after sintering.
90S. VATANSEVER et al.Fig. 5. SEM micrograph <strong>of</strong> an YSZ sample sinteredat 1450 °CThe complex impedance plot <strong>of</strong> YSZ at 300 °C is shown in Fig. 6. It was observedthat grain boundary resistivity is lower than the grain interior resistivity. Theratio <strong>of</strong> these resistivities is 1.62. It is generally believed that the grain boundaryresistivity is higher than the grain interior resistivity <strong>of</strong> YSZ. In other words, in thecase <strong>of</strong> YSZ, the key factor determining conductivity is the grain boundary resistivity.Fig. 6. An impedance plot <strong>of</strong> a sintered YSZ disc at 300 °CHigher grain resistivity is attributed to bigger grain size <strong>and</strong> thicker grain interior. Thesmall grain size, e.g. 1 μ, <strong>of</strong> YSZ obtained from microemulsions is associated witha thinner grain interior. Therefore it provides higher grain boundary conductivity. Ithas been reported that the conductivity <strong>of</strong> YSZ increases when grains are <strong>of</strong> submicronsize. It can be increased by a factor <strong>of</strong> almost 2 with nanoscale grains [15–17].4. Conclusions8YSZ powder was synthesized by the reverse microemulsion method. Uniform,nanosized YSZ particles <strong>of</strong> the sizes brlow 100 nm were obtained. Most <strong>of</strong> the
Fabrication <strong>of</strong> yttria stabilized zirconia nanoparticles 91particles were observed to be around 1 μm in grain size when sintered at 1450 °C,which would be suitable for thin film electrolyte applications.AcknowledgementThe study has been supported by the Istanbul University Research Fund, Project No. 469/27122005as wellas by the by TUBITAK Project No. 105M051References[1] POLITOVA T.I., IRVINE J.T.S., Solid State Ionics, 176 (2004), 153.[2] KONDOH J., TOMII Y., KAWACHI K., J. Am. Ceram. Soc., 86 (2003), 2093.[3] SINGHAL S.C., KENDALL K., High Temperature Solid Oxide Fuel Cells: Fundamentals, Design <strong>and</strong>Applications, Elsevier, Oxford, 2003.[4] HUNG I-M., HUNG D-T., FUNG K-Z., HON M-H., J. Europ. Ceram. Soc., 26 (2006), 2627.[5] LI L., SHI L., CAO S., ZHANG Y., WANG Y., Mater. Lett., 62 (2008), 1909.[6] FANG X., YANG C., J. Colloid Interface Sci., 212 (1999), 242.[7] MA T., HUANG Y., YANG J.L., HE J.T., ZHAO L., Mater. Design, 25 (2004), 515.[8] TAI C.Y., HSIAO B.Y., CHIU H.Y., Mater. Lett., 61 (2007), 834.[9] PILENI M.P., J. Exp. Nanosci., 1 (2006), 13.[10] ERIKSSON S., NYLEN U., ROJAS S., BAUTONNET M., Appl. Cat. A, General, 265 (2004), 207.[11] HUANG Y., MA T., YANG J.L., ZHANG L.M., HE J.T., LI H.F., Ceram. Int., 30 (2004), 675.[12] HE T., HE Q., WANG N., J. Alloy Comp., 396 (2005), 309.[13] KUO C.W., LEE Y.H., FUNG K.Z., WANG M.C., J. Non-Cryst. Solids, 351 (2005), 304.[14] TAYLOR M.A., ARGIRUSIS C., KILO M., BORCHARDT G., LUTHER K.-D., ASSMUS W., Solid State Ionics,173 (2004), 51.[15] HAN M., TANG X., YIN H., PENG S., J. Power Sources, 165 (2007), 757.[16] MONDAL P., KLEIN A., JAEGERMANN W., HAHN H., Solid State Ionics, 118 (1999), 331.[17] CHEIKH A., MADANI A., TOUATI A., BOUSETTA H., MONTY C., J. Eur. Ceram. Soc., 21(2001), 1837.Received 5 November 2008Revised 22 May 2009
Materials Science-Pol<strong>and</strong>, Vol. 28, No. 1, 2010Characterization <strong>of</strong> electrochemically depositedthin Mo–O–C–Se film layersN. DUKSTIENE 1* , L. TATARISKINAITE 2 , M. ANDRULEVICIUS 31 Department <strong>of</strong> Physical Chemistry, Kaunas University <strong>of</strong> Technology,LT-50254 Radvilenu pl. 19, Kaunas, Lithuania2 AB Achema, LT-55550, Jonavos r., Ruklos sen., Jonalaukio k., Lithuania3 Institute <strong>of</strong> Physical Electronics <strong>of</strong> Kaunas University <strong>of</strong> Technology,LT-50131 Savanoriu pr. 271 Kaunas, LithuaniaThe paper reports on the composition, morphology <strong>and</strong> optical properties <strong>of</strong> thin Mo–O–C–Se filmelectrodeposited onto SnO 2 –glass substrate (R = 292 Ω/cm 2 ). The composition <strong>of</strong> films was estimatedbased on X-ray photoelectron spectroscopy <strong>and</strong> Fourier transform infrared spectral analysis. Structuralelements similar to molybdenum oxides <strong>and</strong>/or hydroxides, MoSe 2 , Se <strong>and</strong> SeO 2 were identified on thesurface <strong>and</strong> in the bulk <strong>of</strong> the electrodeposits. The studies <strong>of</strong> surface morphology by scanning electronmicroscopy <strong>and</strong> atomic force microscopy showed long-sized wires distributed over all the surface. Theoptical absorption studies revealed the films to be highly absorptive (10 4 α cm –1 ) with a direct b<strong>and</strong> transition<strong>and</strong> the bang gap energy <strong>of</strong> 1.75 eV.Keywords: thin film electrodeposition; XPS; MoSe 2 ; selenium; molybdenum oxides <strong>and</strong> hydroxides;optical properties1. IntroductionA rapid progress in modern technologies induces the search for new compoundspossessing advanced physicochemical properties. Thin films <strong>of</strong> molybdenum chalcogenide<strong>and</strong> oxide based compounds present considerable interest for many researchfields including electrocatalysis [1, 2], fuel cells [3] <strong>and</strong> batteries [4]. This interest isrelated to the capacity <strong>of</strong> Mo atoms to assume various oxidation states, depending onthe methods <strong>of</strong> syntheses. Therefore, there is continuous research into exploring newprocessing techniques which fulfil low-cost, scalability <strong>and</strong> production criteria. Electrodepositionsatisfies all these conditions <strong>and</strong> hence accelerated efforts are made in_________* Corresponding author, e-mail: nijole.dukstiene@ktu,lt
94N. DUKSTIENE et al.many laboratories [4–6]. Thin amorphous MoO y S x films, applied in lithium battery cells,have been successfully obtained by the electrodeposition technique [4]. The cathodicdeposition <strong>of</strong> complex Mo 4 O 11 –MoS 2 systems has been described in the paper [5].Results regarding simultaneous electrodeposition <strong>of</strong> Mo <strong>and</strong> Se onto SnO 2 coatedglass electrodes from sodium citrate solutions have been recently reported [6]. Mirrorlike,uniform <strong>and</strong> adhesive thin Mo–O–C–Se films were electrodeposited on the surface<strong>of</strong> SnO 2 –glass electrode. However it was impossible to characterize the crystallographicstructures <strong>of</strong> the deposits: the only lines corresponding to polycrystalline SnO 2have been observed in X-ray diffractograms. Therefore, in this paper we continue ourrecent investigations <strong>and</strong> characterize electrodeposited Mo–O–C–Se films. Our motivationfor characterizing these films is driven by their potential as promising c<strong>and</strong>idatesfor photovoltaic applications. To establish the suitability <strong>of</strong> these thin films asa photovoltaic material, it is essential to study the distribution <strong>and</strong> nature <strong>of</strong> compoundspresent in the deposits <strong>and</strong> their optical properties.2. ExperimentalA commercially available ISE-2 three-electrode system with a PI-1-50 potentiostatcoupled to a PR-8 programmer (ZIP, Russia) was adopted to deposit thin films oncommercially available SnO 2 coated glass plates. The thickness <strong>of</strong> the SnO 2 layer was1 μm <strong>and</strong> the sheet resistance was 292 Ω/cm 2 . A plate was fixed in a stainless steelcylindrical holder, <strong>and</strong> a copper stick served as the contact. The working area <strong>of</strong> theSnO 2 plate was 4.5 cm 2 . The conducting SnO 2 coated glasses were cleaned with acetone<strong>and</strong> then cleaned chemically in 0.1 M HNO 3 , rinsed with distilled water <strong>and</strong>dried. A st<strong>and</strong>ard KCl (sat) |AgCl, Ag electrode was used as the reference electrode.A platinum wire with the diameter <strong>of</strong> 1.0 mm <strong>and</strong> the active surface area <strong>of</strong> 12.5 cm 2was used as the counter electrode.Electrolyte solutions, pH = 8.3, containing H 2 SeO 3 <strong>of</strong> fixed concentrations(0.0005 M), Na 2 MoO 4 (0.05 M) <strong>and</strong> sodium citrate (0.22 M) were employed. Thechemicals used were Na 2 MoO 4 ·2H 2 O, H 2 SeO 3 <strong>and</strong> Na 3 C 6 H 5 O 7 ·2H 2 O, all <strong>of</strong> analyticalgrade. Each solution was freshly prepared with twice distilled water. The depositionwas carried out at a constant potential E = –1.0 V <strong>and</strong> the deposition temperature <strong>of</strong>15 ± 1 °C. The deposition time was 100 min. The thickness <strong>of</strong> the electrodepositedfilm was measured with a GAERTNER L115 laser ellipsometer (USA, Gaertner ScientificCorporation). The morphology <strong>of</strong> deposits was examined with a JOEL-SEM-1C25S (Japan) scanning electron microscope (SEM). For each sample, 10 surfacepoints were examined.An atomic force microscope Nanotop-206 (Microtestmashines Belarus) operatingin a contact state mode was used to investigate the roughness <strong>of</strong> the surface. It useda silicon cantilever, with the force constant <strong>of</strong> 5.0 N/m. The image processing <strong>and</strong>analysis <strong>of</strong> the scanning probe microscopy data were performed using the Windowsbased program Surface View, Version 1.0.
Electrochemically deposited thin Mo–O–C–Se film layers 95X-ray photoelectron spectroscopy (XPS) <strong>and</strong> Fourier transform infrared (FTIR)spectroscopy experiments were performed to obtain information on the exact composition<strong>of</strong> electrodeposits. X-ray photoelectron spectra were obtained with a Kratos AnalyticalXSAM800 spectrometer. The energy scale <strong>of</strong> the spectrometer was calibratedusing Au 4f 7/2 <strong>and</strong> Cu 2p 3/2 Ag 3d 5/2 peaks. The source was operating in aluminiumanode mode: non-monochromatized AlK α with the photon energy <strong>of</strong> 1486.6 eV. TheO 1s, C 1s, Mo 3d, <strong>and</strong> Se 3d spectra were determined at the 20 eV pass energy (0.05eV energy increment) <strong>of</strong> the hemispherical analyser. The fixed analyser transmission(FAT) mode was used. The resolution <strong>of</strong> the instrument was 0.2 eV. The chargingeffects were corrected by referring the binding energies to that the <strong>of</strong> C 1 s line at284.8 eV. The relative atomic concentrations <strong>of</strong> oxygen, carbon, molybdenum, <strong>and</strong>selenium were calculated from an appropriate peak area with respect to the sensitivityfactors, using the original Kratos s<strong>of</strong>tware. The XPSPEAK41 s<strong>of</strong>tware was employedfor the peak fitting procedure [7]. The Shirley background with Lorenz to Gauss rate0:100 <strong>and</strong> a symmetric line shape for all peaks were used. Assignation <strong>of</strong> the signals tospecific structures or given oxidation states <strong>of</strong> elements analysed was done by comparisonwith data available from the NIST st<strong>and</strong>ard Reference Database 20, Version3.4 [8] <strong>and</strong> to literature references. All samples were scanned as received – withoutundertaking ion beam surface cleaning procedure.Mo–O–C–Se deposits were scraped with a non-metallic scraper, <strong>and</strong> then scrapingswere solid-mixed with KBr, modulated into pellets <strong>and</strong> investigated by the FTIRspectroscopy to determine the chemical structure <strong>and</strong> binding configuration <strong>of</strong> a thinfilm. Spectra were recorded on a Perkin–Elmer FTIR system spectrum GX with theresolution <strong>of</strong> 1 cm –1 in the 4000–400 cm –1 spectral range.UV–Vis spectrometry was used to investigate the optical behaviour <strong>of</strong> the films. UV–Vis spectra were recorded with a UV/Visible Spectronic Genesis spectrophotometer in therange 200–800 nm. The absorption spectra <strong>of</strong> thin films were recorded using an identicaltransparent tin oxide coated glass plate as a reference, <strong>and</strong> the values <strong>of</strong> the optical absorptioncoefficient α were not corrected for the reflectance from the film surface. The opticalb<strong>and</strong>gap energy, E og , was obtained by studying the absorption edge behaviour.3. Results <strong>and</strong> discussion3.1. XPS analysisThe composition <strong>of</strong> deposits has been determined by the XPS measurements. Therecorded Mo 3d, Se 3d, O 1s <strong>and</strong> C 1s core level (CL) spectra are shown in Figs. 1–4,respectively. The line shape <strong>of</strong> measured Mo 3d CL spectrum (Fig. 1) is highly asymmetric,indicating the presence <strong>of</strong> mixed oxidation states <strong>of</strong> Mo. The molybdenumoxidation state was estimated by deconvolution <strong>of</strong> the peaks in the Mo 3d region. Thespin–orbit splitting between Mo 3d 5/2 <strong>and</strong> Mo 3d 3/2 signals was set to 3.14 eV <strong>and</strong> theintegral intensity <strong>of</strong> the doublet peaks was fixed before the fitting procedure was run.
96N. DUKSTIENE et al.Fig. 1. Mo 3d XPS spectra from Mo–O–C–Se film electrodeposited on a SnO 2 –glass plate:crosses – acquired data, dashed line – fitted curve, 1– MoSe 2 /Mo 2 C, 2 – MoO 2 /Mo x (OH) y , 3 – MoO 3Using the deconvolution technique, the best fit was obtained by resolving the spectruminto three pairs <strong>of</strong> Gaussian peaks, where 1, 2 <strong>and</strong> 3 represent the Mo 3d 5/2 level <strong>of</strong>different molybdenum oxidation states. The primed peaks represent Mo 3d 3/2 levels, respectively.The core level binding energy values <strong>of</strong> Mo 3d 5/2 signals were compared withthe values <strong>of</strong> corresponding states reported in the literature. When molybdenum is boundto selenium, the characteristic Mo 3d 5/2 signal appears at E b = 228.8 eV [9, 10]. It shouldbe noted that the Mo 3d 5/2 signal with a binding energy <strong>of</strong> 228.6 eV is typical <strong>of</strong> Mo 2+ inMo 2 C [11, 12]. According to literature data, the energy values <strong>of</strong> the Mo 3d 5/2 photoelectronsfor MoO 2 <strong>and</strong> MoO 3 are ca. 229 eV [13–17] <strong>and</strong> 232 eV [13–15, 17, 18], respectively.A peak with the binding energy <strong>of</strong> 230.8 eV is midway between those Mo 3d 5/2values assigned to MoO 2 <strong>and</strong> MoO 3 <strong>and</strong> corresponds to the Mo 5+ state associated with themixture <strong>of</strong> oxides <strong>and</strong> hydroxides, mainly in the form <strong>of</strong> Mo 4+ <strong>and</strong> Mo 5+ [14, 19, 20 ].Fig. 2. Se 3d XPS spectra from Mo–O–C–Se film electrodeposited on a SnO 2 –glass plate:crosses – acquired data, dashed line – fitted curve, 1– MoSe 2 , 2 – Se, 3 – SeO 2
Electrochemically deposited thin Mo–O–C–Se film layers 97The Se 3d spectrum (Fig. 2) <strong>of</strong> a film sample shows the total peak envelope withthe binding energy <strong>of</strong> 56 eV, which could be resolved into three peaks at 53.8, 55.9<strong>and</strong> 58.3 eV. The Se 3d spectrum displaces the expected MoSe 2 peak with the bindingenergy 53.8 eV [21, 22]. This peak <strong>and</strong> the position <strong>of</strong> the signal from Mo 3d 5/2 levelat E b = 228.7 eV strongly suggest the presence <strong>of</strong> MoSe 2 in thin film layers. It isknown that the binding energy <strong>of</strong> elemental selenium is about 55.4 eV [22, 23]. A smallpeak centred at 58.3 eV indicates that the film layer may contain SeO 2 [24, 25].Fig. 3. O 1s XPS spectra from Mo–O–C–Se film electrodeposited on a SnO 2 –glass plate:crosses – acquired data, dashed line – fitted curve, 1 – Mo–O, 2 – Mo–OH, 3 – H 2 O, 4 – C=OThe O 1s spectrum (Fig. 3) can be deconvoluted into four contributions with thebinding energies <strong>of</strong> 530.2, 531.1, 532.5 <strong>and</strong> 534.5 eV. The peaks at around 530 eV areknown to result from oxides, <strong>and</strong> the peak at 532 eV may be assigned to the structuralFig. 4. C 1s XPS spectra from Mo–O–C–Se film electrodeposited on a SnO 2 –glass plate:crosses – acquired data, dashed line – fitted curve, 1– Mo 2 C, 2 – C–C or C–H,3 – C–O, 4 – C=O, 5 – O– C=O. Inset: pure SnO 2 –glass plate
98N. DUKSTIENE et al.water while the peak at 531 eV to hydroxide [17, 19]. Besides, the plot areas <strong>of</strong> peakscorresponding to oxides are small compared with the area <strong>of</strong> hydroxides. This observationsuggests that the films consist largely <strong>of</strong> hydroxides. The O 1s peak componentat 534.5 eV corresponds to C=O from citrate [26].Figure 4 shows the C 1s region, after curve fitting to discriminate the various contributions.A very small peak at 283.6 eV is assigned to molybdenum carbide, inagreement with results published in the literature [15, 27]. The presence <strong>of</strong> smallquantities <strong>of</strong> carbides, probably Mo 2 C, has been observed in Mo–Co alloy electrodepositionfrom the sulphate–citrate medium [14]. The main signal at 284.8 eV correspondsto C–C <strong>and</strong> C–H bonds. Signals at 286.24, 287.88 <strong>and</strong> 288.46 eV are consistentwith the presence <strong>of</strong> C–O, C=O <strong>and</strong> O–C=O groups, respectively. These b<strong>and</strong>smainly originate from the citrate ion [26]. The XPS data are summarised in Table 1.Table 1. XPS results derived from the curve fitted deconvoluted spectraElementAtomicpercentage,%Bindingenergy,eVFWHM,eVNISTdataOxidationstateAttributionto structural elementfound inRelativepercentage,%229.2 1.8 228.3 4+/2+ MoSeMo2 . Mo 2 C 10.1820.81 230.6 1.8 230.6 4+/5+ MoO3d 2 /Mo x (OH) y 62.05/2232.0 1.7 232.6 6+ MoO 3 27.8253.8 1.8 53.5 2– MoSe 2 24.18Se 3d 1.52 55.9 1.8 55.7 0 Se 70.5958.3 1.9 58.0 4+ SeO 2 5.23530.1 2.0 530.8 Mo−O 7.14O 1s531.1 2.0 531.8 Mo x (OH) y 78.4260.19 532.3 1.9 532.8 H 2 O 12.61533.7 2.0 535.1 C=O 1.83283.6 1.9 282.7 Mo 2 C 10.19284.8 1.6 284.4 C−C, C−H 59.43C 1s 17.48 286.24 1.6 286.4 C−O 13.33287.9 2.0 287.8 C=O 4.21288.5 2.0 289.0 O−C=O 12.843.2. FTIR studiesFTIR spectrum (Fig. 5) has been analysed in terms <strong>of</strong> the vibration <strong>of</strong> isolated molecularunits <strong>and</strong> based on literature IR data on SeO 2 [28–31] <strong>and</strong> molybdenum oxides[32–36]. The results (cf. Table 2) strongly suggest that some selenium oxide exists inthin film layers, whereas weak absorption peaks indicate that the SeO 2 concentration issmall.The most pronounced absorption peak at 741 cm –1 is clearly related to Mo(IV) oxides[32–34]. The symmetric stretching modes <strong>of</strong> the terminal Mo=O bond <strong>of</strong> crystallineMoO 2 <strong>and</strong> crystalline MoO 3 appears at 985 cm –1 [35] <strong>and</strong> 990 cm –1 [36], respec-
Electrochemically deposited thin Mo–O–C–Se film layers 99tively. The terminal double bond peak downshift with respect to MoO 2 <strong>and</strong> MoO 3 mightbe assigned to the presence <strong>of</strong> OH groups in the structure <strong>of</strong> molybdenum oxide.Fig. 5. FTIR spectrum <strong>of</strong> the Mo–O–C–Se filmrecorded in 4000–400 cm –1 spectral regionTable 2. Results from the analysis <strong>of</strong> FTIR spectrum <strong>of</strong> Mo–O–C–Se filmWavenumber,cm –14747418669271065139816213373Assignmentν s (Se−O−Se)ν (Mo–O)ν as (O–Mo–O)(Mo=O)(Se–O)COO –δ (H–O–H), COO – ,ν (Mo–OH),As a result <strong>of</strong> this interaction, a broad b<strong>and</strong> assigned to the stretching mode ν OH <strong>of</strong>adsorbed water molecule <strong>and</strong> OH groups linked in the form <strong>of</strong> Mo–OH is present at3373 cm –1 .3.3. Morphology <strong>of</strong> a thin film layerThin film layers with the thickness <strong>of</strong> 110 ± 60 nm were electrodeposited ona SnO 2 –glass plate. Visually, the as-deposited films are mirror-like <strong>and</strong> coloured in abrown tint. Thin film layers were analysed without further treatment other than rinsingwith distilled water. The micrograph <strong>of</strong> a thin film layer shown in Fig. 6 indicates
100N. DUKSTIENE et al.long-sized wires distributed all over the surface. AFM images (Fig. 7) show that wirescover the surface well, without any cracks <strong>and</strong> pinholes.Fig. 6. SEM image <strong>of</strong> the Mo–O–C–Se filmelectrodeposited on a SnO 2 –glass plateFig. 7. AFM images <strong>of</strong> the Mo–O–C–Se film electrodepositedon a SnO 2 –glass plate; a) 2D topography, b) 3D topography3.4. UV–Vis studiesThe optical absorption <strong>of</strong> the film was studied in the wavelength range from 200to 800 nm without accounting for reflection <strong>and</strong> transmission losses. The UV–Vistransmittance spectrum <strong>of</strong> freshly deposited thin Mo−O–C–Se film is shown in Fig. 8.The transmission shows an intense minimum in the UV region. A less intense minimumin the red region is also observed. An absorption edge <strong>of</strong> the film is observed at670 nm <strong>and</strong> lies in the visible wavelength range. Transmittance values higher than100% between 670 <strong>and</strong> 800 nm can be ascribed to the fact that the Mo–O–C–Se filmsurface is smoother <strong>and</strong> less light-scattering than the SnO 2 surface used as a referencefor optical transmission measurements.The optical absorption coefficient α for the wavelength range near <strong>and</strong> below theabsorption edge is found to have a value <strong>of</strong> 3.98×10 4 cm –1 . The variation <strong>of</strong> opticaldensity with wavelength was analysed to find the nature <strong>of</strong> transition involved <strong>and</strong> theoptical b<strong>and</strong>gap energy (E og ).
Electrochemically deposited thin Mo–O–C–Se film layers 101The variation <strong>of</strong> the optical absorption coefficient α near the absorption edge followsthe power law in the formBE ( − E ) nogα = (1)Ewhere: E is the photon energy, hν, E og is the b<strong>and</strong>gap energy <strong>of</strong> the system, B is thefunction <strong>of</strong> the density <strong>of</strong> states near the conduction <strong>and</strong> valence b<strong>and</strong> edges. Thevalue <strong>of</strong> n is 2 for allowed direct transition <strong>and</strong> 1/2 for the allowed indirect transition.Fig. 8. UV-Vis spectrum <strong>of</strong> the Mo–O–C–Se film electrodeposited on a SnO 2 –glass plateFig. 9. Plot <strong>of</strong> (αhν) 2 versus photon energy <strong>of</strong> the Mo–O–C–Sefilm electrodeposited on a SnO 2 –glass plate
102N. DUKSTIENE et al.High α values suggest the existence <strong>of</strong> direct b<strong>and</strong>gap transition. The type <strong>of</strong> opticaltransition in the Mo–O–C–Se film has been determined from the dependence <strong>of</strong>(αhν) 2 on the photon energy (Fig. 9). A linear rise near the absorption edge confirmsthe direct nature <strong>of</strong> transition. Extrapolating the linear part <strong>of</strong> the plot towards zeroabsorption, the intercept with the energy axis determines the optical b<strong>and</strong>gap energy(E og ) value <strong>of</strong> 1.75 eV.4. ConclusionsXPS analysis confirms that Mo−O–C–Se film layers are heterogeneous <strong>and</strong> arecomposed <strong>of</strong> MoSe 2 , Se, SeO 2 <strong>and</strong> molybdenum oxides <strong>and</strong> hydroxides. XPS corelevel analysis revealed the presence <strong>of</strong> Mo 4+ , Mo 5+ <strong>and</strong> Mo 6+ oxidation states.FT-IR spectra confirmed the hydrous nature <strong>of</strong> Mo−O–C–Se film.SEM <strong>and</strong> AFM revealed the film surface to be <strong>of</strong> device-grade quality, <strong>and</strong> to befree <strong>of</strong> any pinholes.Optical studies showed that thin Mo−O–C–Se film has a high optical absorptioncoefficient <strong>and</strong> direct b<strong>and</strong> to b<strong>and</strong> type optical transition. The b<strong>and</strong>gap energy E ogequals 1.75 eV.References[1] BOLIVAR H., IZQUIERDO S., TREMONT R., CABRERA C.R., J. Appl. Electrochem., 33 (2003), 1191.[2] BEATO P., BLUME A., GIRGSDIES F., JENTOFT R.E., SCHOEGL R., TIMPE O., TRUNSCHE A., WEINBERG G.,BASHER Q., HAMID F.A., HAMID S.B.A., OMA E., MOHOD SALIM L., Appl. Catal. A, 307 (2006), 137.[3] US Patent No. 6214090, 2005.[4] YUFIT V., NATHAN M., GOLODNITSKY D., PELED E., J. Power Sources, 122 (2003), 169.[5] NAGIRNYI V.M., APOSTOLOVA R.D., BASKIEVICH A.S., SHEMBEL E.M., Russ. J. Appl. Chem., 76(2003), 1438.[6] DUKSTIENE N., TATARISKINAITE L., Polish J. Chem., 80 (2006), 1715.[7] XPSPEAK41 s<strong>of</strong>tware, http://www.phy.cuhk.edu.hk/~surface/ , April 2005.[8] National Institute <strong>of</strong> St<strong>and</strong>ard <strong>and</strong> Technology, NIST on line Databases. X-ray Photoelectron SpectroscopyDatabase. http://www.sr.data.nist.gov/xps (Accessed March 2007)[9] GRIM S.O., MATIENZO L.J., Inorg. Chem., 14 (1975), 1014.[10] BOLIVAR H., IZQUIERDO S., TREMONT R., CABRERA C.R., ASSMANN L., BERNEDE J.C., DRICI A.,AMORY C., HALGAND E., MORSLI M., Appl. Surf. Sci., 246 (2005), 159.[11] ZHANG Y., XIN Q., RODRIQUEZ-RAMOS I., GUERRERO-RIUZ A., Mat. Res. Bull., 34 (1999), 145.[12] BRIGGS D., SEAH M.P., Practical Surface Analysis, Vol. 1, Wiley, New York, 1990.[12] ZACH M.P., INAAZU K., NG K.H., HEMMINGER J.C., PENNER R.M., Chem. Mater., 14 (2002), 3206.[14] GOMEZ E., PELLICER E., VALLES E., J. Electroanal. Chem., 580 (2005), 238.[15] RUIZ F., BENZO Z., QUINTAL M., GARABOTO A., ALBORNAZ A., BRITO J.L., Appl. Surf. Sci., 252(2006), 8695.[16] DI G.G.D., SELMAN J.R., J. Electroanal. Chem., 559 (2003), 31.[17] BARTOLOME J.F., DIAZ M., REQUENA J., MOYA J.S., TOMSIA P., Acta Mater., 47 (1999), 3891.[18] PATISSIER-BLONDEAU V., DOMENICHINI B., STEINBRUN A., BOURGEOIS S., Appl. Surf. Sci., 175(2001), 674.
Electrochemically deposited thin Mo–O–C–Se film layers 103[19] NAKAYAMA M., KOMATASU H., OZUKA S., OGURA K., Electrochim. Acta, 51 (2005), 274.[20] SANCHES L.S., DOMINIGUES S.H., MARINO C.E.B., MASCARO L.H., Electrochem. Commun., 6 (2004), 543.[21] BASOL B.M., KAPUR V.K., LEDIDHOLM C.R., MINICH A., HALANI A., First WCPEC, Dec. 5–9, 1994,Hawaii.[22] SALTAS A., PAPAGEORGOPOULOS C.A., PAPAGEORGOPOULOS D.C., TONTI D., PETTENKOFER C.,JAEGERMAN W., Thin Solid Films, 389 (2001), 307.[23] SURODE P.R., RAO K.J., HEGD M.S., RAO C.N.R., J. Phys. C, 12 (1979), 4119.[24] DIMITRIEV Y., YORDANOV ST., LAKOV L., J. Non-Crystal. Solids, 293 (2001), 410.[25] IWAKURO H., TATSUYMA C., ICHIMURA J., Appl. Phys., 21 (1982), 9463.[26] CHONGDAR S., GUNASEKARU G., KUMAR P., Electrochim. Acta, 50 (2005), 4655.[27] LECLERCQ G., KAMAL K., LAMONIER J.F., FEIGENBOUM L., MALFOY P., LECLERCQ L., Appl. Catal. A,Gen., 121 (1995), 169.[28] NAKAMOTO K., IR Spectra <strong>of</strong> Inorganic <strong>and</strong> Coordination Compounds, Mir, Moskva, 1991 (in Russian).[29] SIMON A., PACTZOLD R., Anorg. Allg. Chem., 301 (1959), 246.[30] BRABSON G.D., ANDREWS L., MARSDEN C., J. Phys. Chem., 100 (1996), 16487.[31] CHEN Y.-W., LI L., D’ULIVO A., BELZILE N., Anal. Chim. Acta, 577 (2006), 126.[32] NIU Z.J., YAO S.B., ZHOU S.M., J. Electroanal. Chem., 455 (1998), 205.[33] GOMEZ E., PELLICER E., VALLES E., J. Appl. Electrochem., 33 (2003), 245.[34] MELTS G., LINSEED CH., GOTTSCHALK R., DIETER M., FIND J, HEREIN D., JAEGR J., UCHIDA Y.,SCHOLL R., J. Mol. Catal. A, 162 (2000), 463.[35] MARTOS M., MORALES J., SANCHES L., J. Mater. Chem., 12 (2002), 2979.[36] DU X., DONG L., LI CH., LIANG Y., CHEN Y., Langmuir, 15 (1999), 1693.Received 20 November 2008Revised 19 June 2009
Materials Science-Pol<strong>and</strong>, Vol. 28, No. 1, 2010Advances in flash memory devices *C. LUDWIG 1** , M.F. BEUG 2 , K.-H. KÜSTERS 31 Q-Cells SE, OT Thalheim, Sonnenallee 17–21, 06766 Bitterfeld-Wolfen, Germany2 Physikalisch-Technische Bundesanstalt (PTB), Bundesallee 100, 38116 Braunschweig, Germany3 Conergy SolarModule GmbH, Conergy-Straße 8, 15236 Frankfurt (Oder), GermanyFundamental challenges are discussed concerning the down-scaling <strong>of</strong> flash memory cells for massstorage applications. A general scaling issue for all various memory cell concepts is the structuring limit<strong>of</strong> conventional lithography. Therefore sub-lithographical structuring methods like e.g., double-patterningfor future flash chips, have been evaluated. Another common scaling challenge <strong>of</strong> charge trapping (CT)<strong>and</strong> floating gate (FG) cells, the two future concurrent flash memory cell concepts, is the introduction <strong>of</strong>new materials such as high k dielectrics. Their implementation into CT <strong>and</strong> FG cells <strong>and</strong> the scaling relatedelectrical issues <strong>of</strong> both cell concepts is also been discussed.Keywords: non-volatile memory; flash; charge trapping; SONOS; TANOS; high workfunction gate; high-kdielectric; double patterning; erase saturation1. IntroductionFlash memories enjoy a strongly growing dem<strong>and</strong>. Further productivity improvementsin the manufacture <strong>of</strong> flash devices have been achieved by continued scaling,recently formulated as Hwang’s law [1]. Currently, the smallest flash products areavailable in the 50 nm generation. Attempts to increase the density <strong>of</strong> bits per areahave addressed the challenges <strong>of</strong> designing as well as fabrication <strong>of</strong> the flash cell.2. Lithography challenges for future flash technology nodesSilicon structuring is currently facing a paradigm change. Considerable effort hasbeen spent on techniques to enhance the resolution <strong>of</strong> the illumination systems, opti-_________* The paper has been presented at the 3rd Workshop on Hybrid Nanostructured Materials, Prague,5 November 2007.** Corresponding author, e-mail: C.Ludwig@q-cells.com
106C. LUDWIG et al.mizing the usage <strong>of</strong> the 193 nm wavelength. The most prominent one is the successfuldevelopment <strong>of</strong> immersion scanners, allowing numerical apertures larger than 1.In order to achieve smaller features, a next step could be the introduction <strong>of</strong> extremeUV (EUV) scanners, operating at the wavelength <strong>of</strong> 13.5 nm. However, thisspectral range comes along with a number <strong>of</strong> challenges as e.g. new diffraction elements,new mask materials <strong>and</strong> mask manufacturing, new resistance materials, <strong>and</strong>others. As an alternative, more conservative approach, so called double patterningtechniques have been developed recently. These methods consist <strong>of</strong> process sequenceswhich generate smaller pitches than the ones which are feasible by direct application<strong>of</strong> lithography tools. Basically, there are two options: one is subsequent printing <strong>of</strong>even <strong>and</strong> odd lines <strong>of</strong> an array separately, i.e. simply applying two subsequent lithographysteps with an appropriate displacement. The other option uses spacers along thelines <strong>of</strong> a single lithography, <strong>and</strong> thus makes a pair <strong>of</strong> lines per one lithographicallygenerated line. Figure 1 illustrates a possible process flow. In Figure 2, we show a part<strong>of</strong> a flash array including the fan out, resulting from this technique.Fig. 1. Schematic process flow for double patterning: lithography defines an array with only half the number<strong>of</strong> lines, reflecting twice the desired pitch (a). The lines are narrowed by a trim etch (b) <strong>and</strong> a spaceris placed along the lines (c). The room between the lines is filled by the same material as the lithographicallydefined lines (d). After removing the spacers (e), a line array is obtained in the desired pitch (f)Fig. 2. Wordline fanout <strong>of</strong> a 36 nm half pitch array
Advances in flash memory devices 107This technique opens a new path to the next flash shrink generations without theneed <strong>of</strong> expensive investment in lithography tools [2].3. NAND shrink pathThe highest bit densities have been continuously achieved in st<strong>and</strong>ard floating-gate(FG) NAND flash products, utilizing Fowler–Nordheim (FN) tunnelling for write <strong>and</strong>erase operations. However, there remain several challenges associated with persistentlyminimizing the dimensions <strong>of</strong> conventional floating gates (FG) in flash devices [3].One <strong>of</strong> them is the crosstalk between adjacent FG cells [4], caused by the electrostaticinteraction <strong>of</strong> the stored charge <strong>of</strong> all neighbouring floating gates on the FG <strong>and</strong>on the channel region <strong>of</strong> one particular flash cell. There is a significant capacitivecoupling between neighbouring flash cells due to the relatively large height <strong>of</strong> FGpoly silicon storage elements. Their height is typically in the order <strong>of</strong> twice the halfpitch,which is the distance between adjacent cells or even larger. As a result <strong>of</strong> thiscross-talk, the unit elements <strong>of</strong> a Gbit scale flash memory array can no longer be consideredindependent.Luckily, the coupling between adjacent FG is a deterministic effect. It can betreated by appropriate programming algorithms which extrapolate the cross-talk fromthe data pattern <strong>and</strong> adjust the amount <strong>of</strong> injected electrons for the individual flashcells accordingly.Another challenge to be discussed here is related to the high wordline voltagesneeded for programming. During programming, selected <strong>and</strong> unselected wordlinesmay happen to be direct neighbours. Their difference in voltage becomes a challengeas soon as it reaches the level <strong>of</strong> the breakdown field strength <strong>of</strong> the insulating dielectricbetween them. A brief glance at numerous sub-50 nm flash devices shows that thisis becoming a significant issue. The magnitude <strong>of</strong> the program pulse voltages is determinedby two factors: the tunnelling oxide (TOX) thickness <strong>and</strong> the efficiency <strong>of</strong>the capacitive voltage transfer from the wordline to the FG body, called the gate couplingratio [5, 6]. The latter depends on FG cell geometry <strong>and</strong> dielectric constants <strong>of</strong>the insulating materials around the FG. The TOX thickness dictates the voltage differenceacross the TOX barrier in order to achieve FN tunnelling. The data retention requirement<strong>of</strong> 10 years leads to a typical TOX thickness between 8 <strong>and</strong> 9 nm, resultingin a voltage difference <strong>of</strong> 10–13 V between FG <strong>and</strong> the channel region. With typicalvalues <strong>of</strong> the gate coupling ratio <strong>of</strong> 0.5~0.6, wordline voltages typically exceed 20 V.Provided the voltage <strong>of</strong> an unselected wordline is kept at a half or a third <strong>of</strong> this value,the dielectric breakdown between selected <strong>and</strong> unselected wordlines during programmingbecomes an issue for technology generations below 30 nm. Therefore, the reduction<strong>of</strong> the programming voltage <strong>and</strong> the reduction <strong>of</strong> the FG–FG coupling deserveutmost attention.Suggestions have been made to reduce the programming voltage by modifying theTOX barrier. Instead <strong>of</strong> a single SiO 2 layer, a tailored b<strong>and</strong>gap-engineered tunnelling
108C. LUDWIG et al.barrier can effectively enhance the tunnelling probability at high fields during programming,<strong>and</strong> still serve as a sufficient tunnelling barrier at low fields, keeping theescape rate low enough for good data retention [7–9]. Whatever material is investigatedfor this type <strong>of</strong> b<strong>and</strong>gap-engineering, it eventually must reach the high <strong>and</strong> maturequality <strong>of</strong> SiO 2 with respect to defect level <strong>and</strong> breakdown voltage.Another possibility for a reduction <strong>of</strong> programming voltage is an increased capacitivecoupling between control gate <strong>and</strong> floating gate. This can be achieved by insertinga high k material as interpoly dielectric (IPD) between the control gate <strong>and</strong> floatinggate instead <strong>of</strong> the conventional oxide–nitride–oxide arrangement. Again, high electricbreakdown fields <strong>and</strong> low trap density are important parameters. In addition, a largeb<strong>and</strong>gap is desirable to act as an effective tunnelling barrier. Viable c<strong>and</strong>idate materialsare e.g. Al 2 O 3 or HfSiO. Figure 3 shows an example <strong>of</strong> a 48 nm half pitch FG flashwith Al 2 O 3 IPD. Here, the programming voltage is reduced by 2 V.Fig. 3. TEM cross-section <strong>of</strong> a 48 nm half pitchfloating gate flash. Interpoly dielectric betweenthe floating gate <strong>and</strong> control gate consists<strong>of</strong> a bilayer <strong>of</strong> 5 nm oxide <strong>and</strong> 7 nm Al 2 O 3Fig. 4. 48 nm NAND flash with Ti(Si)N metal gateAnother very critical issue in FG flash cells beyond the 40 nm technology generationis the placement <strong>of</strong> the control gate (CG) plug between the cells [10]. This plug isimportant for the following two reasons. On the one h<strong>and</strong>, this increases the capacitivecoupling area between CG <strong>and</strong> FG which allows gate coupling ratios in the rangementioned above. On the other h<strong>and</strong>, this CG plug electrically shields <strong>and</strong> thereforereduces the charge crosstalk in wordline direction between adjacent floating gates. Butbelow 40 nm half pitch, there is literally not enough space between the flash cells forthe CG plug. With a typical interpoly thickness <strong>of</strong> 12~15 nm, which has to fit twiceinto the intercell spacing, not much room is left to insert the CG poly as well. Furthermore,a conventional poly CG will always experience a depletion layer <strong>of</strong> a few
Advances in flash memory devices 109nm thickness once operating voltages are applied. Therefore a metallic conductorseems desirable. Figure 4 demonstrates such an example with Ti(Si)N as a CG electrode.4. Charge trapping flashAn elegant way to address all the mentioned concerns in NAND flash is the replacement<strong>of</strong> the FG poly by a thin charge trapping layer, i.e. a SONOS-type (silicon–oxide–nitride–oxide–silicon) flash cell with proper material selections (see alsoFig. 5). Both the programming voltage reduction <strong>and</strong> the coupling between adjacentflash cells can be significantly reduced in such a kind <strong>of</strong> charge trapping flash.Fig. 5. Material options to improve the properties <strong>of</strong> a charge trapping flashHere, the storage layer has a typical thickness in the order <strong>of</strong> 10 nm or below, muchless than a typical FG poly. Therefore, the mere geometry <strong>of</strong> this stack provides a muchsmaller coupling area to accommodate an adjacent storage cell, thus minimizing thelateral cross-talk. We have used our Twinflash technology (see below) to quantify thecross-talk between charge trapping cells. Twinflash cells in the buried bit line (BBL)array configuration [16] are planar cells without shallow trench isolation (STI) betweenadjacent cells (or wordlines). Figure 6 shows the cross-talk analysis on a charge trappingcell with a 6 nm thick Si 3 N 4 layer. As the worst case, the two neighbours <strong>of</strong> an erasedflash cell (low V t ) are considered programmed (high V t ). The two neighbour cells aresupposed to sit on the same bit line as the erased flash cell. Measured data <strong>and</strong> simulationsshow that for an extremely aggressive 20 nm spacing between the adjacent cells,the cross talk creates a V t shift <strong>of</strong> 400~500 mV, whereas only a 100 mV cross-talk isobserved for a 63 nm spacing. This result is generally also valid for the most commonlyused NAND architecture. It shows that cross-talk between neighbouring CT cells cannotbe neglected, as sometimes stated in the literature.The programming voltage in charge trapping (CT) flash cells is generally reducedby the thinner tunnel oxide compared with FG cells (5 nm instead <strong>of</strong> 8 nm) <strong>and</strong> theoverall smaller electrical thickness <strong>of</strong> the whole CT dielectric stack. A high k dielectricmaterial as the top-oxide is introduced to solve the SONOS erase saturation issue[11] when tunnel oxides thicker than 4 nm are used.
110C. LUDWIG et al.Fig. 6. Crosstalk in Twinflash 63 nm: simulation <strong>and</strong> measurement. Upperpart shows a sketch<strong>of</strong> the cross section perpendicular to the channel with simulated electron distributions in the channel.The gates are represented by white areas, with their respective voltages. The black lines arethe simulated equipotential lines. The channel region <strong>of</strong> the central gate is in inversion.Obviously, the effective channel width strongly depends on the gate voltages <strong>of</strong> the left<strong>and</strong> the right gate. Lower part shows the simulated threshold voltage shifts in function<strong>of</strong> the gate potential on the neighbour cells <strong>and</strong> the measured shift <strong>of</strong> a 63 nm Twinflash cell arrayThe erase saturation is a fundamental challenge <strong>of</strong> the conventional silicon basedSONOS flash with symmetrical materials <strong>and</strong> geometry. In such a st<strong>and</strong>ard structure,it turns out that the Vt after erasure cannot go much below the virgin value. The erase
Advances in flash memory devices 111voltage is supposed to create a hole tunnelling current from the substrate through thebottom oxide into the storage nitride. But as soon as the majority <strong>of</strong> stored electrons isneutralized, electrons out <strong>of</strong> the gate will start penetrating through the top oxide intothe storage nitride <strong>and</strong> will eventually compensate the hole injection, as indicated inFig. 7. Using a high k dielectric as a top oxide will improve the erase saturation issuecompared to a SiO 2 top oxide, due to its lower internal field. Al 2 O 3 is the preferredc<strong>and</strong>idate because it acts as an effective tunnelling barrier due to its high b<strong>and</strong>gap <strong>and</strong>its relatively low trapping state density.Fig. 7. Erase saturationFig. 8. Erase efficiency for charge trapping flash: a) with Al 2 O 3 as high k top oxide,b) with Al 2 O 3 as high k top oxide <strong>and</strong> in addition TaN as a gate electrode.Sample (b) with the high work function metal gate reaches significantly lower erase V t .See also K.H.Küsters et al., MSE2008The most recent developments <strong>of</strong> charge trapping flash, however, utilize a gatematerial with a large work function in addition to high k top oxide dielectric. Typicalmaterials are TaN, TiN, W, WN [10, 12]. The reason for the need <strong>of</strong> a high work func-
112C. LUDWIG et al.tion gate is the problem <strong>of</strong> the erase saturation. If the b<strong>and</strong> <strong>of</strong>fsets <strong>of</strong> the high k topoxide <strong>and</strong> the work function <strong>of</strong> the gate material are large enough, tunnelling acrossthe high k top oxide will be strongly suppressed, thus eliminating the erase saturation.Figure 8 demonstrates the improvement in erase level for a TANOS charge trappingflash (TaN gate–Al 2 O 3 top oxide–Si 3 N 4 charge storage–SiO 2 bottom oxide–Si channel)in comparison with a SANOS stack (with st<strong>and</strong>ard n+ gate instead <strong>of</strong> the TaN gate).However, in the TANOS flash, the erase performance <strong>and</strong> the data retention seemto be two conflicting target parameters. The introduction <strong>of</strong> Al 2 O 3 top oxide turns outto degrade the data retention. This effect can be ascribed to the somewhat lower b<strong>and</strong>gapcompared with SiO 2 <strong>and</strong> to some detrapping inside the Al 2 O 3 .5. Localized charge trapping flashThe usage <strong>of</strong> trap centres in a dielectric for storing the charge provides an additionaladvantage over a poly FG flash. Electrically confined local storage <strong>of</strong> more thanone bit per flash cell is feasible if localized charge injection mechanisms are used. Hotelectron (CHE) <strong>and</strong> hot hole injection into a trapping layer like Si 3 N 4 are c<strong>and</strong>idatesfor the write <strong>and</strong> erase mechanisms, as implemented in NROM TM [13], Twinflash TM[14–16], Mirrorbit TM [17] <strong>and</strong> other products. A typical process sequence consists <strong>of</strong>st<strong>and</strong>ard ONO deposition as trapping layer, buried bit lines, a st<strong>and</strong>ard gate, st<strong>and</strong>ardcontact <strong>and</strong> st<strong>and</strong>ard metallization.Fig. 9. Cross-section <strong>of</strong> a Twinflash 63 nm cell, along <strong>and</strong> perpendicular to the wordline. The wordlineconsists <strong>of</strong> a tungsten layer on top <strong>of</strong> a n type poly. Two charge packets, representing two locally confinedbits a <strong>and</strong> b, can be stored in the nitride film <strong>of</strong> the oxide–nitride–oxide layer <strong>of</strong> one flash cellA cross section <strong>of</strong> a 63 nm half-pitch Twinflash is shown in Fig. 9. A Twinflashshrink using double patterning should have an asymmetric cell layout geometry, as shownin Fig. 10. Only the width <strong>of</strong> the MOS channel is reduced, whereas the channel length iskept fixed to accommodate for the high source-drain potential difference during CHEprogramming. The voltage data <strong>of</strong> a Twinflash with sub-lithographical dimensions areshown in Fig. 11 <strong>and</strong> 12 [18]. The flash cells with a width <strong>of</strong> 45 nm exhibit reasonableprogramming <strong>and</strong> erase <strong>and</strong> can withst<strong>and</strong> 100 000 cycles without degradation.
Advances in flash memory devices 113Fig. 10. Sub-lithographical shrink <strong>of</strong> Twinflash cellsFig. 11. Electrical results <strong>of</strong> narrow TwinFlash cells (45 nm width): Programming (a) <strong>and</strong> erase (b)Fig. 12. Dependence <strong>of</strong> V t on the cyclecount. Narrow cells show goodendurance behaviour up to 100kcycles. The window between programmed<strong>and</strong> erased state remainswithout significant degradation
114C. LUDWIG et al.6. ConclusionsNext generations <strong>of</strong> flash will continuously be scaled down. Lithography beingstuck at the 193 nm level is not considered an obstacle, since double patterning methodsmake sub-lithographical dimensions well below 40 nm accessible.However, new materials will be needed to ensure robust operation <strong>of</strong> the flash devices.For both the conventional FG flash <strong>and</strong> charge trapping flash, high k dielectricswith large b<strong>and</strong>gap <strong>and</strong> low leakage at high fields need to be developed to a maturitygood enough for reliable mass manufacture.A charge trapping flash will in addition require high work function materials.A complete set <strong>of</strong> materials which achieve good data retention, good endurance, <strong>and</strong>good erase <strong>and</strong> program levels <strong>and</strong> write speed, is still to be discovered.AcknowledgementsThis work was financially supported by the Federal Ministry <strong>of</strong> Education <strong>and</strong> Research <strong>of</strong> the FederalRepublic <strong>of</strong> Germany (Projects Nos. 01M3167 A <strong>and</strong> 01M3171 A).References[1] HWANG C.-G., International Solid State Circuits Conference, 2 (2002).[2] BEUG M. F., PARASCANDOLA S., HOEHR T., MUELLER T., REICHELT R., MUELLER-MESKAMP L.,GEISER P., GEPPERT T., BACH L., BEWERSDORFF-ARLETTE U., KENNY O., BRANDL S., MARSCHNER T.,MEYER S., RIEDEL S., SPECHT M., MANGER D., KNOEFLER R., KNOBLOCH K., KRATZERT P., LUDWIG C.,KUESTERS K.-H., Non Volatile Semiconductor Memory Workshop, 9 (2008), 77.[3] KIM K., CHOI J., Non Volatile Semiconductor Memory Workshop, 21 (2006), 9.[4] LEE J.-D., HUR S.-H., CHOI J.-D., IEEE Electron Dev. Lett., 23 (2002), 264.[5] BEZ R., CAMERLENGHI E., CANTARELLI D., RAVAZZI L., CRISENZA G., International Electron DevicesMeeting, (1990), 99.[6] GHETTI A., BORTESI L., VENDRAME L., Solid State Elelctron., 49 (2005), 1805.[7] LIKHAREV K., Appl. Phys Lett., 73 (1998), 2137.[8] BLOMME P., AKHEYAR A., VAN HOUDT J., DE MEYER K., International Conference on Memory Technology<strong>and</strong> Design, (2005), 239.[9] LUE H.-T., WANG S.-Y., LAI E.-K., SHIH Y.-H., LAI S.-C., YANG L.-W., CHEN K.-C., KU J.,KUANG-YEU HSIEH K.-Y., LIU R., LU C.-Y., International Electron Devices Meeting, (2005), 547.[10] CHAN N., BEUG M. F., KNOEFLER R., MUELLER T., MELDE T., ACKERMANN M., RIEDEL S., SPECHT M.,LUDWIG C., TILKE A.T., Non Volatile Semiconductor Memory Workshop, 9 (2008), 82.[11] BACHHOFER H., REISINGER H., BERTAGNOLLI E., VON PHILIPSBORN H., J. Appl. Phys., 89 (2001), 2791.[12] LEE C.-H., CHOI J., KANG C., SHIN Y., LEE J.-S., SEL J., SIM J., JEON S., CHOE B.-I., BAE D., PARK K.,KIM K., Symposium on VLSI Technology, (2006), 21.[13] EITAN B., COHEN G., SHAPPIR A., LUSKY E., GIVANT A., JANAI M., BLOOM I., POLANSKY Y.,DADASHEV O., LAVAN A., SAHAR R., MAAYAN E., International Electron Devices Meeting, (2005),539.[14] STEIN VON KAMIENSKI E. G., ISLER M., MIKOLAJICK T., LUDWIG C., SCHULZE N., NAGEL N., RIEDEL S.,WILLER J., KUESTERS K.-H., NVMTS, (2005), 5.
Advances in flash memory devices 115[15] WILLER J., LUDWIG C., DEPPE J., KLEINT C., RIEDEL S., SACHSE J.-U., KRAUSE M., MIKALO R., STEINVON KAMIENSKI E.G., PARASCANDOLA S., MIKOLAJICK T., FISCHER J.-M., ISLER M., KUESTERS K.-H.,BLOOM I., SHAPPIR A., LUSKY E., EITAN B., Symposium on VLSI Technology, (2004), 76.[16] NAGEL N., OLLIGS D., POLEI V., PARASCANDOLA S., BOUBEKER H., BACH L., MÜLLER T., STRASSBURG M.,RIEDEL S., KRATZERT P., CASPARY D., DEPPE J., WILLER J., SCHULZE N., MIKOLAJICK T., KUESTERS K.-H.,SHAPPIR A., REDMARD E., BLOOM I., EITAN B., International Symposium on VLSI Technology, Systems<strong>and</strong> Applications, 90 (2007), 120.[17] KUO T.H., YANG N., LEONG N., WANG E., LAI F., LEE A., CHEN H., CHANDRA S., WU Y., AKAOGI T.,MELIK-MARTIROSIAN A., POURKERAMATI A., THOMAS J., VAN BUSKIRK M., VLSI Circuits, Digest <strong>of</strong>Techn. Papers (2006), 114.[18] BEUG M.F., KNOEFLER R., LUDWIG C., HAGENBECK R., T MÜLLER T., RIEDEL S., ISLER M.,STRASSBURG M., HOEHR T., MIKOLAJICK T., KUESTERS K.-H., International Conference on MemoryTechnology <strong>and</strong> Design (2007), 191.Received 6 October 2008Revised 20 July 2009
Materials Science-Pol<strong>and</strong>, Vol. 28, No. 1, 2010Optimization <strong>of</strong> MFIS structurescontaining poly(vinylidene-fluoride trifluoroethylene)for non-volatile memory applicationsK. HENKEL * , B. SEIME, I. PALOUMPA, K. MÜLLER, D. SCHMEISSERBr<strong>and</strong>enburgische Technische Universität, Angew<strong>and</strong>te Physik-Sensorik,K.-Wachsmann-Allee 1, D-03046 Cottbus, GermanyIn the paper, we report on ways to optimize metal–ferroelectric–insulator–semiconductor (MFIS)stacks in terms <strong>of</strong> the thickness combination <strong>of</strong> the ferroelectric <strong>and</strong> the buffering insulator layers in orderto reduce the operation voltage <strong>of</strong> MFIS based non-volatile memory elements. The stack containspoly(vinylidene fluoride-trifluoroethylene) (P(VDF-TrFE)) as a ferroelectric layer. We discuss the optimization<strong>of</strong> the deposition <strong>of</strong> this material in order to produce thin films with high polarization. This mustbe accompanied by an adapted buffer layer, where reduction <strong>of</strong> thickness as well as increase <strong>of</strong> permittivitycan be taken into account. We show the results based on capacitance voltage measurements (CV) onMFIS stacks, where SiO 2 <strong>and</strong> Al 2 O 3 <strong>of</strong> different thicknesses have been used. Furthermore, we performsimulations <strong>of</strong> the CV characteristics <strong>and</strong> we are able to quantify the polarization <strong>and</strong> decline it from theCV curves. We observe for a 120 nm P(VDF-TrFE)/11 nm Al 2 O 3 stack in a ±20V CV loop almost saturatedpolarization values as predicted by the simulations in that way.Keywords: P(VDF-TrFE), MFIS, non-volatile memory, FeFET1. IntroductionFerroelectric field effect transistors (FeFETs) are considered c<strong>and</strong>idates for futurenon-volatile <strong>and</strong> non-destructive readout memory cells [1, 2]. The first attempt <strong>of</strong>combining the ferroelectricity with a field effect device has been demonstrated in [3].The physics <strong>of</strong> the FeFET is described in [4]. The working principle <strong>of</strong> the device isbased on bistable influence <strong>of</strong> different polarization states inside the ferroelectric insulatoron the drain current (refer to Fig. 1a). The substitution <strong>of</strong> conventionalperowskite type ferroelectrics by a polymer type material leads to possible low costsolutions <strong>of</strong> this kind <strong>of</strong> a memory cell. Furthermore, FeFETs composed <strong>of</strong> conven-_________* Corresponding author, e-mail: henkel@tu-cottbus.de
118K. HENKEL et al.tional materials have been shown to work in general but they need expensive hightemperature <strong>and</strong> high oxygen partial pressure processing steps inducing also unintentional<strong>and</strong> undefined interfacial layers [2, 5]. Poly(vinylidene fluoride trifluoroethylene)P(VDF-TrFE) is an organic ferroelectric material. It is available for spin coatingat room temperature after solving it in non-toxic 2-butanone. In this case, the substratescan have well defined buffer layers. The properties <strong>of</strong> P(VDF-TrFE) have extensivelybeen reviewed in [6]. Recently, attempts at realizing organic FeFETs usingP(VDF-TrFE) have been reported [7–9].In this paper, we will mainly focus on steps to further improve the characteristic <strong>of</strong>metal–ferroelectric–insulator–semiconductor (MFIS) structures, which contain P(VDF-TrFE) as ferroelectric layers. Comparisons <strong>of</strong> results <strong>of</strong> measurements with predictionsbased on a simulation procedure proposed by Miller <strong>and</strong> McWorther [4] are discussed.We investigate the preparation procedure <strong>of</strong> the polymer layer as well as the influence<strong>of</strong> the buffer layer. We perform capacitance–voltage (CV) measurements on MFISbased structures. Due to the dipole switching <strong>of</strong> the P(VDF-TrFE) chains, the CVcurves show a hysteresis [4] (refer to Fig. 1b), which depends on the maximum appliedvoltage in the CV loops [9], i.e. on the polarization <strong>of</strong> the ferroelectric material.2. ExperimentalPreparation. As a copolymer, we use P(VDF-TrFE) in a molar ratio <strong>of</strong> 70/30. Thematerial was delivered as a film from Piezotech S.A., France. The film was solved in2-butanone <strong>and</strong> spin coated onto the substrates. The thickness <strong>of</strong> the polymer film canbe varied considerably, depending on the velocity <strong>and</strong> the concentration <strong>of</strong> the solution,as discussed in the results section. Annealing was performed for 2 h at 135 °C,<strong>and</strong>, for comparison also, samples without annealing were prepared. The thicknesses<strong>of</strong> the spin coated films were measured with a Taylor–Hobson pr<strong>of</strong>ilometer (Talystep).For electrical <strong>characterization</strong>, MFIS capacitors were fabricated on silicon p-typesubstrates with (100) orientation <strong>and</strong> the resistivity 1–20 Ω·cm. As buffer layer,10–235 nm SiO 2 or 11 nm Al 2 O 3 was used. As a top electrode, aluminum was used,which was thermally evaporated through a shadow mask with diameters between500 μm <strong>and</strong> 900 μm. The set-up <strong>of</strong> a MFIS capacitor is shown in Fig. 1b.The CV measurements were carried out with a LCR-Meter Agilent 4284A at thefrequency <strong>of</strong> 1 MHz with a sweep <strong>of</strong> 0.1 V/s. Measurements at higher temperatureswere performed keeping the sample holder in a common drying oven. All measurementswere started in accumulation (negative gate bias) <strong>and</strong> finished there too, afterdriving the voltage in the investigated range to inversion <strong>and</strong> backwards (e.g., from–10 V to 10 V <strong>and</strong> back again to –10 V, we call this a “±10 V loop”, for short). Otherintermediate measurements were taken while driving the voltage over the investigatedrange in a “voltage loop” (e.g. , from –10 V to 10 V <strong>and</strong> back again).
Optimization <strong>of</strong> MFIS structures containing P(VDF-TrFE) 119a)V g1CurrentM+ + + + + + + + + +PF- - - - - - - - - -In + + n +pSV g1Drain-source voltageFig. 1. Set-up <strong>and</strong> output characteristic <strong>of</strong> a FeFET. Due to switching<strong>of</strong> the dipoles after the programming, the current is showing two different statesat the same gate voltage (a) as weel as set-up <strong>and</strong> CV characteristic<strong>of</strong> a MFIS capacitor (b), with a hysteresis caused by the polarization loopModulation. Miller <strong>and</strong> McWorther developed a method to include the ferroelectricpolarization into the characteristics <strong>of</strong> FeFETs [4]. We use parts <strong>of</strong> it to model theCV characteristic <strong>of</strong> MFIS capacitors. The area capacitance <strong>of</strong> the MFIS system C′′MFIScan be written as follows:1 dPVDFdbuf1 1 1C′′ = εε+ εε+ C′′ = C′′ + C′′MFIS 0 PVDF 0 buf S stack S(1)where ε 0 is the permittivity <strong>of</strong> vacuum, ε PVDF <strong>and</strong> ε buf are the relative electric permittivities<strong>of</strong> the ferroelectric <strong>and</strong> the buffer layers, while d PVDF <strong>and</strong> d buf are their thick-
120K. HENKEL et al.nesses. C′′Sis the area depletion capacitance calculated from the derivative dσ S /dφ S <strong>of</strong>the semiconductor surface charge σ S , which follows the same function <strong>of</strong> the siliconsurface potential φ S as that known for the CV characteristic <strong>of</strong> the MIS system[10].The gate voltage V g can then be written asσdV = φ − + V −P( E )SPVDFg S MS PVDFC′′stackεε0 PVDF(2)where V MS is the work function difference between metal <strong>and</strong> semiconductor, C′′stackisthe insulator capacitance calculated by the two first terms in Eq. (1), <strong>and</strong> P is the dipolepolarization, which depends on the electric field E PVDFE[ σ PE ( )]− +S PVDFPVDF= (3)εε0 PVDFin the ferroelectric <strong>and</strong> its history. The saturated polarization hysteresis P ± satis defined byEPVDFEcP± ⎡satPS tanh± − ⎤=± ⎢2Δ⎥⎣ ⎦(4)where P S is the spontaneous polarization (i.e., the saturation polarization), E c is thecoercive field <strong>and</strong> Δ is a hysteresis loop parameter, being a function <strong>of</strong> the ratio <strong>of</strong> theremanent <strong>and</strong> saturated polarization. The dipole polarization at step t is then calculatedby a numerical integration using the data known at step t – 1:⎡d⎤P( EPVDF( t)) = P( EPVDF( t− 1)) + ⎢( EPVDF( t) −EPVDF( t−1)) P( EPVDF( t−1))⎥⎣dEPVDF⎦(5)The term E PVDF (t) is then eliminated by using Eq. (3). Furthermore, dP/dE PVDF isa function <strong>of</strong> dP sat /dE PVDF , P sat , P <strong>and</strong> P S as:dE± ±dP⎧P P⎫ξ = >⎪ ⎡ − ⎤sat ⎪ dPsatdt= ⎨1−tanh⎢ ⎥ ⎬ withdEPVDF ξ PS − P dEPVDFdE⎩⎪⎢⎣ ⎥⎦ ⎭⎪ξ =−
Optimization <strong>of</strong> MFIS structures containing P(VDF-TrFE) 121sis <strong>of</strong> the CV loop we define the voltage window at flat b<strong>and</strong> condition (ΔV FB , refer toFig. 1b), which is also called a memory window. Assuming, that this shift is caused bythe dipole charges due to the polarization, ΔV FB is then used to calculate the surfacecharge density N, which is a more qualitative value <strong>of</strong> the polarizationwhere q is the elementary charge.PNΔVεεFB 0 PVDF∝ = (7)qdPVDF3. Results <strong>and</strong> discussion3.1. Phase transitionHere, we establish whether the CV hysteresis is or is not controlled by the bistablepolarization <strong>and</strong> not by charges, which are injected into the buffer or the polymerlayer. As a first test, we perform CV measurements <strong>of</strong> reference samples withoutP(VDF-TrFE) <strong>and</strong> do not observe any hysteresis. Then, CV loops at elevated temperaturesare recorded <strong>and</strong> we find a decrease in the flatb<strong>and</strong> voltage window, while thehysteresis totally vanishes at temperatures around 100 °C (Fig. 2a) indicating a phasetransition from the ferroelectric to the paraelectric phase. In Figure 2b, this effect isshown for two samples <strong>of</strong> different P(VDF-TrFE) thicknesses on a 100 nm SiO 2 /Sisubstrate. For both samples the flatb<strong>and</strong> voltage shift is reduced to almost zero valuesat ca. 100 °C. Furthermore, by analyzing the accumulation capacitance <strong>of</strong> the CV loopwe estimate the temperature dependence <strong>of</strong> the dielectric constant. For P(VDF-TrFE)with more than 50% VDF content, the phase transition was found to be <strong>of</strong> thermodynamicallyfirst order [6, 11]. A classical theory (L<strong>and</strong>au theory) delivers the Curie–Weiss law describing the temperature dependence <strong>of</strong> the reciprocal permittivity nearfirst order transition [6, 11, 12] as1 ± ( T0−T)∝ε′Ci(8)where the sign (±) is positive for temperatures lower than the phase transition temperature(the Curie temperature, T < T c ) <strong>and</strong> negative for temperatures above it (T > T c ).C i are the Curie constants (i = 1 for T < T c , i = 2 for T > T c ). T 0 is not exactly the Curietemperature [6, 12] <strong>and</strong> in the case <strong>of</strong> a first order transition it is smaller than T c [12].Figure 2c shows the temperature dependence <strong>of</strong> the reciprocal permittivity for thesame samples as in Fig. 2b. From the slope <strong>of</strong> these plots we determine the values <strong>of</strong>C 1 <strong>of</strong> around 1000 K. This is in the same order <strong>of</strong> magnitude as in other papers[11, 13, 14], but our values are higher by a factor <strong>of</strong> 1.5 to 2. Here we have to state,that the permittivity disperses with the VDF content as well as with the frequency [6].
122K. HENKEL et al.The CV loops are recorded at 1MHz, while the corresponding values published elsewhere[11, 13, 14] are observed at lower frequencies.Fig. 2. CV curves <strong>of</strong> a 110 nm P(VDF-TrFE)/100nm SiO 2 stack at room temperature (RT) (a), the values<strong>of</strong> the capacitance are normalized to the accumulation capacitance (i.e. C Stack ) at room temperature;<strong>and</strong> flatb<strong>and</strong> voltage shift (b) <strong>and</strong> the reciprocal permittivity (c) in dependence on temperaturefor a stack with 100 nm SiO 2 <strong>and</strong> 125 nm (filled triangle) or 110 nm (open circles) P(VDF-TrFE)Furthermore, other VDF contents (52–55%, [11, 13, 14]) compared to our samples(70%) were used, <strong>and</strong> much thicker samples (11–100 μm in [13, 14]) have been analyzed.It was shown that the value <strong>of</strong> the C 1 constant increased as the layer thicknesswas reduced to 100 nm [11].
Optimization <strong>of</strong> MFIS structures containing P(VDF-TrFE) 1233.2. Optimization <strong>of</strong> the sample preparation3.2.1. Polymer thickness, spin coatingIn order to reduce the operation voltage <strong>of</strong> a memory device containing a P(VDF-TrFE) layer, due to its high coercive field (47–100 MV/m [6, 15]), the thickness <strong>of</strong>the ferroelectric layer should be downscaled below 100 nm.Fig. 3. Spin coating calibration <strong>of</strong> P(VDF-TrFE): thickness dependence on spin speed (a)at various solution concentrations. The inset depicts the log-log plot <strong>of</strong> the thickness versus the speed<strong>and</strong> dependence <strong>of</strong> the polarization proportional value N on the electric field loop (b) for onenon-annealed sample (350 nm P(VDF-TrFE) <strong>and</strong> one annealed stack (220 nm P(VDF-TrFE)). Bothlayers were spun on a 235 nm SiO 2 buffer layer. The annealing was performed at 135 °C for 2 hHowever, it should be noted that an increase <strong>of</strong> the coercive field <strong>of</strong> P(VDF-TrFE)with shrinking <strong>of</strong> the polymer thickness below 100 nm has been observed for this ma-
124K. HENKEL et al.terial [6, 16]. Therefore, it should be possible to find an optimum solution for thesetwo opposite trends. For that reason, it should be possible to adopt a wide range <strong>of</strong>applicable layer thickness.In Figure 3a, the final film thickness versus the final spin speed is shown for variousconcentrations <strong>of</strong> the solution. In [17, 18] models for the spin coating have beendeveloped, taking into account the solvent evaporation <strong>and</strong> a non-Newtonian character<strong>of</strong> the rheological behaviour <strong>of</strong> the resists. Jenekhe [18] introduced a parameter α,describing the influence <strong>of</strong> solvent evaporation on the viscosity <strong>of</strong> the fluid duringspin coating. In a general dependence− p2d ∝ w with p = (9)2 + awhere d is the final thickness <strong>and</strong> ω is the angular frequency. By analyzing a log–logdependence <strong>of</strong> the thickness on the speed (inset <strong>of</strong> Fig. 3a) we determine mean values<strong>of</strong> p <strong>of</strong> 0.23 in the solution concentration range <strong>of</strong> 0.5–2.5%, while for the thicker solution<strong>of</strong> 5%, the value <strong>of</strong> 0.48 is found, which is in the typical range <strong>of</strong> 0.40–0.82 forresists discussed in [18]. Generally, we find an increased slope p by increasing theconcentration <strong>of</strong> the solution. This is in good agreement with the modulations in theliterature <strong>and</strong> is attributed to the increase in fluid viscosity <strong>and</strong> therefore to the moreprominent non-Newtonian behaviour at higher concentrations [17].With this calibrated spin coating procedure we are able to fabricate films in a widerange <strong>of</strong> thicknesses between 10 nm <strong>and</strong> 1 μm. Using it, we could recently identifyinterface reactions between aluminum electrodes <strong>and</strong> the P(VDF-TrFE) as the reasonfor decreased polarization values, when the polymer thickness is shrunk below 150 nm[15, 19]. Furthermore, we have recently shown that the ferroelectric switching showsstill an extrinsic like behaviour in films as thin as 10 nm [20].3.2.2. AnnealingWe have already partially shown the effect <strong>of</strong> the annealing step on our CV measurements[21], where we find much more symmetric behaviour in the flatb<strong>and</strong> voltageshift inside one CV loop after annealing. Conversely, the CV loops <strong>of</strong> non-annealedsamples additionally shift due to a probable charge injection.Here we analyze the impact <strong>of</strong> annealing to a higher polarization value. In Figure3b, we show the dependence <strong>of</strong> N value – proportional to the polarization – calculatedby Eq. (7) on the applied electrical field window <strong>of</strong> the CV loop for one annealed<strong>and</strong> one non-annealed sample. We observe much higher values <strong>of</strong> the polarizability forthe annealed sample, while the non-annealed sample already shows saturation evenhere, where a thick SiO 2 buffer layer <strong>of</strong> 235 nm is used. In [6] a strong effect <strong>of</strong> annealingfor improving the crystallinity <strong>of</strong> P(VDF-TrFE) was clearly discussed, whichresults in higher polarization values by a factor <strong>of</strong> 3 to 4. Our results are in goodagreement with this finding.
Optimization <strong>of</strong> MFIS structures containing P(VDF-TrFE) 1253.3. Optimization <strong>of</strong> the buffer layerAs discussed above, a layer shrinking <strong>of</strong> the polymer is essential for a low voltageoperation <strong>of</strong> a memory device based on MFIS like structures. However, in a MFISstack a part <strong>of</strong> the programming voltage drops over the buffering insulator, which isnecessary for the hindrance <strong>of</strong> depolarization, thereby causing leakage currents.Fig. 4. Calculation <strong>of</strong> the ratio <strong>of</strong> the voltage over the ferroelectric layer V FE <strong>and</strong> the applied voltage V pin dependence on the ferroelectric thickness d FE using Eq. (10) (a), <strong>and</strong> simulation <strong>of</strong> P(E) curves <strong>of</strong>stacks with 100 nm P(VDF-TrFE) (b) for MFIS systems, which use various buffer layers:100 nm SiO 2 (thick solid lines), 10 nm SiO 2 (dotted lines) <strong>and</strong> 10 nm Al 2 O 3 (dashed lines). For comparison,results for a stack with a conventional PZT ferroelectric (dashed dotted line in part a) <strong>and</strong> for a MFMcapacitor with the same thickness <strong>of</strong> the ferroelectric layer (thin solid line in part b) are shown.Because in part (a) PZT is used as a ferroelectric (FE) material as well, the plot shows the dependence<strong>of</strong> V FE /V P on d FE , i.e. in Eq. (10) d PVDF , ε PVDF <strong>and</strong> V PVDF should be substituted by d FE , ε FE <strong>and</strong> V FEAgain for a low voltage operation, these programming losses should be as small aspossible. Furthermore, in the “<strong>of</strong>f state” <strong>of</strong> the memory, the gate is normally grounded.
126K. HENKEL et al.Due to charge neutrality, the electric field caused by the polarization <strong>of</strong> the ferroelectriclayer will be neutralized by an established field in the buffer layer, leading to depolarizationfields, which can corrupt the saved information [5]. This fact meets the same requirementsas for the low voltage operation, where a high capacitance <strong>of</strong> the buffer layer <strong>and</strong>a moderate permittivity value <strong>of</strong> the ferroelectric material are needed. In the accumulationregime <strong>of</strong> the MFIS structure, the ratio <strong>of</strong> the voltage drop over the ferroelectric layer(V PVDF respectively V FE ) to the programming voltage (write, V p ) can be estimated by a simplemodel <strong>of</strong> two capacitors in series, <strong>and</strong> the following formula can be used:VPVDF1=(10)V εpPVDFdbuf1+ε dbufAs is shown in Fig. 4a, this ratio depends on the thickness <strong>of</strong> the ferroelectriclayer. The thickness <strong>of</strong> the ferroelectric layer could be increased so that a high voltageratio is attained but this contradicts the criteria for low voltage operation. In the oppositedirection, this ratio is reduced by making the polymer layer thinner. Therefore, thebuffer layer should be adapted either by the reduction <strong>of</strong> its thickness (dotted line inFig. 4a) or by increasing its permittivity (dashed line in Fig. 4a). In addition, Fig. 4adepicts also, that for the case in which a buffer layer is needed (see Sect. Introduction),a ferroelectric with a relatively small permittivity is preferable in terms <strong>of</strong> this voltagedivider optimization. In terms <strong>of</strong> optimization <strong>of</strong> the buffer layer, it should be alsotaken into account that the fully saturated regime <strong>of</strong> the polarization <strong>of</strong> the ferroelectricshould be achieved preferably in order to get a stable working MFIS memorystack. However, this simple model <strong>of</strong> the voltage divider does not consider the polarizationinside the ferroelectric layer. Hence, we performed also simulations <strong>of</strong> P(E)curves using the procedure described in Sect. 2.2 with the same thickness <strong>of</strong> the bufferlayer <strong>and</strong> materials as used in Fig. 4a (refer to Fig. 4b). Assuming, that ±20 V CVloops are performed, we calculate the resulting P(E) loop for a 100 nm P(VDF-TrFE)layer with a buffer layer <strong>of</strong> 100 nm SiO 2 , 10 nm SiO 2 , or 10 nm Al 2 O 3 . For comparison,the saturation loop <strong>of</strong> a pure 100 nm thick P(VDF-TrFE) capacitor (metal–ferroelectric–metal, MFM) is shown in Fig. 4b as well. The values <strong>of</strong> Ec, Ps <strong>and</strong>ε PVDF are given in the legend <strong>of</strong> Fig. 4b <strong>and</strong> are taken from our former results [15]. Theassumed values <strong>of</strong> the relative dielectric constants <strong>of</strong> SiO 2 <strong>and</strong> Al 2 O 3 were 3.9 <strong>and</strong> 9,respectively. We clearly observe that for this configuration <strong>and</strong> a CV loop <strong>of</strong> ±20V,a 10 nm Al 2 O 3 buffer layer almost leads to a complete saturation. This is confirmed bythe results <strong>of</strong> measurements shown in Fig. 5a. Here, again we show the more qualitativepolarization value N in dependence <strong>of</strong> the maximum applied voltage <strong>of</strong> the CVloop. We observe a similar behaviour as predicted by the simulation, the stack with11 nm Al 2 O 3 buffer layer shows a much higher polarization value than the stack withalmost the same SiO 2 thickness <strong>and</strong> here the ferroelectric seems to be already more orless in saturation. This means that even this simplified calculation <strong>of</strong> the N value deliversgood qualitative information about the polarization.PVDF
Optimization <strong>of</strong> MFIS structures containing P(VDF-TrFE) 127Fig. 5. Dependence <strong>of</strong> the polarization proportional value N on the maximal voltage appliedin the CV loop (a) for MFIS stacks consisting <strong>of</strong> 120 nm P(VDF-TrFE) <strong>and</strong> 100 nm SiO 2 , 10 nm SiO 2or 11nm Al 2 O 3 <strong>and</strong> measured (symbols) <strong>and</strong> calculated (lines) CV curves <strong>of</strong> stacks with120 nm P(VDF-TrFE) <strong>and</strong> 30 nm or 100 nm SiO 2 (b). The values <strong>of</strong> the capacitance are normalizedto the accumulation capacitance (i.e. C stack ) <strong>of</strong> each individual sample. The curves correspondto the initial flatb<strong>and</strong> voltage (V FB0 ) <strong>of</strong> every sample in order to visualizethe hysteresis due to the ferroelectric switching more easyTo get more quantitative parameters <strong>of</strong> the polarization loop, the CV curve shouldbe fitted to the model described above in Sect. 2.2. Here, we just show two examples<strong>of</strong> modelling, where a 120 nm P(VDF-TrFE) layer is combined with a 30 nm or100 nm SiO 2 layer. In Figure 5b, the ±10V CV measurements on these stacks aremarked by symbols, while the results <strong>of</strong> simulation are shown with solid lines. We usethe same values as above for E c , P S <strong>and</strong> ε PVDF (refer to the legend <strong>of</strong> Fig. 5b) as knownvalues. The model is in very good agreement with the measurement. For a real fittingprocedure the E c <strong>and</strong> P S values as well as the ratio <strong>of</strong> the remanent <strong>and</strong> saturated polarizationshould be adapted.
54 0WL1WL BL1 bit1 bit3bit52WL323 BL2BL2 bit2 bit40bit6WLspace65nmWLspace20nm1 0MTwinFlashcel easurement65nm0ΔVt N(bits1<strong>and</strong>24 5)(V) 68t(bt3)( )xx(b )Received128K. HENKEL et al.4. ConclusionWays to optimize a MFIS stack have been described. The optimization <strong>of</strong> a sequence<strong>of</strong> layer thickness <strong>of</strong> the ferroelectric <strong>and</strong> the buffer layer is discussed. We findthat for a 120 nm P(VDF-TrFE)/11 nm Al 2 O 3 stack in a ±20V CV loop, saturation <strong>of</strong>the polarization is almost reached. Here, we observe a very good match between thepredicted <strong>and</strong> the measurement results. The application <strong>of</strong> the simulation proposed byMiller <strong>and</strong> McWorther [4] is a very useful tool to further optimize these stacks. Recently,we have shown retention <strong>of</strong> several days [15] <strong>and</strong> cycles <strong>of</strong> more than 10 5(soon to be published). We expect even better values for optimized layers.AcknowledgementThe authors acknowledge “Deutsche Forschungsgemeinschaft” for financial support within the priorityprogram 1157 (SCHM745/11-1-2), <strong>and</strong> IHP Frankfurt/O, <strong>and</strong> AMD Saxony Dresden for providingus with oxidized wafers.References[1] BEZ R., PIROVANO A., Mat. Sci. Sem. Proc., 7 (2004), 349.[2] KOHLSTEDT H., ISHIWARA H., Ferroelectric Field Effect Transistors, [in:] R. Waser (Ed.), Nanoelectronics<strong>and</strong> Information Technology. Advanced Electronic Materials <strong>and</strong> Novel Devices, Wiley–VCH, Weinheim, 2003, pp. 388–404.[3] MOLL J.L., TAURI Y., IEEE T., Electron. Dev., ED10 (1963), 338.[4] MILLER S.L., MCWORTHER P.J., J. Appl. Phys., 72 (1992), 5999.[5] GNADINGER F.P., HUEBNER G.G., DERBENWICK G.F., DEVILBISS A.D., Ferroelectrics, 268 (2002), 729.[6] FURUKAWA T., Phase Trans., 18 (1989), 143.[7] NABER R.C.G., TANASE C., BLOM P.W.M., GELINCK G.H., MARSMAN A.W., TOUWSLAGER F.J.,SETAYESH S., DE LEEUW D.M., Natur. Mater., 4 (2005), 243.[8] UNNI K.N.N., DE BETTIGNIES R., DABOS-SEIGNON S., NUNZIA J.M., Appl. Phys. Lett., 85 (2004), 1823.[9] MÜLLER K., HENKEL K., PALOUMPA I., SCHMEISSER D., Thin Solid Films, 515 (2007), 7683.[10] SZE S.M., Physics <strong>of</strong> Semiconductor Devices, Wiley, New York, 1981.[11] URAYAMA K., TSUJI M., NEHER D., Macromol., 33 (2000), 8269.[12] KITTEL C., Introduction to Solid State Physics, 8th Ed., Wiley, New York, 2005.[13] FURUKAWA T., DATE M., FUKADA E., TAJITSU Y., CHIBA A., Jpn. J. Appl. Phys., 19 (1980), L109.[14 ] KOIZUMI N., HAIKAWA N., HABUKA H., Ferroelectrics, 57 (1984), 99.[15] HENKEL K., LAZAREVA I., MANDAL D., PALOUMPA I., MÜLLER K., KOVAL Y., MÜLLER P., SCHMEISSER D.,J. Vac. Sci. Technol. B, 27 (2009), 504.[16] KIMURA K., OHIGASHI H., Jpn. J. Appl. Phys., 25 (1986), 383.[17] FLACK W.W., SOONG D.S., BELL A.T., HESS D.W., J. Appl. Phys., 56 (1984), 1199.[18] JENEKHE S.A., Ind. Eng. Chem. Fundam., 23 (1984), 425.[19] MÜLLER K., MANDAL D., SCHMEISSER D., MRS Proc., 997 (2007), I6-02.[20] MÜLLER K., MANDAL D., HENKEL K., PALOUMPA I., SCHMEISSER D., Appl. Phys. Lett., 93 (2008), 112901.[21] HENKEL K., Electrical Investigations on Praseodymium Oxide/Aluminum Oxynitride ContainingMetal–Insulator–Semiconductor Stacks <strong>and</strong> on Metal–Ferroelectric–Insulator–SemiconductorStructures Consisting <strong>of</strong> Poly(vinylidene fluoride trifluoroethylene), PhD Thesis, Shaker-Verlag,Aachen, 2009, pp. 89–91.6 October 2008Revised 20 July 2009
Materials Science-Pol<strong>and</strong>, Vol. 28, No. 1, 2010Preparation <strong>and</strong> <strong>characterization</strong> <strong>of</strong> SiO 2microspheres doped with CoFe 2 O 4 nanocrystalsV. TYRPEKL 1, 2* , J. POLTIEROVÁ-VEJPRAVOVÁ 3 , J. PLOCEK 1 , D. NIŽŇANSKÝ 21 Institute <strong>of</strong> Inorganic Chemistry <strong>of</strong> the AS CR, v.v. i., 250 68 Řež, Czech Republic2 Faculty <strong>of</strong> Natural Sciences, Charles University, Department <strong>of</strong> Inorganic Chemistry,Albertov 6, 128 43 Praha 2, Czech Republic3 Faculty <strong>of</strong> Mathematics <strong>and</strong> Physics, Charles University, Department <strong>of</strong> CondensedMatter Physics, Ke Karlovu 5, 121 16 Praha 2, Czech RepublicMain goal <strong>of</strong> the reported work was to fabricate silica microspheres doped with magnetic nanocrystals.Cobalt ferrite nanocrystals were fabricated separately via surfactant-assisted coprecipitation. The sol-gel method in microemulsion was subsequently used for encapsulating <strong>of</strong> the magnetic nanonanocrystalsinto the silica microspheres. Final products were characterized by various techniques <strong>and</strong> magnetic measurements.The obtained silica microspeheres doped with CoFe 2 O 4 were <strong>of</strong> average diameter 11 μm.Keywords: sol-gel; microemulsion; cobalt ferrite; microspheres; nanocomposite1. IntroductionFabrication <strong>of</strong> new functional materials tailored for specific applications is a challengefor chemistry <strong>and</strong> material science. Magnetic nanoparticles have been <strong>of</strong> a greatinterest ever since pioneer works <strong>of</strong> their simple preparation, reported for examplein [1]. The sol-gel chemistry, mainly <strong>of</strong> silicate precursors has been undergoingthrough a renaissance since 1980 [2–4]. Combination <strong>of</strong> ever more progressive techniquesleads to a variety <strong>of</strong> new materials based on magnetic or superparamagnetic(SPM) nanoparticles with functionally modified surface. The presence <strong>of</strong> a silica gelsurface layer could shift the point <strong>of</strong> zero charge (p.z.c.) into acidic one, while anamino-modified silica layer could shift it in a basic range [5, 6]. A silica layer could beintroduced by a number <strong>of</strong> preparation methods, two <strong>of</strong> them being widely used. TheStöber method uses ammonia catalyzed gelation <strong>of</strong> tetraalkoxysilane [7, 8], <strong>and</strong> the socalledmicroemulsion method is based on the formation <strong>of</strong> droplets <strong>of</strong> the emulsion,_________* Corresponding author, e-mail: tyrpekl@iic.cas.cz
130V. TYRPEKL et al.stabilized by surfactants, that acts as a micro-reactor for the sol-gel process [5, 9]. Theadvantages <strong>of</strong> the microemulsion method are, for example, independence <strong>of</strong> a catalyticmechanism (acidic or basic) <strong>of</strong> the sol-gel process, easy variation <strong>of</strong> the droplet size(by changing the amount <strong>of</strong> the water phase or changing the surfactant type), thermodynamicstability <strong>of</strong> the system, etc.The paper concentrates on the fabrication <strong>of</strong> silica microspheres with the diameter<strong>of</strong> a few micrometers containing nanocrystals <strong>of</strong> CoFe 2 O 4 . The magnetic Co-ferritenanoparticles were prepared by coprecipitation <strong>of</strong> cobalt(II) <strong>and</strong> iron(II) dodecylsulpahatesolution using methylamine as the precipitant [10]. By this preparation route,many types <strong>of</strong> ferrite nanoparticles were synthesized, for example Fe 3 O 4 [11], NiFe 2 O 4<strong>and</strong> MnFe 2 O 4 [12]. Dodecylsulphate (an anionic surfactant) controls the shape <strong>and</strong>size <strong>of</strong> nanocrystals during the precipitation. A micellar system <strong>of</strong> water/CTAB (cetyltrimethylammoniumbromide)/n-hexanol was used for encapsulation <strong>of</strong> the magneticparticles into silica spheres via the sol-gel microemulsion method. The proper pHacidic solution) <strong>of</strong> droplets <strong>and</strong> temperature around 40 °C, caused gelation <strong>of</strong> the silicaprecursor TMOS (tetramethoxysilane). In general, microemulsion, containing droplets<strong>of</strong> an acidic cobalt ferrite ferr<strong>of</strong>luid, is a suitable system for gelation <strong>of</strong> TMOS athigher temperatures.Nowadays, a micro-scale processing is slightly ignored due to the greater emphasisplaced on the nanosized features. However, this work is an illustrative example <strong>of</strong>a bottom-up approach, where the micro-objects are formed from molecular <strong>and</strong>nanoparticle building blocks.2. ExperimentalSyntheses <strong>and</strong> materials. All chemicals were <strong>of</strong> 98% purity or higher. Nanoparticles<strong>of</strong> CoFe 2 O 4 were prepared by the coprecipitation method as described earlier [10].Cobalt(II) <strong>and</strong> iron(II) dodecylsulphate, respectively, were prepared by crystallization<strong>of</strong> 1:1 volume mixture <strong>of</strong> 0.1 M cobalt acetate (Merck) or 0.1 M iron(II) chloride(Merck) solution, with 0.1 M sodium dodecylsulphate (Merck) at 2 °C. After adding<strong>of</strong> 2 M methylamine into the mixture <strong>of</strong> 8·10 –3 M Co(DS) 2 <strong>and</strong> 2,6.10 –2 M Fe(DS) 2 ,the mixture was stirred vigorously for 2 h. Co-ferrite particles were purified by severalcycles <strong>of</strong> centrifugation <strong>and</strong> decantation.A schematic diagram <strong>of</strong> the synthetic routes <strong>of</strong> CoFe 2 O 4 /SiO 2 microspheres isshown in Fig. 1. The non-aqueous part <strong>of</strong> the microemulsion consisted <strong>of</strong> 5 g <strong>of</strong>n-hexanol (Aldrich), 1.5 g <strong>of</strong> ethanol <strong>and</strong> 0.3 g <strong>of</strong> CTAB (Aldrich). Few droplets <strong>of</strong>distilled water (maximum 0.5 cm 3 ) were added to form appropriate emulsion. Furthermore,3.87 g <strong>of</strong> TMOS (Aldrich) were pre-hydrolyzed with 3.6 g <strong>of</strong> 0.03% HNO 3(Lachema) for 1 h at 40 °C. 1 g <strong>of</strong> formamide (Merck) with 30 mg <strong>of</strong> ultrasonicallydispersed CoFe 2 O 4 particles were added, <strong>and</strong> stirred for 1 h at room temperature. 1.5 g<strong>of</strong> this mixture was slowly added into stirred nonaqueous part <strong>and</strong> evenly heated up to60 °C. Final product was washed with acetone <strong>and</strong> ethanol, <strong>and</strong> finally dried at 100 °C.
SiO 2 microspheres doped with CoFe 2 O 4 nanocrystals 131Fig. 1. The preparation schemeExperimental techniques. Scanning electron microscopy (SEM) investigationswere done on a SEM Philips XL 30 CP equipped with EDS (energy dispersive X-rayspectrometry), secondary <strong>and</strong> back-scattered electron detectors <strong>and</strong> a Robinson detector.Each powder sample was placed on the holder with an adhesive carbon slice <strong>and</strong>covered with a thin (
132V. TYRPEKL et al.3. Results <strong>and</strong> discussion3.1. Cobalt ferrite nanocrystalsParticles <strong>of</strong> cobalt ferrite nanocrystals had already been fully characterized earlier[10]. Briefly, the reported characteristics show the average diameter by TEM <strong>of</strong> 5 nm(σ = 23%). Magnetization measured at 10 K is 50 emu/g <strong>and</strong> the coercive field at 10 Kis 9 kOe. The TEM micrographs were made in order to confirm that the desired particlesize <strong>and</strong> morphology had been achieved (Fig. 2).Fig. 2. TEM micrographs <strong>of</strong> CoFe 2 O 4 nanocrystals: a) overview; b) details <strong>and</strong> electron diffraction pattern3.2. CoFe 2 O 4 /SiO 2 microspheresThe morphology <strong>of</strong> the final composite microspheres is presented in Fig. 3. Thesilica particles are <strong>of</strong> regular spherical shape, as required.Fig. 3. SEM <strong>of</strong> the final CoFe 2 O 4 /SiO 2 composite morphology at various magnifications
SiO 2 microspheres doped with CoFe 2 O 4 nanocrystals 133Fig. 4. Size distribution <strong>of</strong> CoFe 2 O 4 doped silica spheres(calculated from SEM micrographs)The size distribution calculated from the SEM measurements is shown in Fig. 4.The average diameter <strong>of</strong> the particles <strong>of</strong> the silica/ferrite composite was determined as11.04 ± 7.7 μm. The size <strong>of</strong> the silica spheres is determined by the volume <strong>of</strong> the hydrophilicmicrodroplets <strong>of</strong> the microemulsion at ca. 60 °C, where silicon dioxide gel isformed from the pre-hydrolyzed TMOS.Fig. 5. Powder X-ray diffraction pattern <strong>of</strong> the final product. The two reflections above 30°are attributed to the Co ferrite nanoparticles, the broad maximum at around 25°corresponds to the contribution <strong>of</strong> the amorphous silica microspheresThe powder XRD measurements, shown in Fig. 5 proved the presence <strong>of</strong> theCoFe 2 O 4 with the spinel structure, as demonstrated by the two strongest reflections in
134V. TYRPEKL et al.the XRD pattern (PDF 22-1086), <strong>and</strong> amorphous silica, which contribute as a broadmaximum at around 25°. The Co-ferrite related reflections are very broad <strong>and</strong> <strong>of</strong> lowintensity, which points to a very small particle size.Fig. 6. Temperature dependence <strong>of</strong> the zero field cooled (ZFC) <strong>and</strong> field-cooled (FC)magnetization <strong>of</strong> SiO 2 microspheres doped with CoFe 2 O 4 measured at 10 mTFig. 7. Hysteresis loop <strong>of</strong> silica microspeheres doped with CoFe 2 O 4 recorded at 2 KComprehensive investigations by means <strong>of</strong> magnetization <strong>and</strong> ac susceptibilitymeasurements were performed in the temperature range 2–350 K. The temperaturedependence <strong>of</strong> the ZFC <strong>and</strong> FC magnetization is shown in Fig. 6. The ZFC curve exhibitsa broad maximum at ca. 150 K, which can be attributed to the blocking temperature,TB, <strong>of</strong> small Co-ferrite nanocrystals. The FC curve shows a similar maximum ata slightly lower temperature, <strong>and</strong> indicates an additional paramagnetic-like contribu-
SiO 2 microspheres doped with CoFe 2 O 4 nanocrystals 135tion at lower temperatures. The enhanced values on FC curve can be caused by thepresence <strong>of</strong> particles below 2 nm, which do not interact with each other <strong>and</strong> follow thepure SPM trend. On the other h<strong>and</strong>, both curves correspond to slightly higher valuesthan the proposed T B level, which can be explained either by particle size distributionor rather by weak interparticle interactions between the majority particles <strong>of</strong> largersize, mediated by dipolar forces [13, 14].The Co-ferrite particle diameter (R) <strong>of</strong> the majority fraction was estimated fromthe blocking temperature using the formula derived for a pure SPM system <strong>of</strong> noninteractingsuperspins: V = 25k B T B /K 1 <strong>and</strong> R = (3V/4π) 1/3 , where V is the volume <strong>of</strong> oneparticle, K 1 is the first order anisotropy constant <strong>of</strong> the bulk Co-ferrite, k B is theBoltzman constant <strong>and</strong> T B is the blocking temperature. The estimated particle diameterwas R = (3.4 ± 0.2) nm.Fig. 8. Temperature dependence <strong>of</strong> the real χ′ <strong>and</strong> imaginary χ′′ parts<strong>of</strong> the ac susceptibility <strong>of</strong> silica microspeheres doped with CoFe 2 O 4
136V. TYRPEKL et al.The presence <strong>of</strong> hysteresis <strong>and</strong> remanence below the TB level was investigated bytaking hysteresis loop measurements at 2 K (Fig. 7). The tapering <strong>of</strong> the loop ina magnetic field close to zero can be explained by the presence <strong>of</strong> a small proportion<strong>of</strong> small particles, as already suggested in the discussion <strong>of</strong> the temperature dependence<strong>of</strong> the ZFC/FC magnetization, which does not cause any hysteresis. The saturatedmagnetization at 2 K reaches ca. 2·10 –3 A·m 2 /kg calculated relative to the total mass <strong>of</strong>the composite).The dynamic properties <strong>of</strong> the system were examined by taking ac susceptibilitymeasurements, <strong>and</strong> they are shown in Fig. 8. The character <strong>of</strong> the real <strong>and</strong> imaginarypart <strong>of</strong> the ac susceptibility reflects the expected SPM behaviour, demonstrated by thefrequency-dependent maximum at T B at the corresponding frequency (T f ).A useful criterion for classifying the observed freezing process is the empirical parameterΦ, which represents the relative shift <strong>of</strong> the blocking temperature per the frequencydecade: Φ = ΔT f /[T f Δlog10( f )], where ΔT f is the difference between theblocking temperature measured in the Δlog10f. We obtained the value Φ = 0.04,which is slightly lower than the 0.1 value expected for a superparamagnetic (SPM)system. Smaller values <strong>of</strong> Φ are usually caused by the spin-glass-like behaviour <strong>of</strong> thenanoparticle surface, or are simply due to non-negligible interparticle interactions,which corroborate the interpretation <strong>of</strong> the magnetization measurements. The Arrheniusplot <strong>of</strong> the ac susceptibility data, namely ln(1/f ) vs. 1/T B , revealed an almostlinear dependence, however, the obtained values are unrealistic fit, probably due to thedipolar phenomena proposed above.4. ConclusionWe reported an easy route for the preparation <strong>of</strong> silica microspheres doped withcobalt ferrite magnetic nanocrystals. The synthesis was based on the acid-catalyzed sol-gel process in microemulsion. The final product consists <strong>of</strong> microspheres with averagediameter <strong>of</strong> 11 μm, <strong>and</strong> very small Co-ferrite nanocrystals, as proved by SEM, HRTEM <strong>and</strong> XRD analyses. We have further demonstrated a full magnetic <strong>characterization</strong><strong>of</strong> the resulting powder, which revealed that the size <strong>of</strong> the Co-ferrite nanocrystalsis about 3.4 nm <strong>and</strong> suggested SPM behaviour, disturbed weak interparticle interaction<strong>of</strong> dipolar origin. Embedded magnetic particles in silica microspheres show differentbehaviour than pure co-particles 12]. Thanks to the limited concentration <strong>of</strong> the ferr<strong>of</strong>luidinside the microemulsion, the magnetic properties seem to be weaker. The compositemay be used in the case when magnetic crystals have to be protected by achemically inert matrix (SiO 2 ), which can be further functionalized, <strong>and</strong> simultaneouslywhen manipulation in the micro-scale is required.AcknowledgementsThis work was supported by the project: New preparation methods <strong>of</strong> magnetic nanocomposites(spinel ferrites) <strong>and</strong> study <strong>of</strong> their physical properties by the Grant Agency <strong>of</strong> Czech Republic,GA106/07/0949.
54 0WL1WL BL1 bit1 bit3bit52WL323 BL2BL2 bit2 bit40bit6WLspace65nmWLspace20nm1 0MTwinFlashcel easurement65nm0ΔVt N(bits1<strong>and</strong>24 5)(V) 68t(bt3)( )xx(b )ReceivedSiO 2 microspheres doped with CoFe 2 O 4 nanocrystals 137References[1] MASSART R., IEEE Trans. Magn., 17 (1981), 1247.[2] POPE E.J.A., MACKENZIE J.D., J. Non-Cryst. Solids, 87 (1986), 185.[3] CHEN K.C., TSUCHIYA T., MACKENZIE J.D., J. Non-Cryst. Solids, 81 (1986), 227.[4] ARTAKI I., ZERDA T.W., JONAS J., J. Non-Cryst. Solids, 81 (1986), 381.[5] MORNET S., GRASSET F., PORTIER J., DUGUET E., Europ. Cells Mater. Vol. 3., Supll. 2 (2002), 110.[6] MORITAK S.E., TAIRA S., ICHIYANAGI Y., MORONE N., SONG S.-Y., HATANAKA T., YUASA S., SETOU M.,J. Nanosci. Nanotechn., 7 (2007), 937.[7] BORAK B., LASKOWSKI S., HECZKO O., AALTONEN A., BASZCZUK A., JASIORSKI M., SÖDERBERG O.,MAZUREK B., OJA M., HANNULA S.-P., MARUZSZEWSKI K., Mater. Sci.-Pol<strong>and</strong>, 25 (2007), 167.[8] CHENG J., NI X., ZHENG H., LI B., ZHANG X., ZHANG D., Mater. Res. Bull., 41 (2006), 1424.[9] TAGO T., HATSUTA T., MIYAJIMA K., KISHIDA M., TASHIRO S., WAKABAYASHI K., J. Am. Ceram.Soc., 85 (2002) 2188.[10] NOUMEN M., PILENI M.P., J. Phys. Chem., 100 (1996), 1867.[11] FELTIN M., PILENI M.P., Langmuir, 13(1997), 3927.[12] JOLIVET J.-P., TRONC E., CHANEAC C., Chimie 5 (2002), 1.[13] DJURBERG C., SVENDLINH P., NORDBLAD P., HANSEN M.F., BØDKER F., MØRUP S., Phys. Rev. Lett.,79 (1997), 51.[14] DORMANN J.L. , FIORANI D., CHERKAOUI R., TRONC E., LUCARI F., D’ORAZIO F., SPINU L., NOGUES M.,KACHKACHI H., JOLIVET J.-P., J. Magn. Magn. Mater., 203 (1999), 23.2 December 2008Revised 2 July 2009
Materials Science-Pol<strong>and</strong>, Vol. 28, No. 1, 2010Finite element stress analysis<strong>of</strong> forging dies to improve their fatigue lifeK. DEHGHANI 1* , A. JAFARI 2, 31 Amirkabir University <strong>of</strong> Technology, Tehran, Iran2 Shahid Bahonar University <strong>of</strong> Kerman, Kernan, Iran3 University <strong>of</strong> Tehran, School <strong>of</strong> Mechanical Engineering, Tehran, IranThe forging dies, <strong>and</strong> in a particular case a bolt die, were stress analyzed by the finite elementmethod. Two possible modes <strong>of</strong> die failure, due to hoop <strong>and</strong> axial stresses, were investigated. The criticalzones <strong>of</strong> highly concentrated stresses have been identified. Several approaches were studied to overcomethe tensile stresses that result in a premature failure <strong>of</strong> a forging die. The results <strong>of</strong> the finite elementsimulations show that generating the compressive or negative stresses, as produced by the techniquesapplied, can completely remove, or at least significantly reduce the detrimental tensile stresses generated/during forging. This can readily improve the fatigue life <strong>of</strong> dies. Numerical stress analysis was performedon critical elements lying in the transition zone <strong>of</strong> dies. Finally, advanced numerical methods, especiallythe finite element method, were used to determine the optimum mean stress <strong>and</strong> the optimum alternativestress as well as to analyze the compressive negative stresses generated by the applied techniques. TheABAQUS s<strong>of</strong>tware was used for the finite element simulation. The optimum mean stress <strong>and</strong> the optimumalternative stress at the most critical finite element were determined to be 140–150 <strong>and</strong> 34–38 MPa,respectively.Keywords: die-life improvement; forging; extrusion; pre-stress; fatigue fracture1. IntroductionForging is among the best techniques for the production <strong>of</strong> tools. However, themajor concern is the fatigue life <strong>of</strong> forging dies, so that not only the selection <strong>of</strong> anappropriate material is very important in this regard, but also its proper design. That isbecause forging dies are usually subject to high cyclic stresses that can easily lead toa high level <strong>of</strong> internal pressure, local stress concentrations, localized deformation <strong>and</strong>finally premature failure <strong>of</strong> dies._________* Corresponding author, e-mail: dehghani@aut.ac.ir
140K. DEHGHANI, A. JAFARISelecting a die material to satisfy all the properties required for a long life is notan easy task. Among the suggested materials, tungsten carbide has been widely usedas the best choice [1–4]. However, there is a major concern remaining with this material,that is the lack <strong>of</strong> a long fatigue life. As tungsten carbide is a high strength, brittlematerial, the short fatigue life <strong>of</strong> dies might somehow be attributed to improper diedesign. That is because the high tensile stresses generated in the most critical regions<strong>of</strong> a die can readily reduce the fatigue strength, resulting in premature die failure. Inother words, the importance <strong>of</strong> an appropriate die design to prevent or reduce the concentration<strong>of</strong> tensile stresses is just as important as die materials themselves.It is reported that the decrease in the fatigue strength <strong>of</strong> dies, due to the presence<strong>of</strong> undesirable tensile stresses, can easily lead to the fracture <strong>of</strong> dies at a life shorterthan expected [5–7]. As mentioned earlier, the main origin <strong>of</strong> detrimental tensilestresses is inadequate die design, resulting in undesirable stress concentrations. A highstress concentration leads in turn to crack initiation <strong>and</strong> fast crack growth, especiallywhen the die material is brittle. This means that even if the best materials are selected,premature die failure can occur if a die is not designed properly.Although a lot <strong>of</strong> papers have been published on the selection <strong>of</strong> suitable materialsfor dies [1–4], far fewer are available on the finite element modelling <strong>of</strong> die design.For example, reducing or eliminating the detrimental tensile stresses concentrated inthe critical areas <strong>of</strong> dies is essential for improving the fatigue life <strong>of</strong> dies. Thus, theobjectives <strong>of</strong> the present work were to determine <strong>and</strong> analyze the regions <strong>of</strong> highlyconcentrated stresses in forging dies, especially in the particular case <strong>of</strong> a bolt die.Then, attempts have been made for finite-element simulating the design <strong>of</strong> forgingdies. To meet these goals, the practical approaches were studied, including die inserts,shrink rings, assembled dies <strong>and</strong> tapered dies. These alternative designs were investigatedwith regard to their effect on eliminating the tensile stresses concentrated incritical regions <strong>of</strong> a bolt die. The aforementioned techniques can significantly reducethe detrimental tensile stresses by imposing the pre-stresses leading to the prevention<strong>of</strong> premature failure <strong>of</strong> dies.2. ExperimentalMaterials. Plastic deformation is not accepted to happen in the die because its occurrencein a die results in losing the dimension stability or size accuracy <strong>of</strong> producedbolts. In such a case, different bolts having various sizes may be produced with a largetolerance in dimensions. Consequently, tungsten carbide, which exhibits elastic behaviourrather than elastoplastic one due to its very high strength is considered for the dieinsert. Therefore, the material to be forged was considered AISI 1010 steel withelasto-plastic behaviour. The stress-strain relation for this steel is as follow [2]:σ0.22= 730(1)ε
Finite element stress analysis <strong>of</strong> forging dies 141As for the die material, the characteristic parameters for tungsten carbide are, accordingto [3], as follows: E = 540 GPa, v = 0.22.0. The result <strong>of</strong> the present simulation,applied for producing a M10 bolt made <strong>of</strong> AISI 1010, yielded the pressure <strong>of</strong>about 650 MPa.Fig. 1. Schematic <strong>of</strong> the design <strong>of</strong> an M10 bolt dieFig. 2. Modes <strong>of</strong> possible failure due to: a) hoop stress <strong>and</strong> b) axial stressA schematic design <strong>of</strong> the M10 bolt die studied in the present investigation isshown in Fig. 1. The design is based on existing st<strong>and</strong>ards [1, 2]. As any change in thecross section can cause stress concentration, therefore, in this case, the most significantfatigue failure is expected to occur at or near the transition section shown inFig. 2. Due to the stress concentration, there are two possible origins for fatigue cracknucleation, as shown in Fig. 2. Contrary to the fact that the real life <strong>of</strong> forging diesshould lie in the high cycle fatigue (HCF) range, here the premature fatigue failure isexpected to occur in the low cycle fatigue (LCF) range. In other words, the undesirabletensile stress distribution in the die is responsible for this contravention <strong>and</strong> prematurefailure. As shown in Fig. 2, these tensile stresses are oriented in two directions;Figure 2a refers to the failure due to hoop stresses (first mode), whilst Fig. 2b indi-
142K. DEHGHANI, A. JAFARIcates the failure due to axial stresses (second mode). This is also in agreement with theprevious works [6, 8].This work is mostly focused on the methods used to eliminate the tensile stressesin the die. This technique is in accordance with the work <strong>of</strong> others [5, 9]. The proposedapproach is based on the following steps:• Analyzing the stresses distributed in both die <strong>and</strong> work-piece using the finiteelement method.• Determining the critical points or regions <strong>of</strong> highest stress concentrations <strong>and</strong>/or<strong>of</strong> maximum tensile stresses in the die.A crude representation <strong>of</strong> a die as a thick cylinder is sufficient for some mathematicalmodels, but it is not an adequate for accurately identifying critical regions <strong>of</strong>fatigue stresses. As a result, advanced numerical methods, especially the finite elementmethods, were used in this regard [10, 11]. It should be emphasized that in the presentwork, the ABAQUS s<strong>of</strong>tware was used for finite element simulation [12].The assumptions made in the finite element modelling were: both die <strong>and</strong> workpiecewere analyzed simultaneously, the rigid behaviour <strong>of</strong> the die during the workpiece deformationwas ignored, the symmetrical condition was considered, <strong>and</strong> the boundarycondition was considered as 15 mm vertical displacement <strong>of</strong> a hammer pin.3. Results <strong>and</strong> discussion3.1. Stress analysisAlthough the die material (i.e., tungsten carbide) yields a high tensile strength, itsfatigue strength is considerably reduced due to the tensile stress generated across thedie during the forging cycles. Thus, as a first step, it is essential to determine the distribution<strong>of</strong> tensile stresses in the die. The regions <strong>of</strong> high tensile stresses are the socalledcritical points <strong>of</strong> the die. To determine these regions, a simple die, withoutshrink ring, was considered. Figure 3 presents the axial stress distribution within thedifferent portions <strong>of</strong> the die during forging, whereas Fig. 4 shows the distribution <strong>of</strong>hoop stresses, both obtained using the assumed models. As is obvious, the hoopstresses in most portions are positive (tensile) <strong>and</strong> reach the maximum level across theregion α <strong>of</strong> the die (Fig. 4). With respect to axial stresses (Fig. 3), the situation is different;they are positive or tensile in a much fewer number <strong>of</strong>] regions. By contrast, inmost places, the generated stresses are negative (compressive).It is interesting that at the critical radius, i.e. at the point <strong>of</strong> cross-sectional change,where crack initiation is most likely to occur, the axial stresses are tensile (region βindicated in Fig. 3). Thus, these two regions (α <strong>and</strong> β) can be identified as the criticalzones where the stress concentrations are the highest. That is why the first mode <strong>of</strong>fracture (Fig. 2a) can take place in the region α, while the second mode <strong>of</strong> failure(Fig. 2b) may occur in the region β.
Finite element stress analysis <strong>of</strong> forging dies 143Fig. 3. Axial stress counter in the insert (MPa)Fig. 4. Hoop stress counter in the insert (MPa)Therefore, according to the fatigue analysis, the fatigue strength is reduced in the regionshaving positive stresses. As a result, premature fatigue failure is expected to occuranywhere in the die where the generated tensile stress is at its highest value [13, 14]. Thatis why the lifespan <strong>of</strong> forging dies is mainly considered to lie in the low-cycle fatigue(LCF) range rather than in the high-cycle fatigue (HCF) one. Nevertheless, as alreadymentioned, if these principal stresses could be changed to compressive stresses (negative),e.g. by using a shrink ring to induce pre-stresses, then a significant increase in the fatiguestrength <strong>of</strong> dies could be readily attained. If however the tensile stresses, dominant duringforging cycles, could not be eliminated, reduced, or replaced with compressive ones, thenthere is no alternative to using a tougher material.3.2. First mode <strong>of</strong> failure caused by hoop stressesIn this section, the analysis <strong>and</strong> control, by means <strong>of</strong> FEM simulation, <strong>of</strong> the firstmode <strong>of</strong> failure, as illustrated in Fig. 2a, caused by hoop stresses is discussed. One <strong>of</strong>the best approaches for converting the hoop tensile stresses (generated during cyclicforging) to compressive ones is use a shrink ring, which is simulated here. In sucha case, there is a pre-stress imparted by the ring to the inner part <strong>of</strong> the die. This inturn causes the die to experience an overall negative hoop stress, even under themaximum inner pressure imposed on the die insert during service.
144K. DEHGHANI, A. JAFARIFig. 5. Hoop stress counter imposed onlyby using shrink ring (MPa)Fig. 6. Hoop stress counter when applyingload along with using shrink ring (MPa)Classical analysis, based on Lame’s method [15], shows that it is possible to simulate<strong>and</strong> calculate the interference <strong>of</strong> a shrink ring. To illustrate the effect <strong>of</strong> a shrinkring, the results <strong>of</strong> FEM simulation regarding its hoop-stress counter are compared inFigs. 5 <strong>and</strong> 6. Figure 5 appertains only to the presence <strong>of</strong> the ring, but not to finer attributes,such as the inner pressure in the absence <strong>of</strong> loading. Figure 6 shows the simulatedhoop stresses induced by both the ring load <strong>and</strong> the forging load. As is obvious,in both cases, the resultant hoop stress in all parts <strong>of</strong> the die is negative. As a result,the fatigue life <strong>of</strong> the die can be considerably increased if the first mode <strong>of</strong> die failurecan be delayed by the use <strong>of</strong> shrink rings.3.3. Second mode <strong>of</strong> failure caused by axial stressesAs previously mentioned, another cause <strong>of</strong> die failure (second mode) is due to thegeneration <strong>of</strong> tensile stresses in the transition region <strong>of</strong> the die, (Fig. 2b). In this case,three techniques may be applied to overcome the premature failure <strong>of</strong> the secondmode. The first one is to use a multipart die, i.e. an assembled die. A schematic dia-
Finite element stress analysis <strong>of</strong> forging dies 145gram <strong>of</strong> a possible, assembled die for the M10 bolt is shown in Fig. 7. Here, the assembleddie consists <strong>of</strong> only two parts. However, in the case <strong>of</strong> a complicated shape,a more elaborate assembly might consist <strong>of</strong>, for example, several parts, such as a case,sleeve, middle insert, back insert <strong>and</strong> front insert. In this procedure, the interface betweenvarious die parts may act as free surfaces that relieve the tensile stress, therebyreducing the stress concentrations at or near the critical sections. This is an importantpractical issue for increasing the fracture toughness <strong>of</strong> materials when a thick structureexperiencing plane strain condition with low toughness is divided into thin layers experiencingplane stress condition with high toughness [16]. In the case <strong>of</strong> dies, thishappens when they are manufactured <strong>of</strong> various interferences, e.g. an assembled die,which consists <strong>of</strong> a few parts or sections.Fig. 7. The schematic <strong>of</strong> an assembled M10 bolt die consisting <strong>of</strong> two partsFig. 8. Five different pressure distributions across the die wall (MPa)The other method, already mentioned, is to impose a pre-stress (i.e., negativestress) across the die wall, especially at or near the cross-section change-zones or thecritical transition zones. To model this case, five situations (A, B, C, D <strong>and</strong> E) <strong>of</strong> non-
146K. DEHGHANI, A. JAFARIuniform pre-stresses imposed on the die are assumed, <strong>and</strong> presented in Fig. 8. As theprimary simulation, applied for producing a M10 bolt made <strong>of</strong> AISI 1010, yields thepressure <strong>of</strong> about 650 MPa, therefore, the upper limit <strong>of</strong> simulated pressure was considered650 MPa,For the cases C, D <strong>and</strong> E, the presumed pressure is reduced linearly from a maximumat the top, toward the transition section, <strong>and</strong> then remains constant at the bottompart <strong>of</strong> the bolt die. However for cases A <strong>and</strong> B, the pressure is reduced only at thetransition section, while at both the top <strong>and</strong> bottom portions <strong>of</strong> the bolt die, it is keptconstant. The reason for simulating such a pressure distribution was to generate a kind<strong>of</strong> negative bending moment, to counteract the positive one produced by the formingpressure, as shown in Fig. 9a. It should be emphasized that the simulated pressuredistributions shown in Fig. 8 are obtained by the finite element method as well as bythe ABAQUS s<strong>of</strong>tware.Fig. 9. Forging pressure that generates a bending moment (a)<strong>and</strong> imposed pressure that can eliminate bending effects (b)Fig. 10. Scheme <strong>of</strong> the proposed tapered dieIn general, the forging pressure generates a positive bending moment that in turncauses positive tensile stresses at the cross-section change, as shown in Fig. 9a. Thesetensile stresses can readily result in fatigue crack initiation, leading to the premature
Finite element stress analysis <strong>of</strong> forging dies 147fracture <strong>of</strong> the die. That is because the generation <strong>of</strong> detrimental bending moments canresult in the second mode <strong>of</strong> failure, as presented in Fig. 2b. As mentioned before, oneuseful technique to counteract these undesirable bending moments or tensile stresses isto employ one <strong>of</strong> the five pre-stresses described in Fig. 8, illustrated again in Fig. 9b toshow the mechanism <strong>of</strong> compensation <strong>of</strong> bending effect. Such a condition can be createdusing a tapered insert. For instance, an alternative die design for an M10 boltusing a tapered insert is shown in Fig. 10.3.4. Numerical analysesAs already mentioned, FEM was used to simulate the forging process for the tapereddie design proposed in Fig. 10. As the overall stress should be negative in thecritical regions, to prevent the premature failure, attempts were therefore made toidentify the critical elements susceptible to crack initiation.Fig. 11. Critical elements <strong>and</strong> their numbersFig. 12. Axial stress counters in the insertFigure 11 shows the number <strong>of</strong> elements in the finite element simulation located atcritical zones. Interestingly, for the different cases <strong>of</strong> A to E, illustrated in Fig. 8, thehoop stresses in all critical regions <strong>of</strong> the die insert, including the critical fillet regionβ, remain negative during a complete forging cycle. On the other h<strong>and</strong>, as shownin Fig. 12 <strong>and</strong> referring to the results summarized in Table 1, the axial stress at the
148K. DEHGHANI, A. JAFARIcritical fillet region β remains negative during a complete cycle. This confirms thevalidity <strong>of</strong> the proposed approach in imposing the proper pre-stresses to generatenegative stresses at critical zones <strong>of</strong> the die.Table 1. Axial stresses in the critical elements in the fillet region (MPa)Element numberAfterloading–191–198–191–183–215240Beforeloading–135–114–103–114–141Afterloading–134–136–127–115–142246Beforeloading–177–157–136–151–167Afterloading–67–67–56–42–64210Beforeloading–203–185–159–177–183Afterloading–62–62–51–36–55216Beforeloading–208–191–164–182–185Afterloading–104–102–92–78–96222Beforeloading–208–193–165–183–182CaseABCDEAs is obvious, due to this design, the imposed stresses on the die insert in the criticalfillet region are negative. This again can lead to longer fatigue life <strong>of</strong> dies, byeliminating the undesirable tensile stresses. Therefore, generating negative or compressivestresses is the best method to increase the fatigue life <strong>of</strong> components. Thesestresses are typically produced by surface treatments such as shot preening, cold work,heat treatments, plating, etc. [16]. Generating the compressive stresses is practical notonly for dies but also for other important rotating parts, including axles, shafts, crankshafts,etc. that are subjected to cyclic loading. However, there is a region in Fig. 12,labelled γ, where a positive axial stress is generated as well. Indeed, this region mustbe inspected <strong>and</strong> treated with care when being subject to forging cycles. The numericalsimulations reveal that the axial stress varies from positive to negative in this regionduring a loading cycle.In another attempt, the mean stress σ m <strong>and</strong> alternative stress σ a were simulated.The values for σ m <strong>and</strong> σ a , obtained using the finite element analysis for the criticalelements numbered in Fig. 11, are summarized in Table 2. These elements are analyzedfor five cases illustrated in Fig. 8. In general, the lower the σ m <strong>and</strong> σ a , the higherthe fatigue life will be. On the other h<strong>and</strong>, it should be considered that it is impracticalto lower both σ m <strong>and</strong> σ a for a process like forging.The generation <strong>of</strong> cyclic stresses in the elements located in region γ in Fig. 12 enhancescrack initiation at this region. That is because, due to the generation <strong>of</strong> tensilestress, this region is the area most susceptible to failure. As a quick approach, the values<strong>of</strong> σ m <strong>and</strong> σ a appertaining to the critical elements, can be used to determine themost critical case among the five cases, A–E, illustrated in Fig. 8. For instance, it canbe concluded that by comparing the five cases, the optimum values, in terms <strong>of</strong> σ m <strong>and</strong> σ a,are probably those corresponding to cases B <strong>and</strong> C.
Finite element stress analysis <strong>of</strong> forging dies 149Table 2. Mean <strong>and</strong> alternative stresses in critical elements (MPa)Element number205211217181187Caseσ aσ mσ aσ mσ aσ mσ aσ mσ aσ m44.537.531.54637.5153.5145.5133.5131151.5443732.54938.5154149138.5135152.5453834.551.540.5152150140.5135.5152.545.53936.553.542.5149.5149140.5133.5149.547.54139.55750145.5146138.5132146ABCDEOn the other h<strong>and</strong>, another approach might be used to estimate the length <strong>of</strong> the lifecycle for various stresses occurring in critical elements. The method enables determiningthe most critical element <strong>and</strong> finding the best case <strong>of</strong> A–E as well as estimating the lifecycle numerically. In general, the fatigue life can be estimated from [17]:S f⎛ ⎞N = ⎜ ⎟⎝ a ⎠1/b(2)where a <strong>and</strong> b are the constants defined below, <strong>and</strong> S f is the fatigue strength fora specific lifea( fS ) 2ut= (3)Se1 ⎛ fS ⎞ lgutb =− ⎜ ⎟3 ⎝ Se⎠(4)where f is a constant in the range 0.8–0.95, S ut is the ultimate strength <strong>and</strong> S e is theendurance strength <strong>of</strong> the material. On the other h<strong>and</strong>, according to Goodman’s theory,the relation between the fatigue parameters is as follows [17]:σaSfσm+ = 1(5)SutSubstituting Eq. (5) into Eq. (2) leads to the following formula for determining thefatigue life or the number <strong>of</strong> cycles N:N⎛ σ S⎜⎝a Suta ut= ⎜ ⎟( −σ)m⎞⎟⎠1/b(6)
150K. DEHGHANI, A. JAFARIThe values for σ m <strong>and</strong> σ a (Table 2) are obtained using FEM simulation. The assumedvalues for the ultimate <strong>and</strong> the endurance strengths were 800 MPa <strong>and</strong> 350 MPa, respectively.The value <strong>of</strong> 0.9 was used for the constant f. Now, the number <strong>of</strong> cycles to failurecan be calculated.Fig. 13. Life cycle in accordance with cases A to E pertaining to critical elementsIn Figure 13, the number <strong>of</strong> cycles to failure (the fatigue life) obtained for casesA–E are shown, pertaining to the critical elements subjected to cyclic positive/negativeloading. The best case among A–E, the most critical element <strong>and</strong> thefinal life cycle can be readily determined by comparing the numbers <strong>of</strong> cycle to failurefor various situations. To find the best case among the cases A–E, the number <strong>of</strong> cyclesor fatigue life obtained for all states are compared in Fig. 14.Fig. 14. Minimum life cycles for cases A–EObviously, the order C, B, A, E <strong>and</strong> D can be considered as the best to the worstcase in terms <strong>of</strong> fatigue life. In other words, case C has the longest fatigue life because
Finite element stress analysis <strong>of</strong> forging dies 151it has the highest number <strong>of</strong> fatigue cycles (1.9×10 8 cycles). Besides, even for a givencase, the most critical element can be determined in terms <strong>of</strong> the number f <strong>of</strong> cycles t<strong>of</strong>ailure. For example, referring to Fig. 13 <strong>and</strong> comparing the fatigue life <strong>of</strong> differentelements in case C, the failure will most probably initiate at the element 187 which hasthe lowest cycle to failure.From the industrial point <strong>of</strong> view, the application <strong>of</strong> numerical simulation, e.g. FEanalysis, not only provides precise analysis <strong>of</strong> stresses, accurate calculation <strong>of</strong> formingloads <strong>and</strong> rapid solutions to technical problems , but it also saves costs <strong>and</strong> time.4. ConclusionsThe possible ways <strong>of</strong> improving the fatigue life <strong>and</strong> preventing the pre-maturefailure <strong>of</strong> forging dies have been investigated, by using techniques such as imposingpre-stress by shrink rings, die inserts, shrink rings, assembled dies <strong>and</strong> tapered dies.The studies were carried out on a M10 bolt die made <strong>of</strong> AISI 1010 steel. The results <strong>of</strong>finite element simulation show that negative or compressive stresses are generatedusing the aforementioned approaches. In other words, the methods applied can reducesignificantly the tensile stresses responsible for fatigue crack initiation. The fatiguelife <strong>of</strong> dies can be significantly improved when the negative stresses, rather than tensileones, are formed. In another approach, the critical regions <strong>of</strong> highly concentratedstresses are identified <strong>and</strong> appropriate solutions are provided. For example, changingthe design <strong>of</strong> a die was considered as a practical approach that has significant influenceon the fatigue life <strong>of</strong> dies.References[1] LANGE K., H<strong>and</strong>book <strong>of</strong> Metal Forming, McGraw-Hill, New York, 1985.[2] ALTAN T., OH S.I., GEGEL H.L., Metal Forming: Fundamentals <strong>and</strong> Applications, American Societyfor Metals, USA, 1983.[3] HUR K.D., CHOI Y., YEO H.T., Finite Elem. Anal. Des., 40 (2003), 173.[4] GRRAY A.G., Source Book on Cold Forming, American Society for Metals, USA, 1975.[5] VAZQUEZ V., HANAN D., ALTAN T., J. Mater. Proc. Technol., 98 (2000), 90.[6] YOH E.G., KIM Y.I., LEE Y.S., PARK H.J., NA K.H., J. Mater. Proc. Technol., 131 (2002), 647.[7] COLLINS J.A., Failure <strong>of</strong> Materials in Mechanical Design, Wiley, New York, 1981.[8] FALK B., ENGEL U., GEIGER M., J. Mater. Proc. Technol., 119 (2001), 158.[9] KNOERR M., RENTSCH C., ALTAN T., Application <strong>of</strong> 1-DEAS in CAE <strong>of</strong> Forging Dies, Proc. ICCONUser’s Conference, OH, USA, 1991.[10] YEO H.T., CHOI Y., HUR K.D., Int. J. Adv. Manuf. Technol., 18 (2001), 54.[11] LONG H., BALENDRA R., J. Mater. Process. Techn., 81 (1998), 665.[12] ABAQUS User’s Manual. Version 6.3.1, Hibbitt, Karlson <strong>and</strong> Sorensen, Inc., USA, 2002.[13] FUCHS H.O., STEPHENS R.I., Metal Fatigue in Engineering, Wiley, New York, 1980.[14] GEIGER M., FALK B., ENGEL U., Prod. Eng., 6 (1999), 2.[15] UGRAL A.C., FENSTER S.K., Advanced Strength <strong>and</strong> Applied Elasticity, Prentice-Hall, New Jersey,1995.
45 0WL1WL BL1 bit1 bit3bit52WL323 0BL2BL2 bit2 bit4bit6WLspace65nmWLspace20nm1 0MTwinFlashcel easurement65nm0ΔVt N(bits1<strong>and</strong>24 5)(V) 68t(bt3)( )xx(b )Received152K. DEHGHANI, A. JAFARI[16] HERTZBERG R.W., Deformation <strong>and</strong> Fracture Mechanics <strong>of</strong> Engineering Materials, Wiley, NewYork, 1983.[17] SHIGLEY J.E., MISCKE C.R., BUDYANS R.G., Mechanical Engineering Design, McGraw-Hill, NewYork, 2004.29 December 2008Revised 12 October 2009
Materials Science-Pol<strong>and</strong>, Vol. 28, No. 1, 2010Raman scattering <strong>of</strong> ZnO films preparedby the laser molecular beam epitaxyC. WANG 1* , Z. CHEN 2 , Y. HE 1 , L. LI 1 , D. ZHANG 11 School <strong>of</strong> Physics Science <strong>and</strong> Information Engineering, Liaocheng University,Liaocheng 252059, Sh<strong>and</strong>ong Province, P.R. China2 School <strong>of</strong> Materials Science <strong>and</strong> Engineering, Nanyang Technological University, Singapore 639798A series <strong>of</strong> ZnO films have been prepared on Si (100) substrate at various oxygen pressures <strong>and</strong> atvarious substrate temperatures by using a laser molecular beam epitaxy system. Their structure was investigatedby the Raman spectroscopy <strong>and</strong> X-ray diffraction. Raman spectra showed that only E 2 (low) <strong>and</strong>E 2 (high) modes were present in all ZnO films. The E 2 (low) mode peak changed from disperse to sharp atfirst <strong>and</strong> then became more dispersed as either the oxygen pressure or the substrate temperature increased.Its intensity reached a maximum either under the oxygen pressure <strong>of</strong> 1 Pa or at 773 K. The analysesshowed that the sharper <strong>and</strong> stronger the E 2 (low) mode peak, the better the crystal quality, which wasconfirmed by the X-ray diffraction. Moreover, every E 2 (high) mode peak shifted to lower Raman frequenciescompared with ZnO single crystal, implying that a tensile stress occurred in all films, which wasalso proved by the X-ray diffraction. All results indicated that Raman scattering is one <strong>of</strong> the most usefulmethods to investigate the structure <strong>of</strong> ZnO films. In addition, the intensity <strong>of</strong> Si Raman scattering wasenhanced in our results, which might be due to surface-enhanced Raman spectroscopy.Keywords: Raman scattering; X-ray diffraction; ZnO films; laser molecular beam epitaxy1. IntroductionZnO wjich has attracted much attention in recent years [1–4], is a versatile II–IVsemiconductor material, with a variety <strong>of</strong> applications such as in ultraviolet (UV)emitters <strong>and</strong> detectors, surface acoustic wave (SAW) devices, gas sensors <strong>and</strong> transparentconducting electrodes. Many reports on ZnO films involved some techniques tostudy their structure, playing a key role in determining the properties <strong>of</strong> ZnO films.Raman scattering is considered to be a valuable technique for fast <strong>and</strong> nondestructivestudy <strong>of</strong> ZnO films. It can give information about the crystal structure at the scale <strong>of</strong>a few lattice constants. Any distortion <strong>of</strong> the lattice, excursion <strong>of</strong> the component, crystaldefect <strong>and</strong> phase transformation can be shown in Raman b<strong>and</strong>s. Therefore, the Ra-_________* Corresponding author, e-mail: e-mail: wcz102@sjtu.org
154C. WANG et al.man spectroscopic technique is one <strong>of</strong> the most useful methods for gaining insight intothe microscopic structural effects <strong>of</strong> ZnO materials. In this paper, we have used Ramanscattering to investigate the effects <strong>of</strong> both oxygen pressure <strong>and</strong> substrate temperatureon ZnO films.2. ExperimentalAll ZnO films were prepared on single crystals Si (100) substrates by using a lasermolecular beam epitaxy system. The laser source was a KrF excimer laser withthe wavelength <strong>of</strong> 248 nm. The pulse <strong>of</strong> the laser was 5 Hz <strong>and</strong> the energy was 100 mJper pulse. A ZnO ceramic target with the diameter <strong>of</strong> 40 mm <strong>and</strong> the purity <strong>of</strong> 99.99%was installed parallel to the substrate surface <strong>and</strong> the distance between the target <strong>and</strong>the substrate was about 5 cm. The base pressure was ca. 5 × 10 –6 Pa. When in position,all KrF excimer laser pulses were focused by a lens <strong>and</strong> were directed onto a ZnOceramic target. In order to improve the crystal quality <strong>of</strong> ZnO films <strong>and</strong> to compensatethe oxygen atoms in ZnO films, the oxygen gas with a purity <strong>of</strong> 99.999% was put intoa deposition chamber. Both the target <strong>and</strong> the substrate were rotated at 30 rev/min inorder to make the ZnO films homogeneous. The deposition time was about 2 h for allsamples. The microstructure <strong>of</strong> ZnO films was investigated using both a Raman spectrometer<strong>and</strong> an X-ray diffractometer (XRD) with Cu K α radiation (λ = 0.15406 nm).The cross-section morphologies were characterized by scanning electronic microscopy(SEM). The thicknesses <strong>of</strong> ZnO layers could also be determined by observing thecross-section morphologies <strong>of</strong> ZnO layers. The results showed that all ZnO layers areca. 800 nm.3. Results <strong>and</strong> discussionFigure 1 shows the Raman spectra <strong>of</strong> ZnO films prepared on Si substrate undervarious oxygen pressures. The substrate temperatures are all 773 K <strong>and</strong> all the resultscould be obtained by the subtraction <strong>of</strong> signals <strong>of</strong> the Si substrate from total signals. Itcan be seen that the E 2 modes corresponding to ZnO films are represented besidessome Raman peaks corresponding to single crystal Si, <strong>and</strong> no other Raman peaks correspondingto ZnO were discovered. The E 2 modes include an E 2 (low) mode at about99 cm –1 <strong>and</strong> an E 2 (high) mode at about 437 cm –1 [5]. It was clear from Fig. 1 that theZnO film exhibited a dispersed E 2 (low) peak with low intensity at a low oxygen pressure<strong>of</strong> 10 –5 Pa. As the oxygen pressure increased, the E 2 (low) peak first became sharp<strong>and</strong> then dispersed, reaching its sharpest pr<strong>of</strong>ile at 1 Pa oxygen pressure. At the sametime, the intensity <strong>of</strong> the E 2 (low) peak also reached a maximum. Meanwhile, it couldbe seen that the position <strong>of</strong> E 2 (high) peaks for all ZnO films shifted to a lower frequencycompared with ZnO single crystal [5]. In addition, it should be noted thata very strong Raman signal <strong>of</strong> Si substrate was present even if the substrate signal was
Raman scattering <strong>of</strong> ZnO films 155subtracted from the total signal. This might be attributed to the surface-enhanced Ramanspectroscopy (SERS) [6] induced by the epitaxy layer ZnO films. Further comparativestudies will be undertaken later.Fig. 1. Raman spectra <strong>of</strong> ZnO films preparedon Si substrate under various oxygen pressures.The substrate temperatures are all 773 KFig. 2. Raman spectra <strong>of</strong> ZnO films preparedon Si substrate at various substrate temperatures.The oxygen pressures are all 1 PaFigure 2 shows the Raman spectra <strong>of</strong> ZnO films prepared on Si substrate at varioussubstrate temperatures. The oxygen pressures were all 1 Pa <strong>and</strong> all the spectrawere obtained by the subtraction <strong>of</strong> the Si substrate signal from the total signal. It canbe seen that the results were similar to those in ZnO films prepared under variousoxygen pressures. Besides some Raman peaks corresponding to single crystal Si, onlyE 2 modes corresponding to ZnO films were present in the spectra. At low substratetemperatures ZnO film exhibited a dispersed E 2 (low) peak with low intensity. As thesubstrate temperature increased, the pr<strong>of</strong>ile <strong>of</strong> the E 2 (low) peak at first became sharp<strong>and</strong> then became dispersed, reaching its sharpest pr<strong>of</strong>ile at 773 K. At the same time,the intensity <strong>of</strong> the E 2 (low) peak also reached a maximum. In addition, it can be seenfrom Fig. 2 that the position <strong>of</strong> each E 2 (high) peak also shifted to lower frequenciescompared with ZnO single crystal [5].It is well known that ZnO with a hexagonal wurtzite structure belongs to the space4group C The group theory predicts that optical phonons at the Γ point <strong>of</strong> the Brillouin. 6 v
156C. WANG et al.zone belong to the following irreducible representation [7, 8]: Γ = 1A 1 +2B 1 +1E 1 +2E 2 .Both A 1 <strong>and</strong> E 1 modes are polar <strong>and</strong> split into transverse (TO) <strong>and</strong> longitudinal optical(LO) phonons with different frequencies, due to the macroscopic electric fields associatedwith the LO phonons. The two non-polar E 2 modes are Raman active only. The B 1modes are infrared <strong>and</strong> Raman inactive (silent modes). As far as the phonon modes wereconcerned, different scattering geometry could generate different phonon modes in theRaman spectra. In this paper, the Raman spectra have been recorded with the scatteringgeometry in which incident <strong>and</strong> scattered polarizations are parallel. According to Ramanselection rules [9], only the E 2 <strong>and</strong> A 1 (LO) mode can be observed in the above geometry.The reason why the A 1 (LO) mode did not occur in our experiments might be due to thefact that the A 1 (LO) mode was subsumed by the strong Si substrate mode [10].Some researchers [11–13] reported that the E 2 (low) peak could determine thecrystal quality <strong>of</strong> films, while the E 2 (high) peak had a close relationship with the intrinsicstress in ZnO films. If the E 2 (low) peak is sharpest <strong>and</strong> has the highest intensity,the sample has the best crystal quality. Moreover, if a tensile stress occurs in thefilms, the E 2 (high) peak can shift to lower frequencies compared with the bulk value<strong>of</strong> 437 cm –1 , while the E 2 (high) peak can shift to higher frequencies with respect to437 cm –1 if there exists a compressive stress in the films. Therefore, according to theRaman results above, we can draw the conclusion that ZnO films prepared on Si substrateboth under 1 Pa oxygen pressure <strong>and</strong> at 773 K have the best crystal quality, <strong>and</strong>all ZnO films exhibited tensile stress, which can also be confirmed by XRD results.Fig. 3. XRD spectra <strong>of</strong> ZnO films prepared on Si substrate either at 773 K for various oxygenpressures (a) or under oxygen pressure <strong>of</strong> 1 Pa for various substrate temperatures (b).The inset shows the dependences <strong>of</strong> full widths at half maximum (FWHM) <strong>of</strong> the rocking curve<strong>of</strong> (002) diffraction peak on either the oxygen pressure (a) or the substrate temperature (b)Figure 3 shows the XRD spectra <strong>of</strong> ZnO films prepared on Si substrate either at773 K under various oxygen pressures or under 1 Pa oxygen pressure for various substratetemperatures. It can be seen that the ZnO films formed a wurtzite (B4) structure<strong>and</strong> there occurred a strong (002) diffraction peak at 2θ equal to ca. 34.5° for all ZnOfilms. A (004) diffraction peak also occurred for all ZnO films. However, its low in-
Raman scattering <strong>of</strong> ZnO films 157tensity compared the intensity <strong>of</strong> the (002) peak implied that ZnO films have strong(002) texture <strong>and</strong> grew along the [002] orientation. This is confirmed by SEM observation(Fig. 4). Figure 4 shows the cross-section morphologies <strong>of</strong> ZnO films preparedboth at 773 K <strong>and</strong> under oxygen pressure <strong>of</strong> 1 Pa. It was apparent that ZnO films withthe thickness <strong>of</strong> ca. 800 nm formed columnar grains, indicating that ZnO films grew incolumnar form. By comparison <strong>of</strong> the XRD spectra, one can draw the conclusion thatZnO films grew along the [002] orientation, which is perpendicular to the substratesurface.Fig. 4. The cross-section morphology <strong>of</strong> ZnO filmsprepared both at 773 K <strong>and</strong> at 1 Pa oxygen pressureIt is apparent from Fig. 3a that at a low oxygen pressure <strong>of</strong> 10 –5 Pa, the intensity <strong>of</strong>the (002) diffraction peak was low. As the oxygen pressure increased, the intensity <strong>of</strong>the (002) diffraction peak increased <strong>and</strong> then decreased, reaching a maximum at themiddle oxygen pressure <strong>of</strong> 1 Pa. In addition, at a low substrate temperature, the intensity<strong>of</strong> the (002) diffraction peak was also low. As the substrate temperature increased,the intensity <strong>of</strong> the (002) diffraction peak increased <strong>and</strong> then decreased, reachinga maximum at 773 K (Fig. 3b).The intensity <strong>of</strong> a diffraction peak depends on both the crystal quality <strong>and</strong> thethickness <strong>of</strong> a film. Therefore it is insufficient to evaluate the crystal quality <strong>of</strong> ZnOfilms only from the intensity <strong>of</strong> the (002) diffraction peak. Another important factor isthe full width at half maximum (FWHM) <strong>of</strong> the rocking curve <strong>of</strong> the (002) diffractionpeak for ZnO films, through which we can easily determine the crystal quality <strong>of</strong> ZnOfilms prepared under various oxygen pressures. The smaller the FWHM, the better thecrystal quality is. Accordingly, we measured the rocking curve <strong>of</strong> the (002) diffractionpeak for ZnO films prepared under all conditions <strong>and</strong> showed the dependence <strong>of</strong> theFWHM values on either the oxygen pressure or the substrate temperature, as the insetsin Fig. 3. It can be seen from the inset in Fig. 3a that as the oxygen pressure increased,the FWHM <strong>of</strong> the rocking curve <strong>of</strong> the (002) diffraction peak first decreased <strong>and</strong> thenincreased, reaching a minimum <strong>of</strong> about 3.36° at 1 Pa oxygen pressure, indicating thatfilm had the best crystal quality. It can also be seen from Fig. 3b that as the substratetemperature increased, the FWHM <strong>of</strong> the rocking curve <strong>of</strong> the (002) diffraction peakfirst decreased <strong>and</strong> then increased, reaching a minimum <strong>of</strong> about 3.36° at 773 K, indicatingthat the film prepared at 773 K had the best crystal quality. All the above resultsshowed that ZnO films prepared both at 1 Pa oxygen pressure <strong>and</strong> at 773 K have the
158C. WANG et al.best crystal quality, which is in good agreement with the Raman spectra <strong>and</strong> confirmedthe accuracy <strong>of</strong> the Raman results.For all ZnO films, the diffraction angle <strong>of</strong> all ZnO (002) diffraction peaks shifted tohigher values compared with the st<strong>and</strong>ard XRD spectrum <strong>of</strong> ZnO powder (2θ = 34.43°)[14], implying that the lattice constant c changed for all ZnO films. These changeswere mainly caused by the intrinsic stress <strong>of</strong> ZnO films. For ZnO films with a wurtzitestructure, the intrinsic stress could be obtained by the following formula [15]:22 c13 − c33( c11 + c12)c−c0σ = (1)2cc13 0where (i, j = 1, 2, 3) st<strong>and</strong>s for the elastic constants in various orientations, c 0 is thelattice constant <strong>of</strong> ZnO films without defects <strong>and</strong> c is the lattice constant <strong>of</strong> ZnO filmin our experiments, which can be computed by the following formulae:2 2 21 4 h + hk+k l= + (2)2 2 2d 3 d c2d sinθ = λ(3)where h = 0, k = 0, l = 0 for the ZnO (002) diffraction peak, therefore, c is expressedas follows:λc= 2d002= (4)sinθwhere d 002 is the interplanar spacing <strong>of</strong> the ZnO (002) crystal plane. λ <strong>and</strong> θ are theX-ray wavelength <strong>and</strong> the Bragg diffraction angle, respectively.Substituting the value <strong>of</strong> c i,j (i, j = 1, 2, 3) in Eq. (1) with c 11 = 208.8 GPa,c = 119.7 GPa, c 1,2 1,3 = 104.2 GPa, c 33 = 213.8 GPa [16], we could obtain the residualstress σ [GPa] in ZnO film by the following formula:σ233 c − c0=− (5)c0Using the above formula, we calculated the intrinsic stress σ <strong>and</strong> the lattice constantc for various ZnO films, as shown in Fig. 5. Figure 5a showed the dependence <strong>of</strong>the intrinsic stress <strong>and</strong> the lattice constant on the oxygen pressure at 773 K <strong>and</strong> Fig. 5bthe dependence <strong>of</strong> the intrinsic stress <strong>and</strong> the lattice constant on the substrate temperatureunder oxygen pressure <strong>of</strong> 1 Pa. The lattice constants <strong>of</strong> all ZnO films are smallerthan that <strong>of</strong> bulk materials, thus resulting in tensile stresses in films, which was ingood agreement with Raman data. These results confirmed that Raman scattering isa useful method for studying the structure <strong>of</strong> ZnO films. In addition, upon increasingthe oxygen pressure, the stress first decreased <strong>and</strong> then increased, reaching a minimum
Raman scattering <strong>of</strong> ZnO films 159at 1 Pa (Fig. 5a). As the substrate temperature increased, however, the stress increasedmonotonically (Fig. 5b).Fig. 5. Dependences <strong>of</strong> the lattice constant <strong>and</strong> the intrinsic stress on the oxygenpressure at 773 K (a), on the substrate temperature at 1 Pa oxygen pressure (b)Fig. 6. Schematic illustration <strong>of</strong> the changes<strong>of</strong> stresses with the substrate temperatureIn the ZnO film with the wurtzite structure, an intrinsic film stress in the directionperpendicular to the surface originated from a C-axis strain [17, 18]. Basically, thisstress included an intrinsic stress originating from thermal mismatch between films<strong>and</strong> substrates <strong>and</strong> another intrinsic stress originating from the film structure. For ZnOfilms prepared with various oxygen pressures at 773 K, the intrinsic stress originatingfrom thermal mismatch between films <strong>and</strong> substrates should be equal, while the intrinsicstress originating from the film structure changed non-monotonically with the filmstructure <strong>and</strong> should reach a minimum for films with the best crystal quality, thus resultingin the non-monotonic dependence <strong>of</strong> the stress on the oxygen pressure. ForZnO films prepared with various substrate temperatures under oxygen pressure <strong>of</strong>1 Pa, two kinds <strong>of</strong> stresses changed with the substrate temperature. The intrinsic stressoriginating from thermal mismatch between films <strong>and</strong> substrates should increasemonotonically as the substrate temperature increases, while another intrinsic stressoriginating from the film structure should change non-monotonically with the sub-
160C. WANG et al.strate temperature <strong>and</strong> should reach a minimum for film with the best crystal quality.Therefore, the sum <strong>of</strong> the two kinds <strong>of</strong> stresses might give rise to the monotonicchange <strong>of</strong> the stress with the substrate temperature (Fig. 6).4. ConclusionsThe structure <strong>and</strong> intrinsic stress <strong>of</strong> ZnO films have been investigated by using aRaman spectrometer <strong>and</strong> the X-ray diffraction. The results showed that only the E 2mode occurred in ZnO films prepared either at 773 K for various oxygen pressures orat 1 Pa oxygen pressure for various substrate temperatures. The analyses showed thatthe sharper <strong>and</strong> the stronger the E 2 (low) mode peak, the better the crystal quality, <strong>and</strong>the E 2 (high) mode peak in all films shifted to lower frequencies compared with ZnOsingle crystal, implying that a tensile stress occurred in all films. These results confirmedby X-ray diffraction indicated that Raman scattering is one <strong>of</strong> the most usefulmethods to investigate the structure <strong>of</strong> ZnO films. The changes in intrinsic stress werealso analyzed in detail.AcknowledgementThis work was supported by the Research Foundation <strong>of</strong> Sh<strong>and</strong>ong Provincial Education Department<strong>of</strong> China (No. J08LI13) <strong>and</strong> by the Science Foundation for Distinguished Young Scientist <strong>of</strong> Sh<strong>and</strong>ongProvince (No. 2008BS04036) <strong>of</strong> China. The authors also thank the Sh<strong>and</strong>ong Provincial EducationalDepartment for providing a support base for College Teachers to research abroad.References[1] MANDALAPU L.J., XIU F., YANG Z., LIU J.L., Solid State Electr., 51 (2007), 1014.[2] HUANG F.C., CHEN Y.Y., WU T.T., Nanotechn., 20 (2009), 065501.[3] BASU P.K., JANA S.K., MITRA M.K., SAHA H., BASU S., Sens. Lett., 6 (2008), 699.[4] MINAMI T., MIYATA T., Thin Solid Films, 517 (2008), 1474.[5] ASHKENOV N., MBENKUM B.N., BUNDESMANN C., RIEDE V., LORENZ M., SPEMANN D., KAIDASHEV E.M.,KASIC A., SCHUBERT M., GRUNDMANN M., J. Appl. Phys., 93 (2003),126.[6] STILES P.L., DIERINGER J.A., SHAH N.C., VAN DUYNE R.R., Ann. Rev. Anal. Chem., 1 (2008), 601.[7] ARGUELLO C.A., ROUSSEAU D.L., PORTO S.P.S., Phys. Rev., 181(1969), 1351.[8] WANG X.B., SONG C., GENG K.W., ZENG F., PAN F., Appl. Surf. Sci., 253 (2007), 6905.[9] ZHANG Y., JIA H.B., WANG R.M., CHEN C.P., LUO X.H., YU D.P., Appl. Phys. Lett., 83 (2003), 4631.[10] BUNDESMANN C., ASHKENOV N., SCHUBERT M., SPEMANN D., BUTZ T., KAIDASHEV E.M., LORENZ M.,GRUNDMANN M., Appl. Phys. Lett., 83 (2003), 1974.[11] DCREMPS F., PELLICER-PORRES J., SAITTA A.M., CHERVIN J.C., POLIAN A., Phys. Rev. B, 65 (2002),092101.[12] SERRANO J., MANJÓN F.J., ROMERO A.H., WIDULLE F., LAUCK R., CARDONA M., Phys. Rev. Lett., 90(2003), 055510.[13] ZENG J.N., LOW J.K., REN Z.M., LIEW T., LU Y.F., Appl. Surf. Sci., 197/198 (2002), 362.[14] CHEN Y., BAGNALL D.M., KOH H.J., PARK K.T., HIRAGA K.J., ZHU Z.Q., YAO T., J. Appl. Phys., 84(1998), 3912.[15] HONG R.J., HUANG J.B., HE H.B., FAN Z.X., SHAO J.D., Appl. Surf. Sci., 242 (2005), 346.
54 0WL1WL BL1 bit1 bit3bit52WL323 BL2BL2 bit2 bit40bit6WLspace65nmWLspace20nm1 0MTwinFlashcel easurement65nm0ΔVt N(bits1<strong>and</strong>24 5)(V) 68t(bt3)( )xx(b )ReceivedRaman scattering <strong>of</strong> ZnO films 161[16] CULLITY B.D., Elements <strong>of</strong> X-ray Diffractions, Addison–Wesley, Reading, MA, 1978.[17] THORNTON J.A., HOFFMAN D.W., Thin Solid Films, 171 (1989), 5.[18] HONG R.J., QI H.J., HUANG J.B., HE H.B., FAN Z.X., SHAO J.D., Thin Solid Films, 473(2005), 58.26 February 2009Revised 14 June 2009
Materials Science-Pol<strong>and</strong>, Vol. 28, No. 1, 2010Structure <strong>and</strong> properties <strong>of</strong> iron aluminidelayers fabricated by the chemical vapour depositionon 316L steelR. SITEK 1* , J. KAMIŃSKI 1 , P. SALLOT 2 , K.J. KURZYDŁOWSKI 11 Faculty <strong>of</strong> Materials Science <strong>and</strong> Engineering, Warsaw University <strong>of</strong> Technology,ul. Wołoska 141, 02-507 Warsaw, Pol<strong>and</strong>2 Ecole Nationale Supérieure des Mines de Saint-Etienne,158 Cours Fauriel, 42000 Saint-Etienne, FranceThe paper presents results <strong>of</strong> studies <strong>of</strong> structure <strong>and</strong> properties <strong>of</strong> the NiAl + FeAl type diffusionlayers fabricated on 316L steel (00H17N14M2) by the chemical vapour deposition using aluminiumchloride (AlCl 3 ) in a hydrogen atmosphere as a carrier gas. The layers were examined using light <strong>and</strong>scanning electron microscopy. Chemical composition analyses were carried out by EDS <strong>and</strong> phase contentwas investigated by XRD. Corrosion resistance was tested using the potentiodynamic method in 0.5M NaCl, <strong>and</strong> layer/structure adhesion was tested by the scratch test. The results obtained indicate that the50 μm thick layers fabricated on the 316L steel substrate show very good adhesion combined with verygood corrosion resistance.Keywords: iron aluminides; FeAl; CVD; austenitic stainless steel; intermetallics1. IntroductionAustenitic stainless steel 316L, due to its high corrosion resistance, is frequentlyused in implant materials [1–5] <strong>and</strong> for surgical instruments. There is also a constantincrease in the number <strong>of</strong> other fields <strong>of</strong> application, in the nuclear, shipping, chemical,power <strong>and</strong> food industries. Wider use <strong>of</strong> 316L steel in industry is limited by itslow operating temperature (up to ca. 400 °C), unsatisfactory resistance to abrasivewear, <strong>and</strong> insufficient resistance to pitting corrosion (e.g., physiological fluids). Toimprove these properties, various technological processes are used, e.g. introduction <strong>of</strong>sufficient amounts <strong>of</strong> nitrogen <strong>and</strong> molybdenum, special heat-treatments [6] or surfacetreatments, i.e. nitriding or oxygen nitriding [7–10]. The advantage <strong>of</strong> the surfacetreatment is the ability to fully control the process used to produce layers with a spe-_________* Corresponding author, e-mail: rsitek@inmat.pw.edu.pl
164R. SITEK et al.cific microstructure, phase content, <strong>and</strong> chemical composition. Fe-Al type intermetallicphases are increasingly more commonly used in the automotive, aircraft, <strong>and</strong> shippingindustries because they have good heat resistance, are strongly resistant to abrasivewear, have a relatively low density compared with conventional iron <strong>and</strong> nickelalloys, <strong>and</strong> because <strong>of</strong> their high resistance to corrosion in environments containingsulphur or oxygen. It has been predicted [11] that Fe-Al type intermetallic phases canreplace in future austenitic steels, used in the food industry, that contain chromium<strong>and</strong> nickel harmful to organisms. The feature that limits the application <strong>of</strong> bulk intermetallicsis their fragility at room temperature, <strong>and</strong> hydrogen embrittlement caused bya high affinity <strong>of</strong> aluminium to water in vapour. These properties can be improved bythe addition <strong>of</strong> alloy elements such as Mo, Si, Cr, Ta, or by grain refinement: this significantlyincreases the production cost <strong>of</strong> bulk intermetallic materials [11]. The fabrication<strong>of</strong> Fe-Al type intermetallics in the form <strong>of</strong> layers on austenitic steels is bothsimple <strong>and</strong> economical [12, 13]. Accordingly, this paper presents the results <strong>of</strong> researchon the fabrication, using the chemical vapour deposition (CVD) method, <strong>of</strong> Fe-Al type intermetallic layers on 316L steel. Aluminium chloride (AlCl 3 ) was used asthe source <strong>of</strong> aluminium, <strong>and</strong> the carrier gas was hydrogen.2. ExperimentalSamples for tests were cut out from a 4 mm thick cylindrical bar (diameter20 mm) made <strong>of</strong> 316L steel (00H17N14M2) having the chemical composition presentedin Table 1.Table 1. Chemical composition <strong>of</strong> the 316L steelElement Cr Ni Mo Si Mn C Cu P S FeConcentration[wt. %]17.47 12.7 2.55 0.8 2.0 0.03 0.015 0.045 0.03 balanceSample surfaces were polished using s<strong>and</strong>papers (grit: 600, 800, <strong>and</strong> 1200) <strong>and</strong>were degreased using an ultrasonic washer in ethyl alcohol. The layers were depositedusing the chemical vapour deposition (CVD) method in the IonBond device, in twostages, <strong>of</strong> one cycle. The first stage involved deposition <strong>of</strong> aluminium from AlCl 3 vapourswith the addition <strong>of</strong> chromium in an hydrogen atmosphere at a temperature <strong>of</strong>950 °C for a period <strong>of</strong> 1.5 h under the pressure <strong>of</strong> 350 hPa. The second stage entailedbaking at 950 °C for 3 h under the pressure <strong>of</strong> 350 hPa in a N 2 atmosphere. This wasto assure diffusion between the deposited aluminium <strong>and</strong> the steel substrate. In thisprocess, an FeAl diffusion layer was formed. Sections <strong>of</strong> the samples were examinedunder scanning electron microscopes HITACHI 2600 <strong>and</strong> HITACHI 3500 equippedwith a microarea microanalysers EDS from Thermo Noran. Cross sections were polishedto a mirror-like finish using 0.05 μm silicate slurry. All samples were ultrasonicallydegreased in acetone <strong>and</strong> ethanol.
Iron aluminide layers fabricated on 316L steel 165The phase analyses were performed with a Bruker D8 X-ray diffractometer usingCu K α radiation. The samples were examined in a parallel beam from a parabolic mirror(Gobel Mirror Bruker) under the fixed angle ω = 10°. A corrosion resistance testwas conducted using impedance <strong>and</strong> potentiodynamic methods on an AutoLabPGSTAT 100 device in a deoxidised 0.5 M NaCl solution at room temperature.A deoxidised environment was obtained by running chemically pure argon through thesolution. Oxygen concentration was measured using an Elmetron CO 401 oxygenmeter. Impedance tests were performed in a three-electrode system (tested electrode–reference electrode (saturated calomel electrode – SCE)–counter electrode (platinum))within the frequency range <strong>of</strong> 10 5 –10 –3 Hz at the sinusoidal signal amplitude <strong>of</strong>20 mV. The impedance spectra for steel were analyzed using the equivalent circuits(EC). Figure 1a presents the EC for the one time constant model (R(RQ)) <strong>and</strong>Fig. 1b shows the EC for two time constants model R(Q[R(RQ)]).Fig. 1. Equivalent circuits: a) R(RQ), b) R(Q[R(RQ)]); CPE – constant phase element, R s – solutionresistance, R f – resistance <strong>of</strong> the porous layer, R t – charge transfer resistance through a double layerThe spectra were studied with the Baukamp’s EQUIVCRT s<strong>of</strong>tware. The potentiodynamictests were performed in the same three-electrode system within the potentialrange from –400 mV to 500 mV in the anodic direction at the rate <strong>of</strong> 0.2 mV/s.Surface topography tests were conducted using a VEECO scanning pr<strong>of</strong>ilometer. Themicrohardness measurements were carried out using the Vickers method <strong>and</strong>a ZWICK (Materialprüfung 3212002) hardness meter under the load <strong>of</strong> 200 g. Thelayer adhesion test was measured on a Micro-Combi-Tester device, with a variableload in the range from 0 to 100 N.3. ResultsThe CVD method used in the study, employing AlCl 3 as an aluminium donor ina hydrogen carrier gas atmosphere, was good enough to produce a 50 μm layer on the316L steel substrate. These layers <strong>of</strong> a complex substructure consisting <strong>of</strong> elongatedgrains exhibited geometrically perfect adhesion to the substrate (Fig. 2).
166R. SITEK et al.Fig. 2. Microstructure <strong>of</strong> the layer afterthe process at 950 °C on the 316L steel substrateFig. 3. Morphology <strong>of</strong> the surface<strong>of</strong> the layer at 950°CFigure 3 shows that the surface <strong>of</strong> the layer was relatively smooth with an averagesurface roughness parameter R a not exceeding 0.5 μm. Details on the data roughness isprovided in Table 2. R a is R a is the average arithmetic st<strong>and</strong>ard deviation <strong>of</strong> the roughnesspr<strong>of</strong>ile, R q is the average square deviation <strong>of</strong> the roughness pr<strong>of</strong>ile <strong>and</strong> R t is the maximumheight <strong>of</strong> the roughness pr<strong>of</strong>ile peak.Table 2. Roughness parameters [μm] <strong>of</strong> the 316L steelsurface before <strong>and</strong> after the CVD processMaterials R a R q R tBefore treatment 0.095 0.129 4.53After treatment 0.412 0.526 6.18Fig. 4. Spectrum <strong>of</strong> the X-ray diffraction pattern from the layer producedin the CVD process at 950 °C on the 316L steel substructure
Iron aluminide layers fabricated on 316L steel 167The surface microhardness <strong>of</strong> the layers was about 430HV 0.2 . The results <strong>of</strong> X-rayanalysis (Fig. 4), performed in the 20–150° range (2θ ) revealed the presence <strong>of</strong> theAlFe, AlNi <strong>and</strong> Cr 2 N phases.The analysis <strong>of</strong> the chemical composition focusing on microareas <strong>of</strong> the transversesections <strong>of</strong> the layers (Fig. 5, Table 3) showed the presence <strong>of</strong> two sub-layers. Theouter sublayer is enriched in nickel appearing together with iron <strong>and</strong> aluminium. In theinner sublayer, the nickel content decreased while the iron content increased.Fig. 5. SEM image <strong>of</strong> sublayer revealed on thetransverse sections <strong>of</strong> the layers fabricatedon the 316L steel in the CVD process at 950 °C(for details, see Table 3)Table 3. Chemical composition in microareas <strong>of</strong> the transverse section<strong>of</strong> the layer produced on 316L steel in the CVD process at 950 °CMicroarea Chemical composition [wt. %]Fe Cr Ni Mo Al C1 47.61 9.80 23.77 1.70 10.02 6.842 67.51 17.19 6.63 2.30 3.42 2.873 68.99 18.86 5.06 2.17 2.02 2.914 67.01 16.81 8.79 2.07 - 3.215 66.67 16.69 9.32 1.87 - 2.88Fig. 6. Surface distribution <strong>of</strong>elements in the transverse section<strong>of</strong> the layers produced on the 316Lsteel in the CVD process at 950 °C
168R. SITEK et al.The distribution <strong>of</strong> the elements on a transverse section <strong>of</strong> the layer is shown inFig. 6. It reveals that the layer was made mainly <strong>of</strong> aluminium, iron, chromium <strong>and</strong>nickel. The increased concentration <strong>of</strong> aluminium <strong>and</strong> nickel in the outer part <strong>of</strong> thelayer indicates the formation <strong>of</strong> an intermetallic layer containing those two elements.The inner sublayer consists most probably <strong>of</strong> an intermetallic layer made <strong>of</strong> iron, <strong>and</strong>aluminium. However, the presence <strong>of</strong> some Cr 2 N in both sublayers cannot be excluded.The polarization curves for the 316L steel substrate <strong>and</strong> samples with the layer(FeAl) produced upon it are shown in Fig 7. Table 4 presents the characteristic electrochemicalparameters <strong>of</strong> the tested materials; i corr is the corrosion current density,E corr – corrosion potential, <strong>and</strong> E np – nucleated pit.Fig. 7. The anodic polarisation curve in 0.5 M NaCl for NiAl + FeAl typediffusion layer <strong>and</strong> for 316L steel substrateTable 4. Corrosion parameters describing the influence <strong>of</strong> layers fabricatedin the CVD process on the corrosion resistance in comparison with the 316L steelMateriali corr[μA/cm 2 ]E corr[mV]E np[mV SCE ]316L steel without a layer 0.08 –370 120316L steel with a layer<strong>of</strong> the NiAl + FeAl type0.028 –330 –180As results from the data in Table 4 the layers <strong>of</strong> the NiAl + FeAl type increase thecorrosion resistance <strong>of</strong> 316L steel. It is evidenced by a reduction in the density <strong>of</strong> corrosioncurrents with a simultaneous increase in the corrosion potentials. The durability
Iron aluminide layers fabricated on 316L steel 169<strong>of</strong> this state was significant, as proved by both the low current densities in the passivearea (ca. 0.8 μA/cm 2 ) <strong>and</strong> the relatively high breakthrough potentials (E k = 120 mV),with pitting corrosion observed above this potential (Fig. 8a).Fig. 8. Morphology <strong>of</strong> steel after potentiodynamic tests in deoxidised 0.5 M NaCl<strong>of</strong> the 316L steel substrate (a) <strong>and</strong> after the CVD process (b)Fig. 9. Under-layer corrosion after being revealedby the potentiodynamic test in deoxidised 0.5 MNaCl solution in transverse sectionsFig. 10. Impedance spectra (Body’s diagram) for the 316L substrate (a) <strong>and</strong> after the CVD process (b)The FeAl layers had a significant influence on the 316L steel corrosion resistance.Although the data in Table 4 indicates an improvement in the corrosion resistance, thepotentiodynamic tests showed that the durability <strong>of</strong> the passive state is very low.
170R. SITEK et al.A constant increase in densities <strong>of</strong> currents in the passive area was observed witha simultaneous reduction in the breakthrough potential. Moreover, the produced coatingshave a cathodic potential with respect to the substrate which caused the materialto be sensitive to underlayer corrosion (Fig. 9). The non-metallic intrusions observedon the layer surface seem to act as local corrosion initiation spots (Fig. 8b).Table 5. Results <strong>of</strong> impedance measurement tests<strong>of</strong> the 316L substrate before <strong>and</strong> after the CVD processMaterialR[Ωcm 2 ]Q CPE[F/cm 2 ]316L steel without a layer 1.47×10 6 7.04×10 –6 0.88316L steel with layer <strong>of</strong> theNiAl+FeAl type1.58×10 6 6.26×10 –7 0.82Analysis <strong>of</strong> the spectra shown in Fig. 10 indicates a one time constant characteristicfor a single electrochemical process taking place on the surface (i.e., the passage <strong>of</strong>an electron through a double layer). High angle values (ca. 80°) in a broad frequencyrange (10 2 –10 –1 Hz) confirmed the presence <strong>of</strong> the passive layer on the steel substrate.nFig. 11. Results <strong>of</strong> the scratch test <strong>of</strong> the resistance to abrasive wear. Details in the text
Iron aluminide layers fabricated on 316L steel 171The layer characteristics (Table 5) were close to the values obtained for permanentpassive layers. The impedance spectrum shown in Fig. 10b is different. The presence<strong>of</strong> two peaks in the impedance spectrum means that two electrochemical processesoccurred on the surface, one <strong>of</strong> them being related to the passage <strong>of</strong> electrons throughthe double layer <strong>and</strong> the other to the electrochemical processes at the heterogeneousouter layer (zone 1 enriched with Al <strong>and</strong> Ni). According to the impedance spectrum<strong>and</strong> Fig. 4, it might be assumed that this layer was discontinuous (porous). This is themost likely explanation for the unsatisfactory durability <strong>of</strong> passive layers as observedduring the potentiodynamic tests. The data in Table 5 (R is the resistance, Q – capacity)indicate that, despite the significant porosity <strong>of</strong> the outer layer, the Fe-Al coating wascharacterised by a similar corrosion resistance (slightly better) in comparison with thesubstrate.Results <strong>of</strong> the adhesion tests (scratch-test) are presented in Fig. 11. The tested layersdemonstrated a very good adhesion to the substrate <strong>and</strong> plasticity. The first cracks<strong>of</strong> the layer were observed under a critical force <strong>of</strong> Lc 1 = 24.1 N at the distance <strong>of</strong>2.23 mm (Fig. 11a). Spalling (non-continuous perforation) was observed under a criticalforce <strong>of</strong> Lc 2 =38.8 N at the distance <strong>of</strong> 7.63 mm (Fig. 11b). Continuous perforation<strong>and</strong> layer removal were observed under a critical force <strong>of</strong> Lc 3 = 73.57 N at the distance<strong>of</strong> 7.63 mm (Fig. 11c).4. SummaryThe CVD treatment with AlCl 3 vapour <strong>and</strong> hydrogen as carrier gas at 950 °C issatisfactory to produce ca. 50 μm thick layers <strong>of</strong> the NiAl + FeAl type 316L substratein one-step. The layers are characterised by a very good adhesion to the substructure,<strong>and</strong> can be deposited on surfaces having complicated geometries. The NiAl + FeAllayer has a cathodic character in relation to the substrate. It improves the corrosionresistance <strong>of</strong> steel 316L but makes it more sensitive to the sublayer corrosion.References[1] Engineering Materials for Biomedical Applications, Teoh Swee Hin (Ed.), World Scientific, Singapore,2004.[2] BORDJI K., JOUZEAU J.Y., MAINARD D., PAYAN E., DELEGOUTTE J.P, NETTER P., Biomater., 17 (1996),491.[3] SUDHAKAR K.V., Eng. Fail. Anal., 12 (2005), 249.[4] LIU C., LIN G., QI D.Y.M., Surf. Coat. Techn., 200 (2006), 4011.[5] GERINGER J., FOREST B., COMBRADE P., Wear, 259 (2005), 943.[6] ABDULUYAHED A.-A., ROŻNIATOWSKI K., KURZYDŁOWSKI K.J., Scripta Metal., 33 (1995), 1489.[7] FOSSATI A., BORGIOLI F., GALVANETTO E., BACCI T., Surf. Coat. Technol., 200 (2006), 3511.[8] LI G.-J., PENG Q., LI C., WANG Y., GAO J., CHEN S.-Y., WANG J., SHEN B.-L., Surf. Coat. Technol.,202 (2008), 2749.[9] MINGOLO N., TSCHIPTSCHIN A.P., PINEDO C.E., Surf. Coat. Technol., 201 (2006), 4215.
54 0WL1WL BL1 bit1 bit3bit52WL323 BL2BL2 bit2 bit40bit6WLspace65nmWLspace20nm1 0MTwinFlashcel easurement65nm0ΔVt N(bits1<strong>and</strong>24 5)(V) 68t(bt3)( )xx(b )Received172R. SITEK et al.[10] ZHAO C., WANG L.Y., HAN L., Surf. Eng., 24 (3) (2008), 188.[11] Metallic Materials Containing Intermetallic Phases, W. Przetakiewicz, Z. Bojar (Eds.), Studio Bel,Warsaw, 2006 (in Polish).[12] ZHANG Y., PINT B.A., COOLEY K.M., HAYNES J.A., Surf. Coat. Technol., 202 (2008), 3839.[13] KAMACHI MUDALI U., BHUVANESWARAN N., SHANKAR P., RAJ B., Corr. Sci., 46 (2004), 2867.10 March 2009
Materials Science-Pol<strong>and</strong>, Vol. 28, No. 1, 2010Optical properties <strong>of</strong> ternary tellurite glassesM.K. HALIMAH * , W.M. DAUD, H.A.A. SIDEK, A.W. ZAIDAN, A.S. ZAINALUltrasonic Laboratory, Department <strong>of</strong> Physics, Faculty <strong>of</strong> Science,University Putra Malaysia, 43400 Serdang, Selangor, MalaysiaTest samples <strong>of</strong> ternary glass tellurite [(TeO 2 ) 65 (B 2 O 3 ) 35 ] y [Ag 2 O] y with y = 10, 15, 20, 25, 30 mol %have been fabricated <strong>and</strong> their physical <strong>and</strong> optical properties were investigated. The optical absorptionwas recorded at room temperature in the wavelength range from 200 to 800 nm. From the absorption edgedata, the value <strong>of</strong> the optical b<strong>and</strong> gap E opt <strong>and</strong> the Urbach energy ∆E were evaluated. The value <strong>of</strong> E optlies between 2.15 eV <strong>and</strong> 1.85 eV for the indirect transition <strong>and</strong> for direct transition the values vary from2.77 eV to 2.35 eV. From the experimental results, values <strong>of</strong> the optical b<strong>and</strong> gap <strong>and</strong> Urbach energywere calculated. They were found to be dependent on the glass composition.Keywords: tellurite glasses; optical b<strong>and</strong> gap; Urbach energy; density1. IntroductionGlasses have some unique properties such as high hardness <strong>and</strong> transparency atroom temperature, along with sufficient strength <strong>and</strong> excellent corrosion resistance.Due to potential applications in various engineering <strong>and</strong> technological fields, the study<strong>of</strong> the properties <strong>of</strong> glasses is <strong>of</strong> great significance. Glassy materials have acknowledgedadvantages, like physical isotropy, the absence <strong>of</strong> grain boundaries, continuouslyvariable composition they are practical to use [1].Tellurite glasses are very promising materials for laser <strong>and</strong> non-linear applicationsin optics, due to some <strong>of</strong> their important characteristic features, such as high refractiveindex, low phonon maxima <strong>and</strong> low melting point [2]. TeO 2 is known as a conditionalglass former; it needs a modifier ion to form the glassy state easily. The formation <strong>of</strong>glass on two glass formers such as borate glass <strong>and</strong> tellurite glass is <strong>of</strong> both scientific<strong>and</strong> practical interest. This may lead to the formation <strong>of</strong> new structural units [3]. Thebasic structural unit <strong>of</strong> tellurite glass is TeO 4 trigonal bipyramid (tbp) containinga lone pair <strong>of</strong> electrons <strong>and</strong> the structural units take the Te–O–Te bond for glass formation.The introduction <strong>of</strong> TeO 2 into the matrix <strong>of</strong> alkali borate glasses decreases its_________* Corresponding author, e-mail: halimah@science.upm.edu.my
174M.K. HALIMAH et al.hygroscopicity, improves the quality <strong>of</strong> the glass (less brittle <strong>and</strong> free from bubbles)<strong>and</strong> enhances the IR transmission [4, 5]. Silver dioxide, Ag 2 O in the borotellurite networkmodifies the host structure through the transformation <strong>of</strong> the structural units <strong>of</strong>the borate network from [BO 3 ] to [BO 4 ] <strong>and</strong> tellurite network from trigonal bipyramid[TeO 4 ] to trigonal pyramid [TeO 3 ][6].The objective <strong>of</strong> the present work was to study the optical b<strong>and</strong> gap <strong>of</strong> the silverborotellurite glass system. A systematic study has been performed on the variation <strong>of</strong>the optical b<strong>and</strong> gap in function <strong>of</strong> the Ag 2 O composition in borotellurite glasses.Densities were also determined, in order to investigate the correlation between density<strong>and</strong> molar volume in function <strong>of</strong> Ag 2 O content in the silver borotellurite glass.2. ExperimentalThe ternary [(TeO 2 ) 65 (B 2 O 3 ) 35 ] 1–y (Ag 2 O) y glasses were prepared by mixing togethertellurium dioxide (Aldrich 99.5%), boron oxide B 2 O 3 (Alfa Aesar, 97.5%) <strong>and</strong>silver dioxide Ag 2 O (Aldrich 99%), in a closed alumina crucible, y being 10, 15, 20,25 <strong>and</strong> 30 mol %. Appropriate amounts <strong>of</strong> powder chemicals were weighed <strong>and</strong> placedin a crucible. The crucible was covered with a lid <strong>and</strong> then put inside an electric furnaceset at 400 °C. The mixture was maintained at 400 °C for 30 min, the crucible wasthen transferred to another furnace for 60 min at 800 °C. The crucible was constantlystirred in order to obtain a homogeneous melt. The melt was then poured intoa stainless steel, cylindrically shaped split mould which had been preheated, <strong>and</strong> thenthe sample was annealed at 350 °C. The samples were cut into pieces having appropriatedimensions for optical absorption <strong>and</strong> density measurements.Optical absorption measurements in the wavelength range <strong>of</strong> 200–800 nm wereperformed at room temperature using a Camspec M350 double beam UV-visible spectrophotometer.The optical absorption coefficient α (λ) was calculated from the absorbanceA, using the following equationα( λ ) = 2.303 A (1)dwhere d is the sample thickness. Density measurements were made at room temperaturebased on Archimedes' Principle, involving weighing in air <strong>and</strong> in acetone as thebuoyancy liquid. The samples were ground into powder for X-ray diffraction measurements,using an X’pert Pro Panalytical mill.3. Results <strong>and</strong> discussionThe X-ray diffraction patterns <strong>of</strong> the studied glass system revealed the absence <strong>of</strong> anydiscrete or sharp crystalline peaks, indicating that the samples are amorphous (Fig. 1).
Optical properties <strong>of</strong> ternary tellurite glasses 175Fig. 1. XRD spectrum <strong>of</strong> [(TeO 2 ) 65 (B 2 O 3 ) 35 ] 1–y [Ag 2 O] y glassesFig. 2. Optical absorbance spectra <strong>of</strong> [(TeO 2 ) 65 (B 2 O 3 ) 35 ] 1–y[Ag2 O] y glassesThe optical absorption spectra <strong>of</strong> Ag 2 O–TeO 2 –B 2 O 3 are shown in Fig. 2. They donot display any sharp absorption edges, which is characteristic <strong>of</strong> the glassy state. Asthe X-ray diffraction spectra, they also show no distinguishable peaks or sharp linesbut the pattern does exhibit a broad hump, which shows that the samples are essentiallyamorphous rather than crystalline (Fig. 1). It is also observed in Figure 2 that thefundamental absorption edge shifts to higher wavelengths as the concentration <strong>of</strong>Ag 2 O increases. This may be due to the lower rigidity <strong>of</strong> the glass resulting fromhigher Ag 2 O content. The data in Figs. 3 <strong>and</strong> 4 were obtained from the equation:constα ω =( )( ω− Eopt)ωn(2)where E opt is the energy <strong>of</strong> the optical b<strong>and</strong> gap <strong>and</strong> ħω is the photon energy. The values<strong>of</strong> n are 1/2 <strong>and</strong> 2 for the direct <strong>and</strong> indirect transitions, respectively. Both these
176M.K. HALIMAH et al.b<strong>and</strong> gaps obtained from the above dependences are interb<strong>and</strong> transitions, but the latterinvolves the phonon interaction. In order to check whether optical data on the presentglasses fit better to the direct or indirect b<strong>and</strong> gap formula; dependences (αħω) 2on ħω as well as (αħω) 1/2 on ħω have been plotted in the absorption region for whichthe absorption α(ω) ≥ 10 4 cm –1 as shown in Figs. 3 <strong>and</strong> 4.Fig. 3. Plot <strong>of</strong> (α hω) 2 against photon energy for direct b<strong>and</strong> gapmeasurement in [(TeO 2 ) 65 (B 2 O 3 ) 35 ] 1–y [Ag 2 O] y glassesFig. 4. Plot <strong>of</strong> (α hω) 1/2 against photon energy for indirect b<strong>and</strong> gapmeasurement in [(TeO 2 ) 65 (B 2 O 3 ) 35 ] 1–y[Ag2 O] y glassesThe direct <strong>and</strong> the indirect energy b<strong>and</strong> gaps are determined from the linear regions<strong>of</strong> the data plots, as shown in the figures, <strong>and</strong> the corresponding values are pre-
Optical properties <strong>of</strong> ternary tellurite glasses 177sented in Table 1. The values for the optical b<strong>and</strong> gaps lie between 1.85 eV <strong>and</strong>2.37eV for n = 2, whereas for n = 1/2 they lie between 2.35 eV <strong>and</strong> 2.82 eV.Table 1. Results <strong>of</strong> optical measurementsin [(TeO 2 ) 65 (B 2 O 3 ) –35 ] 1–y[Ag2 O] y glassesy[mol %]x = 65DirecttransitionE [eV]1optIndirecttransitionE [eV]2optUrbachenergyΔE [eV]10 2.77 2.15 0.3715 2.62 2.06 0.4320 2.64 2.07 0.4025 2.55 2.06 0.4530 2.35 1.85 0.48The optical b<strong>and</strong> gaps for direct <strong>and</strong> indirect transitions for this ternary telluritesystem both decrease as the Ag 2 O content increases, as shown in Fig. 5.Fig. 5. Dependences <strong>of</strong> optical b<strong>and</strong> gap on molar percentage <strong>of</strong> Ag 2 Ofor direct <strong>and</strong> indirect transitions in [(TeO 2 ) 65 (B 2 O 3 ) 35 ] 1–y[Ag2 O] y glassesThis behaviour may be associated with the structural changes occurring after addition<strong>of</strong> Ag 2 O. In binary tellurite, non bridging oxygen atoms are already present, <strong>and</strong> with theaddition <strong>of</strong> Ag 2 O as a modifier, their concentration increases. The glass structure becomesless ordered; addition <strong>of</strong> Ag 2 O causes breaking <strong>of</strong> the regular structure <strong>of</strong> borate <strong>and</strong> tellurite,leading to a decrease <strong>of</strong> the b<strong>and</strong> gap [7]. The values <strong>of</strong> the obtained b<strong>and</strong> gaps <strong>of</strong>tellurite glasses are quite close to the values reported in the literature [8, 9]. This decreaseis due to an increase <strong>of</strong> the disorder <strong>and</strong> consequently the more extension <strong>of</strong> the localizedstates within the gap according to Mott <strong>and</strong> Davies [10].
178M.K. HALIMAH et al.From Table 1 <strong>and</strong> Figure 5, it is observed that the values <strong>of</strong> the direct b<strong>and</strong> gap arelarger than the corresponding values <strong>of</strong> the indirect b<strong>and</strong> gap. For this ternary telluriteglass system, there are two optical transitions in k space. Assuming that the lowestminimum <strong>of</strong> the conduction b<strong>and</strong> <strong>and</strong> the highest maximum <strong>of</strong> the valence b<strong>and</strong> lie indifferent regions <strong>of</strong> the k space, direct allowed transitions may occur, as shown inFig. 6, <strong>and</strong> the observed indirect transition may be associated with transitions from thetop <strong>of</strong> the valence b<strong>and</strong> to the bottom <strong>of</strong> the conduction b<strong>and</strong> [11].Fig. 6. Suggested energy b<strong>and</strong> diagram (electron energy Eagainst wave vector k in [(TeO 2 ) 65 (B 2 O 3 ) 35 ] 1–y[Ag2 O] y glassesThe fundamental absorption edge usually follows the Urbach rule [3]⎛ω⎞α( ω) = Bexp⎜ ⎟(3)⎝ Δ E ⎠where B is a constant, ∆E is a measure <strong>of</strong> the b<strong>and</strong> tailing <strong>and</strong> is known as the Urbachenergy. The values <strong>of</strong> the Urbach energy ∆E were calculated by taking the reciprocals<strong>of</strong> the slopes <strong>of</strong> the linear portion <strong>of</strong> the lnα(ω) versus ħω curves in the lower photonenergy regions. These values are given in Table 1.The values <strong>of</strong> the Urbach energy increase as the quantity <strong>of</strong> Ag 2 O increases(Fig. 7). An increase in the Urbach energy can be considered being due to a highernumber <strong>of</strong> defects [12]. Hence, the increase in the Urbach energy with Ag 2 O contentconfirms that the number <strong>of</strong> defects also increases. Mott <strong>and</strong> Davies [10] reported thatthe values <strong>of</strong> ∆E for a range <strong>of</strong> amorphous semiconductors are very close <strong>and</strong> therange <strong>of</strong> their values is between 0.046 eV <strong>and</strong> 0.066 eV. The ∆E value <strong>of</strong> Na 2 O–TeO 2glasses is reported by Prakash et al. [2] to lie between 0.09 eV <strong>and</strong> 0.26 eV, <strong>and</strong> in thecase <strong>of</strong> V 2 O 5 –P 2 O 5 –TeO 2 glasses, Hogarth [8] reported that the value <strong>of</strong> ∆E variesbetween 0.31 eV to 0.41 eV. In the present work, the exponential behaviour is ob-
Optical properties <strong>of</strong> ternary tellurite glasses 179served <strong>and</strong> the value <strong>of</strong> ∆E varies between 0.37 eV <strong>and</strong> 0.48 eV. The obtained opticalb<strong>and</strong> gap energies are <strong>of</strong> the order reported in the literature, <strong>and</strong> the Urbach energyvalues are in the same range as that reported for tellurite glasses [13].Fig.7. Dependence <strong>of</strong> Urbach energy on molar percentage<strong>of</strong> Ag 2 O in [(TeO 2 ) 65 (B 2 O 3 ) 35 ] 1–y[Ag2 O] y glassesFig. 8. Density <strong>and</strong> molar volume <strong>of</strong> [(TeO 2 ) 65 (B 2 O 3 ) 35 ] 1–y [Ag 2 O] y glassesThe dependences <strong>of</strong> density <strong>and</strong> molar volume <strong>of</strong> [(TeO 2 ) 65 (B 2 O 3 ) 35 ] 1–y [Ag 2 O] yglasses on Ag 2 O content are shown in Fig. 8. They both increase as the molar percentage<strong>of</strong> Ag 2 O increases. The atomic weight <strong>of</strong> TeO 2 –B 2 O 3 is 229.2 g <strong>and</strong> the atomicweight <strong>of</strong> Ag 2 O is 231.7 g, the replacement <strong>of</strong> the borotellurite atom with the silveratom is explained by the increase in the density resulting from the increase in the content<strong>of</strong> Ag 2 O. Generally, the density <strong>and</strong> the molar volume show opposite behaviours,but in this work it is not the case. This anomalous behaviour was shown in a study byRajendran et al. [3] <strong>and</strong> Saddeek <strong>and</strong> Abdul El-Latif [14]. The increase in the molarvolume, resulting from the presence <strong>of</strong> non-bridging oxygen atoms (NBO) causesbond breaking, <strong>and</strong> thereby leads to an increase in the number <strong>of</strong> spaces in the network[14]. The observed increase in the molar volume may be due to an increase in
45 0WL1WL BL1 bit1 bit3bit52WL323 0BL2BL2 bit2 bit4bit6WLspace65nmWLspace20nm1 0MTwinFlashcel easurement65nm0ΔVt N(bits1<strong>and</strong>24 5)(V) 68t(bt3)( )xx(b )Received180M.K. HALIMAH et al.the bond length or an increase in the interatomic spacing between the atoms. The values<strong>of</strong> the molar volume <strong>of</strong> the ternary tellurite glass system lie in the same range asthose reported by El-Mallawany [15] for the tellurite glasses.4. ConclusionsThe ternary tellurite glass system [(TeO 2 ) 65 (B 2 O 3 ) 35 ] 1–y (Ag 2 O) y was fabricated. Theoptical b<strong>and</strong> gap values have been determined <strong>and</strong> from the theoretical fitting <strong>of</strong> theexperimental absorption coefficient for all samples, it is concluded that both direct <strong>and</strong>indirect transitions occur. For both transition types, the values <strong>of</strong> the optical b<strong>and</strong> gap,are found to decrease as the amount <strong>of</strong> Ag 2 O increases. The Urbach energy is found tobe between 0.37 eV <strong>and</strong> 0.48 eV. Urbach edge behaviour is observed in these glasses,<strong>and</strong> the slope <strong>of</strong> the edge was found to increase as the amount <strong>of</strong> Ag 2 O increases. Thedensity depends on the composition: the greater the compactness <strong>of</strong> the structure, thehigher the density.AcknowledgementThe financial support <strong>of</strong> the Ministry <strong>of</strong> Science, Technology <strong>and</strong> Innovation, Malaysia under FRGSgrant No. 5523645 is gratefully acknowledged.References[1] JOSEPH C.M., BINU P.R., SHREEKRISNAKUMAR R., MENON C.S., Mat. Lett., 50 (2001), 251.[2] VIJAYA PRAKASH G., NARAYANA RAO D., BHATNAGAR A.K., Solid State Commun., 119 (2001), 39.[3] RAJENDRAN V., PALANIVELU N., CHAUDHURI B.K., GOSWANI K., J. Non-Cryst. Solids 320 (2003), 195.[4] EL-MALLAWANY R., Tellurite Glasses H<strong>and</strong>book. Physical Properties <strong>and</strong> Data, CRC Press, Boca Raton,2002.[5] SADDEEK Y.B., Phys. B, 344 (2004), 163.[6] CHOWDARI B.V.R., PRAMODA KUMARI P., Solid State Ionics, 86–85 (1996), 521.[7] SINDHU S., SANGHI S., ARGAWAL A., SONAM S.V.P., KISHORE N., Physica B, 365 (2005), 65.[8] HOGARTH C.A., HOSSEINI A.A., J. Mater. Sci., 18 (1983), 2697.[9] SHALTOUT I., YI TANG, BRAUNSTEIN R., SHAISHA E.E., J. Phys. Chem. Solids, 57 (1996), 1223.[10] MOTT N.F AND DAVIS E.A., Electronic Processes in Non-Crystalline Materials, Oxford UniversityPress, London, 1971, pp. 293.[11] AL-ANI S.K.J., AL-HASSANY I.H.O., AL-DAAN Z.T., J. Mater. Sci., 20 (1995), 661.[12] SREEKANTH CHAKRADAR R.P., SIVARAMAIAH G., LAKSHMANA R., GOPAL N.O., Spectrochim. Acta,Part A, 62 (2005), 761.[13] EL-MALLAWANY R., J. Alloys. Compd., 394 (2005), 292.[14] SADDEEK Y.B., ABD EL-LATIF L., Phys. B, 348 (2004), 475.[15] EL-MALLAWANY R., Mater. Chem. Phys., 53 (1998), 93.10 April 2009Revised 11 August 2009
Materials Science-Pol<strong>and</strong>, Vol. 28, No. 1, 2010Fabrication <strong>and</strong> performance<strong>of</strong> carbon coated copper nanoparticlesL.-P. LI, H.-Y. ZHANG * , J.-S. PANG, J. LINFaculty <strong>of</strong> Material <strong>and</strong> Energy, Guangdong University <strong>of</strong> Technology,Guangzhou, 510006, P.R. ChinaCarbon coated copper nanoparticles were synthesized by the carbon arc discharge method using apowder mixture containing copper <strong>and</strong> carbon at the ratio different than in the raw material. The structure,topography, size distribution, phase composition <strong>and</strong> anti-oxidation property <strong>of</strong> the nanoparticles werecharacterized by X-ray diffraction, transmission electron microscopy, thermogravimetry <strong>and</strong> differentialscanning calorimetry experiments. The results indicated that carbon coated copper nanoparticles had aclear core-shell structure, the core <strong>of</strong> the particles being copper single crystal, <strong>and</strong> the shell <strong>of</strong> the particles– a carbon layer with a graphite-like structure. Carbon coated copper nanoparticles had diameters <strong>of</strong> ca.20–60 nm. As the copper content increased, the inner copper core became more crystallized. Copperpromoted catalysis to the external carbon layers, the graphitization degree became more obvious as thecontent <strong>of</strong> copper increased. The outer graphitic carbon layers effectively prevented oxidation <strong>of</strong> thecopper core inside. The oxidation resistance <strong>of</strong> carbon coated copper nanoparticles was superior to that <strong>of</strong>pure copper powder.Keywords: carbon coated; copper nanoparticles; carbon arc discharge; oxidation resistance1. IntroductionCompared with conventional materials, copper nanoparticles have some unusualproperties, such as small dimensions, large specific surface area <strong>and</strong> low electric resistance.They display quantum size effect, macroscopic quantum tunnel effect. Therefore,copper nanoparticles have been the subject <strong>of</strong> much attention in recent years, dueto their potential applications in several fields. Copper nanoparticles with low resistivitycan be used for electronic connectivity, <strong>and</strong> this has aroused great interest in thefield <strong>of</strong> electronics [1]. They are suitable for fabricating conductive paste, which canbe applied to coating, electronic packaging in microelectronic industry [2]. Coppernanoparticles can be used as catalysts in metallurgical, petroleum <strong>and</strong> chemical indus-_________* Corresponding author, e-mail: hyzhang@gdut.edu.cn
182L.-P. LI et al.tries due to extremely high activity <strong>and</strong> selectivity in catalysis <strong>and</strong> hydrogenation <strong>of</strong>macromolecular polymers [3]. At the same time, owing to their low melting point,isotropy, weak shear strength <strong>and</strong> applicability over a wide temperature range, coppernanoparticles have been used as additives in lubricating oils, resulting in a very highquality <strong>of</strong> products [4–9]. Copper nanoparticles have anti-wear <strong>and</strong> anti-friction properties,are resistant to extreme pressure, are environment-friendly <strong>and</strong> also have selfrepairingproperties. Consequently they have become an indispensable <strong>and</strong> important,basic material for inorganic composites [10, 11].Copper nanoparticles have a high activation state which is attributable to theirspecial volume <strong>and</strong> surface properties. They are sensitive to various environmentalfactors such as instance, temperature <strong>and</strong> humidity, promoting strong interactions withsubstances exposed to air, thereby rendering the surfaces <strong>of</strong> copper nanoparticles vulnerableto oxidation. The chemical stability <strong>of</strong> nanoparticles decreases <strong>and</strong> their activityceases, which makes copper nanoparticles inconvenient to store <strong>and</strong> use.Carbon coating <strong>of</strong> metal nanoparticles can protect them from physicochemicalchanges. The technology can prevent metal particles from hydrolysis <strong>and</strong> oxidation.Carbon layers can improve the surface activity <strong>and</strong> electrical properties <strong>of</strong> the innercopper particles <strong>and</strong> effectively prevent their growth <strong>and</strong> agglomeration. Metal particlescan be confined to a small place by the carbon shells, thereby preventing themetal particles from being oxidized. This solves the problem <strong>of</strong> how to make metalnanoparticles exist stably in air [12]. Carbon coated nanomaterials protection technologygreatly extends the application range <strong>of</strong> metal nanomaterials in many fields suchas chemistry, physics <strong>and</strong> materials science [13]. Many methods <strong>of</strong> fabrication <strong>of</strong> carboncoated metal nanoparticles have been reported, including arc discharging [14–17],ion beam method [18] <strong>and</strong> chemical vapour deposition [19, 20].In the paper, we report on the preparation <strong>of</strong> carbon coated copper nanoparticlesusing dc carbon arc discharge under an argon atmosphere. The synthesized product is<strong>of</strong> high purity <strong>and</strong> has a small particle size the preparation route being rather simple.2. ExperimentalMicron size graphite powder (C, 98.0%) <strong>and</strong> micron copper powder (Cu, 99.8%)were used as staring materials. The powders in the weight ratio <strong>of</strong> graphite to copper4:1 <strong>and</strong> 2:3 were mixed <strong>and</strong> pressed into a cylindrical sample <strong>of</strong> the diameter 24 mm,20 mm high, which was placed at the bottom electrode <strong>of</strong> the reactor. The nanoparticlemanufacturing apparatus consisted <strong>of</strong> the following parts: a stainless steel vacuumchamber cooled by circulating water; a water cooled copper anode on which the cylindricalmetal to be evaporated is placed; a water cooled <strong>and</strong> moveable graphite cathode;a cold surface collector; a gas flow system; a two stage vacuum pump system; <strong>and</strong> aDC power supply. Before preparation, the chamber was vacuumed to 2–3 Pa by mechanicalvacuum pump, pumped in argon to 1000 Pa <strong>and</strong> stopped, continued to vacuumto 2–3 Pa <strong>of</strong> the reactor, <strong>and</strong> then pumped in high purity argon. When the pressure
Fabrication <strong>and</strong> performance <strong>of</strong> carbon coated copper nanoparticles 183was 50 000 Pa, the distance <strong>of</strong> two electrodes for dc arc discharge was adjusted to 1–2mm. When discharge current was 120 A, <strong>and</strong> discharge voltage was 22 V, the electrodebegan to discharge. The reaction caused ionization <strong>and</strong> a plasma fume was formed in thereaction chamber, which was deposited in the container wall <strong>and</strong> formed nanoparticles.After the reaction had finished, the product deposited on the container wall was collected,filtrated in toluene, <strong>and</strong> carbon coated copper nanoparticles were thus obtained.Transmission electron microscopy (TEM; JEM-2000EX) <strong>and</strong> high-resolutiontransmission electron microscopy (HRTEM; JEM-2000EX) were applied to determinethe morphologies <strong>and</strong> sizes <strong>of</strong> carbon coated copper particles. An X-ray diffractometerwith CuK α radiation under the applied power <strong>of</strong> 50 kV×30 mA was employed to detectphases <strong>and</strong> the crystal structure <strong>of</strong> the particles. The thermal effect <strong>and</strong> weightchange analysis <strong>of</strong> the reaction were confirmed by differential thermal analysis (DTA)in the temperature range <strong>of</strong> 25–600 °C with the heating rate <strong>of</strong> 20 °C·min –1 was applied,under a nitrogen atmosphere.3. Results <strong>and</strong> discussion3.1. XRD analysisFigure 1 shows X-ray diffraction pr<strong>of</strong>iles <strong>of</strong> carbon coated copper nanoparticles.Three sharp peaks at 2θ <strong>of</strong> 43.3°, 50.6° <strong>and</strong> 74.3° can be seen in the figure. The correspondingd value was 0.2087 nm, 0.1808 nm, 0.1278 nm, respectively. We consulted thePDF card (the PDF card number 04-0836), which corresponded to the (111), (200) <strong>and</strong>(220) plane <strong>of</strong> the face centred Cu, respectively. The carbon coated copper nanoparticleswere found to match the diffraction peak characteristics <strong>of</strong> copper, whereas no peaks assignedto carbon were detected, suggesting that the carbon shell was amorphous.Fig. 1. X-ray diffraction patternsfor carbon coated nanoparticles fabricatedby using two different ratios <strong>of</strong> carbonto copper starting material: a) 4:1, b) 2:3It is obvious from Fig. 1 that the increase in the copper content in the samples resultedin the marked increase in intensity <strong>of</strong> the copper diffraction peak. This indicated
184L.-P. LI et al.that with an increase in the concentrations <strong>of</strong> copper nanoparticles, copper becamemore crystallized. At the same time, it can be seen that the carbon coated coppernanoparticles at 2θ <strong>of</strong> 36° are represented by a diffuse scattering peak in curve a, whileat 2θ <strong>of</strong> 27° <strong>and</strong> 36° they are represented by a clear diffraction peak, for which thecorresponding d values were 0.3364 nm <strong>and</strong> 0.2470 nm (the PDF card number46-0945), which showed that the carbon <strong>of</strong> the former sample existed in amorphousform, while the surface <strong>of</strong> the latter sample <strong>of</strong> carbon coated copper nanoparticleschanged to graphite state (a diffraction peak <strong>of</strong> graphite was present).Obviously, carbon graphitization can be promoted by increasing the copper content,but XRD analysis <strong>of</strong> the powder did not reveal the presence <strong>of</strong> carbide or <strong>of</strong> copperoxide. During the preparation process, at first argon was ionized to form argonplasma <strong>and</strong> caused the release <strong>of</strong> electrons. The released electrons defined an electricfield which caused the acceleration <strong>of</strong> Ar + ions from the anode, thereby producinga stream <strong>of</strong> high-speed ions. The ions bombarded the bottom electrode, so that theirkinetic energy was converted to a thermal energy; the temperature <strong>of</strong> the reactionreached several thous<strong>and</strong> degrees, which enabled rapid gasification <strong>of</strong> copper <strong>and</strong>carbon atoms. The copper atoms agglomerated quickly, became radicals in containerwall <strong>and</strong> left the discharge region. Since the diffusion rate <strong>of</strong> the copper atoms waslarger than that <strong>of</strong> carbon, despite the role <strong>of</strong> surface tension, the copper atoms couldspherodize <strong>and</strong> become spherical particles. At the same time, carbon atoms adhered tothe molten Cu nanoparticles <strong>and</strong> eventually formed core-shell nanoparticles <strong>and</strong> weredeposited on the container wall. As the copper content <strong>of</strong> the sample was increased,the quantity <strong>of</strong> copper atoms evaporating from the samples also increased, which ledto an increase in the nanoparticle sizes. Therefore, the samples <strong>of</strong> higher Cu contentexhibited stronger diffraction peaks <strong>of</strong> copper than those samples having a lower coppercontent.3.2. TEM analysisTypical TEM images for the obtained carbon-coated copper nanoparticles areshown in Fig. 2. The nanoparticles were spherical in shape (Fig. 2a), well dispersed,with the diameter <strong>of</strong> 50 nm. Particle surfaces were relatively smooth with no apparenttraces <strong>of</strong> agglomeration.According to HRTEM observation (Fig. 2b), we also found that these nanoparticlespossessed a distinct core/shell structure. It was found that the carbon layers incarbon coated copper nanoparticles were 3–5 nm thick. The interlayer spacing <strong>of</strong> thesegraphitic planes was about 0.34 nm, therefore we can see that the shell <strong>of</strong> eachnanoparticle possessed an ordered graphite structure.The selected area electron diffraction (SAED) patterns <strong>of</strong> A <strong>and</strong> B areas fromFig. 2a are shown in Figs. 2c <strong>and</strong> 2d, respectively. According to the calculation <strong>of</strong>electron diffraction spots in Fig. 2c, it was revealed that the crystal plane spacing <strong>of</strong>the inner core region was 0.21 nm, which corresponded to the crystal plane distance <strong>of</strong>
Fabrication <strong>and</strong> performance <strong>of</strong> carbon coated copper nanoparticles 185the main diffraction peak <strong>of</strong> copper; the crystal plane is (111). It was proved to be theelectron diffraction pattern <strong>of</strong> the face centred cubic single crystal copper. It is shownin Fig. 2d that the TEM diffraction pattern <strong>of</strong> B is an amorphous diffuse scatteringring. From the above analysis, we can see that the outer carbon layers were amorphous,which was consistent with the XRD spectrum.Fig. 2. TEM (a) <strong>and</strong> HRTEM (b) images <strong>of</strong> carbon coated coppernanoparticles as well SAED patterns <strong>of</strong> areas A (c) <strong>and</strong> B (d) in Fig. 2a3.3. TGA-DSC analysisThe oxidation resistance <strong>of</strong> carbon coated copper nanoparticles was determined bythermogravimetric analysis (TGA) <strong>and</strong> differential scanning calorimetry (DSC). Figure3a shows the TGA curves <strong>of</strong> the carbon coated copper nanoparticles. Between35 °C <strong>and</strong> 293.9 °C, the mass <strong>of</strong> the sample slightly increased (ca. 1%) because at this
186L.-P. LI et al.temperature the reaction <strong>of</strong> carbon with air occurred at a lower rate. This weight increasewas attributed to the oxidation <strong>of</strong> the trace copper on the particle surface. From293.9°C to 420.1° C, the outer amorphous carbon layer began to oxidize, which manifestedin an exothermic peak at 321.5 °C with a radical weight loss. At 420.1 °C, theweight loss rate reached the maximum (weight loss rate <strong>of</strong> 1.5%). Upon increasing thetemperature above 420.1 °C, due to the decrease <strong>of</strong> the outer carbon layer, a part <strong>of</strong> thecopper nanoparticles exposed to air was oxidized, <strong>and</strong> thus the carbon coated coppernanoparticles had an obvious weight gain. From room temperature to 600 °C, thewhole reaction caused a weight gain <strong>of</strong> 1.8 wt %.Fig. 3. TGA-DSC curves <strong>of</strong> carbon coated copper nanoparticles (a) <strong>and</strong> copper nanoparticles (b)Figure 3b shows the TGA curves <strong>of</strong> copper nanoparticles. It was shown that thecopper nanoparticles had an apparent weight gain at temperatures above 200 °C, therewas an obvious exothermic peak associated with weight gain, which was observed at310 °C. During the whole process, copper nanoparticles experienced a weight gain <strong>of</strong>12%. The initial temperature <strong>of</strong> oxidation <strong>of</strong> carbon coated copper nanoparticles wassuperior to that <strong>of</strong> the copper nanoparticles.From the above comparative analysis <strong>of</strong> both charts we can see that carbon coatedcopper nanoparticles have better oxidation resistance than that <strong>of</strong> copper nanoparticles.Copper nanoparticles experience very obvious weight gain, which revealed thatthey easily reacted with oxygen, while the weight gain <strong>of</strong> carbon coated coppernanoparticles was not obvious in the whole process, which demonstrates that carboncoatedcopper nanoparticles have superior oxidation resistance. The carbon shell <strong>of</strong>graphite provides good protection for the copper particles in the core.4. ConclusionsCarbon coated copper nanoparticles with the diameter <strong>of</strong> ca. 20–60 nm have beensuccessfully fabricated by the carbon arc discharge method. The core shell nanoparticleshad a graphitic carbon shell <strong>and</strong> face centred cubic copper core. The interlayer
45 0WL1WL BL1 bit1 bit3bit52WL323 0BL2BL2 bit2 bit4bit6WLspace65nmWLspace20nm1 0MTwinFlashcel easurement65nm0ΔVt N(bits1<strong>and</strong>24 5)(V) 68t(bt3)( )xx(b )ReceivedFabrication <strong>and</strong> performance <strong>of</strong> carbon coated copper nanoparticles 187spacing <strong>of</strong> the graphitic planes was about 0.34 nm. Copper catalyses graphitization <strong>of</strong>the external carbon layer, the higher the copper content, the more obvious the degree<strong>of</strong> graphitization is. The DSC experiments showed that the produced material exhibitedan excellent oxidation resistance.AcknowledgementsThis work was supported by the National Natural Science Foundation <strong>of</strong> China (Grant No.20971027) by the Special Research Fund for the Doctoral Program <strong>of</strong> Higher Education <strong>of</strong> China(Grant No. 20050562002), supported by the Guangdong Provincial Natural Science Foundation <strong>of</strong> China(Grant No. 9251009001000006), <strong>and</strong> by the Science <strong>and</strong> Technology Program <strong>of</strong> Guangdong Province <strong>of</strong>China (Grants Nos. 2009A030301008, No.2009B090300017).References[1] HEINO P., RISTOLAINEN E., J. NanoStruct. Mater., 11 (1999), 587.[2] LI Z.Y., GONG P.W., ZHAI Y.C., J. Iron Steel Res. Int., 14 (2007), 125.[3] CHU G., TANG Y.J., LIU W., LUO J.S., LI J., YANG T.Z., J. Metallic. Funct. Mater., 12 (2005), 18.[4] HISAKADO T., IKUTA K., SUD A., KSAITOU K., J. Wear., 197 (1996), 280.[5] WANG X.B., LIU W.M., YAN F., ZHANG Z., XU B., J. Chem. Lett., 33 (2004), 196.[6] OU X.M., GE C.L., WANG J., WANG B., ZHU H., J. China Univ. Min. Technol., 34 (2005), 640.[7] XIA Y.Q., J. Tribology., 24 (2004), 576.[8] LI B., XIA Y.Q., WANG X.B., XUE J.J., J. Tribology., 25 (2005), 385.[9] WANG X.L., XU B.S., XU Y., J. Cent. China Norm. Univ., 12 (2005), 203.[10] LEE D.W., KIM B.K., J. Mater. Lett., 58 (2004), 378.[11] LI Z.Y., ZHAI Y.C., TIAN Y.W., MA J.H., J. Rare Met. Mater. Eng., 34 (2005), 965.[12] HUO J.P., SONG H.H., CHEN X.H., J. Chem., 68 (2005), 23.[13] BANHART F., GROBERT N., TERRONES M., J. Int. J. Mod. Phys. B., 15 (2001), 4037.[14] SUN X.C., GUTIERREZ A., YAEAMAN M.J., DONG X.L., JIN S., J. Mater. Sci. Eng. A., 286 (2000), 157.[15] SUN X.C., TOLEDO J.A., J. Current Appl. Phys., 2 (2002), 113.[16] SI P.Z., ZHONG Z.D., GENG D.Y., YOU C.Y., ZHAO X.G., ZHANG W.S., J. Carbon, 41 (2003), 247.[17] SCHAPER A.K., HOU H., GREINER A., SCHNEIDER R., PHILLIPP F., J. Appl. Phys. A., 78 (2004), 73.[18] TIAN Y.Y., NIWA O.S., TOMITA M., J. Electrochem. Commun., 4 (2002), 468.[19] HAO G.H., SCHAPER A.K., WELLER F., GREINER A., J. Chem. Mater., 14 (2002), 3990.[20] SANO N., AKAZWAA H., KIKUEHI T., J. Carbon, 41 (2003), 2159.25 April 2009Revised 10 September 2009
Materials Science-Pol<strong>and</strong>, Vol. 28, No. 1, 2010Nitrogen doped carbon nanotubes<strong>and</strong> curved lamellas produced via pyrolysis<strong>of</strong> melamine by direct current arc dischargeR.I. ZHAO 1, 2 , Y. MA 1 , J. ZHANG 1* , F. LI 1 , W. LIU 1 , Q. CUI 11 National Laboratory <strong>of</strong> Superhard Materials, Jilin University, Changchun 130012, China2 Computer College, Jilin Normal University, Siping 136000, ChinaNitrogen doped carbon nanostructures, including nanotubes <strong>and</strong> barrel like curved lamellas, were fabricatedvia the pyrolysis <strong>of</strong> a solo precursor, melamine, in a direct current arc discharge. The samples were characterizedby elemental analysis, using XRD, XPS, TEM <strong>and</strong> SEM in parallel. The nitrogen concentration,determined from the elemental analysis, was shown to be lower than 5%. Nitrogen-based functional groupssuch as pyridine like structures, the pyrrolic or pyridonic structures, N-amine like structures <strong>and</strong> substitutionalnitrogen within the graphene layers, were observed to coexist in the turbostratic carbon matrix. XRD patternsshowed characteristic features <strong>of</strong> turbostratic carbons. TEM analysis <strong>of</strong> morphologies showed that nanostructuressuch as tubes <strong>and</strong> conglomerations <strong>of</strong> barrel like curved lamellas were present. The formation <strong>of</strong> bundles<strong>of</strong> nanotubes was further confirmed by SEM studies. The inhomogeneity in the morphologies <strong>of</strong> the nanostructureswas attributed to the differences in their growth mechanisms.Keywords: carbon nanotubes; pyrolytic carbon; arc discharge1. IntroductionThe studies <strong>of</strong> doping <strong>of</strong> carbon materials with nitrogen atoms has shown that thenitrogen-doping can obviously enhance mechanical, conducting, field emission, energystorage <strong>and</strong> electron transport properties <strong>and</strong> the catalytic activity in oxidationreactions <strong>of</strong> carbon materials [1–3]. Carbon nanotubes doped with nitrogen shouldexhibit novel electronic, chemical <strong>and</strong> mechanical properties [4]. In fact, the N dopedbulk graphite systems have been the subject <strong>of</strong> investigations for a long time, due totheir enhanced oxidation resistance <strong>and</strong> the possibility to adjust the crystallinity <strong>and</strong>graphitization. Nowadays, thanks to advances in nanoengineering <strong>and</strong> nanotechnology,the study <strong>of</strong> doping carbon nanostructures has entered a boom phase because_________* Corresponding author, e-mail: zhangjian_lxf@yahoo.com.cn
190R.I. ZHAO et al.these materials have potential applications as field effect transistors, logic circuits [5],sensors [6], promising materials for gas storage <strong>and</strong> adsorption [7], <strong>and</strong> as filler materialsfor reinforced composites [8], etc. Thus considerable efforts have been made tostudy the fabrication <strong>and</strong> the growth mechanism <strong>of</strong> the related carbon nanostructureswith nitrogen as the dopant.Up to now, only small quantities <strong>of</strong> nitrogen (≤ 15 at. %) have been incorporatedinto carbon networks [9–12], which implies that the formation <strong>of</strong> C–N bonds is somehowdifficult. From a thermodynamic point <strong>of</strong> view, this is reasonable, since segregationinto pure carbon phases <strong>and</strong> nitrogen gas is much enhanced due partly to thestrong triple bond in the nitrogen molecule. However, multiform nanostructures <strong>and</strong>inaugurating prototypes <strong>of</strong> devices have been obtained through various techniques,such as chemical vapour deposition (CVD) [1, 13], solvothermal techniques [14], directcurrent arc discharge [15], etc.It is desirable that nitrogenous organic compounds be used as precursors for the fabrication<strong>of</strong> nitrogen containing nanostructures. Melamine seems to be an appropriate precursor<strong>of</strong> such a kind. In this paper, we report a new method to synthesize nitrogen dopedcarbon nanostructures in which the pyrolysis <strong>of</strong> melamine in a direct current arc dischargeis involved. In this method, the pyrolysis <strong>of</strong> melamine takes place in a fast heating processgenerated by the direct current arc with the nitrogen rich gases as the working media, <strong>and</strong>the final products are formed via a quenching process for which the rate <strong>of</strong> temperaturedecrease ranges between 10 3 <strong>and</strong> 10 5 K·s –1 . It is shown that nanotubes <strong>and</strong> nanobarrel likecurved lamellas <strong>and</strong> sponge like networks formed by the conglomeration <strong>of</strong> thosenanolamellas can be grown directly by this method.2. ExperimentalA sketch map <strong>of</strong> the direct current arc discharge system we used is shown inFig. 1. In a typical experimental run, fine powders <strong>of</strong> melamine (purity ≥ 99.9%) <strong>and</strong>magnesium (purity ≥ 99.9%) were mixed together in an agate mortar in an appropriateratio <strong>and</strong> cold pressed into pellets. The deliberate addition <strong>of</strong> magnesium was to makethe pellets conductive, so that a direct current arc might be started. Carbonaceous conductivematerials such as carbon fibres or filaments were not used, so that the finalcarbon product was totally produced from melamine, taking into account that theweight loss <strong>of</strong> graphite electrodes was negligible. Then a pellet was loaded in the watercooled graphite crucible, acting as the anode. A graphite rod (6 mm in diameter<strong>and</strong> 25 cm in long) was employed as the cathode. The reaction chamber was firstevacuated to less than 1 Pa <strong>and</strong> washed several times with nitrogen (N 2 , 99.999%).Then working gases such as nitrogen or ammonia (NH 3 , 99.95%) were introduced intothe chamber until the inner pressure reached the target value <strong>of</strong> 10–30 kPa. After thedirect current arc was ignited, the input current was maintained at 100 A during thewhole process <strong>of</strong> synthesis. However, the arc voltage increased gradually from 35 V to45 V until the reactants were exhausted <strong>and</strong> the arc was quenched. After being pas-
Carbon nanotubes <strong>and</strong> curved lamellas produced via pyrolysis <strong>of</strong> melamine 191sivated in N 2 for 6 h, powders were collected from the water-cooled collecting wall,which is made <strong>of</strong> copper. The powders were washed with concentrated hydrochloricacid, distilled water <strong>and</strong> ethanol repeatedly to remove the remnant reactants <strong>and</strong> magnesiumcompounds. The final product, which was black <strong>and</strong> had a fleece like texture,was then gathered.Fig. 1. A sketch diagram <strong>of</strong> the arc discharge system: 1 – reactionchamber, 2 – graphite crucible, 3 – copper collecting wall, 4 – graphite cathode.The crucible <strong>and</strong> the collecting wall are both cooled with waterThe <strong>characterization</strong>s <strong>of</strong> the samples were carried out via elemental analysis,X-ray photoelectron spectroscopy (XPS), X-ray diffraction (XRD), transmission electronmicroscopy (TEM) <strong>and</strong> scanning electron microscopy (SEM). The compositions<strong>of</strong> the samples were examined by elemental analysis on a CHNS-O analyzer (FlashEA 1112 Series) through the conventional combustion method. The bonding states <strong>of</strong>the elements were studied via XPS on an EASY ESCA spectrometer (VG ESCA LABMKII). The XRD patterns were obtained via a Rigaku Dmax-rA diffractometer operatingwith a copper target (λ = 1.54056 Å). The morphologies <strong>of</strong> the samples were takenon a H8100 transmission electron microscope operating at 200 KV <strong>and</strong> a ShimadzuSuperscan SSX-550 scanning electron microscope operating at 15.0 kV.3. Results <strong>and</strong> discussionThe chemical compositions <strong>of</strong> the samples synthesized under typical experimentalconditions estimated through the combustion method are listed in Table 1. It can beseen that the products contain primarily carbon (82.51–89.37 wt. %). The doping level<strong>of</strong> nitrogen is relatively low (1.39–4.66 wt. %). Considerable amounts <strong>of</strong> hydrogen
192R.I. ZHAO et al.(0.88–2.15 wt. %) are also present. The presence <strong>of</strong> other components <strong>of</strong> the productsmay be due to surface oxidation <strong>and</strong> absorption, which may be promoted by incorporatingnitrogen in the carbon network. In addition, the influence <strong>of</strong> incomplete combustion<strong>of</strong> carbon species may not be ruled out entirely.SampleNo.Table 1. Chemical compositions <strong>of</strong> the samples synthesized at typicalexperimental conditions estimated through the combustion methodExperimental conditions Chemical composition [wt. %]Gas Pressure [kPa] C N H Other1 N 2 10 86.54 2.39 0.97 10.102 N 2 30 89.37 1.39 0.88 8.363 NH 3 10 82.51 4.66 2.15 10.684 NH 3 30 86.58 3.19 1.01 9.22The systematic variation <strong>of</strong> the compositions in relation to the experimental conditionsmay be roughly summarized as follows: (a) the powders produced in ammoniahave higher nitrogen concentrations than those produced in nitrogen gas at the samegas pressure; (b) higher working gas pressures tend to lower the nitrogen concentrationincorporated into the products. Taking the surface oxidation <strong>and</strong> adsorption intoaccount, the contaminating oxygen <strong>and</strong> hydrogen are unavoidable. This effect may beenhanced by the intrinsic mesoporosity <strong>of</strong> the products, as shown below.In fact, the compositions, structures, morphologies <strong>and</strong> other characteristics <strong>of</strong> thesamples did not vary much, despite being subject to various experimental conditions.Hereafter, the samples obtained in the procedure under N 2 pressure <strong>of</strong> 10 kPa will betaken as the representative ones in the following discussions.Fig. 2. A typical XRD pattern <strong>of</strong> the powders synthesized under the N 2 pressure<strong>of</strong> 10 kPa <strong>and</strong> I =100 A. The pattern is typical <strong>of</strong> all samples investigated in this studyThe XRD pattern <strong>of</strong> the representative sample is shown in Fig. 2. A broadenedpeak at 26.22° <strong>and</strong> three weak diffraction b<strong>and</strong>s at 42.91°, 53.48° <strong>and</strong> 78.03°, respec-
Carbon nanotubes <strong>and</strong> curved lamellas produced via pyrolysis <strong>of</strong> melamine 193tively, are distinguished in the pattern. They can be indexed as typical (002), (10),(004) <strong>and</strong> (11) diffraction b<strong>and</strong>s, respectively, for turbostratic carbons [16]. The (10)diffraction b<strong>and</strong> shows a shape characteristic <strong>of</strong> a two-dimensionally ordered structure.The absence <strong>of</strong> (10l ) b<strong>and</strong>s or peaks indicates that there is no long range threedimensionalorder <strong>of</strong> the graphite structure. The average thickness <strong>of</strong> the crystallizedlayers, L c , can be roughly estimated to be about 10 nm through Scherrer’s equation:Lc=BKλcosθ002 002where θ 002 is the diffraction angle <strong>and</strong> B 002 is the full width at half maximum (FWHM)<strong>of</strong> (002) diffraction.Fig. 3. The deconvoluted core level spectra<strong>of</strong> a typical sample synthesized under N 2 pressure<strong>of</strong> 10 kPa <strong>and</strong> I =100 A obtained by XPS: a) N1s,b) O1s, c) C1s. The dots represent experimentaldata <strong>and</strong> the lines are the fitting curvesThe binding energy (BE) dispersion <strong>of</strong> the emitted core level electrons observedby XPS can reveal the chemical environment <strong>of</strong> the atoms in materials. In the present
194R.I. ZHAO et al.case, turbostratic carbons are formed from radical atoms or small clusters in the arcdischarge, thus one can assume that the experiments with other nitrogen containingcarbons should be applied. Generally the results follow the observations with nitrogenbasedfunctional groups <strong>of</strong> molecular organic compounds [17–19]. The N 1s core levelspectra <strong>of</strong> our samples are fitted to Gaussian pr<strong>of</strong>iles, as shown in Fig. 3a. The componentpeaks are identified as nitride like species or aromatic N-amines with a BE <strong>of</strong>397.7 eV, pyridinic nitrogen (N-6) with a BE <strong>of</strong> 398.7 eV, pyrrolic or pyridonic nitrogen(N-5) with a BE <strong>of</strong> 400.1 eV, substitutional nitrogen in the centre position in condensedpolyaromatic systems, also called quaternary nitrogen (N-Q) with a BE <strong>of</strong>401.7 eV, <strong>and</strong> nitrogen oxide or nitrate species (N-X) with a BE in the range <strong>of</strong> 402-405 eV. A schematic representation <strong>of</strong> the nitrogen based functional groups similar tothose assigned in the present work may be found in the literature [19]. The O 1s corelevel spectra <strong>of</strong> our samples are also fitted to Gaussian pr<strong>of</strong>iles in a similar manner, asshown in Fig. 3b. Following the interpretation <strong>of</strong> XPS signals from oxygenated microporouscarbons [20], the component peaks are identified as carbonyl oxygen atoms inesters, amides, anhydrides, <strong>and</strong> hydroxyls with a BE <strong>of</strong> 532.1 eV, ester oxygen atomsin esters <strong>and</strong> anhydrides with a BE <strong>of</strong> 533.4 eV, <strong>and</strong> nitrogen oxide or nitrate species(N-oxide) with a BE <strong>of</strong> 530.5 eV. These surface oxygen containing functional groupswere most probably acquired during washing, since washing with acid solutions isa general way for modifying the surface chemistry <strong>of</strong> activated carbons to enable oxygencontaining functional groups. Based on the above analyses, the deconvoluted C 1score level spectra <strong>of</strong> the samples, as shown in Fig. 3c, can be readily explained. Themajor component with a BE <strong>of</strong> 284.6 eV is attributed to graphitic carbons (C–C). Theminor component peaks are identified as carbons in C–N <strong>and</strong>/or C–O with a BE <strong>of</strong>285.5 eV, carbons bonded to two N <strong>and</strong>/or O neighbours a BE <strong>of</strong> 286.3 eV, <strong>and</strong> carbonsin C≡N <strong>and</strong>/or C=O with a BE <strong>of</strong> 287.1 eV, respectively.The formation <strong>and</strong> mechanism <strong>of</strong> the bending <strong>and</strong> curling <strong>of</strong> graphene layers attractsconsiderable interest at present. In this study, nitrogen doped carbon nanostructures withexotic morphologies such as barrel like nanolamellas <strong>and</strong> bundles <strong>of</strong> nanotubes have beendiscovered. The so-called barrel like nanostructures are much shorter <strong>and</strong> less homogeneouswith respect to their shapes <strong>and</strong> dimensions compared with ordinary nanotubes [16].Typical TEM morphologies <strong>of</strong> the barrel like, or to be more precise in our case, bowl likecurved lamellas, are shown in Fig. 4. It can be seen from Fig. 4a that the nanolamellas arecurled <strong>and</strong> curved into irregular bowl like shapes. The characteristic calibre <strong>of</strong> these nanobowlsis about 100 nm <strong>and</strong> the thickness is estimated to be about 10 nm. It is speculatedthat these curved lamellas may be the intermediate structures between the fully curlednanotubes <strong>and</strong> flat graphite planes. Structures with similar shapes but smaller sizes are als<strong>of</strong>ound (Fig. 4b). Presumably they are 10–20 nm in calibre <strong>and</strong> 2–5 nm thick. These curvedlamellas conglomerated with one another, resulting in a sponge like structure with multitudinousmesopores <strong>and</strong> micropores. This structure may find potential usage in gas storage<strong>and</strong> catalyst support.
Carbon nanotubes <strong>and</strong> curved lamellas produced via pyrolysis <strong>of</strong> melamine 195Fig. 4. TEM morphologies <strong>of</strong> N doped carbon nanomaterials with curvedlamellar structures: a) the so-called barrel like nanolamellas with larger sizes,b) the sponge like conglomerations <strong>of</strong> smaller nanolamellasFig. 5. The morphologies <strong>of</strong> nanotubes found in a representative sample synthesizedunder the N 2 pressure <strong>of</strong> 10 kPa <strong>and</strong> I =100 A: a) typical TEM morphology <strong>of</strong> severalcarbon nanotubes (marked as T) with their ends buried in amorphous clumps,b) typical SEM morphology <strong>of</strong> the nanotube bundlesSeveral nanotubes, 15–35 nm in diameter, are demonstrated in Fig. 5a (markedas T), with the coexistence <strong>of</strong> CN x clumps. It is evident that the ends <strong>of</strong> the nanotubesare buried in those clumps. In Figure 5b, a typical SEM morphology <strong>of</strong> the nanotubebundles is demonstrated. The lengths <strong>of</strong> the nanotubes range from several micrometersto at least tens <strong>of</strong> micrometers. The nanotubes are somewhat crooked, indicating low
196R.I. ZHAO et al.crystallinity. This is only reasonable, since the incorporation <strong>of</strong> nitrogen in the graphenenetwork is anticipated to introduce large amounts <strong>of</strong> defects.The growth <strong>of</strong> nanotubes <strong>and</strong> the clusters <strong>of</strong> nanolamellas seem to be mutually exclusive.In expansive regions, the nanotubes tend to coexist with only irregular-shapedparticles (Fig. 5), absolutely non-concomitant with curved nanolamellas Meanwhile,the conglomerates seem to contain only species <strong>of</strong> barrel like nanolamellas. This phenomenonimplies there is a difference between the growth mechanisms <strong>of</strong> the twokinds <strong>of</strong> nanostructures. As for the growth <strong>of</strong> carbon nanotubes, the so-called rootgrowthmodel has been proposed [1], in which vapours <strong>of</strong> the reactants dissolve ina molten catalyst to form eutectic particles <strong>and</strong> nanotubes then grow from these particlesby supersaturation <strong>and</strong> segregation. From our TEM observations (Fig. 5), it can beseen that the ends <strong>of</strong> the nanotubes were embedded in surrounding clumps. Sucha phenomenon implies that the root-growth model also provides a suitable explanationfor the formation <strong>of</strong> N doped carbon nanotubes <strong>of</strong> our samples. Magnesium, melamine<strong>and</strong> the working gases such as nitrogen <strong>and</strong> ammonia react drastically with one another<strong>and</strong> nanosized particles <strong>of</strong> Mg 3 N 2 <strong>and</strong> CN x composites are formed. The vapoursrich in carbon, nitrogen <strong>and</strong> CN radicals dissolve into these composite particles at thehighly ionized central region <strong>of</strong> the arc plasma. The composite particles become supersaturatedas they fly away from the high temperature arc region to the water-cooledcollecting wall <strong>and</strong> the nucleation <strong>and</strong> segregation <strong>of</strong> the nanotubes take place.As to the growth <strong>of</strong> the barrel like curved lamellas, a conceivable hypothesis isthat they are formed with relatively low supersaturation <strong>of</strong> CN x species, which resultsin low growth rates. They grow faster within the graphene planes than in the perpendiculardirection <strong>and</strong> develop into lamellas with high aspect ratios. The lamellas are sothin that the rolling process could proceed easily via the combined effect <strong>of</strong> the extremelyhigh temperature, the bombardment <strong>of</strong> radicals <strong>and</strong> the quenching process.However, the curling <strong>of</strong> the lamellas occurred in all direction simultaneously, due tothe high defect density induced by the incorporation <strong>of</strong> N atoms. Thus, instead <strong>of</strong>seamless co-axial cylinders, irregular barrel like structures are formed.It should be noted that no materials with the layered structure such as graphitewere present in the starting materials. This implies that the direct formation <strong>of</strong> dopedcarbon nanostructures such as nanotubes, fullerenes, etc., using nitrogen-rich precursorsvia certain techniques such as arc discharge or laser ablation is possible. This maybe a new <strong>and</strong> promising route for the synthesis <strong>of</strong> doped carbon nanostructures <strong>and</strong>further work has to be carried out for the optimization <strong>of</strong> the experiments.4. ConclusionNanocrystalline carbon materials such as nanotubes, fullerenes <strong>and</strong> related structuresare a high pr<strong>of</strong>ile subject in science <strong>and</strong> technology, due to their potential usagesin nanoengineering as well as their other attractive properties. The doping <strong>of</strong> these
Carbon nanotubes <strong>and</strong> curved lamellas produced via pyrolysis <strong>of</strong> melamine 197materials opens up new routes to nanoscale electronics. Various techniques such as arcdischarge laser ablation <strong>and</strong> CVD, etc. have been employed to produce those dopednanostructures. In this study, the preparation <strong>of</strong> N doped carbon nanostructures via thepyrolysis <strong>of</strong> a solo precursor, melamine, was demonstrated. The final product hadbeen characterized by various techniques used in parallel. The doping level was shownto be lower than 5 wt. % by elemental analysis via the combustion method. XPS studiesrevealed that N atoms occupying the substitutional sites, the pyridine like sites, thepyrrolic or pyridonic sites <strong>and</strong> N-amine like sites coexisted in the carbon matrix. XRDpatterns showed characteristic features <strong>of</strong> turbostratic carbons. In the TEM morphologies,nanostructures such as tubes <strong>and</strong> conglomerations <strong>of</strong> barrel like curved lamellaswere found <strong>and</strong> attributed to different growth mechanisms. The formation <strong>of</strong> bundles<strong>of</strong> nanotubes was further confirmed by SEM studies.AcknowledgementsThis work was supported by the Natural Science Foundation <strong>of</strong> China (grant No. 50772043,50372023, 50334030), the National Basic Research Program <strong>of</strong> China (grant No. 2001CB711201,2005CB724400), the research startup foundation <strong>of</strong> Jilin University (No. 419080103460) <strong>and</strong> the ResearchFund for the Doctoral Program <strong>of</strong> Higher Education <strong>of</strong> China (20070183175).References[1] TERRONES M., AJAYAN P.M., BANHART F., BLASE X., CARROLL D.L., CHARLIER J.C., CZERW R.,FOLEY B., GROBERT N., KAMALAKALAN R., REDLICH PH., RŰHLE M., SEEGER T., TERRONES H., Appl.Phys. A, 74 (2002), 355.[2] STÖHR B., BOEHM H., SCHLÖGL R., Carbon, 29 (1991), 707.[3] BANDOSZ T., J. Colloid Interf. Sci., 246 (2002), 1.[4] TERRONES M., JORIO A., ENDO M., RAO A.M., KIM Y.A., HAYASHI T., TERRONES H., CHARLIER J.C.,DRESSELHAUS G., DRESSELHAUS M.S., Mater. Today, 7 (2004), 30.[5] AVOURIS P., Chem. Phys., 281 (2002), 429.[6] DOROZHKIN P.S., TOVSTONOG S.V., GOLBERG D., ZHAN J., ISHIKAWA Y., SHIOZAWA M., NAKANISHI H.,NAKATA K., BANDO Y., Small, 1 (2005), 1088.[7] YANG C.M., NOGUCHI H., MURATA K., YUDASAKA M., HASHIMOTO A., IIJIMA S., KANEKO K., Adv.Mater., 17 (2005), 866.[8] THOSTENSON E.T., LI C., CHOU T.W., Compos. Sci. Technol., 65 (2005), 491.[9] TERRONES M., REDLICH PH., GROBERT N., TRASOBARES S., HSU W.K., TERRONES H., ZHU Y.Q.,HARE J.P., CHEETHAM A.K., RŰHLE M., KROTO H.W., WALTON D.R.M., Adv. Mater., 11 (1999), 655.[10] TERRONES M., GROBERT N., OLIVARES J., ZHANG J.P., TERRONES H., KORDATOS K., HSU W.K.,HARE J.P., TOWNSEND P.D., PRASSIDES K., CHEETHAM A.K., KROTO H.W., WALTON D.R.M., Nature,388 (1997), 52.[11] SEN R., SATISHKUMAR B.C., GOVINDARAJ S., HARIKUMAR K.R., RENGANATHAN M.K., RAO C.N.R.,J. Mater. Chem., 7 (1997), 2335.[12] SEN R., SATISHKUMAR B.C., GOVINDARAJ S., HARIKUMAR K.R., RAINA G., ZHANG J.P., CHETHAM A.K.,RAO C.N.R., Chem. Phys. Lett., 287 (1998), 671.[13] TERRONES M., TERRONES H., GROBERT N., HSU W.K., ZHU Y.Q., KROTO H.W., WALTON D.R.M.,KOHLER-REDLICH PH., RŰHLE M., ZHANG J.P., CHEETHAM A.K., Appl. Phys. Lett., 75 (1999), 3932.[14] WU C., GUO Q., YIN P., LI T., YANG Q., XIE Y., J. Phys. Chem. B, 109 (2005), 2597.
198R.I. ZHAO et al.[15] GLERUP M., STEINMETZ J., SAMAILLE D., STÉPHAN O., ENOUZ S., LOISEAU A., ROTH S., BERNIER P.,Chem. Phys. Lett., 387 (2004), 193.[16] LEIS J., PERKSON A., ARULEPP M., KÄÄRIK M., SVENSSON G., Carbon, 39 (2001), 2043.[17] STAŃCZYK K., DZIEMBAJ R., PIWOWARSKA Z., WITKOWSKI S., Carbon, 33 (1995), 1383.[18] WEIDENTHALER C., LU A., SCHMIDT W., SCHÜTH F., Micropor. Mesopor. Mat., 88 (2006), 238.[19] KAPTEIJN F., MOULIJN J., MATZNER S., BOEHM H., Carbon, 37 (1999), 1143.[20] SU F., ZHAO X.S., LV L., ZHOU Z., Carbon, 42 (2004), 2821.Received 27 April 2009Revised 10 September 2009
Materials Science-Pol<strong>and</strong>, Vol. 28, No. 1, 2010Characterization <strong>of</strong> laser ablated AgInSe 2 filmsD. PATHAK 1* , R.K. BEDI 1 , D. KAUR 21 Department <strong>of</strong> Physics, Guru Nanak Dev University, Amritsar, India2 Department <strong>of</strong> Physics <strong>and</strong> Center <strong>of</strong> Nanotechnology,Indian Institute <strong>of</strong> Technology Roorkee, IndiaAgInSe 2 (AIS) thin films have been grown directly on silicon by means <strong>of</strong> a pulsed laser depositiontechnique. The X-ray diffraction studies show that the films are textured in the (112) direction. Increase<strong>of</strong> the substrate temperature results in a more ordered structure. Composition <strong>of</strong> the samples has beenanalysed by EDAX. It was found that the stoichiometry is better maintained with the PLD technique thanwith other traditional methods like thermal evaporation. The optical studies <strong>of</strong> the films show that theoptical b<strong>and</strong> gap is about 1.20 eV. The results <strong>of</strong> investigations may be <strong>of</strong> interest for a better underst<strong>and</strong>ing<strong>of</strong> the growth processes <strong>of</strong> chalcopyrite thin films on silicon materials.Keywords: pulse laser ablation; silicon wafers; heterojunction; FESEM; direct b<strong>and</strong> gap materials1. IntroductionThe I–III–VI 2 compounds are ternary analogues <strong>of</strong> II–VI compounds having highabsorption coefficient <strong>and</strong> good thermal stability [1]. The chalcopyrite semiconductorAgInSe 2 (AIS) is one <strong>of</strong> the most attractive materials in thin film solar cell applicationsbecause <strong>of</strong> its high optical absorption coefficient. These compounds crystallizein chalcopyrite structure which is closely related to a zinc blend structure. Ternarychalcopyrite compounds have photovoltaic properties that have potential use in solarcells since their optical b<strong>and</strong> gap lies between 0.8 eV <strong>and</strong> 2.0 eV <strong>and</strong> can be growneither as n or p type [2]. The efficiency <strong>of</strong> 19.5% has been reported by Contreras et al.in CuInGaSe 2 [3]. AgInSe 2 having a b<strong>and</strong> gap <strong>of</strong> 1.20 eV <strong>and</strong> the melting point <strong>of</strong>780 °C has applications in photovoltaic <strong>and</strong> optoelectronic devices. Matsuo et al. studiedAgInSe 2 films grown by the thermal evaporation technique, taking Ag 2 Se <strong>and</strong>In 2 Se 3 as starting materials [4]. Ramesh et al. obtained the efficiency <strong>of</strong> 7.5% inp-AgInSe 2 /n-CdS solar cells in which AgInSe 2 is used as the absorber material [5]._________* Corresponding author, e-mail: dineshpathak80@gmail.com
200D. PATHAK et al.A number <strong>of</strong> physical <strong>and</strong> chemical deposition techniques such as flash evaporation [6],radio frequency sputtering [7], thermal evaporation [8–10], solution growth [11, 12] <strong>and</strong>hot pressing [13] have been used for the preparation <strong>of</strong> AgInSe 2 under various experimentalconditions. All these techniques have advantages <strong>and</strong> disadvantages, dependingon the type <strong>of</strong> application intended for the films. It is important to obtain highquality AIS films for improving solar cell performance. However, the common problemencountered during synthesis is to preserve the stoichiometric amount <strong>of</strong> seleniumdue to high volatility in Se containing compounds. The pulsed laser deposition (PLD)technique has been shown to be an excellent way to fabricate high temperature superconductors[14] <strong>and</strong> multicomponent oxide films [15, 16], especially with respect tocompositional reproduction <strong>and</strong> high deposition rate. PLD has many advantages <strong>and</strong>technological possibilities. These advantages are the effectiveness <strong>and</strong> simplicity <strong>of</strong>the deposition equipment, high deposition rates <strong>and</strong> low temperature deposition,a wide spectrum <strong>of</strong> deposition parameters for the control <strong>and</strong> optimization <strong>of</strong> filmproperties. In addition, PLD enables accurate control both the stoichiometry <strong>and</strong> thefilm thickness. The growth <strong>of</strong> AIS on Si substrates is <strong>of</strong> interest, since it is regarded tobe a prerequisite for the direct integration <strong>of</strong> this material with the more dominant Sibasedtechnologies. In this paper, an attempt has been made to grow AgInSe 2 films onSi substrates with (100) orientation by laser ablation. We report on the synthesis <strong>of</strong>AIS thin films using the (PLD) technique in which Se volatility can be minimized.Structural <strong>and</strong> optical properties depending on substrate temperature <strong>of</strong> films fabricatedby pulse laser deposition have also been studied.2. ExperimentalAblation <strong>of</strong> a polycrystalline target 25 mm in diameter was achieved using a multitarget,ultra high vacuum (UVH) pulse laser deposition (PLD), KrF excimer lasersystem (λ = 248 nm, the laser rate <strong>of</strong> 3 Hz <strong>and</strong> the pulse energy density <strong>of</strong> 1–2 J/cm 2 ).The complete set up <strong>of</strong> the system is shown in Fig. 1. The synthesis <strong>of</strong> the target wasperformed using a stoichiometric mixture <strong>of</strong> Ag, In <strong>and</strong> Se, followed by sealing ina quartz tube ampoule. The sealed quartz tube was heated at 900 °C for 48 h <strong>and</strong>cooled slowly. A polycrystalline chalcopyrite structure was obtained as the resultingcompound. The details <strong>of</strong> the synthesis <strong>of</strong> the AIS target have been described elsewhere[10]. The target substrate distance was kept at 40 mm. The chamber was evacuatedto the pressure lower than 2.7×10 –6 Pa before ablation. The (100) oriented Si substrateswere chemically cleaned <strong>and</strong> etched in a dilute HF solution prior tointroduction into the chamber. All substrates were also cleaned in an ultrasonic bathbefore deposition. The ablated AIS was collected on a Si(100) wafer. The silicon substrateswere then mounted on a direct heating sample holder made <strong>of</strong> a stainless steelsheet. AIS/Si films were grown with the deposition temperatures 300 K <strong>and</strong> 473 K.Laser pulses were incident at the angle <strong>of</strong> 45° on the target, over the surface scanned
Laser ablated AgInSe 2 films 201by the focused laser beam. The deposited films were finally cooled to room temperaturein vacuum.Fig. 1. Complete PLD set upThe structure <strong>of</strong> the as prepared powder <strong>and</strong> pulse laser ablated films on Si(100)wafers was observed with a θ–2θ X-ray diffractrometer using CuK α radiation tostudy the orientation <strong>and</strong> crystallinity <strong>of</strong> the films. The analysis <strong>of</strong> the composition <strong>of</strong>the product has been carried out by the energy dispersive analysis through X-rays(EDAX), together with field emission scanning electron microscopy (FESEM). Theoptical studies were performed on films grown on glass substrates, using the sameconditions as used for the deposition on Si substrates [9, 17]. Glass was chosen onlyfor the optical measurements. It is noted that AIS/glass exhibits a similar compositionto that found in AIS/Si films. The absorption spectra <strong>of</strong> AgInSe 2 films were recordedin the wavelength range 200–1100 nm, using a UV-VIS Perkin-Elmer spectrophotometer.Themicrostructure was studied using field emission scanning electron microscopy(FESEM-FEI Quanta 200 F). To prevent the charge build up during FESEMobservation, samples were coated with gold using a sputtering system.3. Results <strong>and</strong> discussionThe XRD pr<strong>of</strong>ile <strong>of</strong> the as-prepared powder is shown in Fig. 2a. The pattern indicatesthat AIS is polycrystalline in nature <strong>and</strong> exhibits a prominent (112) peak <strong>of</strong> chalcopyritephase, in addition to other (220), (204), (312) <strong>and</strong> (116) peaks <strong>of</strong> very smallintensity. The films prepared on the Si(100) wafers at room temperature are characterizedby the absence <strong>of</strong> diffraction peaks, indicating their amorphous nature. Howeverthe AIS films obtained at 473 K indicate high orientation in the (112) plane, parallel tothe silicon substrate along with a reflection from the (204) plane <strong>of</strong> comparativelysmall intensity (Fig. 2b).
202D. PATHAK et al.Fig. 2. XRD pattern <strong>of</strong> as synthesized powder (a) <strong>and</strong> films (b)fabricated by PLD on Si(100) wafers at 300 K <strong>and</strong> 473 KThe crystallite size is calculated from the FWHM value <strong>of</strong> the (112) peak by usingScherrer’s formula0.9D = λβ cosθ(1)<strong>and</strong> is found to be 6 nm, where λ is the wavelength <strong>of</strong> X-rays, β is the FWHM in radians,θ is the Bragg angle. XRD studies confirm that by performing laser ablation,
Laser ablated AgInSe 2 films 203AgInSe 2 can be grown on silicon wafers. These preliminary results indicate the possibility<strong>of</strong> producing device quality chalcopyrite–AgInSe 2 /Si heterojunctions by pulselaser ablation for photovoltaic applications.Fig. 3. FESEM <strong>of</strong> laser ablated AIS filmson Si(100) wafer at 473 KField emission scanning electron micrograph <strong>of</strong> an AIS nanostructured film depositedby pulse laser deposition at 473 K on Si(100) substrate is shown in Fig 3. It delineatesthe shape <strong>and</strong> distribution <strong>of</strong> crystallites. Densely packed grains elongated inone direction are exhibited by AIS film grown at 473 K. It is also observed that grainsare more homogeneous, uniformly distributed <strong>and</strong> densely packed as compared withthe films deposited by thermal evaporation on the same substrate, Si(100), <strong>and</strong> at thesame deposition temperature [9]: these are the major advantages <strong>of</strong> PLD, along withpore free growth.Analysis <strong>of</strong> the composition <strong>of</strong> AIS films grown on 100 oriented silicon waferswas carried out by the energy dispersive analysis through X-rays. This elementalanalysis showed that films obtained at 473K are almost as stoichiometric those preparedby thermal evaporation with Ag 28.96%, In 27.41% <strong>and</strong> Se 43.63%. The seleniumpercentage deviates to some extent due highly volatile nature <strong>of</strong> the element.The optical studies were carried out on AIS films grown on glass substrates underthe same conditions as those used for deposition on Si substrates [9, 17]. It is notedthat AIS/glass has a similar composition to that found in AIS/Si films. The linear nature<strong>of</strong> the plot near the absorption edge confirms that ablated AgInSe 2 films showsemi-conducting behaviour with direct b<strong>and</strong> gap [18]. The b<strong>and</strong> gap energy (E g ) wasestimated based on the recorded optical spectra from the equation <strong>of</strong> Bardeen [19].( ) ngαν h = A hν− Ε(2)where A is a constant, α is the absorption coefficient, hν is the photon energy, <strong>and</strong> ndepends on the nature <strong>of</strong> the transition. For direct transition, n =1/2 or 3/2, while forthe indirect one n = 2 or 3, depending on whether they are allowed or forbidden, respectively.Here the best fit to the experimental data was obtained for n = 1/2. The
204D. PATHAK et al.dependence <strong>of</strong> (αhν) 2 on hν yields a straight line, indicating that the fundamental absorptionedge could be due to direct allowed transition.Fig. 4. Dependence <strong>of</strong> (αhν) 2 on EThese results are in conformity with those reported earlier for thermally evaporatedAIS [6, 8–10]. The b<strong>and</strong> gap energy is estimated to be 1.20 ev (Fig. 4). Variousauthors reported different values for the b<strong>and</strong> gap energy <strong>of</strong> AgInSe 2 films [6,8],which may be attributed to different proportions <strong>of</strong> Ag/In/Se in the composition.4. ConclusionsWe have successfully deposited silver indium selenide films directly on Si (100)substrates by the pulse laser deposition technique. The films show a tetragonally distortedchalcopyrite structure. Room temperature deposited films are amorphous innature while AIS films deposited at 473 K appear to have preferential texture orientedin the (112) direction. Crystallites <strong>of</strong> 6 nm size were obtained. On silicon wafers, fromoptical measurements, the b<strong>and</strong> gap energy is estimated to be 1.20 eV. We believe thatthese preliminary results may be <strong>of</strong> interest for a better underst<strong>and</strong>ing <strong>of</strong> the growth <strong>of</strong>chalcopyrite thin films on silicon materials, since it is regarded to be a prerequisite forthe direct integration <strong>of</strong> these materials with the dominant Si-based technologies.AcknowledgementsOne <strong>of</strong> the authors (D. P.), acknowledges the Council <strong>of</strong> Scientific <strong>and</strong> Industrial Research (CSIR),New Delhi, India, for awarding a Senior Research Fellowship (SRF) grant to carry out this project.
Laser ablated AgInSe 2 films 205References[1] TELL B., SHAY J., KASPER H.M., J Appl. Phys., 43 (1972), 2469.[2] JOSEPH C.M., MENON C.S., Semicond. Sci. Techn., 11 (1996),1668.[3] CONTRERAS M.A.,RAMANATHAN K., ABUSHAMA J., HASOON F., KEANE J., YOUNG L., EGAAS B.,NOUFI R., Prog. Photovolt. Res. Appl.,13 (2005), 209.[4] MATSUO H., YOSHINO K., AND IKARI T., Phys. Stat. Sol. (c), 3 (2006), 2644.[5] RAMESH P.P., UTHANA S., SRINIVASALU B.N., JAYARAMA P.R., Vacuum, 47 (1996), 211.[6] PATEL S.M., PATEL A.D., Thin Solid Films, 111 (1984), 53.[7] WEIR R.D., JESSOP P.E., GARSIDE B.K., Can. J. Phys., 65 (1987), 1033.[8] KORASHY A.E., ABDEL-RAHIM M.A., ZAHED H.E., Thin Solid Films, 338 (1999), 207.[9] PATHAK D., BEDI R.K., KAUR D., Appl. Phys. A, (2009), DOI 10.1007/s00339-009-5083-8.[10] BEDI R.K., PATHAK D., DEEPAK, KAUR D., Z. Cristallogr. Suppl., 27 (2008), 177.[11] SHARMA R.P., Indian J. Pure Appl. Phys., 33 (1995), 711.[12] MENG A., CHRIS B., JAGDESE J.V., J. Am. Chem. Soc.,128 (2006), 7118.[13] YOSHINO K., KINOSHITA A., SHIRAHTA Y., OSHIMA M., YOSHITAKE T., OZAKI S., IKARI T., J. Phys.,Conf. Ser. 100 (2008), 042042.[14] DIJKKAMP D., VENKATSAN T., WU X.D., Appl. Phys. Lett., 51 (1987), 619.[15] OTUBO S., MAEDA U., MINAMIKAWA T., YONEZWA Y., MORIMOIO A., SHIMIZU.T., Jpn. J. Appl. Phys,.29 (1990), 133.[16] KIDOH H., YASHIMA H., MORIMOTO A., SHIMIZU T., Jpn J. Appl. Phys., 33 (1994), 4094.[17] BECHIRI L., BENABDSLEM M., BENSLIM N., DIEKOUN A., OTMANI A., MAHADDJOUBI L., MADELON R.,RUTERANA P., NOUET G., Catal. Today, 113 (2006), 226.[18] PANKOVE J.I., Optical Processes in Semiconductors, Prentice Hall, New York, 1971.[19] Photoconductivity Conference, J. Bardeen (Ed.), Wiley, New York, 1956.Received 5 June 2009Revised 13 October 2009
Materials Science-Pol<strong>and</strong>, Vol. 28, No. 1, 2010On the design <strong>of</strong> biodegradable hydrogelsboth thermosensitive <strong>and</strong> pH sensitiveB. WANG 1, 2* , Y. GUO 1, 2 , G. HU 11 Institute <strong>of</strong> Macromolecules <strong>and</strong> Bioengineering, North University <strong>of</strong> China, Taiyuan 030051, China2 Institute <strong>of</strong> Chemical Engineering <strong>and</strong> Environment, North University <strong>of</strong> China, Taiyuan 030051, ChinaA Pluronic oligo(ε-caprolactone) block copolymer has been synthesized by ring opening polymerization<strong>of</strong> ε-caprolactone monomers in the presence <strong>of</strong> poly(ethylene oxide)–poly(propylene oxide)–poly(ethylene oxide) triblock copolymers, using stannous octoate as a catalyst, <strong>and</strong> then the block copolymerwas terminated with an acryloyl group. A novel biodegradable pH- <strong>and</strong> temperature sensitivehydrogel has been fabricated by free radical copolymerization <strong>of</strong> diacylated macromer–methacrylic acidaqueous solution initiated by a redox initiator. The structures <strong>of</strong> products were characterized by the Fouriertransform infrared spectroscopy. Variations <strong>of</strong> the equilibrium swelling ratio in various environmentalsolutions confirmed the pH- <strong>and</strong> temperature sensitivity <strong>of</strong> hydrogel, which were affected by the MAAcontent.Keywords: biodegradable hydrogel; pH sensitivity; temperature sensitivity1. IntroductionDuring the last decade, a great attention has been focused on the controlled drugrelease technique, due to the appearance <strong>of</strong> protein drugs <strong>and</strong> their special structure.Among the current materials for controlled drug carriers, hydrogels are rather unique<strong>and</strong> especially suitable for the sustained release <strong>of</strong> hydrophilic macromoleculardrugs [1]. Hydrogels are three-dimensional hydrophilic polymer networks that can beswollen to many times their mass <strong>and</strong> volume in aqueous environments [2]. As theterm “network” implies, cross-linking has to be formed to avoid dissolving or losingtheir structural integrity in the aqueous phase [3]. Due to their diverse functionalities,intelligent hydrogels have been the subject <strong>of</strong> extensive investigations in recentyears [4]. Most <strong>of</strong> the intelligent hydrogels reported respond to only one type <strong>of</strong> stimuli.Among these intelligent hydrogels, pH sensitive or temperature sensitive hy-_________* Corresponding author, email: bbwang@nuc.edu.cn
208B. WANG et al.drogels have been commonly investigated, because both parameters are importantenvironmental factors in biomedical <strong>and</strong> other systems [5]. Body temperature <strong>of</strong>tendeviates from the normal one (near 37 °C) by the physiological presence <strong>of</strong> pathogensor pyrogens. This change <strong>of</strong> temperature may be a useful stimulus that can modulatethe delivery <strong>of</strong> therapeutic drugs for diseases with accompanying fever [6]. pH sensitivityis another parameter that can be exploited in applications, <strong>and</strong> arguably hasgreater potential for use in biomedical devices, or biomaterials than thermosensitivity(see [7]).From the application point <strong>of</strong> view, hydrogels, especially biodegradable hydrogels,would be highly useful if they simultaneously responded to two stimuli.Keeping this consideration in mind, our objective is to design <strong>and</strong> synthesize a novelbiodegradable hydrogel that sensitive both to pH as well as to temperature. We selectedPluronic (Poloxamer), an ABA triblock copolymer <strong>of</strong> poly(ethylene oxide)–poly(propylene oxide)–poly(ethylene oxide) (PEO–PPO–PEO), as the central part <strong>of</strong>the hydrogel for its superior biocompatibility <strong>and</strong> temperature sensitivity [8–11]. Thenextending it with <strong>of</strong> ε-caprolactone oligomer can endow the final product with biodegradability.Finally, end-capping with reactive acryloyl units allows the macromer tobe polymerized. The PMAA is selected as a pH sensitive copolymer both because <strong>of</strong>its sharp pH induced volume transition in the physiological pH range <strong>and</strong> its broadrange <strong>of</strong> applications in the biomaterial field [12, 13].In the present work, the hydrogel was obtained by radical copolymerization <strong>of</strong> thediacrylated macromer–methacrylic acid aqueous solution initiated by a redox initiator.We also investigated the effect <strong>of</strong> MAA content on the temperature sensitivity <strong>and</strong> pHsensitivity <strong>of</strong> the biodegradable hydrogel.2. ExperimentalMaterials. Pluronic F127 (PEO–PPO–PEO) triblock copolymer was obtainedfrom BASF (Germany). ε-caprolactone monomer <strong>and</strong> tin(II)2-ethylhexanoate (stannousoctoate) were purchased from Aldrich (Milwaukee, WI, USA) <strong>and</strong> Sigma (Dallas,Texas, US), respectively. All other chemicals were <strong>of</strong> analytical grades.<strong>Synthesis</strong> <strong>of</strong> Pluronic–oligo(ε-caprolactone) block copolymers (PFCL). Pluronic–oligo (ε-caprolactone) amphiphilic block copolymers were synthesized by ring openingpolymerization <strong>of</strong> ε-caprolactone monomers in the presence <strong>of</strong> PEO–PPO–PEOtriblock copolymers, Pluronic F127, using stannous octoate as a catalyst. The Pluronic,ε-caprolactone monomers <strong>and</strong> stannous octoate with various weight ratios wereplaced into a flask connected with a vacuum outlet tube, <strong>and</strong> the mixture was preheatedfor 6 h at 60 °C under vacuum in order to obtain a well mixed melting phase.The mixture was purged several times with argon to displace the oxygen. Finally, theflask was sealed <strong>of</strong>f under vacuum <strong>and</strong> the reactant was copolymerized at 150 °C for24 h. The copolymerization product was cooled to the room temperature, dissolved
On the design <strong>of</strong> biodegradable hydrogels both thermosensitive <strong>and</strong> pH sensitive 209with dichloromethane, <strong>and</strong> then precipitated with an excess <strong>of</strong> anhydrous ether to removeunreacted Pluronic <strong>and</strong> ε-caprolactone monomers. The precipitate was collectedby filtration <strong>and</strong> washed several times with absolute ether. The resulting product wasdried under vacuum. The Pluronic–oligo(ε-caprolactone) block copolymer productsare denoted as PFCL X , where X is the degree <strong>of</strong> polymerization <strong>of</strong> ε-caprolactone ateach end <strong>of</strong> the Pluronic molecule according to the feed ratio.<strong>Synthesis</strong> <strong>of</strong> diacrylated macromer (PFCL-D). Dried Pluronic–oligo(ε-caprolactone)block copolymer product <strong>and</strong> triethylamine were dissolved in dichloromethanein a 250 cm 3 round bottom flask. Acryloyl chloride in dichloromethane wasdrop-wise added. The reaction mixture was stirred with an agitator at 0 °C for 12 h<strong>and</strong> then for next 12 h at room temperature. The reaction product was filtrated <strong>and</strong>extracted with an excess <strong>of</strong> anhydrous ether. The precipitate was collected by filtration<strong>and</strong> dried under vacuum. The diacrylated macromer <strong>of</strong> Pluronic–oligo(ε-caprolactone)block copolymer is denoted as PFCL X -D.<strong>Synthesis</strong> <strong>of</strong> pH- <strong>and</strong> temperature sensitive hydrogels (PFCL-MAA). Hydrogelswere obtained by free radical copolymerization in distilled water. Ammonium persulfate(APS) was selected as a redox initiator <strong>and</strong> N,N,N′,N′-tetramethylene diamine(TEMED) was used as an accelerator. PFCL X -D <strong>and</strong> MAA monomers were dissolvedin distilled water. Then a appropriate amounts <strong>of</strong> APS <strong>and</strong> TEMED were added to themixtures. The mixture solution was poured onto a glass dish <strong>and</strong> crosslinked to form ahydrogel film at 60 °C. The wet hydrogel films were dried under vacuum for severaldays. The hydrogels PFCL X -MAA-Y, were obtained where Y is the wt. % <strong>of</strong> MAA indiacrylated macromer <strong>of</strong> Pluronic–oligo(ε-caprolactone).FTIR <strong>characterization</strong>. The dried products were analyzed in KBr discs with a FTIRspectrophotometer (FTIR-8400S, Japan) in the range <strong>of</strong> 500–4000 cm –1 .Temperature sensitivity. The temperature dependence <strong>of</strong> the swelling ratioin the range <strong>of</strong> 4–37 °C was investigated by the classical gravimetric method. Driedhydrogel samples were immersed in distilled water at a given temperature for at least24 h. Then any excess water on the swollen hydrogel surface was removed by wetfilter paper. The equilibrium swelling ratio (ESR) is defined as follows:ms − mdESR = (1)mwhere m s is the weight <strong>of</strong> the equilibrium swollen hydrogel <strong>and</strong> m d is its initial weight.pH sensitivity. The hydrogels were immersed in buffer solutions <strong>of</strong> various pH(from 2 to 8) at 4 °C <strong>and</strong> 37 °C for at least 24 h, in order to achieve swelling equilibrium.Then the hydrogels were weighed, <strong>and</strong> the swelling ratio at each pH was calculatedaccording to Eq. (1).d
210B. WANG et al.3. Results <strong>and</strong> discussion3.1. Characterization <strong>of</strong> chemical structures <strong>of</strong> macromersFTIR spectroscopy has been employed to characterize the chemical structure <strong>of</strong>Pluronic, a series <strong>of</strong> PFCL block copolymers <strong>and</strong> PFCL-D macromers (Fig. 1).Fig. 1. FTIR spectra <strong>of</strong>: a) Pluronic F127, a series <strong>of</strong> PFCL blockpolymers – b), PFCL 4 , c) PFCL 8 , d) PFCL 12 <strong>and</strong> PFCL-D macromers– b′) PFCL 4 -D, c′) PFCL 8 -D, d′) PFCL 12 -DThe peaks between 3000 <strong>and</strong> 4000 cm –1 are assigned to symmetric <strong>and</strong> asymmetricstretching vibration modes <strong>of</strong> the hydroxyl group. As compared with the FTIR spectra<strong>of</strong> F127, PFCL block copolymers (Fig. 1, b–e) display a new <strong>and</strong> strong carbonyl b<strong>and</strong>at 1734 cm –1 , which is attributed to the C=O stretching mode <strong>of</strong> the ε-caprolactoneunits in the copolymers. The ε-caprolactone units are extended into the ends <strong>of</strong> Pluronicmolecules. The intensity <strong>of</strong> the peaks at 1734 cm –1 increases as the number <strong>of</strong>ε-caprolactone units increases. Ding et al. reported similar results [14, 15]. Furthermore,the peaks at 3500 cm –1 disappear for PFCL-D macromers as shown in Fig. 1b′–d′. It maybe concluded that the hydroxyl group at both ends <strong>of</strong> F127-oligoCL was substituted bythe acryloyl group in the macromers.3.2. Temperature sensitivityThe temperature dependence <strong>of</strong> the equilibrium swelling ratio (ESR) over a temperaturerange from 4 to 37 °C is shown in Fig. 2. All obtained hydrogels display
On the design <strong>of</strong> biodegradable hydrogels both thermosensitive <strong>and</strong> pH sensitive 211a good temperature response. For example, at 4 °C, the ESR value <strong>of</strong> the samplesPFCL4-MMA-10, PFCL4-MMA-20, <strong>and</strong> PFCL4-MMA-30 is 7.22, 4.76 <strong>and</strong> 3.93,respectively, whereas the corresponding values at 37 °C are 3.99, 3.28 <strong>and</strong> 2.63, respectively.Fig. 2. Temperature dependence <strong>of</strong> the swelling ratio in hydrogelsThe negative temperature sensitivity <strong>of</strong> the hydrogels originates from the lowercritical solution temperature (LCST) behaviour <strong>of</strong> PEO–PPO–PEO block copolymersin water. Clearly, the swelling ratio <strong>of</strong> hydrogels decreases as the MAA content increases,which may be attributed to the formation <strong>of</strong> a more compact network after theincorporation <strong>of</strong> MAA segments.3.3. pH sensitivityThe investigations <strong>of</strong> the swelling properties <strong>of</strong> the hydrogels were carried out invarious buffer solutions (pH from 2 to 8) at 4 °C <strong>and</strong> 37 °C, respectively. An evidentswelling transition is observed with pH change (Figs. 3 <strong>and</strong> 4). Additionally, with theincrease in the MAA content, the ESR value decreases before the swelling transition:this is in contrast to the increase <strong>of</strong> ESR at high pH. For example, at pH = 5 <strong>and</strong> 4 °C(or 37 °C), the ESR values <strong>of</strong> PFCL8-MMA-10, PFCL8-MMA-20, <strong>and</strong> PFCL8-MMA-30 samples are 6.87 (3.91), 4.50 (3.20), <strong>and</strong> 3.01 (2.21), respectively. Their correspondingESR values at pH = 8, however, are increased to 25.42 (18.61), 33.17(27.07), <strong>and</strong> 38.66 (30.63), respectively. Such behaviours demonstrate that the PFCL–MMA hydrogels show both pH <strong>and</strong> temperature sensitivity. The pH sensitivity isrelated to the pH dependent ionization <strong>of</strong> side carboxylic acid (–COOH) groups <strong>of</strong>PMAA.
212B. WANG et al.Fig. 3. Dependence <strong>of</strong> the swelling ratio on pH plot in hydrogels at 4 °CFig. 4. Dependence <strong>of</strong> the swelling ratio on pH plot in hydrogels at 37 °C3.4. The temperature <strong>and</strong> pH dependent swelling mechanismObviously, the temperature <strong>and</strong> pH-sensitivity <strong>of</strong> PFCL-MAA hydrogels are relatedwith the network structure <strong>and</strong> the associated interactions (such as hydrophobic<strong>and</strong> hydrophilic interaction). We hypothesize that there are three different structures inthe network <strong>of</strong> the PFCL-MAA hydrogel (Fig. 5).
On the design <strong>of</strong> biodegradable hydrogels both thermosensitive <strong>and</strong> pH sensitive 213The temperature sensitivity <strong>of</strong> PFCL-MAA hydrogel contributes to the moiety <strong>of</strong>Pluronic in the network. Hydrogen bonding between hydrophilic segments <strong>of</strong> the macromerchain <strong>and</strong> water molecules dominates at low temperatures, leading to enhanceddissolution in water <strong>of</strong> the copolymer hydrogel. Hydrophobic interactions among hydrophobicsegments, especially PPO segments, however, are strengthened at hightemperatures, resulting in association <strong>and</strong> shrinking <strong>of</strong> the network.Fig. 5. Scheme <strong>of</strong> temperature <strong>and</strong> pH dependence <strong>of</strong> swelling mechanism <strong>of</strong> the PFCL–MAA hydrogelAs expected, using MAA as a pH sensitive co-monomer <strong>of</strong> PFCL-D macromer,the PFCL-MAA hydrogel is highly responsive to changes in pH, just like PMAA itself.Due to the existence <strong>of</strong> carboxylic acid groups in MAA segments, the hydrophobicunits can undergo stable hydrophobic interaction in an acid medium. The hydrophobicinteraction can restrict the movement or relaxation <strong>of</strong> network chains.Therefore, a more compact hydrogel network is formed, with a lower swelling capacity.But in a neutral <strong>and</strong> alkaline media, the ionization <strong>of</strong> the carboxylic acid groups <strong>of</strong>MAA occurs, disrupts the hydrophobic interaction <strong>and</strong> generates electrostatic repulsionamong hydrogel chains. This repulsive force is strong enough to push the network
214B. WANG et al.chain segments apart <strong>and</strong> attract more water into the hydrogel, so a higher swellingratio is observed.Moreover, it is easy to explain different swelling behaviour <strong>of</strong> PFCL-MAA hydrogelfor different MAA contents, as is observed in Fig. 5. Clearly, all <strong>of</strong> these threestructures in Fig. 5, are highly responsive to temperature changes. The swelling capacity,however, is different <strong>and</strong> is described by the sequence: structure I > structure II > structureIII. Therefore, it is not surprising that the ESR values decrease as the MAA contentincreases, since the content <strong>of</strong> the latter two structures increases at high MAA content.We also suspect that only structure III can sensitively respond to the change <strong>of</strong> pH, sinceit can interact hydrophobically with MAA segments in an acidic medium which causesshrinkage <strong>of</strong> polymer chains, water molecules cannot easily diffuse <strong>and</strong> permeate intoa more compact network. Since the hindrance effect increases as the MAA content in thePFCL-MAA hydrogel increases, the ESR values certainly decrease with MAA contentincreasing at acidic swelling solution. As the pH <strong>of</strong> the swelling solution increases, ionization<strong>of</strong> the carboxylic acid groups occurs <strong>and</strong> their electrostatic repulsions causea great degree <strong>of</strong> swelling <strong>of</strong> the hydrogel. In this case, the resulting hydrophobic interactionbetween MAA segments becomes weaker <strong>and</strong> finally vanishes, leading to expansion<strong>of</strong> structure III <strong>and</strong> therefore an increase in the ESR value. The electrostatic repulsionsbecome much stronger if the MAA content is high. As such, the degree <strong>of</strong> swelling<strong>of</strong> the hydrogel increases as the MAA content increases.4. ConclusionsA series <strong>of</strong> Pluronic–oligo(ε-caprolactone) (PFCL) block copolymer was synthesizedby ring opening polymerization <strong>of</strong> ε-caprolactone monomers in the presence <strong>of</strong>PEO–PPO–PEO triblock copolymers (Pluronic), <strong>and</strong> was then subsequently endcappedwith the acryloyl groups. The FTIR spectra verified that the diacrylated macromersuccessfully has been synthesized.This novel, pH-sensitive <strong>and</strong> temperature sensitive PFCL-MAA hydrogel was obtainedby free radical copolymerization <strong>of</strong> the diacrylated macromer–methacrylic acidaqueous solution initiated by a redox initiator. The equilibrium swelling ratio <strong>of</strong> hydrogelin various solutions indicated that the PFCL-MAA hydrogel displayed bothtemperature- <strong>and</strong> pH sensitivity, which were affected by the MAA content. The MAAcontent caused the ESR values to decrease at specific swelling temperatures. With theincrease in the MAA moiety <strong>of</strong> the PFCLMAA hydrogel, the degree <strong>of</strong> swelling at anacidic medium decreased due to the presence <strong>of</strong> hydrophobic interaction. It, however,decreased at neutral <strong>and</strong> alkaline media since lack <strong>of</strong> hydrophobic interaction <strong>of</strong>feredthe hydrogel much stronger electrostatic repulsions in the case <strong>of</strong> high MAA content.AcknowledgementsThis work was financially supported by the Science <strong>and</strong> Technology Foundation for Youth fromShanxi Sci <strong>and</strong> Tech Bureau (Grant No. 2006021011).
On the design <strong>of</strong> biodegradable hydrogels both thermosensitive <strong>and</strong> pH sensitive 215References[1] PEPPAS N.A., BURES P., LEOBANDUNG W., ICHIKAWA H., Eur. J. Pharm. Biopharm., 50 (2000), 27.[2] NI H., KAWAGUCHI H., ENDO T., Coll. Polym. Sci., 285 (2007), 873.[3] ZHAO Y., KANG J., TAN T.W., Polymer, 47 (2006), 7702.[4] SUN G.M., ZHANG X.Z., J. Mater. Sci.: Mater. Med., 18 (2007), 1563.[5] ZHANG J., CHU L.Y., LI Y.K., LEE Y.M., Polymer, 48 (2007), 1718.[6] KIM S.Y., HA J.C., LEE Y.M., J. Control. Release, 68 (2000), 345.[7] NI H., KAWAGUCHI H., ENDO T., Coll. Polym. Sci., 285 (2007), 819.[8] KABANOV A.V., LEMIEUX P., VINOGRADOV S., ALAKHOV V., Adv. Drug Deliv. Rev., 54 (2002), 223.[9] HA J.C., KIM S.Y., LEE Y.M., J. Control. Release, 62 (1999), 381.[10] CHANDAROY P., SEN A., HUI S.W., J. Control. Release, 76 (2001), 27.[11] ZHANG Y., ZHU W., WANG B.B., YU L., DING J.D., J. Control. Release, 105 (2005), 260.[12] TORRES-LUGO M., PEPPAS N.A., Macromolecules, 32 (1999), 6646.[13] LIU Y.Y., LIU W.Q., CHEN W.X., SUN L., ZHANG, G.B.; Polymer, 48 (2007), 2665.[14] ZHU W., WANG B.B., ZHANG Y., DING J.D., Euro. Polym. J., 41 (2005), 2161.[15] WANG B.B., ZHU W., ZHANG Y., YANG Z.G., DING J.D; React. Funct. Polym., 66 (2006), 509.Received 6 June 2009
Materials Science-Pol<strong>and</strong>, Vol. 28, No. 1, 2010Influence <strong>of</strong> sol-gel matriceson the optical excitation <strong>of</strong> europium ionsM. BANSKI * , A. PODHORODECKI, J. MISIEWICZInstitute <strong>of</strong> Physics, Wrocław University <strong>of</strong> Technology,Wybrzeże Wyspiańskiego 27, 50-370 Wrocław, Pol<strong>and</strong>Photoluminescence (PL), total photoluminescence excitation (TPLE), transmission <strong>and</strong> decay photoluminescenceexperiments were done to establish the most efficient excitation mechanism <strong>of</strong> the europium(Eu 3+ ) ions in amorphous Al 2 O 3 <strong>and</strong> Y 3 Al 5 O 12 host matrices. Both matrices were fabricated usingthe sol-gel technique, doped with Eu 3+ ions <strong>and</strong> sputtered on a flat quartz plate. Because <strong>of</strong> relatively lowtemperatures <strong>of</strong> annealing (200 °C), after this treatment the matrices should remain in an amorphousphase. In such a system, Eu 3+ ions occupy the points having different site symmetries. However, based oncharacteristic features <strong>of</strong> the PL spectra, the effective site symmetry (ESS) parameter was defined todescribe the PL properties <strong>of</strong> the Eu 3+ ions in various matrices. Low intensive direct f-f transitions at 392,465, 530 nm were observed in the TPLE spectra. The most intensive, wide excitation b<strong>and</strong>s were centredat around 250–260 nm <strong>and</strong> the charge transfer process was found to be related to these excitation b<strong>and</strong>s.Finally, a good correlation between photoluminescence lifetimes, the PL intensity <strong>and</strong> CT energy wasobserved.Keywords: excitation mechanism; charge transfer; europium; amorphous matrix; photoluminescence1. IntroductionNowadays, one <strong>of</strong> the leading research areas is the investigation <strong>of</strong> new light sourceswith high emission efficiency, low power consumption, stability in various environments,characterised with simple method <strong>of</strong> fabrication <strong>and</strong> low production costs.In the last two decades, intensive investigations were performed with sol-gel materialsas potential host matrices for the optically active centres [10]. One <strong>of</strong> its mostimportant advantages <strong>of</strong> the sol-gel technology is the low cost. Another one is simplicity<strong>and</strong> the possibility <strong>of</strong> easily incorporating optical active centres (i.e., rare earthions) [2] into sol-gel <strong>and</strong> later depositing them onto various substrates (including porousmaterials) [3]. It is well know that PL efficiency <strong>of</strong> rare earth (RE) ions increases_________* Corresponding author, e-mail: mateusz.banski@pwr.wroc.pl
218M. BANSKI et al.with increasing non-centrosymmetricity <strong>of</strong> host crystals. In practice, a big challenge isto find a combination <strong>of</strong> substrate, matrix <strong>and</strong> RE ions such that photoluminescenceemission is enhanced.The advantage <strong>of</strong> RE ions is luminescence being related to the internal 4f orbitaltransitions. The screening <strong>of</strong> the internal 4f orbitals from the external environment bythe 5d orbital electrons provides the stability <strong>of</strong> the emission wavelength in variousexternal conditions. In addition, the emissions <strong>of</strong> different RE ions cover almost allvisible range <strong>of</strong> wavelengths. As a result, RE ions have already been found to havemany applications, e.g. in large-scale display screens, television sets, lasers <strong>and</strong> amplifiers[4]. However, 4f–4f transitions are in principle electric dipole forbidden accordingto Laporte’s rule, thus the RE ions have very small absorption cross sections,which limits their use in photo-activated systems [5]. Because <strong>of</strong> this limitation, inpractical applications RE ions have to be doped in a host material which plays the role<strong>of</strong> a sensitizer <strong>and</strong> increases the RE excitation efficiency.The main role <strong>of</strong> the matrix is to increase the efficiency <strong>of</strong> RE ion photoexcitationleading to the increase <strong>of</strong> the PL intensity from the ions. The PL intensity increases,because the crystal field slightly influences the 4f orbitals <strong>of</strong> RE which overlap <strong>and</strong>cause that forbidden electric dipole transitions become allowed. Thus, Laporte’s ruleno longer applies in the presence <strong>of</strong> the lattice. Simultaneously, the number <strong>of</strong> thepossible excitation mechanisms increases. For RE ions in the host matrix, there arefour various excitation mechanisms: direct excitation <strong>of</strong> the RE ions through 4f–4f <strong>and</strong>4f–5d transitions, <strong>and</strong> excitation through the matrix by charge transfer (CT), or energytransfer (ET). However, depending on the matrix properties (absorption coefficient,refractive index, RE ion site symmetry, etc.), different excitation mechanisms c<strong>and</strong>ominate. Thus, the determination <strong>of</strong> this mechanism is crucial from the point <strong>of</strong> view<strong>of</strong> excitation/emission optimization.From the application point <strong>of</strong> view, we expected that the ideal host material wouldbe transparent for the visible light, environmentally stable <strong>and</strong> not fragile. Only if allthese criteria are satisfied, the proposed solution will have a viable chance <strong>of</strong> becominga commercially available product.Y 3 Al 5 O 12 matrices in a crystalline form are already known to be excellent scintillators.The phosphors based on this material are widely used in cathode ray tubes, <strong>and</strong>field emission display technologies because <strong>of</strong> their optical emission intensity <strong>and</strong>long lifetime [6]. Besides the good environmental stability <strong>and</strong> high electrical resistivity,the main advantage <strong>of</strong> the Al 2 O 3 matrix is its ability to incorporate a high concentration<strong>of</strong> RE ions without clustering. This phenomenon is related to the cubic crystalstructure <strong>of</strong> the γ-Al 2 O 3 which is very similar to the RE 2 O 3 structure. This matrix cansignificantly enhance the RE 3+ fluorescence [7].Y 3 Al 5 O 12 <strong>and</strong> Al 2 O 3 matrices were prepared using the sol-gel technique [8]. Both<strong>of</strong> them were doped with Eu 3+ ions <strong>and</strong> sputtered on flat quartz plates. In order to reducethe cost <strong>of</strong> the production, the samples were annealed at relatively low temperatures<strong>and</strong> thus they remained in the amorphous phase.
Influence <strong>of</strong> sol-gel matrices on the optical excitation <strong>of</strong> europium ions 219Better information about the most efficient excitation mode will be crucial to producemore efficient <strong>and</strong> low power consuming devices. Thus, the aim <strong>of</strong> this work wasto investigate the influence <strong>of</strong> an amorphous sol-gel matrix, fabricated at low temperature,on the excitation mechanism <strong>of</strong> Eu 3+ ions. The results <strong>of</strong> the photoluminescence(PL), the total photoluminescence excitation (TPLE), as well as the transmittancemeasurements <strong>and</strong> PL decay have been presented.2. ExperimentalIn the experiment, two samples were investigated. They were prepared using differentsol-gel compounds as the matrix material, i.e. Al 2 O 3 , Y 3 Al 5 O 12 (YAG). To obtainsol-gel matrices doped with europium ions, the following compositions wereused: Al 2 O 3 :Eu 3+ (30 wt. % <strong>of</strong> Eu 2 O 3 , 70 wt. % Al 2 O 3 ), YAG:Eu 3+ (Eu 0,15 Y 2,85 Al 5 O 12 ).The exact preparation procedure has already been described elsewhere [8, 9]. The solgelderived xerogel films (matrices) were fabricated by spin-on deposition at the rate<strong>of</strong> 2700 rpm onto flat quartz substrates, followed by drying at 200 °С for 30 min[10, 11]. Finally all the just-prepared samples were heated at 200 °C.The experimental setup consisted <strong>of</strong> a 450 W Xenon lamp, Jobin Yvon TRIAX180 monochromator, OceanOptics HR4000 CCD detector. The incident light, in therange from 210 to 500 nm, coming from a monochromator, was focused on the sample.The photoluminescence signal was collected <strong>and</strong> transmitted with the fibre opticdevice to the CCD detector. The setup for transmission measurements were based ona broadb<strong>and</strong> light source – a deuterium tungsten halogen lamp. The luminescencelifetimes were measured with the equipment made by the Photon International Instruments,where the flash halogen lamp was used as a pulse source. The wavelength <strong>of</strong>the incident light was chosen by the monochromator. The second monochromatordispersed the signal recorded by a photomultiplier tube. All the measurements weredone at room temperature.3. Results <strong>and</strong> discussionFigure 1 shows PL spectra <strong>of</strong> Al 2 O 3 :Eu 3+ <strong>and</strong> Y 3 Al 5 O 12 :Eu 3+ samples excited withthe wavelength in the maximum <strong>of</strong> the excitation b<strong>and</strong>. The recorded spectrum exhibitsfeatures characteristic <strong>of</strong> the RE ion 4f–4f intrashell transitions. Four emissionb<strong>and</strong>s related to transition from the lowest excited state ( 5 D 0 ) to the ground state ( 7 F 1 ,7 F 2 , 7 F 3 <strong>and</strong> 7 F 4 ) are clearly resolved at the 593, 613, 650 <strong>and</strong> 701 nm, respectively.The 5 D 0 – 7 F 2 transition gives the most intensive emission peak in the spectrum, becauseit is the most probable transition as it is the electric dipole transition [12]. Luminescencefrom the higher excited states such as 5 D 1 is not observed at all, indicatingvery efficient non-radiative (multiphonon) relaxation to the 5 D 0 level [13]. The mostintensive Eu-related photoluminescence is found for the Y 3 Al 5 O 12 matrix. At this
220M. BANSKI et al.point, a question arises which factors influence the emission. The underst<strong>and</strong>ing <strong>of</strong>these factors enables us to control the excitation properties <strong>of</strong> the Eu 3+ ions in a sol-gelmatrix.Fig. 1. The PL spectra <strong>of</strong> various sol-gel matrices doped by Eu 3+ on the quartz substrateexcited at the maximum <strong>of</strong> the excitation b<strong>and</strong>. The inset shows the intensity ratio<strong>of</strong> the 5 D 0 → 7 F 2 <strong>and</strong> 5 D 0 → 7 F 1 <strong>and</strong> FWHM <strong>of</strong> 5 D 0 → 7 F 2 transitionThe emission efficiency <strong>of</strong> the RE ions depends on four factors, if they are excitednon resonantly: absorption <strong>of</strong> the matrix, excitation energy transfer, emission properties<strong>of</strong> the ions <strong>and</strong> relaxation within an ion. First, the emission properties <strong>of</strong> the REions in two different matrices based on aluminum oxide is presented. Like the absorption,the first order emission among 4f orbitals is also forbidden by electric dipoles butit is allowed by the electric quadrupole, vibronic, magnetic dipole <strong>and</strong> forced electricdipole mechanisms. However, only the last two cases can be related to the observedemission intensities. From the experimental point <strong>of</strong> view, it was found that the emissionefficiency <strong>of</strong> the ion itself depends strongly on the local symmetry <strong>of</strong> the ion site,<strong>and</strong> also on the energy difference between the excited 4f configuration <strong>and</strong> the 4f n–1 5dor CT state.The crystal field <strong>of</strong> the host material influences not only the emission intensityfrom RE ions, but it also splits their ground energy levels. Because <strong>of</strong> that, few separatelines related to different transition could be observed <strong>and</strong> their number depends onthe symmetry <strong>of</strong> the ion site in the matrix. In a less centrosymmetric system, the crystallattice causes the energy levels <strong>of</strong> Eu 3+ ions to split into a higher number <strong>of</strong> sublevels<strong>and</strong> the breadth <strong>of</strong> the emission peak increases [12]. However, in our PL spectra
Influence <strong>of</strong> sol-gel matrices on the optical excitation <strong>of</strong> europium ions 221it is impossible to distinguish these separate lines. They are observed as one peak ataround 612.5 <strong>and</strong> 615.9 nm, with the FWHM parameter equal to 14.7 <strong>and</strong> 18.4 nm forAl 2 O 3 <strong>and</strong> Y 3 Al 5 O 12 matrices, respectively. The observed inhomogeneous broadeningis due to many site symmetries <strong>of</strong> the crystal structure, which can be occupied by theEu 3+ ions in an amorphous matrix, <strong>and</strong> it can be additionally enhanced by the latticedefects <strong>and</strong> contamination <strong>of</strong> the hydrous species. This is characteristic <strong>of</strong> the sol-gelstructures annealed at low temperatures. They are like a disordered structure witha wide inhomogeneous broadening, like in glass [14].As was already mentioned, in the amorphous phase it is impossible to determinethe site symmetry <strong>of</strong> the Eu 3+ incorporated into the matrix. However, the measured PLspectra exhibit different properties <strong>of</strong> the Eu 3+ ions incorporated into various matrices.This fact allows us to determine the effective site symmetry (ESS) parameter, whichdescribes not exactly the site symmetry <strong>of</strong> the ions in the crystal structure, but ratherthe response <strong>of</strong> the Eu 3+ ions to the influence <strong>of</strong> average crystal field.To determine the order <strong>of</strong> ESS <strong>of</strong> the Eu 3+ incorporated into various matrices, theintensity ratio I 2 ( 5 D 0 → 7 F 2 )/I 1 ( 5 D 0 → 7 F 1 ) which serves as an effective spectroscopicprobe could be used. The sensitivity <strong>of</strong> the intensity transition ratio (I 2 /I 1 ) arises fromthe fact that the 5 D 0 → 7 F 1 transition is mainly magnetically allowed (i.e., it is a magnetic-dipoletransition) <strong>and</strong> is independent <strong>of</strong> the site symmetry at which any Eu 3+ ionis situated [15], while the 5 D 0 → 7 F 2 transition is a hypersensitive, forced electricdipoletransition which can occur only at low symmetries with no inversion centre [14].Thus, the higher the I 2 /I 1 ratio, the lower the effective site symmetry (ESS = I 1 /I 2 ) [16].In our case, the intensity ratio I 2 /I 1 increases <strong>and</strong> thus the ESS decreases from Al 2 O 3 toY 3 Al 5 O 12 (inset <strong>of</strong> Fig. 1).In addition, the information about centrosymmetry features <strong>of</strong> the matrices can bededuced also from FHWM parameters <strong>of</strong> the 5 D 0 → 7 F 2 transition (inset <strong>of</strong> Fig. 1).The obtained results indicate that inhomogeneous broadening increase from Al 2 O 3 toY 3 Al 5 O 12 , so the ESS at which the Eu 3+ ions are incorporated into the matrices has todecrease. It is in the good agreement with our previous result.To deeper analyze the excitation properties <strong>of</strong> Eu 3+ ions embedded in the matrix, thetotal photoluminescence excitation (TPLE) map was measured <strong>and</strong> the results are shownin Fig. 2. Figure 2a shows the 2D map <strong>of</strong> PL intensity for the Y 3 Al 5 O 12 :Eu 3+ sample infunction <strong>of</strong> both, the excitation <strong>and</strong> the emission wavelength. The 5 D 0 → 7 F 1 , 5 D 0 → 7 F 2 ,5 D 0 → 7 F 3 , 5 D 0 → 7 F 4 , optical transitions are well resolved <strong>and</strong> the most efficient excitationwavelength is indicated. The PLE spectra recorded for the most intensive5 D 0 → 7 F 2 transitions <strong>of</strong> Eu 3+ in the Al 2 O 3 , Y 3 Al 5 O 12 matrices are plotted in Fig. 2b.The analysis <strong>of</strong> those spectra allows us to confirm or reject the suggestion that the sol--gel matrix is responsible for the efficient excitation <strong>of</strong> Eu 3+ ions since obtainedmaxima vary with material <strong>of</strong> the matrix in which the Eu 3+ ions are doped. Nevertheless,coming from a longer wavelength, there is a very weak absorption b<strong>and</strong> (530 nm)at the PLE spectra <strong>of</strong> all the samples, related to direct excitation <strong>of</strong> europium ions byf–f transition. At 465 nm there is another optical transition related to direct excitation
222M. BANSKI et al.<strong>of</strong> Eu 3+ on the first excited term 7 F 0 → 5 D 2 . The excitation on the upper term 7 F 0 → 5 L 6takes place for the photons with 392 nm wavelength [16]. However, the main excitationpeaks for A l2 O 3 <strong>and</strong> Y 3 Al 5 O 12 are at 249 <strong>and</strong> 261 nm, respectively.Fig. 2. TPLE map <strong>of</strong> the Y 3 Al 5 O 12 :Eu 3+ on a quartz plate (a), <strong>and</strong> the PLE<strong>and</strong> transmittance spectra <strong>of</strong> Al 2 O 3 , Y 3 Al 5 O 12 matrices doped by Eu 3+ on quartzTo analyze the influence <strong>of</strong> the energy transfer (ET) on the Eu 3+ excitation, transmissionspectra have been collected for both samples. The transmission experimentgives an effective matrix response, <strong>and</strong> at low Eu 3+ concentration it is not possible toacquire any information about the Eu 3+ absorption properties. For the samples fabricatedwith Al 2 O 3 <strong>and</strong> Y 3 Al 5 O 12 matrices, results presented in Fig. 2b confirm thatthose materials have a high energy gap (Eg) <strong>and</strong> the light almost does not interact withthese matrices in the investigated wavelength range. The transmittance <strong>of</strong> such structuresis over 80% even for the photons <strong>of</strong> energy 6.0 eV, as the energy gaps equal6.6 eV for Al 2 O 3 [18] <strong>and</strong> 6.44 for Y 3 Al 5 O 12 [19]. It is clear that the ET from the matrixto Eu 3+ is not involved in the excitation <strong>of</strong> the ions, since the b<strong>and</strong> gap is far fromthe energy levels <strong>of</strong> the Eu 3+ ions <strong>and</strong> no evidence <strong>of</strong> the defect states have beenfound. Thus, we suggest that the charge transfer (CT) transition or direct excitation <strong>of</strong>
Influence <strong>of</strong> sol-gel matrices on the optical excitation <strong>of</strong> europium ions 223Eu 3+ ions, by f–d transition is responsible for efficient Eu 3+ excitation in the case <strong>of</strong>Al 2 O 3 <strong>and</strong> Y 3 Al 5 O 12 matrix. Moreover, since the absorption <strong>of</strong> the matrices is close tozero in the investigated range <strong>and</strong> the recombination <strong>of</strong> the ion itself does not dependon the excitation wavelength, the PLE spectra therefore correspond directly to theexcitation efficiency <strong>of</strong> the Eu 3+ ions.The proposed mechanism responsible for the main excitation b<strong>and</strong> is a direct f–dtransition. The theory proposed by Nakazawa [20] makes it possible to establish theenergy position <strong>of</strong> the lowest f–d transition, which for Eu 3+ ion was determined as7.94 eV (156 nm). Unfortunately, this result lies outside the scope <strong>of</strong> our investigationhere, but certainly it is not the source <strong>of</strong> the observed excitation b<strong>and</strong>s.In the high-energy part <strong>of</strong> the optical spectra <strong>of</strong> f-compounds, not only f–d butalso CT transitions give raise to strong absorption b<strong>and</strong>s. The CT follows the transition<strong>of</strong> the electron from 2p full orbit O 2– , which energetically belongs to the top <strong>of</strong> thevalence b<strong>and</strong>, to a charge transfer state (CTS) <strong>of</strong> the trivalent RE ion, resulting in REtransition to a divalent form. As a result, the CT appears as an intense <strong>and</strong> wide b<strong>and</strong>in absorption, <strong>and</strong> excitation spectra due to a spin <strong>and</strong> dipole allowed transition [21].The stimulated emission process is not reversible. The Eu 3+ ions are joined to the matrix,thus the electron comes back from CT state to its initial ion by transferring itsenergy to the Eu 3+ . Eu 3+ is stimulated to the 5 D J (J = 0, 1) state from which the intra 4forbital emission takes place. As was shown by Carnall [22], f–d <strong>and</strong> CT b<strong>and</strong>s maylargely overlap <strong>and</strong> their assignment is quite difficult <strong>and</strong> even impossible without thehelp <strong>of</strong> calculations. However, based on the Jørgensen formula [23], CT energy relativeto the Eu 3+ ground state in oxides is expected to be ca. 5.39 eV (λ ≈ 230 nm).Among the lanthanide series, Eu 3+ <strong>and</strong> Yb 3+ have the highest optical electronegativity, thusmuch lower CT state due to the higher electron affinity <strong>of</strong> f 6 <strong>and</strong> f 13 electronic configurations.In the more advanced Nakazawa approach [20], the established transition energytakes into account many electron effects <strong>and</strong>, for the O 2– –Eu 3+ charge transfer excitation,the energy was calculated as corresponding to 227 nm. However, both estimated values <strong>of</strong>the charge transfer energy are far away from our measured values.To explain the difference in the CT energy for the investigated matrices, the environment<strong>of</strong> the ions has to be taken into account. It has been already shown that theCT absorption b<strong>and</strong> position depends on the covalence <strong>of</strong> matrix bonds. Hoefdraad[25] reported that the longer the bond length <strong>of</strong> Eu lig<strong>and</strong>, the longer the wavelength<strong>of</strong> the CT b<strong>and</strong> position. Also other possible factors, i.e. the covalence or ionicity,the coordinate number, the potential field <strong>of</strong> the coordinate ions, the st<strong>and</strong>ardcation oxidation potential were identified as the factors influencing the position <strong>of</strong> theCT b<strong>and</strong> [26]. As a result, the charge transfer position is sensitive to the ion environment<strong>and</strong> it can vary from matrix to matrix over a broad range. Dorenbos [27] showedthat possible CT energy is in the range from 3.3 to 6.5 eV. The empirical formula proposedby Ling Li et al. [26] describes the relationship between CT energies <strong>and</strong> environmentalfactors, based on the dielectric theory <strong>of</strong> complex crystals. They introduced<strong>and</strong> calculated the environmental factor (h e ) for many crystal matrices to describe their
224M. BANSKI et al.influence on the optical properties <strong>of</strong> Eu 3+ ions. For example, h e <strong>of</strong> Y 3 Al 5 O 12 is equalto 0.733 <strong>and</strong> the related CT energy is 5.54 eV (223 nm). However, this environmentalfactor is established for the fully crystallized Y 3 Al 5 O 12 matrix, where all the Eu 3+ ionsusually occupy the dodecahedral c site with D 2 symmetry [6]. In our case, the sol-gelmatrices are in the amorphous phase. Thus, Eu 3+ ions are substituted at many sites inthe host materials, which leads to much broader charge transfer b<strong>and</strong>s, which are redshifted in the PLE spectra, because <strong>of</strong> the weaker chemical bond Eu 3+ –O 2– , comparedwith the crystallized matrix. The values <strong>of</strong> the CT energies obtained from PLE spectra<strong>of</strong> Al 2 O 3 :Eu 3+ <strong>and</strong> Y 3 Al 5 O 12 are 4.98 eV <strong>and</strong> 4.75 eV, respectively. As we expected,the observed CT energy for Y 3 Al 5 O 12 is slightly lower than the CT energy in crystallizedmatrix (5.54 eV) [26].To the best <strong>of</strong> our knowledge, the CT energy in Al 2 O 3crystal has not been determined so far. Finally, the CT is considered to be responsiblefor the efficient excitation mechanism <strong>of</strong> the Eu 3+ ions in all the investigated matrices.CT states influence the emission properties <strong>of</strong> Eu 3+ ions as well. The closer the CTstate is to the 4f orbitals, the more intensive the spin-orbit interaction between them<strong>and</strong> the more intensive the emission related to electric dipole transition. This expectationis in good agreement with our samples containing the Al 2 O 3 <strong>and</strong> Y 3 Al 5 O 12 matrices.The first matrix has higher CT energy (4.98 eV) <strong>and</strong> lower intensity <strong>of</strong> the5 D 0 – 7 F 2 transition (1.0 a.u.). For the latter matrix, the CT state is closer to 4f orbitals(4.75 eV) <strong>and</strong> higher intensity <strong>of</strong> the 5 D 0 – 7 F 2 transition (12.8 a.u.) is observed.To fully characterize the properties <strong>of</strong> our samples required for the phosphorousmaterial, the photoluminescence lifetimes were measured. PL delay related to the5 D 0 – 7 F 2 (at 615 nm) transitions were observed for both samples, which were excitedby the wavelength <strong>of</strong> the maximum <strong>of</strong> the excitation b<strong>and</strong>, i.e. 249 <strong>and</strong> 260 nm forAl 2 O 3 <strong>and</strong> Y 3 Al 5 O 12 , respectively. The decay time <strong>of</strong> the Eu 3+ ions depends mainly onthe surrounding crystal field, <strong>and</strong> can change in a wide range, from several microsecondsto milliseconds, when the ions are doped in various host materials (i.e. 4.0 ms forY 3 Al 5 O 12 ) [28]. However, photoluminescence lifetime depends also on the excitationmechanism <strong>and</strong> non-radiative processes. Dai et al. [29] showed also that Eu 3+ photoluminescencelifetime depends strongly on the ion concentration <strong>and</strong> he observed anexponential decrease from 162 to 32 μs. This decrease was attributed to the increase inthe non-radiative relaxation rates due to the cross relaxation process among the Eu 3+ions. This decrease was more significant for the ions in the surrounding with moredefected state. Knowing that our samples are in amorphous phase <strong>and</strong> the doping concentrationis relatively high (30%), we expected that the observed photoluminescencelifetime would be relatively short. Figure 3 shows the PL decay for our samples withfitted theoretical curves. For both the samples, a fast recombination process witht = 10 μs was observed, however, the intrinsic properties <strong>of</strong> the setup were found to bethe cause <strong>of</strong> it. For samples with Al 2 O 3 <strong>and</strong> Y 3 Al 5 O 12 matrices, long lifetimes weredetermined as τ 1CT = 120 μs <strong>and</strong> τ 2CT = 328 μs. The discovered lifetimes confirm previousresults, stating that the smaller CT energy, the stronger the interaction <strong>of</strong> the CT
Influence <strong>of</strong> sol-gel matrices on the optical excitation <strong>of</strong> europium ions 225state with 4f orbitals <strong>and</strong> the higher the observed PL intensity in the steady-state condition,which are related to the long lifetime emission.Fig. 3. PL decay spectra <strong>of</strong> 5 D 0 – 7 F 2 transition in Y 3 Al 5 O 12 :Eu 3+ (a) <strong>and</strong> Al 2 O 3 :Eu 3+ (b)samples excited at the maximum <strong>of</strong> PLE spectra (260 <strong>and</strong> 249 nm, respectively)In Table 1, the PL <strong>and</strong> PLE intensity data have been summarized <strong>and</strong> comparedwith the reciprocal <strong>of</strong> the ESS parameter, the CT position <strong>and</strong> the photoluminescencelifetime. The agreement between the values <strong>of</strong> these parameters <strong>and</strong> the theory wasfound, which asserts that the efficiency <strong>of</strong> rare earth ion excitation increases as thecentrosymmetricity <strong>of</strong> the ion environment decreases.Table 1. PL, PLE intensities, ESS –1 parameter, CT position <strong>and</strong> photo-luminescence lifetimeSamplePL[a.u.]PLE[a.u.]ESS –1CT[eV]τ PL[μs]Al 2 O 3 :Eu 3+ 1 1 6 4.98 120Y 3 Al 5 O 12 :Eu 3+ 12.4 12.4 86 4.75 3284. ConclusionsEu 3+ ions doped into an amorphous host material were proved to be effective lightemitters. The samples were fabricated using the inexpensive sol-gel technology inconjunction with a low-cost after-treatment process. In the investigations, the f–f transitionswere observed to be responsible for the intensive PL emission <strong>of</strong> Eu 3+ ions in
226M. BANSKI et al.any matrix. The ESS parameter was determined to describe the influence <strong>of</strong> the crystalfield on the emission <strong>of</strong> Eu 3+ ions in the amorphous matrix. It was found that the broadexcitation b<strong>and</strong> related to CT is responsible for efficient ion excitation, which gives usmore flexibility in inducing efficient Eu 3+ excitation. The knowledge <strong>of</strong> the origin <strong>of</strong>the excitation mechanism is important because various excitation mechanisms undergodifferent quenching processes, which can be optimized to influence the efficiency<strong>of</strong> the emitters.AcknowledgementThe authors would like to thank to N.V. Gaponenko <strong>and</strong> G. K. Maliarevich from the Belarusian StateUniversity <strong>of</strong> Informatics <strong>and</strong> Radioelectronics (Minsk, Belarus) for the delivered samples. Moreover,one <strong>of</strong> the authors (A.P.) acknowledges financial support from the from fellowship co-financed by EuropeanUnion within the European Social Fund <strong>and</strong> financial support from the Foundation for PolishScience within the START programme.References[1] KIM T., YOON Y., HWANG Y., CHUNG H., KIM I.H., AHN Y., Mater. Lett., 47 (2001), 290.[2] MOLCHAN I.S., GAPONENKO N.V., KUDRAWIEC R., MISIEWICZ J., THOMPSON G.E., Mater. Sci. Eng. B,105 (2003), 37.[3] KUDRAWIEC R., MISIEWICZ J., BRYJA L., MOLCHAN I.S., GAPONENKO N.V., J Alloys Compd., 341(2002), 211.[4] WITTMANN H.F., GRUNER J., FRIEND R.H., SPENCER G.W.C., MORATTI S.C., HOLMES A.B., Adv. Mater.,7 (1995), 541.[5] KENYON A.J., Prog. Quant. Electron., 26 (2002), 225.[6] RAVICHADRAN D., ROY E., CHAKHOVSKOI A.G., HUNT C.E., WHITE W.B., ERDEI S., J. Lumin.,71 (1997), 291.[7] MAEDA N., WADA N., ONODA H., MAEGAWA A., KOJIM K., Opt. Mater., 27 (2005), 1851.[8] MALIAREVICH G.K., GAPONENKO N.V., MUDRYI A.V., DROZDOV Y.N., STEPIKHOVA M.V.,STEPANOVA E.A., Semiconductors, 43 (2009), 158.[9] MOLCHAN I.S., GAPONENKO N.V., KUDRAWIEC R., MISIEWICZ J., BRYJA L., THOMPSON G.E.,SKELDON P., J. Alloys. Compd., 341 (2002), 251.[10] MOLCHAN I.S., GAPONENKO N.V., KUDRAWIEC R., MISIEWICZ J., THOMPSON G.E., SKELDON P.,J. Electrochem. Soc., 151 (2004), H16.[11] GAPONENKO N.V., MOLCHAN I.S., SERGEEV O.V., THOMPSON G.E., PAKES A., SKELDON P.,KUDRAWIEC R., BRYJA L., MISIEWICZ J., PIVIN J.C., HAMILTON B., STEPANOVA E.A., J. Electrochem.Soc., 149 (2002), H49.[12] WALSH B.M., Judd–Ofelt Theory: Principles <strong>and</strong> Practices, [In:] B. di Bartolo, O. Forte (Eds.),Advances in Spectroscopy for Lasers <strong>and</strong> Sensing, Springer, New York, 2006, p. 403.[13] BUNZLI J.-C.G., Rare Earth Luminescence Centres in Organic <strong>and</strong> Biochemical Compounds, [In:]G. Liu, B. Jacquier (Eds.), Spectroscopic Properties <strong>of</strong> Rare Earths in Optical Materials, Springer,New York, 2005, p. 462.[14] HARADA M., GOTO M., J. Alloys. Compd., 408–412 (2006), 1193.[15] PENG A., XIE E., JIA C., JIANG R., LIN H., Mater. Lett., 59 (2005), 3866.[16] ZHAO Z., ZENGA Q.G., ZHANGA Z.M., DING Z.J., J. Lumin., 122 (2007), 862.[17] ZHU Y., DING C., J. Solid State. Chem., 139 (1998), 124.[18] SHIIKI K., IGARASHI M., KAIJYU H., Jpn. J. Appl. Phys., 42 (2003), 5185.
Influence <strong>of</strong> sol-gel matrices on the optical excitation <strong>of</strong> europium ions 227[19] XU Y.N., CHING W.Y., Phys. Rev. B, 59 (1999), 10530.[20] NAKAZAWA E., J. Lumin., 100 (2002). 89.[21] YU O., LIU Y., WU S., LU X., HUANG X., LI X., J. Rare Earth, 26 (2008), 783.[22] CARNALL W.T., J. Less Common Met., 122 (1986), 1.[23] KRUPA J.C., J. Solid State Chem., 178 (2005), 483.[24] YAVETSKIY R., DUBOVIK M., TOLMACHEV A., TARASOV V., Phys. Stat. Sol. (c), 2 (2005), 268.[25] HOEFDRAAD H.E., J. Solid State Chem., 15 (1975), 175.[26] LI L., ZHANG S., J. Phys. Chem. B, 110 (2006), 21438.[27] DORENBOIS P., J. Phys-Condens. Mater., 15 (2003), 8417.[28] CHEN X.Y., LIU G.K., J. Solid State Chem., 178 (2005), 419.[29] DAI Q., SONG H., WANG M., BAI X., DONG B., QIN R., QU X., ZHANG H., J. Phys. Chem. C, 112(2008), 19399.Received 10 August 2009
Materials Science-Pol<strong>and</strong>, Vol. 28, No. 1, 2010First principles study on the improved dehydrogenatingproperties <strong>of</strong> MgH 2 systems with metal fluoridesD.W. ZHOU 1* , J.S. LIU 2 , S.H. XU 2 , G.Y. CHEN 11 State Key Laboratory <strong>of</strong> Advanced Design <strong>and</strong> Manufacturing for Vehicle Body,Hunan University, Changsha 410082, P.R. China2 School <strong>of</strong> Materials Science <strong>and</strong> Engineering, Hunan University, Changsha 410082, P.R. ChinaEnergies <strong>and</strong> electronic structures <strong>of</strong> MgH 2 systems were determined from the first principles calculationsto explain the improving <strong>of</strong> their dehydrogenating properties by addition <strong>of</strong> metal fluorides ascatalysts. These calculations show that a Mg vacancy can improve the thermodynamics <strong>of</strong> MgH 2 systems<strong>and</strong> Mg atom replaced for Fe, Ti, Zr, V, Ni, Nb, Cr, Cu is energetically more favourable than formation <strong>of</strong>Mg vacancies at lower temperatures. Calculations <strong>of</strong> density <strong>of</strong> states (DOS) provide a particularly goodexplanation for a close agreement between the experimental results <strong>and</strong> theoretical predictions for improvementsto the dehydrogenation kinetics <strong>of</strong> MgH 2 systems for NiF 2 , NbF 5 , ZrF 4 used as the catalysts.Keywords: MgH 2 ; density functional theory; dehydrogenating properties1. IntroductionMagnesium hydride (MgH 2 ) is a promising material for hydrogen storage applications,as it has high gravimetric (7.6 wt. %) <strong>and</strong> volumetric (110 kg·m –3 ) densities.Moreover, its reversibility <strong>and</strong> cycle performance are quite good compared with otherbinary <strong>and</strong> complex hydrides <strong>of</strong> I <strong>and</strong> II groups. However, magnesium hydride hasa high dissociation temperature <strong>and</strong> relatively high thermal stability, resulting in itsslow re-hydrogenation <strong>and</strong> de-hydrogenation kinetics. This therefore limits its practicalapplication as a good hydrogen storage material.The kinetics <strong>of</strong> sluggish hydrogenation was found to be significantly improved byfabricating fine <strong>nanocrystalline</strong> Mg particles, by the mechanical alloying method[1, 2]. Although a high desorption temperature still remains a problem to be solved,the mechanical alloying <strong>of</strong> MgH 2 <strong>and</strong> 3d transition metals (Ni, Co, Mn, Cu, Ti, Fe, V,etc. [3, 4]), 3d non-transition metals (Ge, Nb, etc. [3, 5]), intermetallic compounds_________* Corresponding author, e-mail: ZDWe_mail@yahoo.com.cn
230D.W. ZHOU et al.(LaNi 5 , FeTi, ZrFe 1.4 Cr 0.6 , etc. [6–8]), metal oxides (Nb 2 O 5 , Fe 3 O 4 , etc [9]), effectivelyimprove the hydriding <strong>and</strong> dehydrogenating kinetics <strong>of</strong> MgH 2 at high temperatures.Recently, Jin et al. [10] systematically investigated various metal fluorides (such asFeF 2 , NiF 2 , TiF 3 , NbF 5 , CuF 2 , VF 4 , ZrF 4 , CrF 2 , etc.) <strong>and</strong> their catalytic effect on thedehydrogenation <strong>and</strong> hydrogenation characteristics <strong>of</strong> MgH 2 powder. They have foundthat metal fluorides are the most suitable catalysts for the re/dehydrogenation <strong>of</strong>MgH 2 . They ranked the following in order <strong>of</strong> increasing catalytic performance: CuF 2 ,CrF 2 , ZrF 4 , FeF 2 , NbF 5 , VF 4 , TiF 3 , NiF 2 .Some considerable experimental <strong>and</strong> theoretical investigations have been performedon the improved dehydrogenating properties <strong>of</strong> MgH 2 systems. Based onX-ray scattering measurements <strong>and</strong> phase structural change analysis, Pelletier et al. [9]suggested that the improved kinetics in Nb doped MgH 2 is due to the formation <strong>of</strong>niobium hydride, which leads to the nucleation <strong>of</strong> the α-Mg at the β-NbH/β-MgH 2interface. Song et al. [11], Shang et al. [3] <strong>and</strong> Li et al. [12] calculated the total energy<strong>and</strong> electronic structure <strong>of</strong> MgH 2 solid solution in order to study the mechanism <strong>of</strong> theimprovement to the dehydrogenating properties <strong>of</strong> MgH 2 systems with metal elements(Al, Ti, Fe, Ni, Cu, Nb, etc.) <strong>and</strong> metal oxides (Nb 2 O 5 , etc.). In the examined group,the energy <strong>and</strong> electronic structure <strong>of</strong> the adsorption <strong>of</strong> H 2 on a clean, vacancy defectiveMg(0001) surface <strong>and</strong> iron alloying MgH 2 were calculated by using the first principlesplane-wave pseudopotential method. The improved properties <strong>of</strong> MgH 2 systemsare also analyzed with respect to the milling process <strong>and</strong> iron addition [13]. Moreover,based on the energy calculations <strong>of</strong> VH 0.81 phase, <strong>and</strong> the design <strong>and</strong> exploitation <strong>of</strong>a VH/MgH 2 interface model, the vanadium alloying effects on the dehydrogenatingproperties [14] <strong>and</strong> diffusion <strong>and</strong> adsorption <strong>of</strong> H atoms [15] <strong>of</strong> MgH 2 –V system havebeen investigated [15].Jin et al. [10] investigated the catalytic performance <strong>of</strong> different metal fluorides onMgH 2 , <strong>and</strong> they concluded that NiF 2 performed best. Nevertheless, it is still not clearhow these chemically different additives promote the dehydrogenation <strong>and</strong> hydrogenationreactions <strong>of</strong> MgH 2 . As for as the improved dehydrogenating properties <strong>of</strong> MgH 2systems with NiF 2 are concerned, MgF 2 <strong>and</strong> Mg 2 NiH 4 are detected in the reactionproducts during high-energy milling process, as reported by Jin et al. [10]. It is believedthat MgF 2 <strong>and</strong> Mg 2 NiH 4 form by the following displacement reaction:NiF 2 + 3MgH 2 = MgF 2 + Mg 2 NiH 4 . One could assume that MgF 2 formation is causedby the Mg atom <strong>of</strong> MgH 2 <strong>and</strong> the F atom <strong>of</strong> NiF 3 , thus some Mg vacancies which remainin the sample, may affect desorption <strong>of</strong> hydrogen. If an Ni atom <strong>of</strong> NiF 3 replacesa Mg atom <strong>of</strong> MgH 2 , it forms (Mg,Ni)H x solid solution, which can be changed intoMg 2 NiH 4 hydrides, thus the electronic structure <strong>of</strong> the considered systems is locallychanged. Hence, both Ni substitution <strong>and</strong> Mg vacancies have an effect on the dehydrogenatingproperties <strong>of</strong> MgH 2 systems.Based on the above analysis, in the present work, the bonding distance change forMg–H <strong>and</strong> Ni–H, the energy to remove H atoms <strong>and</strong> electronic structure <strong>of</strong> MgH 2systems have been calculated by using the Dmol 4.1 program based on the density
Dehydrogenating properties <strong>of</strong> MgH 2 systems with metal fluorides 231functional theory. The improved properties <strong>of</strong> MgH 2 systems with metal fluorides(NiF 2 , TiF 3 , VF 4 , NbF 5 ,FeF 2 , ZrF 4 , etc.) have also been analyzed, some new results areexpected to be <strong>of</strong> theoretical guidance for designing advanced magnesium-based hydrogenstorage materials.2. Models <strong>and</strong> method <strong>of</strong> computationThe energy <strong>and</strong> electronic structure <strong>of</strong> MgH 2 systems with metal fluorides wereinvestigated by constructing 2×2×2 supercell models consisting <strong>of</strong> 48 atoms (Mg 16 H 32 )(Fig. 1a) [12]. Here, the lattice parameters <strong>of</strong> MgH 2 with a tetragonal symmetry(P4/mnm, group No.136) are a = 0. 4501 nm <strong>and</strong> c = 0.3010 nm [11].Fig. 1. Supercell model: a) Mg 16 H 32, b) Mg 15 XH 32 (X = Ni, Ti, V, Nb, Fe, Zr, Cr, Cu), c) Mg 15 H 32To simulate element substitution or a vacancy at the Mg 2a site (0.5, 0.5, 0.5), weconsidered Mg 15 XH 32 (X = Ni, Ti, V, Nb, Fe, Zr, Cr, Cu, Fig. 1b) <strong>and</strong> Mg 15 H 32 (Fig. 1c)supercell models, respectively. In the present work, the optimized structure, the totalenergy <strong>and</strong> electronic structure calculations are performed by the the DMol 3 package,which is based on density functional theory (DFT). The PWC [16] exchangecorrelation functional is adopted for LDA correction [17]. Sampling <strong>of</strong> the irreduciblewedge <strong>of</strong> the Brillouin zone is performed with a regular Monkhorst–Pack grid <strong>of</strong> specialk-points [18]. The positions <strong>of</strong> selected atoms in the structures are relaxed to getthe final structure with minimum total energy. The convergence criteria <strong>of</strong> optimizationare 1.0×10 –5 Ha, 0.004 Ha/Å <strong>and</strong> 0.005 Å for energy, gradient <strong>and</strong> atomic displacement,respectively. To assess the accuracy <strong>of</strong> the method as well as <strong>of</strong> the computationalmodels, a series <strong>of</strong> calculations has been performed on the bulk properties<strong>of</strong> the hcp-Mg <strong>and</strong> H 2 molecules correlated with the MgH 2 supercell models. In Table 1,the calculated equilibrium lattice constants a, c are listed, <strong>and</strong> c/a <strong>of</strong> hcp-Mg bulk, thebond length (d H–H ) <strong>of</strong> a free H 2 molecule as well as their cohesive energies (E tot ). The
232D.W. ZHOU et al.equilibrium lattice constants a, c <strong>and</strong> c/a <strong>of</strong> hcp-Mg bulk are estimated to be0.31751 nm, 0.51504 nm <strong>and</strong> 1.6240, respectively; this is in good agreement with theexperimental values [19] <strong>and</strong> other calculations [20], <strong>and</strong> the error <strong>of</strong> the c/a ratio,calculated here relative to the experimental result, is only 0.06%. The bond length <strong>of</strong>a free H 2 molecule is calculated to be 0.07490 nm, which gives a relative error <strong>of</strong> only1.08% compared with the experimental value [21]. Meanwhile, their calculated cohesiveenergies (E tot ) are also close to the experimental data [19] <strong>and</strong> other calculateddata [20]. Thus, the geometrical <strong>and</strong> electronic structures <strong>of</strong> the MgH 2 supercell modelshave been calculated the same conditions.Table 1. The calculated equilibrium lattice constants a, c <strong>and</strong> c/a <strong>of</strong> hcp-Mg bulk,the bond length d H–H <strong>of</strong> a free H 2 molecule as well as their cohesive energies E cohSourceEquilibrium lattice constantsa/nm c/nm c/ahcp-Mg H 2E coh/(eV·atom –1 )Bondlength/nmE coh/(eV·atom –1 )Present work 0.31751 0.51504 1.6240 1.4942 0.07490 4.5502Experimental [19, 21] 0.321 0.521 1.62 1.51 0.0741 4.74Ref. [20] 0.318 0.524 1.65 1.48 0.075 4.56In our calculations <strong>of</strong> the phase stability <strong>of</strong> the MgH 2 system with a Mg vacancyunder high temperature, it is relaxed through NVT molecular dynamics for 0.01 pswith a time step <strong>of</strong> 1.0 fs. The BLYP exchange-correlation functional is adopted forGGA correction. All electron Kohn–Sham wave functions are exp<strong>and</strong>ed in a doublenumerical basis with a polarized orbital (DNP).3. Results <strong>and</strong> discussion3.1. Effect <strong>of</strong> Ni substitutionon the dehydrogenating properties <strong>of</strong> MgH 2 systemsIn MgH 2 (see Fig. 2), the bonding distances with Mg at the 2a site (Mg(0),Fig. 2b) <strong>and</strong> its first nearest neighbour H atom (H(A), Fig. 2b) <strong>and</strong> second nearest Hatom (H(B), Fig. 2b) are analyzed, as shown in Fig. 3. The results show that the distance<strong>of</strong> Mg(0)–H(A) <strong>and</strong> Mg(0)–H(B) are 0.1935 nm <strong>and</strong> 0.1955 nm, respectively.We then replace one Mg atom at the 2a (0.5, 0.5, 0.5) site with a Ni atom (Fig. 1b).Similarly to the case <strong>of</strong> MgH 2 , the corresponding Ni–H(A) <strong>and</strong> Ni–H(B) bond lengthsare shorter compared with those <strong>of</strong> Mg–H(A) <strong>and</strong> Mg–H(B), <strong>and</strong> decrease by0.0297 nm <strong>and</strong> 0.0245 nm, respectively. When H(A) is removed, there is no observabledifference in the bonding distance between the H(B) <strong>and</strong> Mg(0) atoms (Fig. 4,
Dehydrogenating properties <strong>of</strong> MgH 2 systems with metal fluorides 233NO, NO1 denote MgH 2 systems with no H atom removed <strong>and</strong> one H atom removed,respectively). After Ni substitution, the distance between the Mg(0) <strong>and</strong> H(B) atom is0.167 nm, which is also shorter compared with that (0.1710 nm) <strong>of</strong> the unchangedstructure. Thus, one can visualize the Ni atom as playing the role <strong>of</strong> a magnet thatcontinues to attract nearby H atoms as the very nearest ones are successively desorbed.Fig. 2. Supercell model <strong>of</strong> MgH 2 (a) <strong>and</strong> supercell octahedral (b)Fig. 3. The H–Mg(Ni) atom bondingdistance changeFig. 4. The H(B–Mg(0)(Ni) atom bondingdistance changeThe energy costs to remove H atoms from intrinsic MgH 2 as well as the energycosts associated with Ni substitution at the Mg site are calculated by using the followingequation [19]:E coh = E(Mg 16–x Ni x H 32–n ) – E(Mg 16–x Ni x H 32 ) + (n/2)E(H 2 ) (1)The subscripts x <strong>and</strong> n refer to the number <strong>of</strong> Ni <strong>and</strong> H atoms, respectively, in the supercellthat are removed, <strong>and</strong> E coh refers to the cohesive energy at 0 K, defined withrespect to the dissociated atoms. The calculated energies <strong>of</strong> MgH 2 systems are given inFig. 5 (NO2 denotes MgH 2 system with two atoms removed). We find that 1.77 eV are
234D.W. ZHOU et al.required to remove a hydrogen atom in pure MgH 2 , <strong>and</strong> 1.90 eV are required to removetwo hydrogen atoms from the vicinity <strong>of</strong> the same. In contrast, in Ni dopedMgH 2 , the energy cost <strong>of</strong> removing one or two H atoms is 0.75 eV <strong>and</strong> 1.61 eV at 0 K,respectively, which is marginally less than that required in the case <strong>of</strong> H atom removalfrom pure MgH 2 . This dramatic decrease in energy costs originates from structuralchanges following hydrogen removal from different positions, which means that Nisubstitution plays an important role in the dehydrogenation properties <strong>of</strong> MgH 2 systems.Fig. 5. The critical energy needed to removeH atoms in MgH 2 systems3.2. Effect <strong>of</strong> Mg vacancy on the dehydrogenating properties <strong>of</strong> MgH 2 systemsJin et al. [10] pointed out that the improved kinetics in MgH 2 systems for NiF 2may be due to high density defects but the nature <strong>of</strong> these defects is not identified.Moreover, MgF 2 has been found to form during ball milling <strong>of</strong> MgH 2 , which is alsocorrelated to Mg vacancies. Here, we study the role <strong>of</strong> Mg vacancies on hydrogendesorption; a Mg vacancy is created from MgH 2 supercells, <strong>and</strong> the resulting changesin the H–H bonding distance are listed in Table 2.Table 2. The differences in the H-H atom bonding distance for MgH 2 systems with/without Mg vacancySupercellmodelTemperature/K H(B)–H(B)/nm H(A)–H(B)/nm H(A)–H(A)/nmMg 15 H 32 0 0.4134 0.2796 0.3766Mg 15 H 30 0 0.3087 0.2924 –Mg 15 H 30 325 0.2992 0.2789 –Mg 15 H 30 473 0.2960 0.2780 –Mg 15 H 30 673 0.2926 0.2773 –Based on the data from the Table 2, it can be seen that the bonding distance betweentwo H atoms in MgH 2 systems with a Mg vacancy is 0.2796 nm, longer comparedwith that (0.0741 nm) <strong>of</strong> hydrogen molecule. This therefore means that no hy-
Dehydrogenating properties <strong>of</strong> MgH 2 systems with metal fluorides 235drogen molecule formation is observed during 0 K optimization, because when twohydrogen atoms, i.e., H(A) <strong>and</strong> H(B) (Fig. 2b), are removed, the bonding distance is0.2924 nm, meaning that no hydrogen molecule can form. To check whether there areenergy barriers that cannot be overcome at 0 K during dehydrogenation, we considertemperatures <strong>of</strong> 325 K, 473 K or 673 K. The corresponding two H atoms are found tobond to each other at the distances <strong>of</strong> 0.2924 nm, 0.2780 nm <strong>and</strong> 0.2773 nm, respectively(Fig. 6). Although Mg vacancy is created, no hydrogen molecule formation isobserved during optimization at 0–673 K, based on analysis <strong>of</strong> changes in the bondingdistances. The H–H bonding distances at 325 K, 473 K or 673 K are all shorter thanthat at 0 K, lying in the trend for hydrogen molecule formation, which hints that thethermodynamics <strong>of</strong> the considered systems can be improved. This is consistent withthe dynamics <strong>of</strong> hydrogen molecule formation, <strong>and</strong> suggests that the thermodynamics<strong>of</strong> the considered systems can be improved.Fig. 6. The H–H atom bonding distance changeat various temperaturesFurther calculation is done to check whether there are benefits for the dehydrogenation<strong>of</strong> MgH 2 systems having a Mg vacancy, it is found that the energy cost <strong>of</strong> removinga hydrogen molecule from the vicinity <strong>of</strong> a Mg vacancy is –2.76 eV. Thenegative sign means that energy is gained if a hydrogen molecule is removed from thevicinity <strong>of</strong> a Mg vacancy <strong>and</strong> therefore the dehydrogenation process is exothermic.Based on the above analysis, a Mg vacancy also plays an important role in the dehydrogenationproperties <strong>of</strong> MgH 2 systems [22].3.3. Improved dehydrogenating properties <strong>of</strong> MgH 2 systems with NiF 2Based on the analyses <strong>of</strong> sections 2.1 <strong>and</strong> 2.2, one can see that both Ni substitutionas well as Mg vacancies both play an important role in dehydrogenation, sowhich <strong>of</strong> these two cases is most effective for desorbing hydrogen at lower temperatures?Clearly it is important to firstly know the energies <strong>of</strong> their formation. The
236D.W. ZHOU et al.formation energy <strong>of</strong> a Ni atom substituted at the Mg site is calculated using the followingequation [23]:( Mg NiH ) ( Mg) ( Ni) ( Mg H )H1 = ⎡ ⎣E 15 32+ E ⎦⎤ − ⎣⎡ E + E16 32 ⎦ ⎤ (2)The formation energy <strong>of</strong> a Mg vacancy is computed from cohesive energies forthe Mg 16 H 32 <strong>and</strong> <strong>and</strong> Mg 15 H 32 supercells, using the following equation [23]:( Mg H ) ( Mg) ( Mg H )E + E − E(3)15 32 16 32The calculated energy <strong>of</strong> vacancy formation is 6.51 eV; this value is higher thanthe one obtained by Li (3.87 eV) [12], although different methods should producesimilar results. The formation energy <strong>of</strong> the Mg vacancy is much higher than the2.12 eV needed to substitute Ni at the Mg site assuming all other conditions remainunchanged. Thus, although both Ni substitution <strong>and</strong> Mg vacancies are found to beeffective in desorbing hydrogen at lower temperatures, Ni substitution is more energyefficient than the formation <strong>of</strong> Mg vacancies. If an Ni atom <strong>of</strong> NiF 2 can replace a Mgatom belonging to a MgH 2 system, the reaction NiF 2 + 3MgH 2 = MgF 2 + Mg 2 NiH 4 ,occurring during the milling process, is accelerated. Thus MgH 2 with the higher stabilitycan be changed into Mg 2 NiH 4 . In Sect. 2.1, regarding the removal <strong>of</strong> one first nearestneighbouring H atom, the Ni atom plays the role <strong>of</strong> a magnet that continues to attractits second nearest H atom as the nearest ones are successively desorbed, thus, itcan be thought that there lies in the trend for NiH x cluster formation, MgH 2 may bechanged into (Mg,Ni)H x solid solution due to the substitution <strong>of</strong> Ni at the Mg site,while (Mg,Ni)H x solution is a likely the pathway for dehydrogenation in MgH 2 [10],<strong>and</strong> which lead to Mg 2 NiH 4 formation. In the experiment undertaken by Jin et al. [10],MgF 2 <strong>and</strong> Mg 2 NiH 4 were detected in the reaction products during the milling process,which is in agreement with the above analysis. Moreover, the experimental value forthe formation heat <strong>of</strong> Mg 2 NiH 4 is –62.7 kJ/mol H 2 [24] which is larger than that(–76.15 ± 9.2 kJ/(mol H 2 ) [24]) for MgH 2 , which means that the H atoms <strong>of</strong> MgH 2 canbe released more easily than those in Mg 2 NiH 4 . Hence, when a Ni atom <strong>of</strong> NiF 2 replacesa Mg atom belonging to a MgH 2 system at lower temperatures, the reactionNiF 2 + 3MgH 2 = MgF 2 + Mg 2 NiH 4 is accelerated. Thus, MgH 2 having higher stabilitycan be changed into Mg 2 NiH 4 with lower stability. Due to formation <strong>of</strong> ternary hydrideMg 2 NiH 4 with the lower stability, the dehydrogenating properties <strong>of</strong> Ni dopedMgH 2 systems are improved.3.4. Improved dehydrogenating properties<strong>of</strong> MgH 2 systems with metal fluoridesAs far as the improved dehydrogenating properties <strong>of</strong> MgH 2 systems with the addition<strong>of</strong> TiF 3 , VF 4 , NbF 5 , FeF 2 , ZrF 4 are concerned, the corresponding phase <strong>of</strong> MgF 2 ,TiH 2 , V 3 H 2 , NbH, Mg 2 FeH 6 , ZrH 2 were also detected in the reaction products during
Dehydrogenating properties <strong>of</strong> MgH 2 systems with metal fluorides 237the milling process by Jin et al. [10]. It is believed that MgF 2 , TiH 2 , V 3 H 2 , NbH,Mg 2 FeH 6 , ZrH 2 are formed by the following displacement reactions:TiF 3 + 3MgH 2 = 3MgF 2 + 2TiH 2 + H 23VF 4 + 6MgH 2 = 6MgF 2 + V 3 H 2 + 5H22NbF5 + 5MgH 2 = 5MgF 2 + 2NbH + 4H 2FeF 2 + 3MgH 2 = MgF 2 + Mg 2 FeH 6ZrF 4 + 2MgH 2 = 2MgF 2 + ZrH 2Similarly, it is assumed that MgF 2 is formed by a Mg atom <strong>of</strong> MgH 2 <strong>and</strong> a F atom<strong>of</strong> TiF 3 , VF 4 , NbF 5 , FeF 2 , ZrF 4 , respectively. Thus some Mg vacancies remain in thesample, while Ti, V, Nb, Fe, Zr atoms <strong>of</strong> TiF 3 , VF 4 , NbF 5 , FeF 2 , ZrF 4 replace a Mgatom <strong>of</strong> MgH 2 , which will lead to formation <strong>of</strong> TiH 2 , V 3 H 2 , NbH, Mg 2 FeH 6 or ZrH 2 .Table 3. The energy to remove H atoms <strong>and</strong> the energy<strong>of</strong> the Mg atom replaced with other atoms for MgH 2 systemsMg substitutionOne H atomremoved/eVTwo H atomsremoved/eVSubstitutionenergy/eVclean 1.7688 1.9021 –Ni 0.7456 1.6136 2.1198Ti 1.6463 2.4763 1.1946V 1.7062 2.8872 2.0899Nb 1.6490 1.7606 2.4354Fe 1.9021 – 0.6912Zr 1.5592 1.8368 1.3511Cr – – 2.4626Cu – – 2.6967The energies needed for Ti, V, Nb, Fe, or Zr substitution (as well as Ni itself) atthe Mg site are listed in Table 3. It is known that the higher the energy needed for theconsidered systems, the more difficult the atom substitution is. Hence, in the presentwork, the substituting elements can be ranked in the following order, according toincreasing levels <strong>of</strong> energy required for substitution: Fe, Ti, Zr, V, Ni, Nb, Cr, Cu(Fig. 7) because the calculated vacancy formation energy is much higher than that (thehighest value is 2.6967eV) needed to substitute Ti, V, Nb, Fe, Zr, Cr, Cu at the Mgsites. Hence, the substitution at the Mg site is more energy efficient than the formation<strong>of</strong> Mg vacancies at lower temperatures. According to the results <strong>of</strong> Jin et al. [10], neitherCuF 2 nor CrF 2 have a significant effect on the dehydrogenation properties <strong>of</strong>MgH 2 systems, while the substitution <strong>of</strong> Cr, Cu at the Mg site is the most difficultamong all other elements under consideration, thus, we believe that the catalytic effect<strong>of</strong> CuF 2 <strong>and</strong> CrF 2 is correlated to its substitution at the Mg site.
238D.W. ZHOU et al.The energy costs <strong>of</strong> removing one or two H atoms from MgH 2 systems are calculatedfrom Eq. (1) (Table 3). Here, Cr <strong>and</strong> Cu are not considered, due to the difficulty<strong>of</strong> substituting them at the Mg site. It was found that the energy needed for Ni, Zr, Ti,Nb, or V substitution (not including Fe) at the Mg site is lower than that (1.7688 eV)<strong>of</strong> pure MgH 2 systems with one H atom removed, which means that elemental substitutionimproves the dehydrogenation properties <strong>of</strong> MgH 2 systems <strong>and</strong> the influence <strong>of</strong>substitution on the dehydrogenating properties increases in the order Nb, Ni, Ti(Fig. 8).Fig. 7. The order <strong>of</strong> the Mg atomreplaced with another atomFig. 8. The calculation order <strong>of</strong> one Mg atomreplaced with other atom in the catalyst effectFig. 9. The experimental order <strong>of</strong> one Mg atomreplaced with another atom in the catalyst effectFig. 10. The calculation order <strong>of</strong> two Mg atomsreplaced with another atom in the catalyst effectThis is in agreement with the experimental results <strong>of</strong> Jin et al. [10] (Fig. 9).Fe substitution is not considered here, in the case when two H atoms are removedbecause dehydrogenation <strong>of</strong> MgH 2 systems is difficult in this case. It was found thatthe energy needed for Ni, Nb, or Zr substitution (not including Ti <strong>and</strong> V) at the Mgsite is lower than that needed for pure systems (1.9021 eV), which means that Ni, Nb,
Dehydrogenating properties <strong>of</strong> MgH 2 systems with metal fluorides 239Zr substitution at the Mg site plays an important role in the dehydrogenation properties<strong>of</strong> MgH 2 systems. The substituting elements (assuming two H atoms are removed)can be ranked as follows, according to their increasing dehydrogenation efficiencies:Zr, Nb, Ni (Fig. 10). This is also in agreement with the experimental results <strong>of</strong> Jin etal. [10] (Fig. 9).In the present work, since MgH 2 systems with removed two H atoms are close tothe realistic case in which hydrogen molecule is released, they are investigated in detailas following. Based on Fig. 10, it can be seen that Ni, Nb, or Zr substitution at theMg site improves the dehydrogenating process for MgH 2 systems, while it is not thecase for Fe, Ti, or V substitution, which is not in agreement with the experimentalresults <strong>of</strong> Jin et al. [10]. In our group, the <strong>characterization</strong> <strong>of</strong> the synthesized duplexMgH 2 + Mg 2 FeH 6 hydrides mixture has been investigated. We found that the structuralstability <strong>of</strong> the alloying system is reduced when a little iron is dissolved in MgH 2 , <strong>and</strong>further reduced when the iron additions form the compound Mg 2 FeH 6 . Consequently,the dehydrogenation properties <strong>of</strong> the corresponding systems are improved [24].Moreover, based on the calculated energy results for the TiH 2 <strong>and</strong> VH 0.81 phase structures,TiH 2 /MgH 2 <strong>and</strong> VH/MgH 2 interfaces were designed. The alloying effects <strong>of</strong>titanium [25] <strong>and</strong> vanadium [14] substitution on the dehydrogenating properties <strong>of</strong>MgH 2 were investigated. It was found that the improved dehydrogenating properties<strong>of</strong> MgH 2 were caused by titanium or vanadium alloying originates from the increasing<strong>of</strong> the valence electrons at the Fermi level (E F ) <strong>and</strong> the decreasing <strong>of</strong> the HOMO-LUMO gap (ΔE H–L ) after titanium or vanadium alloying. The catalysis effect <strong>of</strong> titaniumor vanadium on the dehydrogenating kinetics <strong>of</strong> MgH 2 may be attributed toa stronger bonding between the Ti or the V atoms with the H atoms in comparisonwith the bonding between Mg <strong>and</strong> H atoms. This stronger bonding leads to easier nucleation<strong>of</strong> the α-Mg at the TiH 2 /MgH 2 or the VH/MgH 2 interface in the MgH 2 –Ti orthe MgH 2 –V systems, compared with the nucleation associated with pure MgH 2 phase.Ti <strong>and</strong> V both have higher affinity to hydrogen than Mg, <strong>and</strong> work as a hydrogenpump that chemisorbs hydrogen atoms <strong>and</strong> transfers them to the TiH 2 /MgH 2 or theVH/MgH 2 interface. The nucleation barrier is relatively small. Based on our previouswork, the catalytic effect <strong>of</strong> FeF 2 , TiF 3 , VF 4 on the dehydrogenation properties <strong>of</strong>MgH 2 systems (Fig. 9) cannot be caused by Fe, Ti, V substitution at the Mg site. Withregard to Fe substitution, the Mg 2 FeH 6 compound formed during the milling processacts as the catalyst that improves the dehydrogenation properties <strong>of</strong> MgH 2 systems[3, 13]. For Ti or V doped systems, the TiH 2 /MgH 2 or VH/MgH 2 interfaces help improvethe dehydrogenation properties <strong>of</strong> MgH 2 systems [14]. The effect <strong>of</strong> FeF 2 , TiF 3<strong>and</strong> VF 4 on the dehydrogenation properties will be discussed elsewhere. As far asNiF 2 , NbF 5 <strong>and</strong> ZrF 4 are concerned, they are all beneficial for the dehydrogenatingkinetics <strong>of</strong> MgH 2 systems, <strong>and</strong> the results <strong>of</strong> our calculations for the improved dehydrogenatingkinetics are in agreement with experimental results. If a Ni, Nb, or a Zratom replaces a Mg atom <strong>of</strong> a MgH 2 system, the corresponding reactions, namelyNiF 2 + 3MgH 2 = MgF 2 +Mg 2 NiH 4
240D.W. ZHOU et al.2NbF 5 +5MgH 2 = 5MgF 2 +2NbH+4H 2orZrF 4 +2MgH 2 = 2MgF 2 +ZrH 2that occur during the milling process are accelerated, thus, MgH 2 with the higher stabilitycan be changed into other hydrides such as Mg 2 NiH 4 , NbH <strong>and</strong> ZrH 2 .Fig. 11. DOS <strong>of</strong> MgH 2 systems with Mg atom replaced with another atom (a),<strong>and</strong> H atoms unchanged (b) two H atoms removedAn analysis was undertaken <strong>of</strong> the total density <strong>of</strong> states (DOS) <strong>of</strong> MgH 2 systemswith two H atoms removed <strong>and</strong> replaced by other atoms, in order to underst<strong>and</strong> themechanism <strong>of</strong> the improved dehydrogenation kinetics <strong>of</strong> MgH 2 systems with metalfluorides (such as NiF 2 , NbF 5 ZrF 4 , etc.) (Fig. 11). With regard to Mg, with or withoutNi, Nb or Zr substitution, it was found that before the dehydrogenation process, thebonding electron numbers below the Fermi energy are 72.14513, 67.13484, 66.13957,64.10414, which are higher than the corresponding values, (70.11917, 65.06694,64.07548, 62.07548) for the same systems after the dehydrogenation process. Hence,the bonding strengths/energies for Ni–H, Nb–H <strong>and</strong> Zr–H are stronger than that forMg–H. Compared with the density <strong>of</strong> states (DOS) <strong>of</strong> MgH 2 systems (Fig. 12), it isfound that when a Ni, Nb, or a Zr atom replaces a Mg atom, the valence electron numbers(Fig. 13) lying below the Fermi level in octahedral areas are made <strong>of</strong> the supercell
Dehydrogenating properties <strong>of</strong> MgH 2 systems with metal fluorides 241central atom <strong>and</strong> the first-nearest <strong>and</strong> second-nearest H atoms (Fig. 2b) reduce in theorder <strong>of</strong> Ni, Ti, Zr.Fig. 12. DOS <strong>of</strong> octahedral areas in the MgH 2supercellFig. 13. The number <strong>of</strong> valence electronslying below the Fermi level in octahedral areasin the MgH 2 supercellThe higher the bonding electron numbers are, the stronger the charge interactions,<strong>and</strong> other electron numbers in the low energy range, lying far below the Fermi level,will lead to a more stable structure. Hence, the corresponding structural stability isincreased <strong>and</strong> the dehydrogenation kinetics is less energy-efficient. The density <strong>of</strong>states (DOS) theory <strong>of</strong> these MgH 2 systems also provides a very good explanation forthe close agreement between the experimental results <strong>and</strong> the theoretical calculationsfor predicted improvements to the dehydrogenation kinetics <strong>of</strong> MgH 2 sytems, if NiF 2 ,NbF 5 , or ZrF 4 are used as catalysts.
242D.W. ZHOU et al.4. ConclusionsDensity functional theory <strong>and</strong> the Dmol 4.1 s<strong>of</strong>tware program were used to calculatethe formation energy associated with the replacement <strong>of</strong> a Mg atom by a differentatom, the formation energy <strong>of</strong> a Mg vacancy, the critical energy needed to remove twoH atoms <strong>and</strong> the electronic structure <strong>of</strong> MgH 2 systems. The main conclusions aresummarized as follows:The formation energy <strong>of</strong> a Mg vacancy is higher than that <strong>of</strong> Fe, Ti, Zr, V, Ni, Nb,Cr, or Cu substitution, which means that the substitution <strong>of</strong> Fe, Ti, Zr, V, Ni, Nb, Cr,or Cu at the Mg site is more energy efficient than the formation <strong>of</strong> an Mg vacancy atlower temperatures.NiF 2 , NbF 5 , ZrF 4 all improve the dehydrogenation kinetics <strong>of</strong> MgH 2 systems. Thetheoretical predictions for these kinetic improvements are in good agreement with theexperimental results.If a Ni, Nb, or a Zr atom replaces a Mg atom <strong>of</strong> an MgH 2 system, the correspondingreactions that occur during the milling process are accelerated, thus, MgH 2 withthe higher stability can be changed into other hydrides such as Mg 2 NiH 4 , NbH <strong>and</strong>ZrH 2 .Compared with the density <strong>of</strong> states (DOS) theory <strong>of</strong> MgH 2 systems, it was foundthat when a Ni, Nb, or a Zr atom replaces a Mg atom, the valence electron numberslying below the Fermi level in octahedral areas are made <strong>of</strong> the supercell central atom<strong>and</strong> its first-nearest, second-nearest H atom reduces in the order <strong>of</strong> Ni, Ti, Zr, meaningthe corresponding structural stability is increased <strong>and</strong> the dehydrogenation kineticsbecome inferior. The density <strong>of</strong> states (DOS) theory <strong>of</strong> these MgH 2 systems also providesa very good explanation for the close agreement between the experimental results<strong>and</strong> the theoretical calculations for predicted improvements to the dehydrogenationkinetics <strong>of</strong> MgH 2 sytems, if NiF 2 , NbF 5 , or ZrF 4 are used as catalysts.AcknowledgementsThe work was supported by the Hunan Provincial Natural Science Foundation <strong>of</strong> ChinaNo. 09JJ6079, the PhD Programs Foundation <strong>of</strong> Ministry <strong>of</strong> Education <strong>of</strong> China No. 200805321032, theScience Fund <strong>of</strong> State Key Laboratory <strong>of</strong> Advanced Design <strong>and</strong> Manufacturing for Vehicle BodyNo. 60870005.References[1] ZALUSKA A., ZALUSKI L., STRÖM-OLSEN J.O., J. Alloys Compd., 288 (1999), 217.[2] JURCZYK M., SMARDZ L., OKONSKA I., JANKOWSKA E., NOWAK M., SMARDZ K., Int. J. Hydrogen. En.,33 (2008), 374.[3] SHANG C., X BOUOUDINA M., SONG Y., GUO Z., Int. J. Hydrogen. En., 29 (2004), 73.[4] HUOT J., HAYAKAWA H., AKIBA E., J. Alloys Compd., 248 (1997), 164.[5] GENNARI F.C., CASTRO F.J., URRETAVIZCAYA G., MEYER G., J. Alloys Compd., 334 (2002), 277.[6] LIANG G., HUOT J., BOILY S., VAN NESTE A., SCHULZ R., J. Alloys Compd., 297 (2000), 261.[7] MANDAL P., DUTTA K., RAMAKISHNA K., SAPRU K., SRIVASTAVA O.N., J. Alloys Compd., 184 (1992), 1.
Dehydrogenating properties <strong>of</strong> MgH 2 systems with metal fluorides 243[8] WANG P., WANG A.M., DING B.Z., HU Z.Q., J Alloys Compd., 334 (2002), 243.[9] PELLETIER J.F., HUOT J., SUTTON M., SCHULZ R., SANDY A.R., LURIO L.B., MOCHRIE S.G.J., Phys.Rev. B., 63 (2001), 052103.[10] JIN S.A., SHIM J.H., CHO Y.W., YI K.W., J. Power Sources, 172 (2007), 859.[11] SONG Y., GUO Z., YANG R., Phys. Rev. B., 69 (2004), 094205.[12] LI S., JENA P., AHUJA R., Phys. Rev. B., 74 (2006), 132106.[13] ZHOU D.W., ZHANG J., LIU J.S., PENG P., Chin. Nonferr. Metal., 18 (2008), 2233.[14] ZHOU D.W., PENG P., LIU J.S., Sci. China Ser. E., 49 (2006), 129.[15] ZHOU D.W., LIU J.S., PENG P., Sci. China Ser. E., 51 (2008), 979.[16] PERDEW J.P, BURKE K., ERNZERHOF M., Phys. Rev. Lett., 77 (1996), 3865.[17] PACK J.D., Phys. Rev. B., 16 (1977), 1748.[18] DELLY B., J. Chem. Phys., 94 (1991), 7245.[19] KITTEL C., Introduction to Solid State Physics, Wiley, New York, 1986.[20] HOU Z.F., J. Power Sources, 159 (2006), 111.[21] FUKAI Y., The Metal–Hydrogen System, Springer, Berlin, 1993.[22] MEDVEDEVA M.I., GORNOSTYREV Y.N., NOVIKOV D.L., MRYASOV O.N., FREEMAN A.J., Acta. Mater.,46 (1998), 3433.[23] SAHU B.R., Mater. Sci. Eng. B., 49 (1997), 74.[24] BOGDANOVÍC B., BOHMHAMMEL K., CHRIST B., REISER A., SCHLICHITE K., J. Alloys Compd., 282(1999), 84.Received 18 August 2009
Materials Science-Pol<strong>and</strong>, Vol. 28, No. 1, 2010Characterization <strong>of</strong> electrodepositednanostructured macroporous cobalt filmsusing polystyrene sphere templatesI.S. EL-HALLAG *Chemistry Department, Faculty <strong>of</strong> Science, Tanta University, 31527, Tanta, EgyptThe electrodeposition <strong>of</strong> highly ordered macroporous films <strong>of</strong> cobalt with regular arrays <strong>of</strong> sphericalpores <strong>of</strong> the diameters 200, 550, 600, 750 <strong>and</strong> 1000 nm was carried out into the interstitial spaces <strong>of</strong>a template formed by polystyrene latex spheres. The spheres were self-assembled on flat gold electrodes<strong>of</strong> 1 cm 2 surface area to produce a highly periodic, hexagonal close packed, interconnected network <strong>of</strong>monodisperse spherical pores within the metal film. The size <strong>of</strong> pores was determined by the diameter <strong>of</strong>the polystyrene latex particles used to prepare the template. The nanostructure <strong>of</strong> the films was studied bythe scanning electron microscopy. Magnetic studies <strong>of</strong> the films were carried out with an Aerosonic 3001vibrating sample magnetometer. The nucleation <strong>and</strong> the growth mode <strong>of</strong> cobalt were investigated viaa chronoamperometry study.Keywords: electrochemical deposition; macroporous films; chronoamperometry; magnetic properties;polystyrene latex1. IntroductionMetal electrodeposition is <strong>of</strong> great importance, both for the basic science involvingthe process <strong>and</strong> for its major technological applications in electroplating, metalelectr<strong>of</strong>ining <strong>and</strong> electrowinning. Porous metals are important for many engineeringapplications such as filters, catalysts, supports, heat exchangers, fuel cells, electrolyticcells, thermal screens, <strong>and</strong> vibration dampers [1–4]. In many applications, a high specificsurface area is required. The production <strong>of</strong> materials with micron <strong>and</strong> submicronscale structures in two <strong>and</strong> three dimensions is <strong>of</strong> importance in the range <strong>of</strong> applicationssuch as photonic materials, high density magnetic data storage devices, microchipreactors <strong>and</strong> biosensors [5–9].The electrochemical deposition <strong>of</strong> nanoscale Ni <strong>and</strong> Au meshes through templatesmade from a closely-packed silica sphere array have been described by Xu et al [10]._________* E-mail: ielhallag@yahoo.co.uk
246I.S. EL-HALLAGSeveral important differences were found between the method described in this workover that <strong>of</strong> Xu et al. These differences can be summarized as follows: (i) the polystyrenelatex particles used are commercially available in a range <strong>of</strong> sizes; (ii) theclosely-packed templates can be prepared by evaporation rather than by sedimentationover a period <strong>of</strong> several months; (iii) there is no need to sinter the template; (iv) themetal deposition is achieved in a few minutes rather than over 36 h; (v) the templatecan be removed by dissolving the polystyrene in toluene rather than requiring the use<strong>of</strong> HF.In the paper, we report on the preparation <strong>of</strong> highly ordered macroporous metalfilms. The preparation <strong>of</strong> the structured macroporous films was carried out via theelectrochemical reduction <strong>of</strong> CoSO 4 in aqueous solution within the interstitial spaces<strong>of</strong> a closely packed polystyrene latex sphere template, self assembled on a gold surface.The influence <strong>of</strong> the pore diameter <strong>of</strong> polystyrene latex spheres on the magneticproperties <strong>of</strong> the electrodeposited Co films is reported. The nucleation <strong>and</strong> the growthmode <strong>of</strong> Co onto gold substrates were investigated via current–time transient curvesduring potentiostatic deposition. The morphologies <strong>of</strong> the Co films were investigatedby the scanning electron microscopy (SEM). Magnetic hysteresis curves were recordedwith an Oxford Instruments Aerosonic 3001 vibrating sample magnetometer atroom temperature.2. ExperimentalMaterials. All solvents <strong>and</strong> chemicals were <strong>of</strong> reagent quality <strong>and</strong> were used withoutfurther purification. The monodisperse polystyrene latex spheres, with diameters<strong>of</strong> 200, 550, 600, 750 <strong>and</strong> 1000 nm were obtained from an Alfa Asear a 2.5 wt. %solution in water. Propanol <strong>and</strong> toluene were obtained from Aldrich. The gold electrodesused as substrates were prepared by evaporating 10 nm <strong>of</strong> a chromium adhesionlayer, followed by evaporating 200 nm <strong>of</strong> gold, onto 1 mm thick glass microscopeslides. The gold electrodes were cleaned by sonication in propanol for 1 h followed byrinsing with deionized water. All solutions were freshly prepared using reagent-gradewater (18 MΩ·cm) from a Whatman RO 80 system coupled to a Whatman Still Plussystem. The deposition solution was 0.1 mol·dm –3 Co(Ac) 2 with 0.1 mol·dm –3 KAc<strong>and</strong> 0.1 mol·dm –3 H 3 BO 3 to produce pH 3.7. The deposition was carried out potentiostaticallyat the potential <strong>of</strong> –0.95 V vs. SCE.Instrumentation. An analytical scanning electron microscope (JEOL 6400) wasused to study the morphology <strong>and</strong> thickness <strong>of</strong> the electrodeposited cobalt films. Magnetichysteresis loops were measured using an Oxford Instruments Aerosonic 3001vibrating sample magnetometer. Electrochemical deposition was carried out in a conventionalthree electrode configuration using an EG G 273. A large area platinumgauze was used as the counter electrode, saturated calomel (SCE) as the referenceelectrode <strong>and</strong> the template coated gold substrate as the working electrode.
Electrodeposited nanostructured macroporous cobalt films 247Assembly <strong>of</strong> the colloidal templates. The polystyrene sphere templates were assembledby sticking a 1.0 cm internal diameter Teflon ring onto the gold substrateusing double-sided tape. Approximately 0.3 cm 3 <strong>of</strong> an aqueous suspension <strong>of</strong> themonodisperse polystyrene spheres <strong>of</strong> 200, 550, 600, 750 <strong>and</strong> 1000 nm in diameterdiluted with water to 0.5 wt. % was spread over the area <strong>of</strong> the gold electrode surroundedby the Teflon ring (0.785 cm 2 ); this corresponds to a template layer about2.0×10 4 nm thick. The sample was then kept in a controlled humidity chamber <strong>and</strong>allowed to dry slowly over a period <strong>of</strong> 3–4 days. After all the water had evaporated,the Teflon was removed to leave a circular area covered by the template. The templatesare robust <strong>and</strong> adhere well to the gold substrate. There is no evidence for the resuspension<strong>of</strong> the latex particles when these are placed in contact with the depositionsolutions.<strong>Synthesis</strong> <strong>of</strong> highly ordered macroporous cobalt films. The electrochemical depositionwas performed at fixed potentials <strong>of</strong> –0.95 V vs. SCE. The cobalt films weregrown with a constant <strong>and</strong> gradient thickness. The gradient ranged from 0.0 to 1500nm across the sample 1 cm in diameter. This was done in order to allow a systematicstudy, by SEM measurements, <strong>of</strong> the properties <strong>of</strong> the films, as a function <strong>of</strong> the filmthickness. When the electrochemical deposition was complete (25–30 min), the cobaltfilms were soaked in toluene for 24 h to dissolve away the polystyrene template. Allexperiments were performed at room temperature (20–23 °C).3. Results <strong>and</strong> discussion3.1. Characterization by chronoamperometryChronoamperometry is a widely used technique for the deposition <strong>and</strong> observation<strong>of</strong> the growth process during the film formation. The chronoamperometric curve inFig. 1a shows three different regions, in which A region corresponds to a rapid increaseunder an applied potential <strong>of</strong> –0.95 V vs. SCE. A slow current decay is observedin the B region which is followed by a constant current in C region. A rapidsurge <strong>and</strong> exponential decay <strong>of</strong> the current observed in region A is due to double layercharging, which takes 6 s to reach the peak current <strong>of</strong> 4.7 μA. A continuous decaycurrent observed in region B corresponds to the formation <strong>of</strong> cobalt films [11]. Thecurrent in region C is characteristic <strong>of</strong> diffusion controlled growth. In this region, thediffusion rate <strong>of</strong> Co 2+ is equal to the reduction rate <strong>of</strong> Co 2+ at the electrode surface,current keeps steady. This means that at longer time gradual increase <strong>of</strong> the diffusionzone increases the volume the depleted region. The diffusion zone between the electrodesurface <strong>and</strong> the electroactive species in the bulk solution increase which leads toextension <strong>of</strong> the diffusion zone into the bulk solution (high population region <strong>of</strong> theelectroactive species) causing linear diffusion <strong>of</strong> species to the electrode surface[1, 12, 13]. Thus, (i) cobalt deposition after double layer charging, (ii) critical nuclei
248I.S. EL-HALLAGformation, <strong>and</strong> (iii) further diffusive controlled growth <strong>of</strong> the cobalt films, are the responsiblesteps for the nuclei formation <strong>and</strong> subsequent growth <strong>of</strong> cobalt thin films.Fig. 1. Time dependences <strong>of</strong> current during deposition <strong>of</strong> cobalt at an appliedpotential <strong>of</strong> –0.95 V vs. SCE (a) <strong>and</strong> the Cottrel plot at E f = –0.950 V (b)By choosing the data for a short time from the experimental points selected inFig. 1a, a Cottrel plot was obtained as a dependence <strong>of</strong> current on the reciprocalsquare root <strong>of</strong> time (Fig. 1b). The slope <strong>of</strong> the Cottrel plot yields the diffusion coefficientD = 5.2×10 –10 m 2·s –1 . Cobalt thin films were deposited from an optimized bathcomposition by applying the –0.95 V vs. SCE deposition potential for various timedurations. Figure 2 shows the plot <strong>of</strong> film thickness against the amount <strong>of</strong> charge re-
Electrodeposited nanostructured macroporous cobalt films 249quired for the deposition <strong>of</strong> films. It was observed that the film thickness increases asthe quantity <strong>of</strong> change increases.Fig. 2. Dependence <strong>of</strong> the charge requiredfor deposition <strong>of</strong> cobalt films on the film thickness3.2. Characterization by SEMFigure 3a shows an exemplary SEM image <strong>of</strong> the surface <strong>of</strong> a macroporous cobaltfilm on a gold substrate covered with templates made <strong>of</strong> 550 ± 20 nm diameter polystyrenespheres. The electrochemical deposition was carried out at potentials <strong>of</strong>–0.95 V vs. SCE (total charge passed 2 C·cm –2 ).The SEM images show that the spherical voids left in the gold films after the removal<strong>of</strong> the polystyrene sphere are arranged in a well ordered, single domain, closelypacked structure. Measurements <strong>of</strong> the centre-to-centre distances for the pores inFig. 3a, <strong>and</strong> for similar images <strong>of</strong> other films, confirms that the spherical voids withinthe cobalt films have the same diameter as the polystyrene spheres used to fabricatethe template. Figure 3b shows an image for a macroporous cobalt film prepared witha template <strong>of</strong> spheres 750 nm in diameter. Figure 3c shows a cross section <strong>of</strong> a cobaltfilm fabricated using templates formed from 750 nm polystyrene latex spheres. Thesemicrographs also reveal the formation <strong>of</strong> three-dimensional macroporous films. Thespherical voids have diameters determined by the diameter <strong>of</strong> the polystyrene latexspheres used for the template <strong>and</strong> are arranged as a part <strong>of</strong> an hexagonal lattice, againindicating that the polystyrene latex particles were arranged in a three-dimensional,hexagonal, closely packed structure. This was also confirmed by scanning electronmicrographs <strong>of</strong> the template themselves before the deposition <strong>of</strong> the metal.
250I.S. EL-HALLAGFig. 3. SEM images <strong>of</strong> nanostructuredcobalt films with the template diameters<strong>of</strong> 550 ± 20 nm (a), <strong>and</strong> 750 ± 20 nm (b),cross-section <strong>of</strong> depositedcobalt fiilm using template 750 nm (c)It was noted that self-assembled layers <strong>of</strong> polystyrene latex particles formed ongold surfaces by slow evaporation <strong>of</strong> water from the latex suspension can be used astemplates through electrochemical deposition <strong>of</strong> metal films. In the resultingmetal/polystyrene composite, the polystyrene spheres are in contact <strong>and</strong> can be dissolvedout <strong>of</strong> the metal to leave a regular array <strong>of</strong> interconnected spherical voids. Thesize <strong>of</strong> each <strong>of</strong> these voids is determined by the size <strong>of</strong> the polystyrene latex particlesused. Polystyrene latex particles <strong>of</strong> tightly controlled size distribution are readilycommercially available controlled. The final film thickness can be controlled by appropriatelyregulating the quantity <strong>of</strong> charge employed in the electrochemical deposition.Thus this method provides a simple route for the fabrication <strong>of</strong> ordered macroporousfilms <strong>of</strong> metals with potentially interesting <strong>and</strong> useful photonic, catalytic,magnetic, or other properties.3.3. Magnetic properties <strong>of</strong> cobalt filmsThe film thicknesses were controlled by changing the diameter, d, <strong>of</strong> the polystyrenelatex spheres, used to form the template, <strong>and</strong> the amount <strong>of</strong> charge passed during
Electrodeposited nanostructured macroporous cobalt films 251the electrodeposition process [14]. Consequently, the grain structure <strong>and</strong> morphology<strong>of</strong> the electroplated cobalt films obtained from water <strong>and</strong> from the template mixturemay be significantly different.Fig. 4. Normalized in plane magnetic hysteresis loop at 550 nmFig. 5. Dependence <strong>of</strong> the measured coercivityon the diameter <strong>of</strong> the polystyrene sphereFigure 4 shows an example <strong>of</strong> a normalized in plane magnetic hysteresis loop recordedat room temperature for cobalt film electrochemically deposited on a gold substrateusing a polystyrene sphere <strong>of</strong> 550 nm in diameter. It was found that the hystere-
252I.S. EL-HALLAGsis decreases as the the diameter <strong>of</strong> the polystyrene sphere increases. Figure 5 showsthe dependence <strong>of</strong> the coercivity on the diameter <strong>of</strong> the polystyrene sphere. It is clearthat the coercivity is proportional to the inverse <strong>of</strong> the diameter <strong>of</strong> polystyrene sphere.The nanostructuring significantly affects the shape <strong>of</strong> magnetization loops <strong>and</strong> drasticallychanges the coercive field β c which found to show a maximum with variation <strong>of</strong>sphere diameter [15]. Measurements <strong>of</strong> the dependence <strong>of</strong> β c on the thickness <strong>of</strong> themagnetic film, t f , revealed that the coercive force changes periodically as a function <strong>of</strong>film thickness.4. ConclusionsUsing a simple method, we have successfully produced nanostructured films <strong>of</strong>cobalt via electrochemical deposition using templates prepared by assembling closepacked arrays on monodisperse polystyrene spheres <strong>of</strong> various diameters (200, 550,600, 750, <strong>and</strong> 1000 nm). The resulting electrochemical deposition is highly ordered.Three dimensional macroporous thin films <strong>of</strong> cobalt are robust <strong>and</strong> stable when the thetemplate is removed. The diameter <strong>of</strong> the spherical voids is determined by the diameter<strong>of</strong> the polystyrene latex spheres employed to form the template. Scanning electronmicroscopy confirms the presence <strong>of</strong> a highly regular macroporous structure. Thethickness <strong>of</strong> the films is controlled by varying the charge passed in their deposition. Itwas noted that the synthesis exhibits the Cotterellian behaviour at short time. Thismeans that the diffusion controlled limiting current is proportional to t –1/2 .Magnetic measurements show that the magnetic properties <strong>of</strong> cobalt films werestrongly influenced by the diameter <strong>of</strong> the polystyrene sphere <strong>and</strong> the film thickness. Itwas found that the hysteresis loops <strong>and</strong> coercivity decrease with increasing the diameter<strong>of</strong> polystyrene sphere.AcknowledgementThe author is grateful to Pr<strong>of</strong>. P.N. Bartlett, School <strong>of</strong> Chemistry, University <strong>of</strong> Southampton, U.K.,for providing the material for this work.References[1] KANG Y., ZHAQ J., TAO J., WANG X., LI Y., Appl. Surf. Sci., 254 (2008), 3935.[2] YUN H.J., DULAL S.M.S.I., SHIN C.B., KIM C.K., Electrochim. Acta, 54 (2008), 370.[3] ZHAO D.D., XU M.W., ZHOU W.J., ZHANG J., LI H.L., Electrochim. Acta, 53 (2008), 2699.[4] MARTIN C.R., Chem. Mater., 8 (1996), 1739.[5] HULTEEN J.C., MARTIN C.R., J. Mater. Chem., 7 (1997), 1075.[6] MARTIN C.R., PATHASARATHY R.V., Adv. Mater., 7 (1995), 787.[7] CHAN J.P., LEE K.M., SORENSEN C.M., J. Appl. Phys., 75 (1994), 5876.[8] WESTON J.L., BUTERA A., BARNARD J.A., J. Magn. Magn. Mater., 193 (1999), 515.[9] ATTARD G.S., BARTLETT P.N., COLEMAN N.R.B., ELLIOTT J.M, OWEN J.R., WANG J.H., Science, 278(1997), 838.
Electrodeposited nanostructured macroporous cobalt films 253[10] XU L., ZHOU W.L., FROMMEN C., BAUGHMAN R.H., ZAHKIDOV A.A., MALKINSKI L., WANG J.Q.,WILEY J.B., Chem. Commun., (2000), 997.[11] OKAM G., VEREECKEN P.M., SEARSON P.C., J. Electrochem. Soc., 146 (1999), 1436.[12] VALIZADEH S., GEORGE J.M., LEISNER P., HULTMAN L., Electrochim. Acta, 47(2001), 865.[13] Instrumental Methods in Electrochemistry, T.J. Kemp (Ed.), Hills Horwood, Chichester, UK, 1985.[14] BARTLETT P.N., BIRKIN P.R., GHANEM M.A., Chem. Commun., (2000), 1671.[15] DE GROOT P.A.J., ZHUKOV A.A., BOARDMAN R., BORDIGNON G., FANGOHR H., BARTLETT P.N.,J. Magn. Magn. Mater., 310 (2007), e846.Received 12 November 2008Revised 22 June 2009
Materials Science-Pol<strong>and</strong>, Vol. 28, No. 1, 2010Mechanical behaviour <strong>of</strong> glassduring cyclic instrumented indentationA. CHORFA 1* , M. HAMIDOUCHE 2 , M.A. MADJOUBI 2 , F. PETIT 31 Department <strong>of</strong> Mechanics, Faculty <strong>of</strong> Engineering Science, Skikda University, Algeria2 Departement O.M.P., Faculty <strong>of</strong> Engineering Science, Ferhat Abbas University, Algeria3 Belgian Ceramic Research Centre, Mons, BelgiumIndentation techniques are largely used nowadays for characterizing the intrinsic mechanical properties<strong>of</strong> brittle materials. A cyclic indentation tests have been carried out on soda lime glass <strong>and</strong> borosilicateglass using an instrumented indentation apparatus. Repeated post-threshold Vickers indentationswere made using various peak loads. The hardness, elastic modulus <strong>and</strong> fracture toughness <strong>of</strong> the twoglasses were evaluated using the consecutive load–displacement curves. Their properties <strong>of</strong> were compared<strong>and</strong> discussed.Keywords: glass; hardness; fatigue crack propagation; stress analysis1. IntroductionIndentation techniques are appropriate for characterizing the fracture behaviour <strong>of</strong>brittle materials. They are simple, economical <strong>and</strong> efficient methods that can be used todetermine the material fracture parameters (toughness, <strong>and</strong> sub-critical crack-growthcharacteristics) <strong>and</strong> to analyse brittle contact damage problems (erosion, wear) [1]. Theirapplications have been extended over the last two decades with the development <strong>of</strong> instrumentedequipments that allow the continuous measurement <strong>of</strong> the indenter depthunder loading [2–4]. Instrumented indentation is a sensitive technique that can probe themechanical properties <strong>of</strong> materials (Young modulus <strong>and</strong> hardness) at submicron scalesfrom the load–displacement data (Fig. 1). Loads at the milli-Newton scale <strong>and</strong> displacementslower than 1 nm can be measured. It was used for studying metal dislocations[5, 6], toughened ceramics fracture behaviour [7], material coatings [8, 9], residualstresses [10] <strong>and</strong> the tribological behaviour <strong>of</strong> materials [11–13]._________* Corresponding author, e-mail: a_chorfa@yahoo.fr
256A. CHORFA et al.Fig. 1. Typical load–displacement indentationcurveWhen a Vickers indenter is loaded against a brittle material surface, it inducesa plastic zone under the residual imprint. Above a critical loading level, in the postthresholddomain, two crack systems form during a loading–unloading cycle. A radialmediancracks system evolves normal to the surface along the imprint diagonals followedby a lateral crack system parallel to the surface [1] (Fig. 2).Fig. 2. Vickers indentation crack systems in glassThe material fracture toughness can be evaluated by measuring the radial cracks<strong>and</strong> the lengths <strong>of</strong> imprint diagonals with the knowledge <strong>of</strong> the applied load <strong>and</strong> thematerial elastic modulus using formula <strong>of</strong> Anstis et al. [14]:KIcE P= 0.016(1)3/2H Cwhere P is the peak applied indentation load, E is the elastic modulus, H v is the materialhardness <strong>and</strong> C is half the length <strong>of</strong> the two radial cracks (measured from the imprintcentre).v
Mechanical behaviour <strong>of</strong> glass during cyclic instrumented indentation 257Both the hardness <strong>and</strong> the elastic modulus can be derived from the load–displacement curve. Figure 1 shows a typical load–displacement indentation curveduring a loading–unloading cycle. In this figure, h m represents the displacement at thepeak load P max , h c is the depth along which the indenter is in contact with the sampleduring loading, h f is the final displacement after complete unloading, S is the initialunloading contact stiffness. From the load–displacement curve, the hardness obtainedat the peak load is defined as:H = (2)Awhere A is the projected contact area. Determining the projected contact area from a load–displacement curve requires the contact depth h c to be known. The elastic modulus <strong>of</strong> theindented sample can be inferred from the initial unloading contact stiffness [15]:dPS = (3)dhBrittleness is crucial to ceramic <strong>and</strong> glass materials in contact damage issues. Theranking <strong>of</strong> susceptibilities <strong>of</strong> brittle materials to contact damage is based on indentationbrittleness indexes. With the use <strong>of</strong> the Vickers indentation, Lawn <strong>and</strong> Marshall [16] proposedthe brittleness index B, defined as the ratio <strong>of</strong> the hardness H to the fracturetoughness K 1c :P maxHB = (4)KCyclic fatigue <strong>characterization</strong> is usually used for describing the degradation <strong>of</strong>the mechanical properties <strong>of</strong> metals with time under repeated subcritical loads. Cyclicfatigue on brittle materials has not been extensively studied as for metals because itwas thought insignificant in terms <strong>of</strong> their lack <strong>of</strong> plasticity. Some ceramics exhibit themechanical fatigue effect related to the microstructure toughening mechanisms presentin these materials [17–19]. Without any toughening mechanisms, glasses are consideredresistant to mechanical cyclic fatigue. The observed glass mechanical strengthdeterioration under cyclic loading was explained by stress corrosion (environmentallyassisted crack growth process).However, recent works on borosilicate glass showed an evidence <strong>of</strong> a mechanicaleffect in addition to the stress corrosion effect at very low sub-critical crack growthvelocities, using a st<strong>and</strong>ard fatigue test method [20]. In the context <strong>of</strong> brittle contactdamage problems, repeated indentation was used to study the cyclic fatigue <strong>of</strong> ceramics[21–23]. The method is based on the relation between the applied indentation load<strong>and</strong> the number <strong>of</strong> subsequently repeated indentations needed to produce radial cracks(for sub-threshold loads) [23], or chipping (for post-threshold loads) [21].1c
258A. CHORFA et al.2. ExperimentalCSM indentation equipment (Micro-Combi-Tester, CSM Instruments, Switzerl<strong>and</strong>)was used for our tests. It is essentially composed <strong>of</strong> three parts, as shown inFig. 3. The first part corresponds to the indentation <strong>and</strong> scratch instrument. It hasa sample holder table (4), an indenter holder (3) connected to the amplification <strong>and</strong>signal transformation system (1) <strong>and</strong> an acoustic probe (2). The second part consists <strong>of</strong>an optical system that enables imprint observation <strong>and</strong> magnification with the use <strong>of</strong>different objectives (6) <strong>and</strong> a display screen. The third part is the computer (7) usedfor test programming <strong>and</strong> data acquisition.Fig. 3. Scheme <strong>of</strong> the CSM indentation tester. See the text for detailsTable. 1. Chemical compositions [wt. %] <strong>of</strong> the tested glassesSoda lime glassBorosilicate glassOxide Content Oxide ContentSiO 2 72.851 SiO 2 69.734Al 2 O 3 1.354 Al 2 O 3 2.549Na 2 O 12.729 Na 2 O 6.761K 2 O 0.478 K 2 O 3.071CaO 8.249 CaO 1.508MgO 4.097 B 2 O 3 12.086Fe 2 O 3 0.098 ZrO 2 0.399SO 3 0.151 SO 3 0.033BaO 0.007 BaO 2.318TiO 2 0.469 ZnO 1.115Soda lime <strong>and</strong> borosilicate flat glass samples were used in this study. Their chemicalcompositions are given in Table 1. The sample thicknesses were 3 <strong>and</strong> 5 mm for the sodalime <strong>and</strong> borosilicate glasses, respectively. Samples <strong>of</strong> the dimensions 40×20 mm 2 werefabricated. They were annealed at 530 °C for 40 min in order to eliminate residual
Mechanical behaviour <strong>of</strong> glass during cyclic instrumented indentation 259stresses. Each sample was glued to a metallic pellet fixed on the sample holder. Itssurface was previously cleaned before testing.Indentations have to be spaced apart by 2 mm intervals in order to avoid their mutualinteractions. The peak loads applied for the different indentations were: 1 N, 2 N,3 N, 4 N <strong>and</strong> 5 N. For each load, the number <strong>of</strong> loading–unloading cycles was variedfrom 1 to 5. The loading <strong>and</strong> unloading speed was maintained at a constant rate <strong>of</strong>1 N/min. A dwell time <strong>of</strong> 5 s at the peak load was used at every cycle. The minimalcontact load during unloading was 0.2 N. Every test was repeated three times in orderto get reliable results. Imprint micrographs were systematically taken for both glasses.3. Results <strong>and</strong> discussionThe load–displacement curves obtained during repeated indentations under the5 N peak load for the two glasses are presented in Fig. 4. It can be noticed that there isa hysteresis effect <strong>and</strong> a looping shift toward higher displacements as the number <strong>of</strong>repeated indentations increases, which are more pronounced for soda lime glass thanfor borosilicate glass.Fig. 4. Cyclic load–displacement curves for:a) soda lime glass, b) borosilicate glass
260A. CHORFA et al.The hysteresis effect reveals that the unloading is not only due to elastic recoverybut includes also a certain amount <strong>of</strong> plastic reversibility. The dissipated energy relatedto non-elastic effects during the hysteresis process can be measured from theobtained closed loop surfaces. This energy, more important for soda lime glass, decreasesas the indentation cycle number increases. The permanent penetration depthafter the fifth cycle is 5 μm <strong>and</strong> 3.9 μm for the soda lime <strong>and</strong> the borosilicate glass,respectively. This leads to a smaller elastic recovery E r for soda lime glass (E r is theratio <strong>of</strong> the recovered to the total surface <strong>of</strong> the loading displacement curve) [24].Fig. 5. Dependence <strong>of</strong> hardness on the number <strong>of</strong> indentation cycles for 5 N peak loadThe hardness values (Fig. 5) reveal a similar decreasing trend upon the increasingnumber <strong>of</strong> indentation cycles for both glasses. It is probably related to the hysteresis effect.Such a trend was not observed with subthreshold loads in other papers when the three firstcycles were avoided [3]. The measured values <strong>of</strong> hardness from the first load–displacement curve (6.2 GPa <strong>and</strong> 7.27 GPa for the soda lime glass <strong>and</strong> the borosilicateglass, respectively) are higher than the previously reported values (5 GPa <strong>and</strong> 6 GPa). Thelower values obtained at the fifth indentation are closer to these values. Based on the meanvalue obtained from three measurements in every test, it is noticed that the hardness valuesobtained with instrumented indentation exhibit an insignificant variation between 0.4%<strong>and</strong> 0.94% for the first indentation <strong>and</strong> the fifth one, respectively.Fig. 6. Dependence <strong>of</strong> the elastic modulus on the number <strong>of</strong> indentation cycles for 5 N peak load
Mechanical behaviour <strong>of</strong> glass during cyclic instrumented indentation 261Fig. 7. Dependence <strong>of</strong> radial crack lengthon the number <strong>of</strong> indentation cycles using different peak loadsFig. 8. Dependence <strong>of</strong> fracture toughness on the number<strong>of</strong> indentation cycles for: a) soda lime glass, b) borosilicate glassThe obtained elastic moduli for the borosilicate glass seem to stabilize after thefirst indentation cycle, as seen in Fig. 6. Contrarily, the values obtained for the sodalime glass appear less consistent with the more pronounced hysteresis effect. It can benoted that Young’s moduli obtained using instrumented indentation for both glasses,exhibit a significant scatter. Typical variations are in the range from 1% for the first
262A. CHORFA et al.indentation to 6% for the fifth indentation. Nevertheless, it remains acceptable if oneconsiders the fact that Young’s moduli, obtained by instrumented indentation, rely onlocalized measurements, highly sensitive to local defects like micro-cracks, <strong>and</strong> cumulativeresidual stresses induced during the indentation cycles.Figure 7 shows the radial crack length evolution with the cycle numbers for variouspeak loads corresponding to the two glasses. The same increasing trend <strong>of</strong> theradial crack lengths clearly appears for all peak indentation loads. This is probably dueto the increase in the residual stresses as the number <strong>of</strong> cycles increases.For both glasses, the obtained values <strong>of</strong> fracture toughness from the Anstis et al.formula (Fig. 8) are much lower than previously accepted values. The determination<strong>of</strong> fracture toughness is not only influenced by the variation <strong>of</strong> the hardness <strong>and</strong>Young modulus, but also by the cumulative residual stresses induced during the indentationcycles. With regard to the obtained variations <strong>of</strong> hardness <strong>and</strong> the Youngmodulus, the observed decrease in the fracture toughness with the cycle number canbe explained by the effect <strong>of</strong> cumulative residual stresses on the propagation <strong>of</strong> theradial cracks. This effect is more apparent on the borosilicate glass.Fig. 9. Vickers indentation imprints for 4 N peak load after 5 cycles(×400): a) soda lime glass, b) borosilicate glassFor a peak load <strong>of</strong> 5 N, soda lime glass was found to have a brittleness index that increasesfrom 9.98 μm –1/2 at the first cycle up to 10.60 μm –1/2 at the fifth cycle. For the sametesting conditions, the borosilicate glass showed a variation from 10.19 μm –1/2 up to11.24 μm –1/2 . This increase <strong>of</strong> the brittleness index is clearly related to the changes in fracturetoughness, which is more important than that <strong>of</strong> the hardness. Observations <strong>of</strong> the twoglasses indentation imprints generated during the cyclic loading showed more pronouncedscaling in the borosilicate case. The contact damage characteristics (imprints, radial cracks,etc.) for the soda lime glass did not vary that much during cycling. The photographs inFig. 9 show longer radial cracks for soda lime glass under the same peak load (4 N).4. ConclusionsFor the mechanical properties obtained during repeated indentations, we observe asimilar qualitative behaviour for both soda lime <strong>and</strong> borosilicate glasses. The hardness
Mechanical behaviour <strong>of</strong> glass during cyclic instrumented indentation 263evaluation is clearly influenced by the hysteresis effect affecting the load–displacementcurves. The values obtained during the first four cycles are higher than thoseusually accepted. The values <strong>of</strong> the Young modulus seem to stabilize after the firstcycle <strong>and</strong> are closer to expected values. It is therefore important to reduce the hysteresiseffect, as was suggested in the literature, by using a longer dwell time at the peakload <strong>and</strong> avoid the first cycles, where this effect is preponderant. The obtained valuesfor the fracture toughness are much lower than the accepted values for both glasses.They decrease, particularly for the borosilicate glass, as the cycle number increases.This is probably due to the cumulative residual stress effect on the radial crack propagation.From the brittleness index values, it appears that the use <strong>of</strong> instrumented Vickersindentation is appropriate for detecting the variation in the brittleness index.References[1] LAWN B.R., Fracture <strong>of</strong> Brittle Solids, 2nd Ed., Cambridge University Press, Cambridge, 1993.[2] OLIVER W.C., PHARR G.M., J. Mater. Res., 7 (1992), 1564.[3] PHARR G.M., Mater. Sci. Eng. A, 253 (1998), 151.[4] FISHER-CRIPPS A.C., Nanoindentation, 2nd Ed., Springer, New York, 2002.[5] NIX W.D., GAO H., J. Mech. Phys. Solids., 46 (1998), 411.[6] CORCORAN S.G., COLTON R.J., LILLEODDEN E.T., GERBERICH W.W., Phys. Rev. B, 55 (1997), 16057.[7] CLARKE D.R., TANDON R., Mater. Sci. Eng. A, 195 (1995), 207.[8] KRAFT O.K., SCHWAR Z., BAKER S.P., FREUND B., HULL R., Mater. Res. Soc., 673 (2001), 131.[9] TSUI T.Y., PHARR G.M., J. Mater. Res., 14 (1999), 292.[10] SWADENER J.G., TALJAT B., PHARR G.M., 16 (2001), 2091.[11] RANDALL N.X., CONSIGLIO R., Rev. Sci. Instrum., 71 (2000), 2796.[12] JARDRET V., LUCAS B.N., OLIVER W.C., RAMAMURTHY A.C., J. Coating Technol., 72 (2000), 79.[13] LI X.D., BHUSHAN B., Thin Solid. Films, 398 (2001), 313.[14] ANSTIS G.R., CHANTIKUL P., LAWN B.R., MARSHALL D.B., J. Amer. Ceram. Soc., 64, 9 (1981), 533.[15] LI X.D., BHUSHAN B., J. Mater. Charact., 48 (2002), 11.[16] LAWN B.R., MARSHALL D.B., J. Am. Ceram. Soc., 62 (1979), 347.[17] EVANS A.G., FULLER E.R., Metall. Trans. A, 5 (1974), 27.[18] GIGU F.J., Mater. Sci. Lett., 13 (1978), 1357.[19] DAUSKARDT R.H., YU W., RITCHIE R.O., J. Am. Ceram. Soc., 70 (1987), 248.[20] DILL S.J., BENNISON S.J., DAUSKARDT R.H., J. Am. Ceram. Soc., 80 (1997), 773.[21] REECE M.J., GUIU F., J. Am. Ceram. Soc., 73 (1990), 1004.[22] TAKAKURA E., HORIBE S., J. Mater. Sci., 27 (1992), 6151.[23] BANERJEE R., SARKAR B.K., Glass Sci. Technol., 68 (1995), 177.[24] SUZUKI K., BENINO Y., FUJIWARA T., KOMATSU T., J. Am. Ceram. Soc., 85 (2002), 3102.Received 17 December 2008Revised 25 August 2009
Materials Science-Pol<strong>and</strong>, Vol. 28, No. 1, 2010A novel technique for the synthesis<strong>of</strong> CaCu 3 Ti 4 O 12 ceramicsS. SEN 1* , P. SAHU 1 , K. PRASAD 21 Materials Science <strong>and</strong> Technology Division, National Metallurgical Laboratory,Jamshedpur-831007, India2 Material Research Laboratory, T.M. Bhagalpur UniversityA novel, low temperature synthesis technique is developed for fabrication <strong>of</strong> <strong>nanocrystalline</strong>CaCu 3 Ti 4 O 12 ceramic powders, using inexpensive <strong>and</strong> easily available reagents. Structural <strong>and</strong> microstructural<strong>characterization</strong> was undertaken by X-ray diffraction, scanning electron microscopy <strong>and</strong> transmissionelectron microscopy. The confirmation regarding the phase formation was done using the Reitveldanalysis. The compound belongs to the cubic system with the lattice parameter a = 7.3985 Å, whichagrees well with the values reported in the literature. The particles formed were spherical in shape, withthe average size <strong>of</strong> 70 nm.Keywords: <strong>nanocrystalline</strong> materials; XRD; Reitveld analysis; SEM1. IntroductionDielectric materials have many technological applications such as capacitors,resonators <strong>and</strong> filters. It is commonly accepted that high dielectric ceramic capacitorswith Ba/Pb based perovskite oxides are indispensable for modern electronic devices<strong>and</strong> are found to be suitable for a wide range <strong>of</strong> applications. In general, these compoundsbelong to the perovskite structure where high electric permittivities are alwaysassociated with ferroelectric or relaxor properties, with a maximum depending on futemperature, due to phase transition. CaCu 3 Ti 4 O 12 (CCTO) has the cubic perovskitecrystal structure <strong>and</strong> unusual dielectric properties [1–3]. It exhibits an enormouslylarge, low-frequency electric permittivity ε ′ (ca. 10 4 ), for both single crystal <strong>and</strong> ceramicsat room temperature, <strong>and</strong> remains constant over 100–380 K at low frequencies.According to some researchers, this stunning dielectric behaviour is intrinsic [5],while others claim that it arises from external effects such as spatial inhomogene-_________* Corresponding author, e-mail: shrabanee@nmlindia.org
266S. SEN et al.ity [6], contact effect [7] or internal barrier-layer capacitors (IBLC). While the stillexist controversies with respect to the mechanism, the IBLC explanation is ratherwidely accepted. Most <strong>of</strong> the reports were done on bulk materials, which were preparedby solid state reaction from metal oxides at higher temperature with severalintermediate grindings. This method requires tedious work, relatively long reactiontimes <strong>and</strong> high temperature conditions, <strong>and</strong> still may result in unwanted phase because<strong>of</strong> limited atomic diffusion through micrometer sized grains. On the other h<strong>and</strong>,chemical methods provide atomic level mixing <strong>of</strong> individual components, <strong>and</strong> result inthe formation <strong>of</strong> <strong>nanocrystalline</strong> materials at much lower temperatures compared withsolid state reactions. There are many chemical methods, such as sol-gel, coprecipitation,precursor solution technique <strong>and</strong> hydrothermal process [8–13], whichhave already been reported for the synthesis <strong>of</strong> CCTO ceramics.Here, we made a first time attempt to synthesize CCTO ceramics by precursor solutiontechnique using easily available <strong>and</strong> inexpensive reagents at low temperature,<strong>and</strong> further characterize the compound by several different techniques.2. ExperimentalNanocrystalline CaCu 3 Ti 4 O 12 powder was prepared by a metal ion–lig<strong>and</strong> complexbased precursor solution evaporation method using high purity raw materials.Calcium carbonate (CaCO 3 ) (Merck), copper(II) acetate (Cu(CH 3 COO) 2 ) (Merck),ethylenediaminetetraacetic acid (EDTA) (SRL, 99%), triethanolamine (TEA) (Merck,>97%) <strong>and</strong> titanium tartarate were used. The required amount <strong>of</strong> calcium carbonatewas first dissolved in a minimum amount <strong>of</strong> dilute (6 M) nitric acid to make a clearsolution. The solution was then boiled for 10 min to remove CO 2 . The requiredamount <strong>of</strong> copper(II) acetate dissolved in water was then added, <strong>and</strong> finally EDTAwas added to the solution <strong>and</strong> stirred. In order to get a clear solution, dilute ammoniasolution [(2 M) was further added (pH ≈ 8). Titanium tartarate was obtained in thelaboratory in the following way. Titanium oxide (Aldrich, 98%) was dissolved in HF(M/s Merck, 40% solution, 1:7 mole ratio) by heating on a water bath for 72 h. A clearsolution <strong>of</strong> titanium fluoro complex was produced. The addition <strong>of</strong> dilute ammonia to thatclear solution resulted in insoluble hydrous titanium hydroxide (TiO 2·nH 2 O) which wasthen separated from its solutions by filtration <strong>and</strong> was repeatedly washed with 5% ammoniato yield hydrous titanium oxide free from chloride ions. After estimating the amount <strong>of</strong>TiO 2 present in TiO 2·nH 2 O by heating its small part at 1000 °C for 2 h, the hydrous TiO 2was dissolved in tartaric acid (Quest, 99%) (1:4 mol) solution to obtain titanium tartaratethrough constant stirring at 60 °C for 8 h. Then a required amount <strong>of</strong> titanium tartarate <strong>and</strong>TEA was mixed. The final pH <strong>of</strong> this mixture was fixed at pH ca. 8 using dilute ammoniasolution (2 M). Finally, both the solutions were mixed thoroughly <strong>and</strong> heated over a hotplate (ca. 200 °C) for complete evaporation under constant stirring. Continuous heating <strong>of</strong>the solution led to foaming <strong>and</strong> puffing. During evaporation, the nitrate ion provides anin situ oxidizing environment for TEA, which partially converts the hydroxyl groups
A novel technique for the synthesis <strong>of</strong> CaCu 3 Ti 4 O 12 ceramics 267<strong>of</strong> TEA into carboxylic acids. On complete dehydration <strong>of</strong> the precursor solution, themetal complexes, TEA <strong>and</strong> EDTA, decomposed with the evaluation <strong>of</strong> dense fumes <strong>and</strong>resulted in a voluminous, fluffy, black carbonaceous mass, which was calcined at 700 °Cto get the precursor powder.The crystal structure <strong>of</strong> the pellet was confirmed by powder X-ray diffraction (XRD)using CuK α radiation from a high resolution PANalytical X’Pert PRO diffractometerequipped with a secondary beam graphite monochromator <strong>and</strong> operating with the Bragg–Brentano geometry. For determination <strong>of</strong> the instrumental broadening function, a speciallyprepared Si sample was used [14]. The microstructural <strong>characterization</strong> was done usinga JEOL-JSM 5800 microscope <strong>and</strong> JEOL-JSM-2010. In order to study the electrical properties,pellets were formed <strong>and</strong> sintered at 800 °C. The impedance properties were measuredwith an HIOKI 3532 LCR METER with a high temperature attachment.3. Results <strong>and</strong> discussionThe phase formation <strong>of</strong> the compound was confirmed by XRD, which matchedwell with the results reported in the literature. It was further confirmed by the Reitveldanalysis using the MAUD program (Version 2.044). The XRD pattern <strong>of</strong> CCTO wassimulated with the cubic space group Im 3 <strong>and</strong> atoms at the following Wyck<strong>of</strong>f positions:Ca (0,0,0), Cu (0,1/2, 1/2), Ti (1/4,1/4,1/4), O (0, 1/4, 1/4) (ICDD PDF Card #21-0140). The Rietveld analysis <strong>of</strong> the XRD pattern also confirmed the formation <strong>of</strong>the CCTO phase with the lattice parameter a = 7.3985 Å, which agreed well with thevalues reported in the literature. With regard to the microstructure analysis for theextraction <strong>of</strong> particle size <strong>and</strong> r.m.s. microstrain values using the Rietveld methodfrom the ‘size–strain’ broadening, we considered the model proposed by Popa involvingthe expansions <strong>of</strong> spherical harmonics for the prediction <strong>of</strong> the particle shapes[154]. This model accounts for the anisotropic X-ray peak broadening, i.e. the modelis capable <strong>of</strong> reproducing the case where in addition to the regular diffracting angle(2θ) dependent broadening, the broadening becomes a function <strong>of</strong> the diffractingplanes (hkl) as well. From the ‘size-strain’ analysis, it turned out that the particle sizevalues are nearly isotropic along all major [hkl] directions. In other words, it can besaid that the particles are nearly spherical with average diameter ca. 70 nm havingnegligible r.m.s. strain (10 –4 ).SEM micrographs <strong>of</strong> the calcined powders <strong>and</strong> sintered pellets are shown inFig. 1. Due to the fineness <strong>of</strong> the particle, agglomeration took place, which resulted inthe formation <strong>of</strong> a network resembling foam. The equation for grain growth at fixedtemperature is:( ( ))mG − G 0 m= Ktwhere G is the average size, G(0) is the average size at t = 0, K is a constant <strong>and</strong> m is takenas 3. In nanomaterials, grain growth is inhibited by open porosity, growth inhibitors <strong>and</strong>grain boundary segregation. Thus the size <strong>of</strong> the grains does not increase much.
268S. SEN et al.Fig. 1. SEM micrographs<strong>of</strong> calcined CCTO powdersFig. 2. TEM micrographs<strong>of</strong> calcined CCTO powdersFig. 3. Selected area electron diffraction (SAED)pattern <strong>of</strong> CCTO powdersThe uniform distribution <strong>of</strong> the particles obtained from TEM is observed (Fig. 2)<strong>and</strong> the shapes <strong>of</strong> the particles are spherical. The particle size was calculated with thehelp <strong>of</strong> UTHSCA IMAGE TOOL considering 50 particles. After statistical analysis,the average particle size was found to be ca. 65 nm. This is in agreement with the particlesize obtained from the Reitveld analysis. The corresponding selected area electrondiffraction pattern (Fig. 3) shows a symmetrically dotted pattern, implying thatthe nanoparticles are well crystallized.Fig. 4. Plot <strong>of</strong> the real <strong>and</strong> imaginary parts <strong>of</strong> impedance <strong>of</strong> CCTO powders
A novel technique for the synthesis <strong>of</strong> CaCu 3 Ti 4 O 12 ceramics 269The electrical behaviour <strong>of</strong> the compound was studied using the ac technique <strong>of</strong>CIS. Figure 4 shows the plot <strong>of</strong> the real <strong>and</strong> imaginary parts <strong>of</strong> impedance at highertemperatures. The impedance spectrum is characterized by the appearance <strong>of</strong> semicirculararcs whose pr<strong>of</strong>ile changes as the temperature increases. Also at higher temperaturesonly one semicircular arc was present, which clearly showed that only the bulkeffect was prominent. The centre <strong>of</strong> the arcs lies below the real axis (Z ′ ), which suggeststhat the relaxation is <strong>of</strong> polydispersive non-Debye type.The complex impedance (Z * (ω)) can be expressed as:∗Ζ ( ω)=R⎛ jω⎞1+ ⎜ ⎟⎝ω0⎠where the exponent n represents the magnitude <strong>of</strong> the departure <strong>of</strong> the electrical responsefrom the ideal condition, <strong>and</strong> is greater than zero for non-Debye type phenomena.1−nFig. 5. Dependence <strong>of</strong> the imaginary part <strong>of</strong> impedance on frequencyThe dependence <strong>of</strong> the imaginary part <strong>of</strong> impedance (Z″) on frequency at highertemperatures is shown in Fig 5. A typical peak broadening, which is slightly asymmetricalin nature, was observed at higher temperatures. This asymmetric broadening <strong>of</strong>the peaks suggests the presence <strong>of</strong> electrical processes in the material with a spread <strong>of</strong>the relaxation time. The relaxation species can be defect tanδ complexes. In the case <strong>of</strong>dielectric materials, the localized relaxation dominates [15, 16] (i.e., defect relaxation)because <strong>of</strong> the low dielectric ratio r, (r = ε s /ε ∞ , ε s <strong>and</strong> ε ∞ , electric permittivity at low<strong>and</strong> high frequencies, respectively).
270S. SEN et al.Fig. 6. Dependence <strong>of</strong> the dc conductivity on the reciprocal temperatureThe bulk conductivity <strong>of</strong> the CCTO compound at higher temperatures was evaluatedfrom the impedance data using the equation:σdc=tR Abwhere R b is the bulk resistance, t the thickness <strong>and</strong> A the area <strong>of</strong> the electrode depositedon the sample. The value R b is obtained from the low frequency intercept <strong>of</strong> thesemicircle on the real axis Z ′ axis in the complex impedance plot. The value <strong>of</strong> theapparent bulk conductivity (σ b ) a determined from the complex impedance plots can betreated approximately as the true value σ b because <strong>of</strong> the negligibly small thickness <strong>of</strong>the grain boundary layer in the sample. The dc conductivity also follows the Arrheniuslaw, <strong>and</strong> the activation energy was calculated from the slope <strong>of</strong> the linear portion <strong>of</strong>the plot <strong>of</strong> σ vs. 10 3 /T (Fig. 6) [17]. It was found to be 0.3 eV at higher temperatures<strong>and</strong> 0.38 eV at lower temperatures. This value is close to the single crystal value <strong>of</strong>0.24 eV, which again supports the existence <strong>of</strong> the internal barrier layers inside thegrains [18, 19].4. ConclusionsCaCu 3 Ti 4 O 12 ceramics were fabricated by the precursor solution technique. Keepingin mind the importance <strong>of</strong> this compound, this process provides a novel <strong>and</strong> reproducibleroute for preparation using two complexing agents (EDTA <strong>and</strong> TEA). XRDanalysis confirmed the formation <strong>of</strong> cubic phase, with a lattice parameter value <strong>of</strong>
A novel technique for the synthesis <strong>of</strong> CaCu 3 Ti 4 O 12 ceramics 2717.3985 Å. Spherical particles <strong>of</strong> average 65 nm size were observed from TEM micrographsafter calcination at 700 °C. The presence <strong>of</strong> single semicircular arcs obtainedfrom the impedance plots depicted the bulk effect only. The conductivity plot followsthe Arrhenius law. The obtained activation energy was close to that <strong>of</strong> a single crystal.References[1] SUBRAMANIN M.A., DONG L., DUAN N., REISNER B.A., SLEIGHT A.W., J. Solid State Chem.,151 (2000), 323.[2] RAMIREZ A.P., GARDEL M., BLUMBERG G., LI. D., VOGT T., SHAPIROS M., Solid State Commun.,115 (2000), 217.[3] SINCLAIR D.C., ADAMS T.A., MORRISON F.D., WEST A.R., Appl. Phys. Lett., 80 (2002), 2153.[4] HOMES C.C., VOGT T., SHAPIRO S.M., WAKIMOTO S., RAMIREZA P.R., Science, 293 (2001), 673.[5] COHEN M.H., NEATON J.B., VANDERBIT D., J. Appl. Phys., 94 (2003), 3299.[6] LUNKNHEIMER P., FICHTL R., EBBIMGHAUS S.G., LOIDL A., Phys. Rev. B, 70 (2004), 172102.[7] LIU J., SUI Y., DUAN C., NEI W., SMITH R.W., HARDY J.R., Chem. Mater., 18 (2006), 3878.[8] JHA P., ARORA P., GANGULY A.K., Mater .Lett., 57 (2003), 2443.[9] JIN S., XIA H., ZHANG Y., XU J.G., J. Mater. Lett., 61 (2007), 1404.[10] MASINGBON C., THONGBAI P., MAENSIRI S., YAMWONG T., SERAPHIN S., Mater. Chem. Phys.,109 (2008), 15.[11] LIU J., SUI Y., DUAN C., MWI W.N., SMITH R.W., HARDY J.R., Chem. Mater., 18 (2006), 3878.[12] YU H., LIU H., LUO D., CAO M., J. Mater. Res., 208 (2008), 145.[13] BARBIER B., COMBETTES C., GUILLEMET-FRITSCH S., CHARTIER T., ROSSIGNOL F., RUMEAU A., LEBEY T.,DUTARDE E., J. Eur. Ceram. Soc., 29 (2009), 731.[14] VAN BERKUM J.G.M., SPRONG G.J.M., DE KEIJSER TH.H., DELHEZ R., SONNEVELD E.J., PowderDiffr., 10 (1995), 129.[15] POPA N.C., J. Appl. Cryst., 31 (2006), 176.[16] SEN S., CHOUDHARY R.N.P., TARAFDAR A., PRAMANIK P., J. Appl. Phys., 99 (2006), 124114.[17] MACDONALD J.R., Impedance Spectroscopy, Wiley, New York, 1987.[18] FANG T., MEI L.T., HO H.F., Acta Mater., 54 (2006) 2867.[19] LI J., SLEIGHT A.W., SUBRAMANIAN M.A., Sol. Stat. Commun,135 (2005) 260.Received 17 December 2008Revised 1 April 2009
Materials Science-Pol<strong>and</strong>, Vol. 28, No. 1, 2010Growth orientation transition <strong>and</strong> metal-likeconductivity <strong>of</strong> Ti, Al co-doped ZnO filmsM. JIANG * , X. LIU, H. WANG, J. XUGuangxi Key Laboratory <strong>of</strong> Information Materials, Guilin University <strong>of</strong> Electronic Technology,Guilin, Guangxi 541004, P.R. ChinaTi, Al co-doped ZnO thin films have been fabricated by radio frequency magnetron sputtering <strong>and</strong>post-vacuum-annealing techniques on glass substrates. For annealing temperatures below 723 K, theroom temperature resistivity <strong>of</strong> these films was found to decrease as the annealing temperature increased.The lowest resistivity (6.75×10 –4 Ω·cm), indicating metal-like conductivity, was found at 723 K. Thepost-annealing temperature dependent on the resistivity <strong>of</strong> these films also showed a metal–semiconductor transition at 723 K. It was also found a growth orientation transition <strong>of</strong> these films from(002) to (100) with the annealing temperature up to 773 K.Keywords: growth-orientation transition; metal-like conductivity; Ti, Al co-doped; ZnO thin film; vacuumannealing1. IntroductionTransparent conducting oxides (TCOs) have found applications in several optoelectronicdevices such as light emitting diodes (LEDs), solar cells, <strong>and</strong> flat panels aswell as flexible displays [1–3]. Indium tin oxide (ITO) is the most commonly usedTCO for these applications because <strong>of</strong> its high transmittance in the visible region <strong>and</strong>the resistivity close to 1.0×10 –4 Ω·cm [4, 5]. However, a high cost <strong>and</strong> scarce resources<strong>of</strong> In limit its usage in these devices. This has led researchers to explore alternativematerials for TCO devices. Some <strong>of</strong> the TCOs which have shown transmittance <strong>and</strong>resistivity values close to those <strong>of</strong> ITO are ZnO:Al, ZnO:Ga, SnO 2 :F, TiO 2 :Nb etc.Among these, ZnO is the most favourable material, because <strong>of</strong> its benign nature, relativelylow cost, good stability in hydrogen plasma process, <strong>and</strong> non-toxicity [5, 6].Therefore, there is a considerable interest in underst<strong>and</strong>ing the electrical <strong>and</strong> transportproperties <strong>of</strong> doped ZnO films which is critical for further improvement <strong>of</strong> TCOscharacteristics._________*Corresponding author, e-mail: jiangmh@guet.edu.cn (M.H. Jiang)
274M. JIANG et al.Most <strong>of</strong> the careful doping studies have been performed by several techniques <strong>of</strong>various types in order to improve the performance <strong>of</strong> ZnO films [5, 7–10]. DopedZnO, especially Al-doped ZnO (ZATO), shows excellent transparency over the entirevisible spectrum <strong>and</strong> has better transport properties, due to higher electron mobility.For further improvement <strong>of</strong> properties <strong>of</strong> ZATO films, the co-doping effect <strong>of</strong> someimpurity <strong>and</strong> Al 3+ has been reported earlier [8, 11]. But the co-doping effect <strong>of</strong> Ti 4+<strong>and</strong> Al 3+ has not been reported so far. TiO 2 has a particular <strong>and</strong> useful physical propertyfor optical applications [12, 13]. TiO 2 was selected as dopant <strong>and</strong> expected toimprove the transmittance <strong>and</strong> transport properties for ZATO film. In this paper, wehave investigated the post-annealing, temperature dependent, transport properties <strong>of</strong>ZATO films grown on glass substrates at room temperature using the radio frequency(rf) magnetron sputtering technique. The investigation <strong>of</strong> a metal-like behaviour at lowtemperature has been investigated, being probably due to weak localization <strong>of</strong> thecharge carries at the defect sites, surface scattering <strong>and</strong> the annealing temperature. Inthe paper, a new observation <strong>of</strong> the growth-orientation transition from (002) to (100)with an annealing temperature <strong>of</strong> up to 773 K has also been reported; it is probablyrelated to the change <strong>of</strong> crystal surface energy induced by ionized impurities <strong>and</strong> massiveformation <strong>of</strong> oxygen vacancies <strong>and</strong> defects in ZnO films grown on glass substratesduring annealing.2. ExperimentalThe ZATO ceramic sputtering targets, <strong>of</strong> which the raw materials were mechanicalmixed powders, were fabricated by the conventional solid state sintering process inair. The following compositions were chosen: 97% ZnO + 1.5% Al 2 O 3 + 1.5 TiO 2(wt. %). The raw materials were commercially available ZnO, Al 2 O 3 (99.95% in purity)<strong>and</strong> TiO 2 (99.96% in purity) powders. The compacted targets were sintered at1573 K for 3 h in air.ZATO thin films were grown on glass substrates at room temperature by the rfmagnetron sputtering technique. The glass substrates were thoroughly cleaned usingabsolute ethanol, acetone <strong>and</strong> distilled water as solvents <strong>and</strong> ultrasonic technology,<strong>and</strong> then dried before loading in a deposition chamber. The chamber was evacuated tothe pressure <strong>of</strong> 8×10 –5 Pa, <strong>and</strong> the deposition was carried out under 1.6 Pa argon pressure.The ZATO films <strong>of</strong> 400–500 nm thick were annealed in the temperature range <strong>of</strong>298–823 K for 3 h under vacuum (ca. 10 –1 Pa).Crystallographic <strong>and</strong> phase structures <strong>of</strong> the ZATO thin films were determined usinga D8-Advance X-ray diffractometer with Cu K α radiation. A JSM-5610LV scanningelectron microscope (SEM) was used to investigate the surface morphologies <strong>of</strong>the deposited films. The electrical resistivity was measured using a st<strong>and</strong>ard four-pointprobe technique at room temperature.
Growth orientation transition <strong>and</strong> metal-like conductivity <strong>of</strong> Ti, Al co-doped ZnO films 2753. Results <strong>and</strong> discussionFigure 1 shows X-ray diffraction (XRD) patterns <strong>of</strong> the ZATO films annealed atvarious temperatures under vacuum for 3 h. The (100), (002) peaks are observed in theXRD patterns. The peaks correspond to a hexagonal wurtzite structure. The patternsshow that the ZATO films deposited <strong>and</strong> annealed are highly textured along the c axis,except for the films annealed at 773 K. The absence <strong>of</strong> additional peaks excludes thepossibility <strong>of</strong> any extra phases <strong>and</strong>/or large-size precipitates in the films. The aboveindicates that Al, Ti co-doping did not distort the original crystalline structure.Fig. 1. X-ray diffraction (XRD) patterns OF ZATO filmsannealed at various temperatures under vacuum (ca. 10 –1 Pa) for 3 hHowever, for the film annealed at 773 K, very strong (100) <strong>and</strong> weak (200), (002)peaks were observed, which suggests that the preferred growth orientation undergoesa transition from (002) to (100), which is related to the change <strong>of</strong> surface energy <strong>of</strong> thefilm crystals during the annealing. Theoretically, for the ZnO films, (002) plane is theclose-packed surface, <strong>and</strong> thus the value (1.6 J/m 2 ) <strong>of</strong> its surface energy is the lowestamong all the planes, which is the reason that ZnO film crystals preferentially grow alongthe c axis [14, 15]. However, after the high temperature (773 K) annealing, Al, Ti ionssufficiently substitute the sites <strong>of</strong> Zn ions in the ZATO film, which probably results in thechange <strong>of</strong> the closely-packed surface, <strong>and</strong> makes the surface energy value <strong>of</strong> the (100)plane be lowest being the reason for the change in the orientation <strong>of</strong> the recrystallizationgrowth. In order to prove that Al 3+ , Ti 4+ ions occupy Zn substitutional sites, the dependences<strong>of</strong> the lattice parameters a <strong>and</strong> c <strong>and</strong> the step-scanned (002) XRD line pr<strong>of</strong>iles <strong>of</strong>ZATO films on the annealing temperature have been recorded (Fig. 2).The lattice parameter c decreases as the annealing temperature increases to 723 K,<strong>and</strong> then it slightly increases till 773 K. The lattice parameter a also initially tends todecrease <strong>and</strong> then subsequently increases. This is a universal trend with the shift <strong>of</strong> 2θ
276M. JIANG et al.in the XRD patterns, as is seen from the (002) XRD line pr<strong>of</strong>iles <strong>of</strong> ZATO films atvarious annealing temperatures (Fig. 2) suggesting that the Al <strong>and</strong> Ti atoms occupy Znsubstitutional sites.Fig. 2. Annealing temperature dependence <strong>of</strong> the lattice parameters (a, c)<strong>and</strong> step-scanned (002) XRD line pr<strong>of</strong>iles <strong>of</strong> ZATO filmsAnnealing <strong>of</strong> ZnO under vacuum at 773 K also leads to massive formation <strong>of</strong> oxygenvacancies <strong>and</strong> defects in ZnO films grown on glass substrates. In order to verifythis supposition, ZATO films were annealed under oxygen atmosphere at 773 K for 3h. In their XRD patterns (Fig. 3), only the (002) peak is observed, which supports theabove supposition.Fig. 3. X-ray diffraction (XRD) patterns OF ZATO filmsannealed at 773 K under oxygen atmosphere for 3 h
Growth orientation transition <strong>and</strong> metal-like conductivity <strong>of</strong> Ti, Al co-doped ZnO films 277Fig. 4. Dependences <strong>of</strong> FWHM <strong>of</strong> (002) peak <strong>and</strong> averagegrain size <strong>of</strong> ZATO films on annealing temperatureFigure 4 shows the dependence <strong>of</strong> the full width at half maximum (FWHM) <strong>and</strong>average grain size on the annealing temperature. The FWHM decreased, that is, theaverage grain size became larger, as the annealing temperature increased. The smallest(100) peak FWHM exists when the annealing temperature is 773 K; this is the temperatureat which the largest grain size can be obtained. Figure 4 also shows that theannealing temperature dependence <strong>of</strong> both the (100) peak FWHM <strong>and</strong> the (002) peakFWHM is similar, that is, initially both the (100) peak FWHM <strong>and</strong> the (002) peakFWHM decrease as the annealing temperature increases up to 623 K, then slightlyincrease till 673 K, <strong>and</strong> then decrease till 773 K.Fig. 5. Dependence <strong>of</strong> the resistivity <strong>of</strong> ZATO films on the annealing temperature
278M. JIANG et al.Figure 5 shows the dependence <strong>of</strong> the resistivity <strong>of</strong> ZATO films on the annealingtemperature. The resistivity decreases as the annealing temperature increases up to723 K, due to the increased grain size <strong>and</strong> the decreasing scattering to electrons. Thenit clearly increases to 773 K, due to the growth-orientation transition from (002) to(100) as discussed previously, weak localization <strong>of</strong> the charge carriers at the defectsites <strong>and</strong> surface scattering. When the annealing temperature is 723 K, the semiconductor–metaltransition appears, at which, the lowest resistivity, 6.75×10 –4 Ω·cm, isachieved. The lower resistivity <strong>of</strong> ZATO films after thermal annealing can be explainedby the presence <strong>of</strong> Al, Ti ions at the substitutional sites <strong>of</strong> Zn ions. Furthermore,Al, Ti interstitial atoms change the oxygen vacancy characteristics, <strong>and</strong> desorption<strong>of</strong> oxygen atoms under vacuum, thereby causing a shift in the Fermi level. Byraising the annealing temperature, the atoms receive energy <strong>and</strong> migrate to relativeequilibrium positions. This induces a series <strong>of</strong> effects, for example, it reduces the latticestrain <strong>and</strong> the oxygen defect levels. In particular, it results in the appearance <strong>of</strong>a more perfect crystallite, <strong>and</strong> a pilling-up <strong>of</strong> donor, thereby weakening the grainboundary scattering <strong>and</strong> increasing the number <strong>of</strong> current carriers. The other reasonfor the lower resistivity is the growth <strong>of</strong> the average grain size as the annealing temperatureincreases, which reduces the grain boundary scattering [3, 4]. When the annealingtemperature is increased even further, a serious diffusion appears howeverbetween the glass substrates <strong>and</strong> the ZnO films, <strong>and</strong> consequently more defects areproduced in the films. Excessive defect levels <strong>and</strong> disorder caused by the impuritiesstrengthen the grain boundary scattering <strong>and</strong> reduce the number <strong>of</strong> current carriers.a) b)c)Fig. 6. SEM micrographs <strong>of</strong> ZATO films afterannealing under vacuum at: a) room temperature,b) 673 K <strong>and</strong> c) 773 K for 3 h
Growth orientation transition <strong>and</strong> metal-like conductivity <strong>of</strong> Ti, Al co-doped ZnO films 279Thus, the resistivity <strong>of</strong> the films starts to increase when annealing occurs at 773 K.Otherwise, the preferred growth orientation changes for a few grains in the films, <strong>and</strong>maybe also increases the resistivity <strong>of</strong> the films. A novel preferred orientation might<strong>of</strong>fer different properties.In order to illustrate the surface morphology <strong>of</strong> the ZATO films, scanning electronicmicroscopy (SEM) images are shown in Fig. 6. For the obtained ZATO films,uniform <strong>and</strong> dense surfaces with small grain sizes are observed, but these <strong>nanocrystalline</strong>surfaces do not show evident differences. The crystallite size, which can be estimatedusing the Scherrer formula, increases as the annealing temperature increases upto 773 K, as shown in Fig. 4 <strong>and</strong> is in the 10–45 nm range. This indicates the coalescence<strong>of</strong> the grains in ZATO films after thermal annealing at a different temperature.During deposition <strong>of</strong> ZATO films by sputtering onto glass substrates the growth tookplace by the nucleation <strong>and</strong> coalescence process. R<strong>and</strong>omly distributed nuclei mayhave formed first <strong>and</strong> then may have grown to form some observable “isl<strong>and</strong>s” whichcome closer to each other [8]. The larger ones appeared to grow by coalescence <strong>of</strong>smaller ones during annealing.4. ConclusionHigh-quality conducting ZATO films were grown on glass substrate by the rfmagnetron sputtering technique, showing stronger c axis orientation. After thermalannealing in vacuum at 723 K, the preferred growth orientation <strong>of</strong> ZATO filmschanges from the (002) to the (100) plane. The resistivity <strong>of</strong> ZATO films decreases asthe annealing temperature increases up to 723 K, <strong>and</strong> then clearly increases till 773 K.At 723 K, the semiconductor–metal transition appears, at which, the lowest resistivity,6.75×10 –4 , is achieved. For the obtained ZATO films, uniform <strong>and</strong> dense surfaces withsmall grain size are observed, but these <strong>nanocrystalline</strong> surfaces do not show evidentdifferences. The crystallite size is in the 10–45 nm range.AcknowledgementsThe authors are grateful to the Education Department <strong>of</strong> Guangxi Zhuang Autonomous Region <strong>and</strong>to the Guangxi Key Laboratory <strong>of</strong> Information Materials for supporting this research under the grantsNos. 200807LX121 <strong>and</strong> 0710908-09-Z.References[1] LEE J., METSON J., EVANS P.J., KINSEY R., BHATTACHARYYA D., Appl. Surf. Sci., 253 (2007), 4317.[2] AKHLESH G., COMPAAN A.D., Appl. Phys. Lett., 85 (2004), 684.[3] BAMIDURO O., MUNDLE H., KONDA R.B., PRADHAN A.K., Appl. Phys. Lett., 90 (2007), 252108.[4] WELLINGS J.S., CHAURE N.B., HEAVEHS S.N., DHARMADASA I.M., Thin Solid Films, 516 (2008),3893.[5] BHOSLE V., TIWARI A., NARAYAN J., J. Appl. Phys., 100 (2006), 033713.[6] ASHOUR A., KAID M.A., EL-SAYED N.Z., IBRAHIM A.A., Appl. Surf. Sci., 252 (2006), 7844.
280M. JIANG et al.[7] KIM Y.S., TAI W.P., Appl. Surf. Sci., 253 (2007), 4911.[8] LIN W., MA R.X., SHAO W., LIU B., Appl. Surf. Sci., 253 (2007), 5719.[9] ZHU X.W., LI Y.Q., LU Y., LI Y.W., XIA Y.B., J. Inorg. Mater., 22 (2007), 359.[10] SAITO K., HIRATSUKA Y., OMATA A., MAKINO H., KISHIMOTO S., YAMAMOTO T., HORIUCHI N.,HIRAYAMA H., Superlattice Microst., 42 (2007), 172.[11] TADATSGUMU M., SHINGO S., TOSHIHIRO M., Thin Solid Films, 398 (2001), 53.[12] XU L.H., SHI L.X., LI X.Y., J. Phys. Chem. Solids, 70 (2009), 511.[13] CHUNG J.L., CHEN J.C., TSENG C.J., J. Phys. Chem. Solids, 69 (2008), 535.[14] PEI Z.L., ZHANG X.B., WANG T.G., GONG J., SUN C., WEN L.S., Acta Metall. Sinca, 41 (2005), 84.[15] FUJIMURA N., NISHIHARA T., GOTO S., XU J., ITO T., J. Cryst. Growth, 348 (1993), 165.Received 25 November 2008Revised 8 May 2009
Materials Science-Pol<strong>and</strong>, Vol. 28, No. 1, 2010Enhancement <strong>of</strong> photovoltaic performance<strong>of</strong> quasi-solid state dye sensitized solar cellwith dispersion <strong>of</strong> a hole conducting agentS. RANI 1 , P.K. SHISHODIA 2 , R.M. MEHRA 1*1 Department <strong>of</strong> Electronic Science, University <strong>of</strong> Delhi, South Campus, New Delhi – 110 021, India2 Department <strong>of</strong> Physics & Electronics, Zakir Husain College,University <strong>of</strong> Delhi, New Delhi – 110 002, IndiaThe presence <strong>of</strong> a hole conducting agent in a quasi-solid state dye sensitized solar cell (DSSC) mayimprove cell parameters. The paper reports on the photovoltaic properties <strong>of</strong> two types <strong>of</strong> cells, one containinga layer <strong>of</strong> CuI on a dye coated ZnO electrode (cell A) <strong>and</strong> the other with CuI dispersed in a gelelectrolyte (cell B). The cell A generated a short circuit current density <strong>of</strong> 7.45 mA·cm –2 , an open-circuitvoltage <strong>of</strong> 0.56 V, a fill factor <strong>of</strong> 0.54 <strong>and</strong> an overall power conversion efficiency <strong>of</strong> 2.26% under100 mW·cm –2 (air mass: 1.5). In cell B, an enhancement in its performance was observed. The cellshowed 2.67% efficiency with a short circuit current density <strong>of</strong> 8.75 mA·cm –2 , an open-circuit voltage <strong>of</strong>0.59 V <strong>and</strong> a fill factor <strong>of</strong> 0.52. The increase in the performance is attributed to the improvement in thehole transport in the electrolyte. The efficiency <strong>of</strong> cell B was further increased to 3.38% by introducinga compact layer <strong>of</strong> ZnO 106 nm thick.Keywords: ZnO DSSC; layered CuI; dispersed CuI; ZnO compact layer1. IntroductionDye sensitized <strong>nanocrystalline</strong> solar cells have intensively been investigated, asthey <strong>of</strong>fer an attractive alternative to conventional p-n junction solar cells, because <strong>of</strong>their high efficiency, simple fabrication process <strong>and</strong> low production cost [1, 2]. Insolid state versions, the electrolyte present in the pores <strong>of</strong> a mesoporous oxide film isreplaced by a large b<strong>and</strong> gap p-type semiconductor [3–6]. Light is absorbed by the dyeadsorbed on the oxide surface. Upon excitation, the dye injects electrons into the conductionb<strong>and</strong> <strong>of</strong> the oxide <strong>and</strong> is regenerated by injection <strong>of</strong> holes into the p-type conductor.A great advantage <strong>of</strong> such systems with regard to conventional p-n junctions isthat only majority carriers are involved in the photoelectric conversion process._________* Corresponding author, e-mail: rammehra2003@yahoo.com
282S. RANI et al.TiO 2 based quasi-solid state dye sensitized solar cell (DSSC) produce energy conversionefficiencies as high as ca. 11%, Typical DSSC are normally arranged ina s<strong>and</strong>wich configuration, that is the space between dye sensitized semiconductor(e.g., TiO 2 ) <strong>and</strong> counter electrodes is filled with an organic solution containing I – /I 3–redox couple as a cell electrolyte. Problems such as leakage <strong>and</strong> solvent evaporationassociated with liquid electrolyte results in lower long-term stability <strong>and</strong> a decrease incell performance. Many efforts have been made to replace liquid electrolytes withsolid state or quasi-solid state ones such as inorganic p-type semiconductors [7], organichole conductors [8], polymer/polymer gels [9, 10] <strong>and</strong> other new materials[11, 12]. Inexpensive ZnO powder is expected to be an alternating wide b<strong>and</strong>gapsemiconductor because <strong>of</strong> its many important physical properties, such as large excitonbinding energy <strong>of</strong> 60 meV at room temperature <strong>and</strong> good electrical conductivity[13]. Recently we reported results on ZnO based quasi-solid state DSSC fabricatedusing the sol-gel derived ZnO powder [14].Solid state cells comprising CuI as a p-type semiconductor, to conduct away theholes, exhibit low conversion efficiencies [15], compared with the liquid version dueto the low conductivity <strong>of</strong> charge carriers in the electrolytes <strong>and</strong> incomplete penetration<strong>of</strong> the solid electrolyte in the voids <strong>of</strong> the porous electrode. Therefore, quasi-solidstate cells have received much attention because they have higher conductivities <strong>and</strong>higher conversion efficiencies compared with solid state cells. There are a number <strong>of</strong>reports on the use <strong>of</strong> organic or inorganic fillers in gel electrolytes in order to increase theefficiency <strong>of</strong> quasi-solid state dye sensitized solar cells. For example, Wang et al. [16]obtained a quasi-solid state electrolyte by solidifying the ionic liquid (1-methyl-3-propylimidazolium iodide) electrolyte with fluorine polymer (poly(vinylidenefluorideco-hexafluoropropyl-ene)),achieving 5.3% overall conversion efficiency <strong>of</strong> the cells.Usui et al. [17] found improved conversion efficiency by dispersing TiO 2 nanoparticlesin a ionic gel electrolyte. Kubo et al. [18] studied a quasi-solid state electrolyte bymixing the gelator with low molecular weight ionic liquid <strong>and</strong> achieved a cell with theconversion efficiency <strong>of</strong> 5%. Wang et al. reported DSSC with an ionic gel electrolytecontaining dispersed silica nanoparticles [19]. The dispersion <strong>of</strong> various agents such asCNT, TiO 2 , carbon black <strong>and</strong> graphite in ionic gel electrolyte enables the use <strong>of</strong>nanoparticles as “gelators” to solidify ionic liquid-based electrolytes <strong>and</strong> also increasethe photovoltaic output [17].In this paper, the authors have studied the effect <strong>of</strong> dispersion <strong>of</strong> hole conductingmaterials such as CuI in gel electrolyte to increase the photovoltaic performance <strong>of</strong>ZnO based quasi-solid state dye sensitized solar cells. The solar cell containing CuI asa layer on dye coated ZnO electrode <strong>and</strong> CuI dispersed in gel electrolyte were formed.The purpose <strong>of</strong> this work is to investigate various technologies which affect thephotovoltaic performance, such as the application <strong>of</strong> CuI in various forms (layer ordispersion) to collect holes. The effect <strong>of</strong> a ZnO compact layer on photovoltaic performancewas also investigated.
Quasi-solid state dye sensitized solar cell with dispersion <strong>of</strong> a hole conducting agent 2832. ExperimentalPreparation <strong>of</strong> the polymer gel electrolyte. The polymer gel electrolyte was synthesizedas follows: 3.0 g <strong>of</strong> poly ethylene glycol (PEG MW 6000 ), 0.03 g <strong>of</strong> tetra propylammonium iodide (TPAI), 0.003g <strong>of</strong> I 2 , 0.15 g <strong>of</strong> ethylene carbonate (EC): propylenecarbonate (PC) 1:1 in 25 cm 3 acetonitrile were used. TPAI <strong>and</strong> I 2 were firstly dissolvedin a binary organic solvent mixture containing EC <strong>and</strong> PC (1:1) Then PEG wasadded <strong>and</strong> the solution was heated at 75–80 °C under vigorous stirring until a viscousgel was obtained, followed by cooling to room temperature.Dispersion <strong>of</strong> CuI in polymer gel electrolyte. A composite polymer gel electrolytewas formed by dispersing 0.3 cm 3 <strong>of</strong> filtered acetonitrile solution <strong>of</strong> CuI (0.16 M) inthe polymer gel electrolyte, prepared as above (0.9 cm 3 ) at 60 °C under continuousstirring. A DSSC using the dispersed CuI polymer gel-electrolyte was fabricated byspreading the composite electrolyte on a dye coated ZnO electrode <strong>and</strong> then applyinga counter electrode.Preparation <strong>of</strong> ZnO electrode <strong>and</strong> treatment with the dye. Porous ZnO films, producedusing <strong>nanocrystalline</strong> ZnO powder, were deposited on indium tin oxide (ITO)coated glass from the synthesized ZnO powder by the doctor blade technique [14].Rose Bengal (RB) dye was used to sensitize the ZnO film. RB is an organic dye in thexanthene class. It absorbs a wide spectrum <strong>of</strong> solar energy <strong>and</strong> energetically matchesthe ZnO <strong>and</strong> iodine/iodide redox couple for DSSC application [20, 21]. Thus ZnOperforms particularly well when sensitized with Rose Bengal [22]. Being an organicdye, there are no concerns about environmental damage, as it does not contain anynoble metal, such as ruthenium. RB dye has been successfully used by several groupsfor DSSCs structures. It has high extinction coefficients <strong>and</strong> its molecular structurecontains anchoring groups that can be adsorbed onto the oxide surface [23]. For theparticular case <strong>of</strong> ZnO–RB (or other anionic xanthenes dyes), it is highly probable thatthe dye is directly bound to the surface <strong>of</strong> a zinc ion. Such bonding will not only makethe adsorptivity high but also facilitate the electron injection process by a strong overlapbetween the electron molecular orbitals <strong>of</strong> the dye <strong>and</strong> those <strong>of</strong> the conductionb<strong>and</strong> <strong>of</strong> the semiconductor [22]. The ZnO film was immersed in a 0.3 mM solution <strong>of</strong>Rose Bengal dye in ethanol for 24 h. To minimize the adsorption <strong>of</strong> impurities frommoisture in the ambient air, the electrodes were dipped in the dye solution while theywere still warm (ca. 80 °C). The dye covered electrodes were then rinsed with ethanol,to remove excess dye on the surface, <strong>and</strong> dried at room temperature.Formation <strong>of</strong> CuI layer. A solution <strong>of</strong> CuI (0.16 M) was prepared by dissolving0.3 g <strong>of</strong> CuI in 10 cm 3 <strong>of</strong> moisture free acetonitrile. The dye coated ZnO electrode wasplaced on a hot plate (80–100 °C) <strong>and</strong> filtered (0.3 cm 3 ) acetonitrile CuI solution wasspread over the dye coated ZnO electrode.
284S. RANI et al.Preparation <strong>of</strong> ZnO compact layer. The ZnO compact layer was prepared by the solgeltechnique. Sols were prepared by dissolving zinc acetate (Zn(CH 3 COO) 2·2H 2 O, 99.0%purity) in methanol to form 0.2 M solution. The mixture was stirred with an ultrasonic<strong>and</strong> magnetic stirrer at 25 °C for 120 min until a clear solution was formed. The solprepared was found to be stable <strong>and</strong> transparent with no precipitate or turbidity.Monoethanolamine (MEA) was further added to the sol to achieve the pH <strong>of</strong> ca. 9.The modified sols were stirred ultrasonically for 60 min at room temperature. The solswere then kept for 48 h for aging in order to convert the sol into gel. The conductiveglass substrate (ITO) was cleaned using acetone, methanol <strong>and</strong> distilled water in anultrasonic bath. The ZnO film was spin coated on the substrate at a spinning speed <strong>of</strong>3000 rpm for 20 s. The desired thickness <strong>of</strong> the ZnO compact layer was varied byrepeatedly applying the appropriate number <strong>of</strong> coatings. The films were dried on a hotplate at 300 °C for 10 min in between each successive layer deposition. Since the boilingpoint <strong>of</strong> MEA <strong>and</strong> temperature <strong>of</strong> thermal decomposition <strong>of</strong> zinc acetate are170 °C <strong>and</strong> 240 °C respectively [24], a preheat treatment temperature <strong>of</strong> 300 °C issufficient for the complete evaporation <strong>of</strong> organics. The deposited ZnO compact layerfilms were annealed in air at 400 °C for 1 h. The thickness <strong>of</strong> the film was measuredby the reflectance method.Solar cell assembly. The assembled solar cells are: cell A: CuI in a layer form(ITO/ZnO/Rose Bengal/CuI layer/gel electrolyte/Pt), <strong>and</strong> cell B: CuI dispersed in a gelelectrolyte (ITO/ZnO/Rose Bengal/dispersed CuI gel electrolyte/Pt). Pt sheet was usedas a counter electrode. The active electrode area was typically 1 cm 2 .Characterization <strong>and</strong> J–V measurement. The crystalline nature <strong>of</strong> ZnO powder<strong>and</strong> ZnO electrode was determined by X-ray diffraction (XRD) using a Philips analyticalModel No.-PW1830 with a CuK α incident beam (λ = 1.54 Å). The presence <strong>of</strong>CuI on the ZnO surface <strong>and</strong> in gel electrolyte was confirmed by X-ray diffraction. Thesurface morphology <strong>of</strong> the ZnO electrode was analyzed by using a scanning electronmicroscope (SEM) (LEO 435 Vp, variable pressure scanning electron microscope,Cambridge UK). The absorbance <strong>of</strong> the ZnO electrode, sensitized with Rose Bengaldye was measured using a UV-VIS-NIR spectrophotometer (SolidSpec-3700, Shimadzu,Japan). The spectrophotometer was equipped with an integrating sphere whichenabled recording the reflectance. The absorbance is obtained by transforming thediffused reflectance data using the Kubelka–Munk function.The solar energy conversion efficiency (J–V) curve was measured by usinga computerized digital Keithley source meter (Model 2400) <strong>and</strong> a tungsten halogenlamp as the light source. The lamp was calibrated close to AM1.5 SUN conditionsfrom National Physical Laboratory (NPL, New Delhi). The IR radiation was attenuatedusing a water filter. A tungsten halogen lamp does not assure AM conditionssince its source <strong>of</strong> light contains insufficiently small amounts <strong>of</strong> UV light. Thereforegenerally xenon arc lamps are used in solar simulators. Although in such a case the
Quasi-solid state dye sensitized solar cell with dispersion <strong>of</strong> a hole conducting agent 285absolute value <strong>of</strong> solar cell parameters would slightly differ from the actual one butthis would not significantly affect the comparative study [25, 26].Based on the J–V curve, the fill factor (FF) is defined as:ImaxVFF =I Vwhere I max <strong>and</strong> V max are the photocurrent density <strong>and</strong> photovoltage for maximum poweroutput (P max ), I sc <strong>and</strong> V oc are the short-circuit current density <strong>and</strong> open circuit voltage,respectively. The overall energy conversion efficiency η is defined as:scinmaxocIscVocFFη =Pwhere P in is the power <strong>of</strong> the incident light.The incident photon-to-current density conversion efficiency (IPCE) gives the ratiobetween the number <strong>of</strong> generated charge carriers contributing to the photocurrentdensity <strong>and</strong> the number <strong>of</strong> incident photons, <strong>and</strong> is given by1240 jIPCE = sc %λPwhere j sc [mA/cm 2 ] is the short circuit current density, P in [mW/cm 2 ] is the light powerdensity <strong>and</strong> λ [nm] is the wavelength. j sc <strong>of</strong> the cells was determined from the J–Vcharacteristics <strong>of</strong> the cells obtained at various wavelengths <strong>of</strong> light using narrowb<strong>and</strong>width (10–12 nm) interference filters (Vin Karola Instruments, USA). The intensity<strong>of</strong> the incident monochromatic radiation was kept constant <strong>and</strong> measured using anoptical power meter (Model 1815-C, Newport USA).3. Results <strong>and</strong> discussion3.1. Structural <strong>characterization</strong>Figure 1 shows a SEM image <strong>of</strong> synthesized ZnO powder. Microstructural homogeneitiesare visible in the morphology <strong>of</strong> ZnO powder. The diameter <strong>of</strong> ZnO particlesis approximately 1 μm. Figure 2 shows the SEM micrograph <strong>of</strong> the ZnO film on ITOsintered at 400 °C. The film is porous with a homogeneous distribution <strong>of</strong> particles,tightly packed with good connectivity between them.Figure 3a shows the XRD pattern <strong>of</strong> synthesized ZnO powder. The powdersshowed their crystalline nature, with peaks corresponding to the (100), (002) <strong>and</strong> (101)planes. The preferred orientation corresponding to the (101) plane is observed for ZnOpowder. The spacing values <strong>and</strong> relative intensities <strong>of</strong> the peak coincide with theJCPDS card No. 36-1451 for ZnO powder.in
286S. RANI et al.Fig. 1. SEM images <strong>of</strong> ZnO powdergrown at pH = 9 in solFig. 2. SEM image <strong>of</strong> the ZnO filmon ITO sintered at 400 °CCrystallite size D was obtained from the full width at half maximum β <strong>of</strong> (101)peak using the Debye–Scherrer formula [27, 25]0.94λD =β cosθwhere λ is the wavelength <strong>of</strong> CuK α radiation <strong>and</strong> θ is the angle obtained from the 2θvalue corresponding to the maximum intensity peak in the XRD pattern. The crystallitesize <strong>of</strong> ZnO powder was found to be ca. 28 nm.Fig. 3. XRD patterns <strong>of</strong> a synthesized ZnO powder (a), ZnO filmon ITO (b), <strong>and</strong> after deposition <strong>of</strong> CuI layer on ZnO film(c)Figure 3b shows the XRD pattern <strong>of</strong> ZnO films on ITO sintered at 400 °C. The filmshows the polycrystalline nature with a preferred orientation corresponding to (101). Fig-
Quasi-solid state dye sensitized solar cell with dispersion <strong>of</strong> a hole conducting agent 287ure 3c shows the XRD pattern <strong>of</strong> ZnO electrode after deposition <strong>of</strong> CuI. It contains thepeaks <strong>of</strong> both ZnO <strong>and</strong> CuI. CuI crystallizes in the zinc blende structure with γ-phasewhile the preferential orientation is the (111) direction.To show the presence <strong>of</strong> CuI in gel electrolyte, films <strong>of</strong> gel electrolyte were depositedon Corning glass (7059) by the spin coating unit. Figure 4 shows the XRDpattern <strong>of</strong> the films before <strong>and</strong> after dispersion <strong>of</strong> CuI in gel electrolyte. It shows thepresence <strong>of</strong> CuI in gel electrolyte with the preferential orientation in (111) direction.Fig. 4. XRD patterns <strong>of</strong> a gel electrolyte (a) <strong>and</strong> dispersed CuI (b) in gel electrolyteFig. 5. UV-VIS absorption spectra <strong>of</strong> the Rose Bengal dye on ZnO surface
288S. RANI et al.The absorbance <strong>of</strong> a ZnO electrode with <strong>and</strong> without dye is shown in Fig. 5. Theabsorption spectrum shows that the dye absorbs visible light in the 400–670 nm rangewith the maximum absorption at 564 nm. A broader absorption spectrum <strong>of</strong> the dye onthe porous layer <strong>of</strong> ZnO is observed as compared with that in ethanol.3.2. Effect <strong>of</strong> dispersion <strong>of</strong> CuI particles in gel electrolyte (J–V measurement)Figure 6 shows the J–V characteristics <strong>of</strong> cells A <strong>and</strong> B. The J–V characteristic <strong>of</strong>a solar cell without CuI is also shown in the figure. The obtained solar cell parametersare given in Table 1. The cell made without the use <strong>of</strong> CuI was characterized byJ sc = 6.21 mA, V oc = 0.58 <strong>and</strong> η = 1.92%. Enhancement in the photovoltaic performanceis observed when CuI was used in the cell structure, <strong>and</strong> the increment in performancedepends on the fabrication technique (layer or dispersed form). The J sc , V oc ,FF, <strong>and</strong> η for the cell A having CuI in a layer form were found to be 7.45 mA·cm –2 ,0.56 V, 0.54, <strong>and</strong> 2.26% respectively while the solar cell B with CuI in a dispersedform by J sc = 8.75 mA·cm –2 ,V oc = 0.59 V, FF = 0.52 <strong>and</strong> η = 2.67%. It may be mentionedthat various cells were fabricated under identical conditions. There was no significantchange in the J–V characteristics, including the value <strong>of</strong> V oc <strong>and</strong> J sc .Fig. 6. J–V characteristics <strong>of</strong> solar cells showing the effect<strong>of</strong> addition <strong>of</strong> CuI on photovoltaic performanceTable 1. Photovoltaic parameters <strong>of</strong> DSSC employing CuI in various formsJ scSolar cell[mA/cm 2 ]ηFF[V][%]Without CuI 6.21 0.58 0.53 1.92CuI in a layer form 7.45 0.56 0.54 2.26CuI in a dispersed form 8.75 0.59 0.52 2.67V oc
Quasi-solid state dye sensitized solar cell with dispersion <strong>of</strong> a hole conducting agent 289Figure 7 shows the influence <strong>of</strong> CuI concentration on the performance <strong>of</strong> DSSC.When 0.3 cm 3 <strong>of</strong> CuI (0.16 M) was added to 0.9 cm 3 <strong>of</strong> gel electrolyte (the ratio <strong>of</strong>CuI to gel electrolyte was 1/3), V oc , J sc <strong>and</strong> η were found to have maximum values. V ocdecreases as the ratio <strong>of</strong> CuI/gel increases. J sc <strong>and</strong> η also showed the same trend.Fig. 7. Influence <strong>of</strong> the CuI concentration in gel electrolyte on the performance <strong>of</strong> DSSCFig. 8. Effect <strong>of</strong> layered <strong>and</strong> dispersed CuI on IPCE <strong>of</strong> a solar cellFigure 8 shows the IPCE <strong>of</strong> the two solar cells A <strong>and</strong> B. Cells A <strong>and</strong> B showa maximum IPCE <strong>of</strong> ca. 14% <strong>and</strong> 20% at 564 nm, respectively. The peak in IPCE spectra
290S. RANI et al.at ca. 564 nm is close to the observed peak in the absorbance <strong>of</strong> the ZnO electrode sensitizedwith RB dye. One <strong>of</strong> the recent papers also reports that the sensitization <strong>of</strong> TiO 2 layerwith RB causes a widening <strong>of</strong> the spectral response covering the visible region, <strong>and</strong> resultsin high value <strong>of</strong> IPCE [28]. In the present case, also this could be the reason for a highvalue <strong>of</strong> IPCE in the range <strong>of</strong> 400–470 <strong>and</strong> 600–650 nm.The IPCE is expressed in terms <strong>of</strong> the light harvesting efficiency <strong>of</strong> the dye(LHE), the quantum yield <strong>of</strong> electron injection (η inj ) <strong>and</strong> the efficiency <strong>of</strong> collectingthe injected electrons (η cc ) at the transparent back contact, as described in [29]:IPCE( λ) = LHE( λ)η ηA high IPCE is the result <strong>of</strong> either efficient light harvesting by the dye, efficientcharge injection into ZnO, or efficient collection <strong>of</strong> injected electrons.In the present case, only the conducting property <strong>of</strong> the electrolyte has been modified.The observed increase in the value <strong>of</strong> IPCE with the dispersion <strong>of</strong> CuI in TPAI+PEG gelelectrolyte indicates an efficient collection <strong>of</strong> holes at the back contact.injcc3.3. Mechanism for achieving higher photocurrent densitySeveral workers have attempted to improve the properties <strong>of</strong> electrolytes by addingnan<strong>of</strong>illers such as TiO 2 particles, MWCNT <strong>and</strong> carbon black [17, 30–32]. It hasbeen shown that the addition <strong>of</strong> nano fillers in the ionic liquid electrolyte reduces theresistance <strong>of</strong> the electrolyte <strong>and</strong> increases the redox couple mobility. Recently, Chenet al. [33] used CuI as an additive in an ionic liquid electrolyte (HMImI). It has beenshown that CuI dissolves in HMImI <strong>and</strong> exists as Cu + <strong>and</strong> I – in the electrolyte. Cu +ions are adsorbed on TiO 2 which results in the increase in I sc <strong>and</strong> the decrease in V oc .Fig. 9. Mechanism <strong>of</strong> hole transport in dispersed CuI gel electrolyte
Quasi-solid state dye sensitized solar cell with dispersion <strong>of</strong> a hole conducting agent 291In the present case (Cell B), the dispersion <strong>of</strong> CuI in the gel electrolyte(TPAI + PEG) resulted in the increase in I sc without affecting V oc unlike the valuesobtained for Cell A which had a layer <strong>of</strong> CuI on the ZnO electrode. It is assumed thatthe dispersed CuI dissociates into Cu + <strong>and</strong> I – ions in the gel electrolyte <strong>and</strong> formsCu + /I – / I 3 – complexes, thereby introducing local ordering <strong>of</strong> the redox couple as shownin Fig. 9. This local ordering facilitates the hole conduction at back electrode whichresults in the higher conversion efficiency <strong>of</strong> the solar cell B. The efficiency <strong>of</strong> DSSCincreased from 1.92 to 2.67% (Table 1) by the introduction <strong>of</strong> hole conducting agentCuI to the gel electrolyte (TPAI + PEG). Figure 9 illustrates the hopping <strong>of</strong> positivecharges (holes) between I – / I 3 – <strong>and</strong> Cu + .3.4. Effect <strong>of</strong> ZnO compact layer on photovoltaic performanceThe photovoltaic properties <strong>of</strong> fabricated solar cell B was further improved by applyingZnO compact layer on a conductive glass substrate. The introduction <strong>of</strong> a thin,ZnO compact layer in a dye sensitized solar cell can prevent a short circuit in the cell<strong>and</strong> therefore may inhibit the back transfer <strong>of</strong> electrons by blocking direct contactbetween the electrolyte <strong>and</strong> the conductive glass substrate [6]. Figure 10 shows thephotocurrent density–voltage characteristics <strong>of</strong> solar cells, <strong>and</strong> the cell parameters aregiven in Table 2.Fig. 10. J–V characteristics <strong>of</strong> a dispersed CuI solar cellwith various numbers <strong>of</strong> compact layer coatingsWhen a ZnO compact layer was applied to cell B, the cell was found to exhibit anincrease in efficiency from 2.67 to 3.38%. On applying 3 coatings <strong>of</strong> compact layer
292S. RANI et al.(thickness ca. 42 nm), the efficiency increased from 2.67 to 3.06%. Efficiency wasfound to increase up to 3.38% with 7 numbers <strong>of</strong> coatings <strong>of</strong> compact layer correspondingto the thickness <strong>of</strong> 106 nm. With 11 coatings <strong>of</strong> compact layer (~140 nm) theefficiency decreases from 3.38% to 3.12%. At the thickness <strong>of</strong> 140 nm, the compactlayer becomes thick enough to hinder the electrons from reaching the anode, which inturn worsens the performance <strong>of</strong> a solar cell [34].No. <strong>of</strong>compact layersTable 2. Photovoltaic parameters <strong>of</strong> DSSC with a ZnO compact layerThickness[nm]J sc[mA/cm 2 ]V oc[V]FFη[%]Without layer 0 8.75 0.59 0.52 2.673 42±1 9.66 0.59 0.54 3.067 106±1 10.83 0.59 0.53 3.3811 140±1 11.34 0.58 0.48 3.12Fig. 11. SEM images <strong>of</strong> compact layers<strong>of</strong> the following thicknesses: a) 3 layers,b) 7 layers, c) 11 layersFigure 11 shows the surface morphology (SEM images) <strong>of</strong> the compact layers 42,106 <strong>and</strong> 140 nm thick. Uniformly tight packed grains <strong>of</strong> ZnO (Fig. 11a, b) convert intoa tetrapod-like textured surface with sharp boundaries.4. ConclusionsDispersion <strong>of</strong> CuI in a gel electrolyte improves the cell parameters. It is envisagedthat the dispersion <strong>of</strong> CuI in the gel electrolyte results in the formation <strong>of</strong> Cu + /I – /I 3–
Quasi-solid state dye sensitized solar cell with dispersion <strong>of</strong> a hole conducting agent 293complexes thereby, introducing local ordering <strong>of</strong> the redox couple. This local orderingfacilitates the hole conduction towards the back electrode, thereby improving the conversionefficiency <strong>of</strong> the DSSC. Use <strong>of</strong> a ZnO compact layer in ZnO/Rose Bengal/dispersedCuI gel electrolyte cell further increases the efficiency <strong>of</strong> the solar cell,due to prevention <strong>of</strong> back transfer <strong>of</strong> electrons by blocking direct contact between theelectrolyte <strong>and</strong> the conductive substrate.AcknowledgementsThis work has been financially supported under the MNRE project No. 31/7/2004–05/PV-R&D,Govt. <strong>of</strong> India. One <strong>of</strong> the authors, S.R., gratefully acknowledges the financial support in the form <strong>of</strong> JRFfrom UGC, New Delhi.References[1] O’REGAN B., GRATZEL M., Nature, 353 (1991), 737.[2] NAZEERUDDIN M.K., KAY A., RODICIO I., HUMPHRY-BAKER R., MULLER E., LISKA P., LACHCHOPOULOS N.,GRATZEL M., J. Am. Chem. Soc., 115 (1993), 6382.[3] O’REGAN B., SCHWARTZ DANIEL T., Chem. Mater., 10 (1998), 1501.[4] TENNAKONE K., KUMARA G.R.R.A., KUMARSINGHE A.R., WIJAYANTHA K.G.U., SIRIMANNE P.M.,Semicond. Sci. Technol., 10 (1995), 1689.[5] MURAKOSHI K., KOGURE R., YANAGIDA S., Chem. Lett., 5 (1997), 471.[6] BACH U., WEISSORTEL F., UEBE J., GRATZEL M., SALBECK D.W., Abstract Book, Bayreuth Polymer<strong>and</strong> Material Research Symposium, 1997, p. 28.[7] MENG Q.B., TAKAHASHI K., ZHANG X.T., SUTANTO I., RAO T.N., SATO O., FUJISHIMA A.,WATANABE H., NAKAMORI T., AND URAGAMI M., Langmuir 19 (2003), 3572.[8] BACH U., LUPO D., COMTE P., MOSER J.E., WEISSORTEL F., SALBECK J., SPREITZER H.& GRATZEL M.,Nature, 395 (1998), 583.[9] NOGUERIA A.F., DURRANT J.R., DEPAOLI M.A., Adv. Mater., 13 (2001), 826.[10] WANG P., ZAKEERUDDIN S.M., GRÄTZEL M., J. Fluorine Chem., 125 (2004), 1241.[11] WANG H., LI H., XUE B., WANG Z., MENG Q., LIQUAN C., J. Am. Chem. Soc., 127 (2005), 6394.[12] XUE B., WANG H., HU Y., LI H., WANG Z., QINGBO M., HUAN X.G., SATO O., CHEN L., FUJISHIMA A.,Photochem. Photobiol. Sci., 3 (2004), 918.[13] NAKAHARA K., TAKASU H., FONS P., YAMADA A., MATSUBARA K., HUNGER R., NIKI S., Appl. Phys.Lett., 79 (2001), 4193.[14] RANI S., SURI P., SHISHODIA P.K., MEHRA R.M., Solar En. Mater. Solar Cells, 92 (2008), 1639.[15] KUMARA G.R.A., KANEKO S., SHIRATSUCHI K., TSUKAHARA J., TENNAKONE K., Chem. Mater., 14(2002), 954.[16] WANG P., ZAKEERUDDIN S.M., EXNAR I., GRATZEL M., Chem. Commun., 24 (2002), 2972.[17] USUI H., MATSUI H., TANABE N., YANAGIDA S., J. Photochem. Photobiol. A: Chem., 164 (2004), 97.[18] KUBO W., KITAMURA T., HANABUSA K., WADA Y., YANAGIDA S., Chem. Commun., 4 (2002), 374.[19] WANG P., ZAKEERUDDIN S.M., EXNAR I., GRATZEL M., J. Am. Chem. Soc., 125 (2003), 1166.[20] PRADHAN B., BATABYAL S.K., PAL A.J., Solar En. Mater. Solar Cells 91 (2007), 769.[21] DUFFY N.W., PETER L.M., RAJAPAKSE R.M.G., WIJAYANTHA K.G.U., J. Phys. Chem. B, 104 (2000),8916.[22] MLCHIO M., SHIGEYUKI M., HIROSHI T., Ind. Eng. Chem. Prod. Res. Dev., 19 (1980), 415.[23] GUILLENA E., CASANUEVA F., ANTA J.A., VEGA-POOT A., OSKAM G., ALCANTARA R., FERNANDEZ-LORENZO C., MARTIN-CALLEJA J., J. Photochem. Photobiol. A: Chem., 200 (2008), 364.
294S. RANI et al.[24] MAJUMDER S.B., AGARWAL D.C., MOHAPATRA Y.N., KULKARNI V.N., Integr. Ferroelectr., 9 (1995),271.[25] GODOVSKY D., CHEN L., PETTERSSON L., INGANAS O., ANDERSSON M.R., HUMMELEN J.C., Adv. Mater.Opt. Electron., 10 (2000), 47.[26] BEREZNEV S., KOEPPE R., KONOVALOV I., KOIS J., GUNES S., OPIK A., MELLIKOV E., SARICIFTCI N.S.,Thin Solid Films, 515 (2007), 5759.[27] WEST A.R., Solid State Chemistry <strong>and</strong> Its Application, Wiley, New York, 1984, p. 174.[28] ROY M.S., BALRAJU P., MANISH K., SHARMA G.D., Solar En. Mater. Solar Cells, 92, (2008), 909.[29] SODERGREN S., HAGFELDT A., OLSSON J., LINDQUIST S.E., J. Phys. Chem., 95 (1994), 5522.[30] BING L., PING C., CHANG-SHENG D., Chin. J. Chem. Phys., 20, (2007), 816.[31] KANG M.-S., AHN K.-S., LEE J.-W., J. Power Sources, 180 (2008), 896.[32] STERGIOPOULOS T., ARABATZIS I.M., KATSAROS G., FALARAS A.P., Nano Lett., 2 (2002), 1259.[33] CHEN L.-H., XUE B.-F., LIU X.-Z., LI K.-X., LUO Y.-H., MENG Q.-B., WANG R.-L., CHEN L.-Q., Chin.Phys. Lett., 2 (2007), 555.[34] BIN P., JUNGMANN G., JAGER C., HAARER D., SCHMIDT H.W., THELAKKAT M., Coord. Chem. Rev.,248 (2004), 1479.Received 18 December 2008Revised 10 July 2009
Materials Science-Pol<strong>and</strong>, Vol. 28, No. 1, 2010Influence <strong>of</strong> CaO reactivity on the formation<strong>of</strong> low-base calcium silicate hydratesK. BALTAKYS * , E. PRICHOCKIENEDepartment <strong>of</strong> Silicate Technology, Kaunas University <strong>of</strong> Technology,Radvilenu 19, LT – 50270 Kaunas, LithuaniaThe influence <strong>of</strong> CaO reactivity on the formation <strong>of</strong> calcium silicate hydrates in the CaO–SiO 2 ⋅nH 2 O–H 2 O system has been determined when the CaO/SiO 2 molar ratio was equal to 0.83 <strong>and</strong> 1.0. In a pureCaO–SiO 2 ⋅nH 2 O–H 2 O system, with CaO/SiO 2 = 0.83, C–S–H (I) is rather stable, <strong>and</strong> at 175 °C, evenafter 72 h, only partially recrystallizes into 1.13 nm tobermorite. Meanwhile, in the mixtures with lessreactive CaO (96%), the stoichiometric composition (CaO/SiO 2 ) <strong>of</strong> products <strong>of</strong> the synthesis varies from0.66 to 0.83. When the CaO/SiO 2 molar ratio in the initial mixture is equal to 1.0, the CaO reactivity hasa significant effect on the composition <strong>of</strong> products forming in hydrothermal conditions. The products <strong>of</strong>the syntheses were characterized by X–ray diffraction analysis, simultaneous thermal analysis <strong>and</strong> Fouriertransform infrared spectroscopy.Keywords: calcium silicate hydrate; 1.13 nm tobermorite; gyrolite; CaO reactivity1. IntroductionThe most common calcium silicate hydrates found in nature, produced in laboratories<strong>and</strong> formed in silicate products during hydrothermal treatment – or in autoclavedor hot-pressed materials – are C–S–H (I), 1.13 nm tobermorite, xonotlite, gyrolite. Theformation <strong>of</strong> these calcium silicate hydrates depends on the duration <strong>and</strong> temperature<strong>of</strong> hydrothermal synthesis, stoichiometric composition <strong>of</strong> the initial mixture(CaO/SiO 2 (C/S) molar ratios), granulometric composition (grading) <strong>and</strong> strain <strong>of</strong> theraw materials, the additives used, mixing intensity <strong>and</strong> other factors [1–5].Low-base (C/S = 0.6–1.5) <strong>and</strong> high-base (C/S = 1.5–2.0) calcium silicate hydratesbelong to the set <strong>of</strong> key binding compounds [6]. They can be used as fillers for theproduction <strong>of</strong> rubber, plastics, paper, paint; for cleaning water contaminated withheavy <strong>and</strong> radioactive metal ions, for non-asbestos heat insulations, for adsorbents <strong>of</strong>_________* Corresponding author, e-mail: kestutis.baltakys@ktu.lt
296K. BALTAKYS, E. PRICHOCKIENEorganic <strong>and</strong> inorganic effluents, cation exchangers [7]. Therefore, calcium silicatehydrates formed under hydrothermal conditions are the subject <strong>of</strong> numerous scientificstudies.The 1.13 nm tobermorite is the most prevalent among calcium silicate hydratesfound in nature <strong>and</strong> obtained during autoclave treatment. This compound was firstdescribed by Heddle [8]. Tobermorite is known to have four different strains: 0.9 nmtobermorite – riversidite, 1.13 nm tobermorite, 1.4 nm tobermorite – plombierite, <strong>and</strong>clinotobermorite [9–11]. The 1.13 nm tobermorite Ca 5 (Si 6 O 18 H 2 )·4H 2 O can be reproducedin the laboratory in hydrothermal conditions when C/S = 0.8–1.0 [2]. The typicalinterplatelet distances d <strong>of</strong> 1.13 nm tobermorite are 1.13 <strong>and</strong> 0.297 nm.From the wollastonite group <strong>of</strong> calcium silicate hydrates, xonotlites Ca 6 (Si 6 O 17 )(OH) 2are <strong>of</strong> great practical importance <strong>and</strong> interest [3, 4]. This compound can be synthesizedat 190–400 °C when the molar ratio <strong>of</strong> the mixture is C/S = 1.0. Xonotlite ischaracterized by an interplatelet distance d <strong>of</strong> 0.7 nm [12]. Nocuń–Wczelik reportsthat synthesis <strong>of</strong> xonotlite highly depends on the SiO 2 strain <strong>and</strong> the temperature <strong>and</strong>duration <strong>of</strong> synthesis [13] <strong>and</strong> that xonotlite may be formed directly, without the formation<strong>of</strong> an intermediate mineral – 1.13 nm tobermorite.Gyrolite (2CaO⋅3SiO 2 ⋅2.5H 2 O), calcium silicate hydrate, rarely occurs as a naturalmineral together with with zeolites as low-temperature hydrothermal replacementproduct <strong>of</strong> basic igneous rock. Synthetic gyrolite was hydrothermally synthesized byFlint et al. [14]. They indicated that after 6–42 days <strong>of</strong> hydrothermal synthesis at150–350 °C, the only product – gyrolite forms when the C/S ratio changes from 0.5 to0.66. Mackay <strong>and</strong> Taylor [15] synthesized this compound by isothermal curing at150 °C within 76 days <strong>of</strong>. Later on, other scientists continued studies on the synthesis<strong>of</strong> gyrolite [16–18]. It was declared that gyrolite is stable at 120–200 °C in hydrothermalconditions under a saturated steam pressure. Truscottite (Ca 14 Si 24 O 58 (OH) 8·2H 2 O)forms at the temperature higher than 200 °C, although metastable gyrolite may beobtained at temperatures up to 270 °C. It is assumed that gyrolite forms only at a temperatureshigher than 120 °C. The parameters <strong>of</strong> hydrothermal synthesis <strong>of</strong> gyrolite inunstirred suspensions, when initial mixtures were composed from CaO <strong>and</strong> SiO 2 ⋅nH 2 Oor quartz, were determined elsewhere [19]. The results <strong>of</strong> the research showed that theoptimal temperature <strong>of</strong> the synthesis <strong>of</strong> gyrolite is rather high (approximately 200 °C)<strong>and</strong> that the duration is long (ca. 32 h) when amorphous SiO 2 ⋅nH 2 O is used as the SiO 2component.Much scientific research is focused on the influence <strong>of</strong> calcium strains SiO 2 on theformation <strong>of</strong> calcium silicate hydrate [2, 5, 20]. Not much data has been published onthe effects <strong>of</strong> reactivity <strong>of</strong> another raw material, CaO, on the synthesis <strong>of</strong> calcium silicatehydrates.The aim <strong>of</strong> this work was to analyse the influence <strong>of</strong> reactivity <strong>of</strong> CaO on the formation<strong>of</strong> 1.13 nm tobermorite <strong>and</strong> xonotlite, as well as to analyse <strong>and</strong> explain thesequence <strong>of</strong> formations <strong>of</strong> intermediary compounds.
Influence <strong>of</strong> CaO reactivity on the formation <strong>of</strong> low-base calcium silicate hydrates 2972. ExperimentalThe following reagents were used as starting materials: fine-grained SiO 2·nH 2 O(Reachim, Russia, ignition losses 21.28%, specific surface area S a = 1155 m²/kg byBlaine), CaO (free CaO = 99.96%, S a = 548 m 2 /kg, time <strong>of</strong> lime slaking τ = 135 s,temperature <strong>of</strong> lime slaking 96 °C, Reachim, Russia) <strong>and</strong> CaO (free CaO = 96%,S a = 320 m 2 /kg, time <strong>of</strong> lime slaking τ = 430 s, temperature <strong>of</strong> lime slaking 94 °C,Reachim, Russia) were additionally burned at 1000 °C for 0.5 h.The syntheses <strong>of</strong> calcium silicate hydrates were carried out in unstirred suspensionsin stainless steel vessels. Calcium silicate hydrates were synthesized within8, 16, 24 <strong>and</strong> 72 h at 175 °C using stoichiometric compositions (CaO/SiO 2 molar ratioswere equal to 0.83 <strong>and</strong> 1.0, the water/solid ratio <strong>of</strong> the suspension was equal to 10.0) <strong>of</strong> theinitial CaO <strong>and</strong> SiO 2 ⋅nH 2 O mixture. The products <strong>of</strong> the syntheses were filtered, rinsedwith ethyl alcohol to prevent carbonization <strong>of</strong> materials, dried at 50 ± 5 °C <strong>and</strong> filteredthrough a sieve with a mesh width <strong>of</strong> 50 μm.The X-ray powder diffraction data was collected with a DRON–6 X-ray diffractometerwith the Bragg–Brentano geometry using Ni-filtered CuK α radiation <strong>and</strong>a graphite monochromator, operating at the voltage <strong>of</strong> 30 kV <strong>and</strong> delivering an emissioncurrent <strong>of</strong> 20 mA. The step scan covered the angular range 2–60° (2θ ) in steps <strong>of</strong>2θ = 0.02°.Simultaneous thermal analysis (STA: differential scanning calorimetry – DSC <strong>and</strong>thermogravimetry – TG) was carried out on a Netzsch instrument STA 409 PC applyingthe heating rate <strong>of</strong> 15 °C/min. The temperature ranged from 30 °C up to 1000 °Cunder an air atmosphere. Ceramic sample h<strong>and</strong>lers <strong>and</strong> crucibles <strong>of</strong> Pt–Rh were used.FTIR spectra were obtained with the aid <strong>of</strong> a Perkin Elmer FTIR Spectrum X system.Specimens were prepared by mixing 1 mg <strong>of</strong> the sample with 200 mg <strong>of</strong> KBr.The spectral analysis was performed in the range <strong>of</strong> 4000–400 cm –1 with the spectralresolution <strong>of</strong> 1 cm –1 .3. Results <strong>and</strong> discussionAfter 8 h <strong>of</strong> isothermal curing at 175 °C in the Ca O–SiO 2 ⋅nH 2 O–H 2 O system,traces <strong>of</strong> 1.13 nm tobermorite (Fig. 1, curve 1, d spacing 1.1472, 0.5449, 0.3063,0.2967, 0.2804, 0.1834, 0.1670 nm, the area <strong>of</strong> the endothermic effect at 220 °C isequal to 5.72 μV·s/mg, according to the tangent method) together with C–S–H (I)were formed (Fig. 1, curve 1, d spacing 0.3048, 0.1834 nm, the area <strong>of</strong> the exothermiceffect at 833 °C is equal to 41.24 μV·s/mg according to the tangent method). By prolongingthe duration <strong>of</strong> synthesis, an increasing amount <strong>of</strong> 1.13 nm tobermorite isformed in the product, due to an increase in the intensity <strong>of</strong> its characteristic diffractionpeak, whose interplanar distance is d ~1.13 nm, <strong>and</strong> the area <strong>of</strong> the endothermiceffect at 219 °C is 8.31 μV·s/mg (Fig. 1, curve 2). It should be underlined that even
298K. BALTAKYS, E. PRICHOCKIENEafter an isothermal exposure for 72 h, the identified endothermic effect (i.e., the areameasuring 9.34 μV·s/mg) at 848 °C indicates that a small amount <strong>of</strong> C–S–H (I), which hadinsufficient time for recrystallisation into 1.13 nm tobermorite, remains in the products(Fig. 1b, curve 3). These data was confirmed by differential scanning calorimetry: at225 °C the area <strong>of</strong> the endothermic effect increased to 18.97 μV·s/mg (Fig. 1b, curve 3).Fig. 1. X-ray diffraction patterns (a) <strong>and</strong> DSC curves (b) <strong>of</strong> the products <strong>of</strong> synthesis;the initial C/S molar ratio is equal to 0.83. Duration [h] <strong>of</strong> hydrothermal syntheses at 175 °C:1 – 8; 2 – 16; 3 – 72; C – C–S–H (I), T – 1.13 nm tobermoriteThus, in a pure CaO–SiO 2 ⋅nH 2 O–H 2 O system, C–S–H (I) which formed at the beginning<strong>of</strong> the synthesis, is sufficiently stable <strong>and</strong> at 175 °C, even after 72 h, it onlypartially recrystallizes into 1.13 nm tobermorite.In mixtures with less reactive CaO (96%), changes occur not only in the sequence<strong>of</strong> the formed compounds, but also in their stability limits. After 8 h <strong>of</strong> hydrothermalsynthesis, a semicrystalline calcium silicate hydrate C–S–H (I) <strong>and</strong> traces <strong>of</strong> 1.13 nmtobermorite were formed (Fig. 2, curve 1). It should be noted that 1.13 nm tobermoritebecomes a dominant compound after 24 h <strong>of</strong> hydrothermal treatment (Fig. 2, curve 2).After extending the duration <strong>of</strong> isothermal curing to 72 h, unexpected results wereobtained: the intensity <strong>of</strong> peaks characteristic <strong>of</strong> the 1.13 nm tobermorite in X-raypatterns decreased (Fig. 2, curve 3). Together with this compound, a low-base calciumsilicate hydrate – gyrolite – begins to form (according to stoichiometry <strong>of</strong> this compound,the C/S molar ratio is equal to 0.66). Thermal conversions characteristic <strong>of</strong> thiscompound were identified in the DSC curve: endothermic (at 148 °C) <strong>and</strong> exothermic
Influence <strong>of</strong> CaO reactivity on the formation <strong>of</strong> low-base calcium silicate hydrates 299(at 793 °C) (Fig. 3a). Presumably, one <strong>of</strong> the reasons for this is that the less activeCaO is less soluble in water, moreover, that the water solubility <strong>of</strong> CaO, upon raisingthe temperature from 20 °C to 175 °C, decreases from 1.58 g/dm 3 to 0.17 g/dm 3 [21].The larger amount <strong>of</strong> impurities <strong>and</strong> a smaller surface area <strong>of</strong> CaO change the time <strong>of</strong>lime slaking <strong>and</strong> thus influence the formation <strong>of</strong> calcium silicate hydrates. This meansthat the molar ratio <strong>of</strong> the reacting mixture is lower than in the raw materials, i.e. intermediatebetween 0.66 <strong>and</strong> 0.83, <strong>and</strong> there occur favourable conditions for the simultaneouscrystallisation <strong>of</strong> the two compounds – gyrolite <strong>and</strong> 1.13 nm tobermorite.Fig. 2. X-ray diffraction patterns <strong>of</strong> the products<strong>of</strong> the synthesis; the C/S molar ratio is equal to0.83 (less reactive CaO). Duration [h]<strong>of</strong> hydrothermal syntheses at 175 °C: 1 – 8;2 – 24; 3 – 72; C – C–S–H (I),T – 1.13 nm tobermorite, G – gyroliteFig. 3. STA curve (TGA – 1, DSC – 2) (a) <strong>and</strong> FTIR spectrum (b) <strong>of</strong> the products <strong>of</strong> the 72 hhydrothermal synthesis at 175 °C; the C/S molar ratio is equal to 0.83 (less reactive CaO)All these results were confirmed by FTIR spectroscopy data, which can be used todistinguish gyrolite from other calcium silicate hydrates [22]. A sharp peak near
300K. BALTAKYS, E. PRICHOCKIENE3635 cm –1 is visible only in the gyrolite spectrum (Fig. 3b). This clear b<strong>and</strong> (3638 cm –1 )proves that clearly distinguished OH positions exist in the structure <strong>of</strong> gyrolite, whichare connected only with Ca atoms <strong>and</strong> are not influenced by hydrogen bridge links.A wide b<strong>and</strong> near 3447 cm –1 means the opposite – that molecular water forms hydrogenbridge links in the interlayers. The b<strong>and</strong>s in the 1640 cm –1 frequency range areassigned to δ (H 2 O) vibrations <strong>and</strong> confirm this presumption. Thus, the sequence <strong>of</strong>the formation <strong>of</strong> calcium silicate hydrates is highly dependent on the reactivity <strong>of</strong> theinitial materials used for the preparation <strong>of</strong> the mixture – in this case, on the purity <strong>of</strong>CaO. It was found that in the mixtures with C/S = 0.83, the stoichiometric factor <strong>of</strong>products <strong>of</strong> the synthesis varies from 0.66 to 0.83 <strong>and</strong> depends on the CaO reactivity.In order to evaluate the influence <strong>of</strong> higher CaO reactivity on the mixtures <strong>of</strong>higher basicity, i. e. with C/S = 1.0, similar hydrothermal syntheses were carried out.It was found that the reactivity <strong>of</strong> CaO has by far a great effect on the formation <strong>of</strong>monobasic calcium silicate hydrate. During the first 8 h <strong>of</strong> the synthesis, regardless <strong>of</strong>the CaO reactivity, a semicrystalline calcium silicate hydrate C–S–H (I) is formed(Fig. 4, curve 1, Fig. 6, curve 1).Fig. 4. X-ray diffraction patterns <strong>of</strong> the products<strong>of</strong> the synthesis; the C/S molar ratio is equal to 1.0.Duration [h] <strong>of</strong> hydrothermal syntheses at 175 °C:1 – 8; 2 – 24; 3 – 72; C – C–S–H (I),T – 1.13 nm tobermorite, K – xonotliteHowever, after 24 h <strong>of</strong> isothermal curing by using less reactive CaO, X-ray diffractionanalysis curves showed only traces <strong>of</strong> 1.13 nm tobermorite (Fig. 6, curve 2),but if more reactive CaO is added to the initial mixture, 1.13 tobermorite having anoticeably higher degree <strong>of</strong> crystallization is formed (Fig. 4, curve 2). When the duration<strong>of</strong> the synthesis is prolonged even more, the effect <strong>of</strong> CaO reactivity on the composition<strong>of</strong> the product becomes even more obvious. When CaO <strong>of</strong> the lower reactivityis used in primary mixtures, 1.13 nm tobermorite <strong>and</strong> traces <strong>of</strong> gyrolite are formed
Influence <strong>of</strong> CaO reactivity on the formation <strong>of</strong> low-base calcium silicate hydrates 301(Fig. 6, curve 3). The thermal conversion characteristic <strong>of</strong> gyrolite was identified inthe DSC curve as an endothermic peak at 144 °C <strong>and</strong> an exothermic peak at 793 °C(Fig. 7a, curve 2). FTIR spectroscopy data supports the DSC results (Fig. 7b). Itshould be noted that typical peaks characteristic <strong>of</strong> xonotlite have not been identifiedin the X-ray diffraction analysis curves, even though the molar ratio C/S = 1.0 <strong>of</strong> theinitial mixture corresponded specifically to the stoichiometric composition <strong>of</strong> thiscompound. In the mixture with more reactive CaO, both compounds – 1.13 nm tobermorite<strong>and</strong> xonotlite – are already formed after 72 h <strong>of</strong> synthesis (Fig. 4, curve 3).Thermal conversions characteristic <strong>of</strong> 1.13 nm tobermorite were identified in the DSCcurve as an endothermic peak at 220 °C (Fig. 5a, curve 1).Fig. 5. STA curve (1 – DSC, 2 – TGA) (a) <strong>and</strong> FTIR spectrum (b) <strong>of</strong> the products<strong>of</strong> the 72 h hydrothermal synthesis at 175 °C when the C/S molar ratio is equal to 1.0Fig. 6. X-ray diffraction patterns <strong>of</strong> the products<strong>of</strong> the synthesis; the C/S molar ratio is equalto 1.0 (less reactive CaO). Duration [h]<strong>of</strong> hydrothermal syntheses at 175 °C: 1 – 8;2 – 24; 3 – 72; C – C–S–H (I),T – 1.13 nm tobermorite, G – gyrolite
302K. BALTAKYS, E. PRICHOCKIENEFig. 7. STA curve (1 – DSC, 2 – TGA) (a) <strong>and</strong> FTIR spectrum (b) <strong>of</strong> the products<strong>of</strong> the 72 h hydrothermal synthesis at 175 °C when C/S molar ratio is equal to 1.0 (less reactive CaO)Data that can be used to distinguish xonotlite from other calcium silicate hydrates[22] were confirmed by FTIR spectroscopy results: sharp peaks near 3614 cm –1<strong>and</strong> near 1202 cm –1 are visible only in the xonotlite spectrum (Fig. 5b). Thus, when inthe initial mixture the C/S molar ratio is equal to 1.0, CaO reactivity has a significanteffect on the composition <strong>of</strong> products forming in hydrothermal conditions.Thus the formation <strong>of</strong> calcium silicate hydrates proceeds during the reactionCaO + SiO 2·nH 2 O + H 2 O under the outer surface <strong>of</strong> the particles <strong>of</strong> reagents. Accordingto kinetic theory with influence <strong>of</strong> diffusion, when the crystallization productsreact at the outer surface <strong>of</strong> particles, the apparent order <strong>of</strong> reaction n is close to zero:dx ⎛dx⎞= = ⎜ ⎟dτ⎝ dl ⎠CaOwappkappFRwhere w app is the rate <strong>of</strong> reaction, k app – a constant <strong>of</strong> apparent reaction, F r – reactivesurface <strong>of</strong> CaO, dx/dl – gradient <strong>of</strong> reagent concentration, n – apparent order <strong>of</strong> reaction.⎛Particle <strong>of</strong> CaO⎞⎜⎟⎜2 2O ⎟ ⎯⎯⎯⎯⎯⎯⎯⎯→ C–S–H composition depends⎜ Fr ⎟ ⎜ ⎟app.τ , t, p,SiO ⋅nHOn⎛the former calcium silicate hydrate⎞⎜⎟⎜ ⎟ ⎝on the conditions <strong>of</strong> synthesis ⎠⎝⎠↓n → 0⎛⎜⎝wdxdl⎞⎟ → 1;⎠=f( F )rIt is obvious that the outer surface area <strong>of</strong> particles increases when the particles aremilled. In this case, the apparent order <strong>of</strong> reaction increases as well. Therefore, the
Influence <strong>of</strong> CaO reactivity on the formation <strong>of</strong> low-base calcium silicate hydrates 303factor limiting the formation <strong>of</strong> calcium silicate hydrate is the outer surface area F r <strong>of</strong>calcium oxide particles.It should be underlined that extra admixtures in the calcium oxide compositionmay have extra influence on the formation <strong>of</strong> products.4. ConclusionsThe reactivity <strong>of</strong> CaO changes the composition <strong>of</strong> intermediate <strong>and</strong> final products<strong>of</strong> the synthesis. In a pure Ca O–SiO 2 ⋅nH 2 O–H 2 O system with CaO/SiO 2 = 0.83, theC–S–H (I) which forms at the beginning <strong>of</strong> synthesis is rather stable, <strong>and</strong> at 175 °C,even after 72 h, it only partially recrystallizes into 1.13 nm tobermorite. In the mixtureswith less reactive CaO (96%), however, the stoichiometric composition <strong>of</strong> products<strong>of</strong> the syntheses varies from 0.66 to 0.83 because, together with 1.13 nm tobermorite,a low-base calcium silicate hydrate – gyrolite – begins forming.When the CaO/SiO 2 molar ratio in the initial mixture is equal to 1.0, CaO reactivityhas a significant influence on the composition <strong>of</strong> products forming in hydrothermalconditions. In the CaO–SiO 2·nH 2 O–H 2 O system, after 72 h <strong>of</strong> synthesis at 175 °C inthe mixture with more reactive CaO both compounds – 1.13 nm tobermorite <strong>and</strong>xonotlite – are formed. However, when the lower reactivity CaO is used in primarymixtures, only 1.13 nm tobermorite <strong>and</strong> traces <strong>of</strong> gyrolite are formed.AcknowledgementWe gratefully thank A. Baltusnikas – a Head <strong>of</strong> X-ray diffraction analysis laboratory <strong>of</strong> KTU for carryingout X-ray analysis experiments <strong>and</strong> for his constructive comments on the paper.References[1] BALANDIS A., JASIUKEVICIUS V., MARTYNAITIS M., STRAZDAS K., The Fundamentals <strong>of</strong> SilicateTechnology, The Institute <strong>of</strong> Scientific <strong>and</strong> Encyclopaedic Press, Vilnius, 1995 (in Lithuanian).[2] TAYLOR H.F.W., Cement Chemistry, Academic Press, San Diego, 1997.[3] MARTUSEVICIUS M., KAMINSKAS R., MITUZAS J., The Chemical Technology <strong>of</strong> Binding Materials,Technology, Kaunas, 2002 (in Lithuanian).[4] MARTUSEVICIUS M., Nonhydraulic Hydrated Binders, Technology, Kaunas, 1993 (in Lithuanian).[5] TAYLOR H.F.W., Hydrothermal reactions in the system <strong>and</strong> autoclaved treatment <strong>of</strong> the products <strong>of</strong>cement <strong>and</strong> cement silicates, Press <strong>of</strong> Constructional Literature, 4th National Congress <strong>of</strong> CementChemistry, Washington, 15 (1973), pp. 385–406 (in Russian).[6] TAYLOR H.F.W., ROY D.M., Structure <strong>and</strong> composition <strong>of</strong> hydrates, Proc. 7th Int. Symposium on theChemistry <strong>of</strong> Cement, Paris, 1 (1980), pp. 112/1–112/3.[7] MOSTAFA N.Y., KISHAR E.A., ABO-EL-ENEIN S.A., J. Alloys Comp., 1–2 (2009), 538.[8] HEDDLE M.F., Mineral. Mag., 30 (1954), 293.[9] MERLINO S., BONACCORSI E., ARMBRUSTER T., Am. Mineral., 84 (1999), 1613.[10] MERLINO S., BONACCORSI E., ARMBRUSTER T., Eur. J. Mineral., 12 (2000), 411.[11] MERLINO S., BONACCORSI E., ARMBRUSTER T., Eur. J. Mineral., 13 (2001), 577.
304K. BALTAKYS, E. PRICHOCKIENE[12] BUT YU.М., RASHKOVICH L.N., The Hardening <strong>of</strong> Binding Materials at Higher Temperatures, ConstructionalPress, Мoscow, 1965 (in Russian).[13] NOCUŃ-WCZELIK W., Cem. Concr. Res., 29 (1999), 1759.[14] FLINT E.P., MCMURDIE H.F., WELLS L.S., J. Res. Natl. Bur. St<strong>and</strong>., 21 (1938), 617.[15] MACKAY A.L., TAYLOR H.F.W., Mineral Mag., 30 (1953), 80.[16] STEVULA L., HARMAN M., HORVATH I., PUTYERA K., Ceramics – Silikaty, 34 (1990), 315.[17] JAUBERTHIE R., TEMIMI M., LAQUERBE M., Cem. Concr. Res., 26 (1996), 1335.[18] SHAW S., HENDERSON C.M.B., CLARK S.M., Am. Mineral., 87 (2002), 533.[19] SIAUCIUNAS R., BALTAKYS K., Cem. Concr. Res., 34 (2004), 2029.[20] BALTAKYS K., SIAUCIUNAS R., BALTUSNIKAS A., Chemical Technology, Kaunas, 1 (2004), 45.[21] GUNDLACH H., Dampfgehartete Baust<strong>of</strong>fe, Bauverlag GmbH, Wiesbaden, 1973 (in German).[22] SIAUCIUNAS R., BALTAKYS K., BALTUSNIKAS A., The Instrumental Analysis <strong>of</strong> Silicate Materials,Vitae Litera, Kaunas, 2007 (in Lithuanian).Received 19 December 2008Revised 9 June 2009
Materials Science-Pol<strong>and</strong>, Vol. 28, No. 1, 2010Influence <strong>of</strong> frequency variations on the dielectricproperties <strong>of</strong> Sm doped Ba 4 La 9.33 Ti 18 O 54dielectric ceramics at various temperaturesS. BINDRA NARANG * , S. BAHELDepartment <strong>of</strong> Electronics Technology B-18, Guru Nanak Dev University, Amritsar-143005, Punjab, IndiaThe dependence <strong>of</strong> frequency variations on the dielectric properties <strong>of</strong> Sm substituted barium lanthanumtitanate was investigated. Dielectric ceramics based on the Ba 4 (La 1–y Sm y ) 9.33 Ti 18 O 54 system, wherey = 0.0, 0.3, 0.5, 0.7, were synthesized <strong>and</strong> subsequently characterized for their structural <strong>and</strong> dielectricproperties. The temperature dependences <strong>of</strong> the relative permittivity <strong>and</strong> the dielectric losses were measuredin the frequency range from 10 kHz to 10 MHz, for temperatures ranging from 25 °C to 150 °C. Themeasurement system consisted <strong>of</strong> an impedance analyzer <strong>and</strong> a temperature chamber. Substituting Sm forLa was an effective way to stabilize the variations in relative permittivity, within the temperature range <strong>of</strong>interest. No dielectric anomaly was observed in this temperature range. The temperature coefficient <strong>of</strong> theresonant frequency improved from 273.9 ppm/°C at y = 0.0 to 53.8 ppm/°C at y = 0.7. The relative permittivity<strong>of</strong> 90.33 <strong>and</strong> a dielectric loss <strong>of</strong> 0.09 were obtained at 25 °C for y = 0.5 at 10 MHz; the temperaturecoefficient <strong>of</strong> the resonant frequency was 106.8 ppm/°C. The materials under investigation have highrelative permittivities, remaining constant under temperature variation, which therefore makes themsuitable for applications in communication devices.Keywords: ceramics; relative permittivity; dielectric loss; temperature coefficient <strong>of</strong> resonant frequency1. IntroductionThe revolution in microwave telecommunication <strong>and</strong> satellite broadcasting systemshas created the need for good quality dielectric ceramics. The important propertiesrequired for these materials are a high electric permittivity (ε r > 70) for miniaturization,low loss or a high quality factor (Q > 2000) for selectivity, <strong>and</strong> a lowtemperature coefficient <strong>of</strong> the resonant frequency (τ f ) for stability. The unique dielectricproperties, namely high relative permittivity (70–100), low dielectric losses <strong>and</strong>low temperature coefficient <strong>of</strong> resonant frequency, <strong>of</strong> Ba 6–3x R 8+2x Ti 18 O 54 (R is a rareearth atom such as La, Nd, Sm or Gd) solid solutions [1–3] make them very important_________* Corresponding author, e-mail: sukhleen2@yahoo.com
306S. BINDRA NARANG, S. BAHELfor applications in communication devices. However, the requirements <strong>of</strong> moderncommunication technologies dem<strong>and</strong> even greater improvements in the performance<strong>of</strong> the materials. Ohsato et al. [4–7] have extensively studied the structural <strong>and</strong> dielectricproperties <strong>of</strong> Ba 6–3x R 8+2x Ti 18 O 54 <strong>and</strong> found that the ordering <strong>of</strong> Ba 2+ <strong>and</strong> R 3+ ions atx = 2/3 leads to the lowest internal strain, which in turn results in a maximum qualityfactor. In this system, La based solid solutions [5, 7, 8] have the highest relative permittivity,but dielectric loss <strong>and</strong> the temperature coefficient <strong>of</strong> the resonant frequency(~300 ppm/°C) are also high. Some reports have been published on the improvement<strong>of</strong> dielectric properties <strong>of</strong> Ba 6–3x R 8+2x Ti 18 O 54 solid solutions by A <strong>and</strong>/or B site substitution[9, 10]. In our previous paper [11], we have reported the required reduction indielectric loss tangent by Sm substitution in Ba 4 La 9.33 Ti 18 O 54 dielectric ceramic whilekeeping the high relative permittivity. Now, the main objective is the suppression <strong>of</strong>the temperature coefficient <strong>of</strong> the resonant frequency (τ f ) while retaining low dielectricloss <strong>and</strong> a high relative permittivity (ε r ). The goal <strong>of</strong> this study is to investigate theeffect <strong>of</strong> various Sm substitutions on Ba 6 La 9.33 Ti 18 O 54 solid solutions over a wide temperature<strong>and</strong> frequency range.2. ExperimentalCeramic samples <strong>of</strong> Ba 4 (La (1–y) Sm y ) 9.33 Ti 18 O 54 , where y = 0.0, 0.3, 0.5 <strong>and</strong> 0.7,were prepared using the high temperature solid state reaction technique. The stoichiometricmixtures <strong>of</strong> high purity powders <strong>of</strong> BaCO 3 (99.5%), La 2 O 3 (99.9%), Sm 2 O 3(99.9%) <strong>and</strong> TiO 2 (99.5%) were weighed <strong>and</strong> ground for 12 h in methanol. The mixtureswere then dried <strong>and</strong> calcined in air at 1100 °C for 2 h. The calcined powderswere thoroughly re-ground, mixed with 3 wt. % <strong>of</strong> polyvinyl alcohol (PVA) asa binder <strong>and</strong> pressed into pellets <strong>of</strong> various shapes under the load <strong>of</strong> 98 kN. Thesepellets were then sintered at 1300 °C for 2h in air.X-ray diffraction data were collected on a Philips, PWQ 1729 powder X-ray diffractometerusing CuK α radiation in the 2θ range from 20° to 80°. The microstructures<strong>of</strong> freshly fractured sintered samples were examined using a JEOL, JSM 6100 scanningelectron microscope <strong>and</strong> an Oxford, INCA energy dispersive X-ray analyzer. Thebulk densities <strong>of</strong> the sintered samples were measured by the Archimedes method.Flat surfaces <strong>of</strong> the pellets were polished with high purity conductive silver paste.The dielectric properties, namely the relative permittivity <strong>and</strong> the dielectric loss infunction <strong>of</strong> temperature in the range from 25 °C to 150 °C <strong>and</strong> frequency in the rangefrom 10 kHz to 10 MHz, were calculated from the data recorded from an Agilent, HP4192A impedance analyzer <strong>and</strong> a programmable temperature chamber interfaced witha PC. The temperature coefficients <strong>of</strong> the resonant frequency (τ f ) in the temperaturerange from 25 °C to 90 °C were estimated using the dependence [12]:τfτ ε⎛ ⎞=− ⎜ + α⎟⎝ 2 ⎠
Properties <strong>of</strong> Sm doped Ba 4 La 9.33 Ti 18 O 54 dielectric ceramics at various temperatures 307where τ ε is the temperature coefficient <strong>of</strong> the relative permittivity <strong>and</strong> α is the thermalexpansion coefficient, which is about 10 ppm/°C [9] in the ceramics under study here.3. Results <strong>and</strong> discussionThe XRD patterns <strong>and</strong> SEM micrographs <strong>of</strong> Ba 4 (La 1–y Sm y ) 9.33 Ti 18 O 54 ceramicshaving different Sm content were reported earlier [11]. Detailed structural analysis,along with lattice parameters, has already been reported.Fig. 1. Results <strong>of</strong> EDX analysis <strong>of</strong> Ba 4 (La (1–y) Sm y ) 9.33 Ti 18 O 54 for various Sm contents
308S. BINDRA NARANG, S. BAHELIt has been found that all the ceramic samples possess single phase <strong>of</strong> tungstenbronze-type compounds <strong>and</strong> have orthorhombic symmetry. Microstructural examinationshowed the presence <strong>of</strong> closely packed uniform hexagonal grains with low porosity.Figure 1 shows the results <strong>of</strong> the EDX analysis <strong>of</strong> three samples, with y = 0.0, 0.5<strong>and</strong> y = 0.7. The observed <strong>and</strong> the calculated atomic concentration <strong>of</strong> various elementsin Ba 4 (La (1–y) Sm y ) 9.33 Ti 18 O 54 solid solution are given in Table 1. This indicates thepresence <strong>of</strong> expected elements (Ba, La, Sm, Ti <strong>and</strong> O) in the required proportions.Table 1. Observed <strong>and</strong> calculated atomic concentrations [at. %]<strong>of</strong> various elements in Ba 4 (La (1–y) Sm y ) 9.33 Ti 18 O 54Elementy = 0.0 y = 0.5 y = 0.7Calculated Observed Calculated Observed Calculated ObservedBa 4.69 4.52 4.69 4.85 4.69 4.59La 10.93 10.29 5.47 5.07 3.28 2.98Sm – – 5.47 5.27 7.65 7.05Ti 21.09 20.13 21.09 20.22 21.09 19.42O 63.29 65.06 63.28 64.59 63.28 65.96The bulk density for all the samples in function <strong>of</strong> Sm content is shown in Fig. 2.These ceramics have a high bulk density (>5.0 g/cm3), with a maximum <strong>of</strong> 5.46 gm/ccfor y = 0.7, confirming the observed porosity diminution in the microstructures [11](grain closeness).Fig. 2. Bulk densities <strong>of</strong> Ba 4 (La (1–y) Sm y ) 9.33 Ti 18 O 54 for various Sm contentsThe dependences <strong>of</strong> relative permittivity <strong>and</strong> dielectric losses on frequency in therange <strong>of</strong> 10–10 MHz for various Sm contents at room temperature are shown inFigs. 3 <strong>and</strong> 4, respectively. The relative permittivity decreases from 106.44 for y = 0.0to 90.33 for y = 0.5 <strong>and</strong> finally to 89.27 for y = 0.7 at 10 MHz. These results are inaccordance with the variation in relative permittivity <strong>and</strong> loss at high frequencies(0.3 GHz–3.0 GHz) as previously reported [11]. The relative permittivity ε r decreases
Properties <strong>of</strong> Sm doped Ba 4 La 9.33 Ti 18 O 54 dielectric ceramics at various temperatures 309with the increase in Sm content, due to the substitution <strong>of</strong> Sm ions for La ions. Therelative permittivity depends on the unit cell volume, tilting <strong>of</strong> octahedral strings alongthe c axis <strong>and</strong> polarizabilities <strong>of</strong> ions [5]. It is evident from previously reported resultsthat the unit cell volume decreases with increase in Sm contents thereby decreasing ε r .The tilting angle between the c axis <strong>and</strong> the central axis <strong>of</strong> the octahedra is smaller forlarger sized ions [12]. The smaller ionic radii <strong>of</strong> Sm 3+ ions (1.24 Å) than those <strong>of</strong> La 3+ions (1.36 Å) [13] cause an increase in the tilt <strong>of</strong> octahedra in solid solutions withhigher Sm content, resulting in lower ε r . Moreover, the third factor, i.e. the ionic polarizability<strong>of</strong> Sm 3+ ions (4.74 Å 3 ), is lower than the ionic polarizability <strong>of</strong> La 3+ ions(6.07Å 3 ) as reported by Shannon [14] also contributes towards decrease in ε r .Fig. 3. Dependence <strong>of</strong> relative permittivity on frequency for various Sm contents at 25 °CFig. 4. Dependence <strong>of</strong> dielectric loss on frequency for various Sm contents at 25 °CFigure 5 shows the dependence <strong>of</strong> the temperature coefficients <strong>of</strong> relative permittivity<strong>and</strong> resonant frequency on Sm contents. The estimated value <strong>of</strong> the temperaturecoefficient <strong>of</strong> relative permittivity decreases from –567.68 ppm/°C at y = 0.0, through–233.46 ppm/°C at y = 0.5 to –127.6 ppm/°C at y = 0.7. The corresponding values <strong>of</strong> τ falso decrease from 273.9 ppm/°C at y = 0.0 to 106.8 ppm/°C at y = 0.5 <strong>and</strong> finally to53.8 ppm/°C at y = 0.7.
310S. BINDRA NARANG, S. BAHELFig. 5. Dependence <strong>of</strong> the temperature coefficient<strong>of</strong> resonant frequency <strong>and</strong> relative permittivity for various Sm contentsFig. 6. Dependence <strong>of</strong> relative permittivity on frequency at various temperaturesfor the following Sm contents y: a) 0, b) 0.3, c) 0.5, d) 0.7With regard to the dependences <strong>of</strong> dielectric properties on ionic radii, the observedbehaviour can be explained by the existence <strong>of</strong> the same intrinsic mechanism revealed
Properties <strong>of</strong> Sm doped Ba 4 La 9.33 Ti 18 O 54 dielectric ceramics at various temperatures 311to govern the dielectric properties <strong>of</strong> undoped Ba 6–3x R 8+2x Ti 18 O 54 solid solutions [12].The extension <strong>of</strong> this study to Sm doped Ba 6–3x La 9.33 Ti 18 O 54 solid solutions suggeststhat the changes in the tilting <strong>of</strong> the octahedral due to substitution <strong>of</strong> small sized Smions for large sized La ions induce changes in the crystal field <strong>and</strong> consequently causea decrease in τ f .Fig. 7. Dependence <strong>of</strong> dielectric losses on frequency at various temperaturesfor the following Sm contents y: a) 0, b) 0.3, c) 0.5, d) 0.7The dependences <strong>of</strong> the relative permittivity <strong>and</strong> dielectric losses with frequency forvarious temperatures <strong>and</strong> Sm contents <strong>of</strong> are shown in Figs. 6 <strong>and</strong> 7. No dielectric anomalywas observed for these materials in the temperature range 25–150 °C. It is assumedthat there is no structural transition over the temperature range <strong>of</strong> interest which is in accordancewith the results <strong>of</strong> other authors [15, 16]. The relative permittivity varies from106.44 to 100.35 for y = 0.0 <strong>and</strong> from 89.27 to 87.62 for y = 0.7 as temperature increasesfrom 25 °C to 150 °C at 10 MHz. However, it is also evident that the increase in the contents<strong>of</strong> Sm reduces the variations <strong>of</strong> relative permittivity with temperature, which is requiredfor the thermal stability <strong>of</strong> ceramics having a high relative permittivity.4. ConclusionsDielectric ceramics <strong>of</strong> the general formula Ba 4 (La (1–y) Sm y ) 9.33 Ti 18 O 54 , wherey = 0.0, 0.3, 0.5 <strong>and</strong> 0.7 were synthesized by high temperature solid state reaction
312S. BINDRA NARANG, S. BAHELtechnique <strong>and</strong> characterized for structural <strong>and</strong> dielectric properties. A detailed study relatedto the variation in the dielectric properties, namely the relative permittivity <strong>and</strong> thedielectric loss, as temperature increases from 25 °C to 150 °C, was carried out using animpedance analyzer in the frequency range 10 kHz–10 MHz. The relative permittivitydecreased in the entire frequency range for all the three samples as the temperature increased.The variation in relative permittivity <strong>of</strong> Ba 4 (La (1–y) Sm y ) 9.33 Ti 18 O 54 solid solutionswith temperature reduces as the concentration <strong>of</strong> Sm increases. The temperature coefficient<strong>of</strong> the resonant frequency was estimated to improve from 273.9 ppm/°C to53.8 ppm/°C as the concentration <strong>of</strong> Sm increased.AcknowledgementsThe authors express their gratitude to Dr. A. Banerjee, UGC-DAE CSR, Indore, for providing the facilityto study the dielectric properties in function <strong>of</strong> temperature <strong>and</strong> frequency.References[1] KOLAR D., STADLER Z., GABERSCEK S., SUVOROV D., Ber. dt. Keram. Ges., 55 (1978), 346.[2] KOLAR D., GABERSCEK S., VOLAVSEK B., J. Solid State Chem., 38 (1981), 158.[3] KAUR D., NARANG S.B., SINGH K., J. Ceram. Proc. Res., 7 (2006), 31.[4] OHSATO H., OHHASHI T., NISHIGAKI S., OKUDA T., SUMIYA K., SUZUKI S., Jpn. J. Appl. Phys., 32(1993), 4323.[5] OHSATO H., J. Eur. Ceram. Soc., 21 (2001), 2703.[6] OHSATO H., IMAEDA M., Mater. Chem. Phys., 79 (2003), 208.[7] OHSATO H., J. Ceram. Soc. Japan, 113 (2005), 703.[8] NARANG S.B., KAUR D., BAHEL S., Mater. Lett., 60 (2006), 3179.[9] LI Y., CHEN X.M., J. Eur. Ceram. Soc. 22 (2002), 715.[10] CHENG C.C., HSIEH T.E., NAN LIN I., Mat. Chem. Phys 79 (2003), 119.[11] BAHEL S., BINDRA NARANG S., Mater. Sci.-Pol<strong>and</strong>, 26 (2008), 555.[12] VALANT M., SUVOROV D., RAWN C.J., Jpn. J. Appl. Phys., 38 (1999), 2820.[13] SHANONON R.D., Acta Cryst., 32A (1976), 751.[14] SHANNON R.D., J. Appl. Phys., 73 (1993), 348.[15] BELOUS A.G., OVCHAR O., VALANT M., SUVOROV D., J. Appl. Phys., 92 (2002), 3917.[16] BELOUS A.G., OVCHAR O.V., MISCHUK D.O., Cond. Mater. Phys., 6 (2003), 251.Received 16 January 2009Revised 7 June 2009
Materials Science-Pol<strong>and</strong>, Vol. 28, No. 1, 2010Quantum computations for temperature variation<strong>of</strong> refractive indices <strong>of</strong> covalent semiconductorsB.K. SHARMA 1* , G. MISRA 2 , S.C. GOYAL 31 Department <strong>of</strong> Physics, Agra College, Dr. B.R. Ambedkar University, Agra, India2 Department <strong>of</strong> Physics, Eritrea Institute <strong>of</strong> Technology, Asmara University, Asmara, Eritrea3 Department <strong>of</strong> Applied Sciences, Faculty <strong>of</strong> Engineering <strong>and</strong> Technology,R.B.S. College, Agra, U.P. Technical University, Lucknow, IndiaThe well-established theory <strong>of</strong> ion-dependent quantum dielectrics is used to compute the temperaturederivatives <strong>of</strong> optical refractive indices <strong>of</strong> ΙΙ–VІ <strong>and</strong> ΙΙΙ–V covalent semiconductors. The ion characteristics<strong>of</strong> these materials vary a little from one another, due to variation in the plasma frequency <strong>of</strong> crystals<strong>and</strong> the d core effect. The computed values <strong>of</strong> the temperature derivatives <strong>of</strong> optical refractive indices arefinally compared with the experimentally obtained values, <strong>and</strong> with the values predicted by some otherworkers. The correspondence between our theoretical predictions <strong>and</strong> the available, experimental data isshown, to be the most consistent to-date for a wide variety <strong>of</strong> crystals <strong>of</strong> interest.Keywords: optical refractive index; temperature dependence; d core effect1. IntroductionThe model [1] for ion dependent quantum dielectrics, for ionic crystals, is nowwell established. This model produced multiple applications such as high resolutionphotographic lenses, optical instrumentation, <strong>and</strong> high power laser beams which arerequired to operate under a wide variety <strong>of</strong> temperature conditions. In this communication,we highlight a theory to study the effect <strong>of</strong> heat on the refractive indices <strong>of</strong>binary covalent semiconductors. The families under study are II–VI <strong>and</strong> III–V binarycovalent semiconductors. The optical refractive properties <strong>of</strong> these dielectric compoundsvary a little from one another, due to variation in plasma frequency <strong>and</strong> thed core effect. These properties depend upon the electric permittivities <strong>and</strong> optical refractiveindex <strong>of</strong> the crystal. Thus the study <strong>of</strong> the temperature dependence <strong>of</strong> refrac-_________* Corresponding author, e-mail: gaurang_misra@rediffmail.com
314B.K. SHARMA et al.tive indices for binary families is an integral part <strong>of</strong> the present study. The computedresults have been thoroughly analyzed <strong>and</strong> a number <strong>of</strong> technological applications <strong>of</strong>the derivative have been presented.It was noticed that in ionic solids, namely families <strong>of</strong> A N B 8–N compounds, with Nincreasing from 1 to 4, as we move from type I–VII to type IV–IV families a gradualtransition from high ionicity to high covalency occurs [2]. The gradual change is fromrock salt to wurtzite <strong>and</strong> zinc blende <strong>and</strong> finally to diamond structures.The ionic compounds <strong>of</strong> I–VII binary crystals are purely ionic with a high percentage<strong>of</strong> heteropolar parts <strong>and</strong> a negligible homopolar part, showing pure cationdependent dielectric behaviour. However, solids belonging to the II–VI families havecomparable homopolar <strong>and</strong> heteropolar parts. Thus, these solids may be considered ascovalent as well ionic <strong>and</strong> hence show anion as well as cation dependent dielectricbehaviour. The solids belonging to the III–V families are covalent in nature [1, 3].Experimentally, it is also proved that the optical refractive properties <strong>of</strong> crystals varywith temperature. Therefore, after thermal treating <strong>of</strong> the solids, their optical refractiveindices n <strong>and</strong> high frequency electric permittivity ε ∞ change, thereby varying theiraverage energy gaps (E g ). Thus, we use our theory <strong>of</strong> ion-dependent dielectrics tocompute the temperature derivatives <strong>of</strong> the refractive indices.2. TheoryTo study the temperature dependences <strong>of</strong> the optical refractive indices in the crystalsunder consideration, we will use the well established ion-dependent correlation[4, 5] between the optical refractive index <strong>and</strong> the average energy gap2kn 1 CE g= + (1)where the parameter k is a family characteristic <strong>and</strong> the constant C is an ion characteristicfor a given family. The parameter k is different for different binary families likeII–VI <strong>and</strong> III–V etc., <strong>and</strong> is readily available in our base paper [3], whereas C is als<strong>of</strong>ound for different ions in different families.Differentiation <strong>of</strong> Eq. (1) with respect to temperature leads to2( n 1)1⎛ dn ⎞ − ⎡ k ⎛dEg⎞ 1 ⎛dC⎞⎤⎜ ⎟= 2 ⎢ ⎜ ⎟+⎜ ⎟⎥n⎝dT ⎠ 2n ⎢⎣Eg⎝ dT ⎠ C⎝dT⎠⎥⎦All terms in this equation are represented with unit per Kelvin <strong>and</strong> while derivingthis correlation, the effect <strong>of</strong> core d electrons is neglected. In fact, the presence <strong>of</strong> cored electrons affects the number <strong>of</strong> free electrons per atom, which subsequently changesthe plasma frequency by a small amount [6]. It is also noticed that the ion characteristicC varies a little from one ionic solid to another with the same cation, due to variationin the plasma frequency <strong>of</strong> the crystal [3].(2)
Quantum computations <strong>of</strong> refractive indices <strong>of</strong> covalent semiconductors 3153. ProcedureIn order to compute the temperature derivatives <strong>of</strong> the optical refractive indices <strong>of</strong>various covalent semiconductors from the above model, we may rewrite Eq. (1) as:2ln ( 1) lnglnn − = k E + C(3)Then, using the measured values <strong>of</strong> average energy gaps E g [1] <strong>and</strong> the refractiveindices n [6], a dependence <strong>of</strong> ln(n 2 – 1) on lnE g is plotted <strong>and</strong> the parameter k, characteristic<strong>of</strong> the family, <strong>and</strong> the values <strong>of</strong> the parameter C, characteristic <strong>of</strong> the ion, areevaluated. Using these values, we have calculated the value <strong>of</strong> (1/C)(dC/dT), whichshould remain constant for the same anion solids in the covalent families, <strong>and</strong> for thesame cation solids in ionic families [7]. These data are listed in Table 1, along with themeasured values <strong>of</strong> dE/dT for all representative compounds [8].Table 1. Input parameters used for computing the temperature variation <strong>of</strong> refractive indexFamilyII–VIIII–VSolidE g[1]n[6]k(1/C)(dC/dT)×10 –5 /K–(dE g /dT)×10 –5 /K [8]ZnS 8.1 2.28 –1.000 2.012 5.00ZnSe 7.6 2.43 –1.000 2.012 5.40ZnTe 6.1 2.70 –1.000 2.012 6.30GaP 5.3 2.92 –0.652 4.389 3.25InP 5.1 3.09 –0.652 4.389 4.00GaAs 5.0 3.30 –0.652 7.693 3.76InAs 4.7 3.51 –0.652 7.693 3.55GaSb 4.2 3.79 –0.652 11.726 3.80InSb 4.1 3.96 –0.652 11.726 3.46Table 2. The computed values <strong>of</strong> (1/n)(dn/dT), for various semiconductorsalong with the available experimental values <strong>and</strong> those computed through other theoriesFamily Solid Present modelII–VIIII–VExperimentalvalue [10]Other theories[8] [9]ZnS 3.3 3.3 4.3 –ZnSe 3.7 3.6 5.1 –ZnTe 5.3 5.2 8.3 –GaP 3.7 3.7 4.2 2.2InP 4.2 4.0 6.2 3.6GaAs 5.8 5.6 5.8 5.4InAs 5.7 5.7 6.3 6.7GaSb 8.2 8.2 7.7 9.3InSb 12.7 12.9 8.0 15.0
316B.K. SHARMA et al.These reference values are used to compute the values <strong>of</strong> (1/n)(dn/dT) for the crystals,using Eq. (2). The computed values <strong>of</strong> 1/n)(dn/dT), namely the temperature derivatives<strong>of</strong> refractive indices, for various semiconductors in respective groups aregiven in Table 2, along with the available experimental values <strong>and</strong> those computedfrom other theories [8, 9], for comparison.4. ConclusionThe computed values <strong>of</strong> (1/n)(dn/dT) being the temperature derivatives <strong>of</strong> refractiveindices, obtained through the present theoretical model are in better agreementwith the available experimental values [10] than those predicted by Tsay et al. [8] <strong>and</strong>Yu et al. [9]. The predicted values <strong>of</strong> the temperature dependence <strong>of</strong> the refractiveindex may have a wide range <strong>of</strong> applications. Therefore, through this study we canobtain more data on behaviour <strong>of</strong> such crystals under application <strong>of</strong> heat. This propertymay be relevant to the field <strong>of</strong> photoelasticity, photoconductivity <strong>and</strong> solar celltechnology [11]. Other applications <strong>of</strong> interest in this field are semiconductor electronics<strong>and</strong> high-power laser technology etc.AcknowledgementsThe authors are thankful to Dr. M.K. Rawat, Principal, Agra College, Agra, for providing the necessaryfacilities. We acknowledge Dr. K.P. Tiwari, Department <strong>of</strong> Physics, Agra College, Agra, for usefulcomments <strong>and</strong> suggestions. One <strong>of</strong> the authors, S.C.G., is thankful to the UGC for providing the financialassistance.References[1] SARKAR K.K., GOYAL S.C., Phys. Rev., 21 (1980), 279.[2] PHILLIPS J.C., Bonds <strong>and</strong> B<strong>and</strong>s in Semiconductors, Academic Press, New York, 1973.[3] SARKAR K.K., GOYAL S.C., J. Chem. Phys., 68 (1978), 3231.[4] SINGH R.P., SINGH P., SARKAR K.K., Infrared Phys., 26 (1986), 1.[5] SINGH R.P., SINGH P., SARKAR K.K., Infrared Phys., 26 (1986), 167.[6] VAN VECHTEN J.A., Phys. Rev., 182 (1969), 921.[7] FERNANDEZ A.O., SARKAR K.K., GOYAL S.C., Solid State Commun., 54 (1991), 633.[8] TSAY Y.F., BENDOW B., MITRA S.S., Proc. Roy. Soc., A, 308 (1969), 473.[9] YU P.Y., CORDONA M., Phys. Rev. B, 2 (1970), 3193.[10] RUBLOFF G.W., Phys. Rev. B, 5 (1972), 662.[11] RAVINDRA N.M., GANPATI P., CHOI J., Infrared. Phys. Tech., 50 (2007), 21.Received 27 January 2009Revised 8 May 2009
Materials Science-Pol<strong>and</strong>, Vol. 28, No. 1, 2010Electrical conduction in Ba(Bi 0.5 Nb 0.5 )O 3 ceramicsImpedance spectroscopy analysisK. PRASAD 1* , S. BHAGAT 1 , K. AMARNATH 1 , S.N. CHOUDHARY 1 , K.L. YADAV 21Materials Research Laboratory, University Department <strong>of</strong> Physics,T.M. Bhagalpur University, Bhagalpur 812 007, India2 Department <strong>of</strong> Physics, Indian Institute <strong>of</strong> Technology, Roorkee 247 667, IndiaA new lead free perovskite ceramics Ba(Bi 0.5 Nb 0.5 )O 3 was fabricated by a conventional ceramictechnique at 1185 °C <strong>and</strong> subsequent sintering at 1200 °C in air atmosphere. The XRD analysis <strong>of</strong>Ba(Bi 0.5 Nb 0.5 )O 3 powder indicated the formation <strong>of</strong> a single-phase monoclinic structure. The ac conductivitydata were found to obey the power law <strong>and</strong> showed a negative temperature coefficient for the resistancebehaviour. The ac conductivity values were used to evaluate the density <strong>of</strong> states at the Fermi level,minimum hopping length <strong>and</strong> activation energy <strong>of</strong> the compound. The correlated barrier hopping modelwas found to successfully explain the mechanism <strong>of</strong> charge transport in Ba(Bi 0.5 Nb 0.5 )O 3 .Keywords: Ba(Bi 0.5 Nb 0.5 )O 3 ; ceramics; ac conductivity; conduction mechanism; hopping model1. IntroductionA(B′B′′)O 3 materials <strong>of</strong> the perovskite type exhibiting high dielectric permittivityε′ are <strong>of</strong> current interest due to their practical applications in various electronic/microelectronicdevices. Most <strong>of</strong> the materials used for these applications are,in general, lead bearing compounds, e.g. PbTiO 3 , PbZr 1–x Ti x O 3 , PbMg 1/3 Nb 2/3 O 3 ,PbFe 1/2 Nb 1/2 O 3 , etc. With the aim <strong>of</strong> identifying alternatives to the lead-based materials,the electrical properties <strong>of</strong> Ba(Fe 1/2 Nb 1/2 )O 3 [1–9], Ba(Al 1/2 Nb 1/2 )O 3 [10],Sr(Fe 1/2 Nb 1/2 )O 3 [5], Ba(Fe 1/2 Ta 1/2 )O 3 [11], etc. have been investigated. One such ceramicsin this series is perovskite Ba(Bi 0.5 Nb 0.5 )O 3 having the tolerance factort = 0.8769 estimated using the relation:_________tr + r ⎛r + r⎜2 ⎝ 2⎞r ⎟⎠Ba O Bi Nb= +0−1* Corresponding author, e-mail: k.prasad65@gmail.com
318K. PRASAD et al.where r Ba , r Bi , r Nb <strong>and</strong> r O are the ionic radii <strong>of</strong> the constituent ions. The material ismechanically tough <strong>and</strong> lead-free.The complex impedance spectroscopy technique is widely recognized as a nondestructivebut powerful technique for the study <strong>of</strong> the electrical properties <strong>of</strong> solids[12]. Thus, the dynamics <strong>of</strong> ionic movement <strong>and</strong> the contributions <strong>of</strong> various microstructureelements such as grain, grain boundary <strong>and</strong> interfacial polarization, tototal electric response in polycrystalline solids can be identified by this technique. Italso enables us to evaluate the nature <strong>of</strong> dielectric relaxation <strong>and</strong> the relaxation frequency<strong>of</strong> the material.Despite an extensive literature survey, there has been no study <strong>of</strong> Ba(Bi 0.5 Nb 0.5 )O 3(BBN) so far, to the best <strong>of</strong> the author’s knowledge. In the present work, structural,microstructural <strong>and</strong> ac conductivity studies <strong>of</strong> BBN have been described. An attempthas also been made to explain the conduction mechanism in the system.2. ExperimentalBa(Bi 0.5 Nb 0.5 )O 3 (BBN) was obtained from AR grade (99.9%+ pure) chemicals(BaCO 3 , Bi 2 O 3 <strong>and</strong> Nb 2 O 5 ) by solid state synthesis using the following chemical reactionat 1185 °C for 4 h:BaCO + 1Bi O + 1Nb O ⎯⎯→ Ba(Bi Nb )O + CO4 4Δ3 2 3 2 5 0.5 0.5 3 2under controlled heating <strong>and</strong> cooling cycles. A circular disc shaped pellet, 9.99 mm indiameter <strong>and</strong> 2.192 mm thick was made by applying a uniaxial stress <strong>of</strong> ca. 650 MPa. Thepellet was subsequently heated up to 1200 °C under air for 3h. The complete reaction <strong>and</strong>the formation <strong>of</strong> the desired compound were verified by X-ray diffraction analysis. Theweights <strong>of</strong> the samples were monitored before <strong>and</strong> after heat treatments. The maximumdifference was about 1.08 mg for 10 g <strong>of</strong> the sample. Therefore, the compositions <strong>of</strong> thesamples were considered to be the same as the initial ones. The XRD spectra were takenon calcined powder <strong>of</strong> BBN with a X-ray diffractometer (XPERT-PRO) at room temperature,using CuK α radiation (λ = 1.5405 Å), over a wide range <strong>of</strong> Bragg angles (20° ≤ 2θ≤ 80°) with a scanning speed <strong>of</strong> 2°·min –1 . The microstructure <strong>of</strong> the sintered BBN samplewas taken on the fractured surface using a computer controlled scanning electron microscope(SEM Hitachi S-3400N, Japan). The identification <strong>of</strong> secondary phases present inthe sample was carried out using an energy dispersive X-ray analyzer (Thermo NoranNSS200). Electrical impedance Z, phase angle θ, loss tangent tanδ <strong>and</strong> capacitance C weremeasured in function <strong>of</strong> frequency (0.1 kHz–1 MHz) at various temperatures (30–500 °C)using a computer controlled LCR Hi-Tester (HIOKI 3532-50), Japan, attached with amicroprocessor controlled dry temperature controller (DPI-1100), Sartech Intl., India on asymmetrical cell <strong>of</strong> type Ag|ceramics|Ag, where Ag is a conductive paint coated on eitherside <strong>of</strong> the pellet.
Electrical conduction in Ba(Bi 0.5 Nb 0.5 )O 3 ceramics 3193. Results <strong>and</strong> discussionFigure 1 shows the XRD pr<strong>of</strong>ile <strong>of</strong> calcined BBN powder. A st<strong>and</strong>ard computerprogram (POWD) was utilized for the XRD pr<strong>of</strong>ile analysis. Good agreement betweenthe observed <strong>and</strong> calculated inter-planar spacing <strong>and</strong> no traces <strong>of</strong> any extra peaks dueto constituent oxides were found, thereby suggesting the formation <strong>of</strong> a single phasecompound having a monoclinic structure. The lattice parameters were estimated to bea = 4.320(6) Å, b = 4.238(8) Å, c = 3.001(6) Å <strong>and</strong> β = 90.659° with the estimatederror <strong>of</strong> ±10 –4 Å. The unit cell volume was estimated to be 54.97 Å 3 .Fig. 1. X-ray diffraction pattern <strong>of</strong> calcined Ba(Bi 0.5 Nb 0.5 )O 3 powderat room temperature. Inset shows the Williamson–Hall plotThe XRD pattern <strong>of</strong> BBN is found to be similar to that <strong>of</strong> Ba(Fe 0.5 Nb 0.5 )O 3 [3, 6, 7, 9]with little shifts in peak positions. This may be due to the difference in the ionic radii<strong>of</strong> Fe 3+ <strong>and</strong> Bi 3+ ions. The criterion adopted for evaluating the robustness <strong>and</strong> accuracy<strong>of</strong> <strong>of</strong> the indexing <strong>and</strong> the structure <strong>of</strong> compound was the sum <strong>of</strong> differences in observed<strong>and</strong> calculated d values (i.e., ∑∆d =∑(d obs – d calc )), which were minimized usinga least squares refinement technique. The apparent particle size <strong>and</strong> lattice strain <strong>of</strong>BBN were estimated by analyzing the broadening <strong>of</strong> the X-ray diffraction peak, usingthe Williamson–Hall approach [13]:KλΔξβ cosθ = + 2 sinθ(1)D ξwhere D is the apparent particle size, β is the width <strong>of</strong> the diffraction peak at half intensity(FWHM), Δξ/ξ is the lattice strain <strong>and</strong> K is the Scherrer constant (K = 0.89).The term Kλ/D represents the Scherrer particle size distribution. The Gaussian modelwas applied to estimate the width <strong>of</strong> the diffraction peak at half intensity.
320K. PRASAD et al.2A ⎛ ⎛θ−θc⎞ ⎞I = I0 + exp −2π ⎜ ⎜ ⎟η ⎟η ⎝ ⎝ ⎠ ⎠2(2)where A <strong>and</strong> θ c are the area <strong>and</strong> centre <strong>of</strong> the curve, respectively. The inset <strong>of</strong> Fig. 1illustrates the Williamson–Hall plot for BBN. A linear least squares fitting <strong>of</strong> theβcosθ–sinθ data provided the values <strong>of</strong> the apparent particle size <strong>and</strong> the lattice strain:these were found to be approximately 89 nm <strong>and</strong> 0.0035, respectively.Fig. 2. EDAX spectrum <strong>and</strong> SEM micrograph <strong>of</strong> fractured surface <strong>of</strong> Ba(Bi 0.5 Nb 0.5 )O 3 ceramicsTo confirm the absence <strong>of</strong> a second phase, EDAX was carried out. Figure 2 showsthe EDAX pattern for the constituent ions <strong>of</strong> BBN. All peaks in the pattern matchperfectly with the elements present in Ba(Bi 0.5 Nb 0.5 )O 3 . This clearly indicated the purity<strong>and</strong> formation <strong>of</strong> BBN. The grain shapes (almost cuboid) are clearly visible in theSEM micrograph (inset <strong>of</strong> Fig. 2) <strong>of</strong> the sintered BBN sample, indicating the existence<strong>of</strong> a polycrystalline microstructure. Grains <strong>of</strong> unequal sizes (5–10 μm) appear to bedistributed throughout the sample.The ac electrical conductivity, which in most <strong>of</strong> the materials is due to localizedstates, is given by:σ = σ(0) + σ( ω)(3)acwhere σ (0) <strong>and</strong> σ (ω) are the frequency independent <strong>and</strong> frequency dependent parts <strong>of</strong>the conductivity, respectively. Also, σ (ω) was found to satisfy the following equationin the frequency sensitive region: σ (ω) = Aω s with 0 ≤ s ≤ 1, ω being the angularfrequency <strong>of</strong> the applied ac field <strong>and</strong> A = πN 2 e 2 /6k B T(2α) is a constant, e is the electroncharge, T – temperature, α – polarizability <strong>of</strong> a pair <strong>of</strong> sites, <strong>and</strong> N – the number <strong>of</strong>sites per unit volume among which hopping takes place. Such variation is associated
Electrical conduction in Ba(Bi 0.5 Nb 0.5 )O 3 ceramics 321with displacement <strong>of</strong> carriers which move within the sample by discrete hops <strong>of</strong> thelength R between r<strong>and</strong>omly distributed localized sites. The term Aω s can <strong>of</strong>ten be describedbased on two distinct mechanisms for carrier conduction: (i) quantum mechanicaltunnelling (QMT) through the barrier separating the localized sites; <strong>and</strong> (ii)correlated barrier hopping (CBH) over the same barrier. In these models, the exponents is found to have two different trends being a function <strong>of</strong> temperature <strong>and</strong> frequency.If the ac conductivity is related to QMT, s is predicted to be temperature independentbut is expected to show a decreasing trend with ω4s = 1+ (4)lg ωτ( )where τ 0 is the characteristic relaxation time. The ac conductivity is expected to be [14]4π 2e2 1 4σac = ωkT B ( N( Ef))α − R ω(5)24where α –1 is the spatial decay parameter for the localized wave function, <strong>and</strong> R ω is thetunnelling length at the frequency ω. If ac conductivity is related to CBH [15],0( ( ))π 2e2 −5⎛ f ln0 ⎞σac = ωkT BN Efα ⎜ ⎟3⎝ ω ⎠where N(E f ) is the density <strong>of</strong> states at the Fermi level, f 0 the photon frequency <strong>and</strong> α isthe localized wave function. The exponent s <strong>and</strong> minimum hopping length R min can beexpressed as [16, 17]6kTBs = 1− (7)WRminm204(6)2e= (8)πεεWwhere W m is the binding energy, which is defined as the energy required to remove anelectron completely from one site to the another site. Figure 3 shows the log–log dependence<strong>of</strong> the electrical conductivity on frequency at various temperatures. Thepattern <strong>of</strong> the conductivity spectrum shows dispersion throughout the chosen frequencyrange. The frequency dependence <strong>of</strong> ac conductivity satisfies [18]:mS1 S2σac = A1ω + A2ω(9)where A 1 <strong>and</strong> A 2 are the temperature dependent constants, <strong>and</strong> s 1 <strong>and</strong> s 2 are temperatureas well as frequency dependent parameters. The values <strong>of</strong> s 1 <strong>and</strong> s 2 can be obtainedfrom the slopes <strong>of</strong> the plots: lgσ ac vs. lgω in the low <strong>and</strong> high frequency regions.The inset <strong>of</strong> Fig. 3 shows the temperature dependence <strong>of</strong> s 1 <strong>and</strong> s 2 . It can beseen that the values <strong>of</strong> both s 1 <strong>and</strong> s 2 are always lower than 1. Also, the values <strong>of</strong> boths 1 as well as s 2 decrease with the rise in temperature. The value <strong>of</strong> s 1 → 0 at higher
322K. PRASAD et al.temperatures indicates that the dc conductivity dominates at higher temperatures in thelow frequency region satisfying Eq. (3). The model based on correlated hopping <strong>of</strong>electrons over a barrier [19] predicts a decrease in the value <strong>of</strong> s 1 with the increase intemperature, <strong>and</strong> thus it is found to be consistent with the experimental results. Therefore,the conduction in the system could be considered due to the short range translationaltype hopping <strong>of</strong> charge carriers [18–20]. This indicates that the conductionprocess is thermally activated.Fig. 3. Dependences <strong>of</strong> ac conductivity on frequency at various temperaturesfor Ba(Bi 0.5 Nb 0.5 )O 3 ceramics. Inset figure illustrates the dependences <strong>of</strong> s 1 <strong>and</strong> s 2 on temperatureThe hopping conduction mechanism is generally consistent with the existence <strong>of</strong>high density <strong>of</strong> states in the materials having a b<strong>and</strong> gap similar to that <strong>of</strong> a semiconductor.Due to localization <strong>of</strong> charge carriers, formation <strong>of</strong> polarons takes place <strong>and</strong>the hopping conduction may occur between the nearest neighbouring sites. Figure 4shows the dependence <strong>of</strong> ac conductivity on 10 3 /T. The activation energy for conductionwas determined using the Arrhenius relationship:exp ⎛ E ⎞aσac= σ0 ⎜−⎟⎝ kTB ⎠(10)where E a is the activation energy <strong>of</strong> conduction <strong>and</strong> T is the absolute temperature. Thevariation pr<strong>of</strong>ile shows the negative temperature coefficient <strong>of</strong> resistance (NTCR)behaviour <strong>of</strong> BNN. A linear least squares fitting <strong>of</strong> the conductivity data to Eq. (10)gives the value <strong>of</strong> the activation energy, E a . The values <strong>of</strong> E a were found to be0.379 eV, 0.352 eV <strong>and</strong> 0.349 eV at 1 kHz, 10 kHz <strong>and</strong> 100 kHz, respectively.
Electrical conduction in Ba(Bi 0.5 Nb 0.5 )O 3 ceramics 323Fig. 4. Dependences <strong>of</strong> ac conductivity on inverse <strong>of</strong> temperatureat various frequencies for Ba(Bi 0.5 Nb 0.5 )O 3 ceramicsThe activation energy decreases with the increase in frequency It can be seen thatthe ac conductivity is almost frequency insensitive in low temperature region. Also,the onset temperature shifts to higher temperature side with the increment in frequency.The low value <strong>of</strong> E a may be due to the carrier transport through hopping betweenlocalized states in a disordered manner [21]. The increase in conductivity withtemperature may be explained, taking into consideration that within the bulk the oxygenvacancies due to the loss <strong>of</strong> oxygen, are usually created during sintering <strong>and</strong> thecharge compensation is described by the following reaction [22]:O→ O ↑+ V + 2e12ii2 0which may leave behind free electrons, making them n type [23].The values <strong>of</strong> N(E f ) were estimated using Eq. (6) by assuming f 0 = 10 13 Hz,α = 10 10 m –1 at various operating frequencies <strong>and</strong> temperatures. Figure 5 shows thefrequency dependence <strong>of</strong> N(E f ) at various temperatures. It can be seen that the values<strong>of</strong> N(E f ) decrease with the increase in the operating frequency. Inset <strong>of</strong> Fig. 5 showsthe variation <strong>of</strong> N(E f ) with temperature at various frequencies. It is seen that the N(E f )simply increases with the increase in temperature. Therefore, at low frequencies theelectrical conduction in the system is being affected by both frequency as well as temperature,whereas at higher frequencies the charge carriers are localized <strong>and</strong> being affectedby thermal excitations. The reasonably high values <strong>of</strong> N(E f ) suggest that the hopping betweenthe pairs <strong>of</strong> sites dominates the mechanism <strong>of</strong> charge transport in BBN.−
324K. PRASAD et al.Fig. 5. Dependences <strong>of</strong> density <strong>of</strong> states at Fermi level <strong>of</strong> (Ba(Bi 0.5 Nb 0.5 )O 3 ceramics on frequency atvarious temperatures. Inset figure shows the temperature dependence <strong>of</strong> N(E f ) at various frequenciesFig. 6. Dependences <strong>of</strong> R min <strong>of</strong> Ba(Bi 0.5 Nb 0.5 )O 3 ceramics on frequency at various temperatures.Inset figure shows the variation <strong>of</strong> R min on temperature at various frequenciesThe values <strong>of</strong> the minimum hopping distance, R min were calculated using Eq. (8).Figure 6 presents the variation <strong>of</strong> R min with frequency at various temperatures. Thevalues <strong>of</strong> R min simply increase as the frequency increases at every temperature. Inset <strong>of</strong>Fig. 6 shows the variation <strong>of</strong> R min with temperature at various frequencies. It can beseen that the values <strong>of</strong> R min decrease with the increase in temperature. The value <strong>of</strong>R min at room temperature was found to be 1.6 nm.
Electrical conduction in Ba(Bi 0.5 Nb 0.5 )O 3 ceramics 3254. ConclusionsPolycrystalline Ba(Bi 0.5 Nb 0.5 )O 3 , fabricated through a high-temperature solid statereaction technique, was found to have a single phase perovskite type monoclinic structure.The ac conductivity is found to obey the universal power law <strong>and</strong> showed theNTCR character. The correlated barrier hopping model is found to successfully explainthe mechanism <strong>of</strong> charge transport in BBN. Furthermore, the frequency dependentac conductivity at various temperatures indicated that the conduction process isthermally activated.AcknowledgementsThe present work was supported by the Defense Research <strong>and</strong> Development Organization, NewDelhi.References[1] REANEY I.M., PETZELT J., VOITSEKHOVSKII V.V., CHU F., SETTER N., J. Appl. Phys., 76 (1994), 2086.[2] SAHA S., SINHA T.P., Phys. Rev. B, 65 (2002), 134103.[3] RAEVSKI I.P., PROSANDEEV S.A., BOGATIN A.S., MALITSKYA M.A., JASTRABIK L., J. Appl. Phys., 93(2003), 4130.[4] CHUNG C.-Y., CHANG Y.-H., CHEN G.-J., J. Appl. Phys., 96 (2004), 6624.[5] CHUNG C.-Y., CHANG Y.-H., CHEN G.-J., CHAI Y.-L., J. Cryst. Growth, 284 (2005), 100.[6] EITSSAYEAM S., INTATHA U., PENGPAT K., TUNKASIRI T., Curr. Appl. Phys., 6 (2006), 316.[7] WANG Z., CHEN X.M., NI L., LIU X.Q., Appl. Phys. Lett., 90 (2007), 022904.[8] INTATHA U., EITSSAYEAM S., PENGPAT K., MACKENZIE K.J.D., TUNKASIRI T., Mater. Lett., 61 (2007), 196.[9] KE S., HUANG H., FAN H., CHAN H.L.W., ZHOU L.M., Ceram. Int., 34 (2008), 1059.[10] DUTTA A., SINHA T.P., J. Phys. Chem. Solids, 67 (2006), 1484.[11] JUNG W.-H., LEE J.-H., SOHN J.-H., NAM H.-D., CHO S.-H., Mater. Lett., 56 (2002), 334.[12] SUMAN C.K., PRASAD K., CHOUDHARY R.N.P., Adv. Appl. Ceram., 104 (2005), 294.[13] WILLIAMSON G.K., HALL W.H., Acta. Metall., 1 (1953), 22.[14] ELLIOTT S.R., Adv. in Phys., 36 (1987), 135.[15] SHARMA G., ROY M., ROY M.S., Mater. Sci. Eng., B 104 (2003), 15.[16] MOLLAH S., SOM K.K., BOSE K., CHAUDRI B.K., J. Appl. Phys., 74 (1993), 931.[17] SALAM R., Phys. Stat. Sol. (a), 117 (1990), 535.[18] FUNKE K., Prog. Solid State Chem., 22 (1993), 111.[19] ELLIOTT S.R., Philos. Mag., B 37 (1978), 553.[20] YOUSSEF AHMED A.A., Z. Naturforsch., A57 (2002), 263.[21] PRASAD K., SUMAN C.K., CHOUDHARY R.N.P., Adv. Appl. Ceram., 105 (2006), 258.[22] KRÖGER F.A., VINK H.J., Solid State Phys., 3 (1956), 307.[23] PRASAD K., SUMAN C.K., CHOUDHARY R.N.P., Ferroelectrics, 324 (2005), 89.Received 8 March 2009Revised 4 June 2009
Materials Science-Pol<strong>and</strong>, Vol. 28, No. 1, 2010Preparation <strong>and</strong> microwave absorption<strong>of</strong> M type ferrite nanoparticle compositesG.Z. SHEN 1* , G.S. CHENG 1 , Y. CAO 1 , Z. XU 21 College <strong>of</strong> Mathematics <strong>and</strong> Physics, Nanjing University <strong>of</strong> Information Science <strong>and</strong> Technology,Nanjing 210044, P.R. China2 School <strong>of</strong> Materials Science <strong>and</strong> Engineering, Tongji University,Shanghai 200092, P.R. ChinaThe sol-gel method was used to obtain M type BaFe 12 O 19 ferrite nanoparticles. Rod like <strong>and</strong> flakelike ferrite nanoparticles can be successfully fabricated by controlling the heating process <strong>of</strong> the precursor.The phase attributes, morphology <strong>and</strong> grain size <strong>of</strong> BaFe 12 O 19 ferrite were characterized by TEM <strong>and</strong>XRD. The complex permittivity <strong>and</strong> permeability <strong>of</strong> ferrite epoxy resin composites were measured in theKu waveb<strong>and</strong> (12.4–18 GHz). Ferrite composites containing short carbon fibres have also been fabricatedin order to obtain higher complex permittivities <strong>of</strong> the composites. The reflectivities <strong>of</strong> these ferrite compositeswere calculated according to the measured electromagnetic parameters. The results show that themicrowave absorption properties <strong>of</strong> ferrite composites can be effectively improved by filling them withshort carbon fibres.Keywords: ferrite nanoparticles; sol-gel method; carbon fibres; microwave absorption1. IntroductionElectromagnetic wave absorbing materials in the GHz range have attracted muchattention in recent years with the development <strong>of</strong> GHz microwave communication,radar detection <strong>and</strong> other industrial applications. These absorbing materials can bemanufactured by a number <strong>of</strong> magnetic <strong>and</strong> dielectric materials in powder forms,loaded in various kinds <strong>of</strong> polymeric binders. Various electromagnetic wave absorbingmaterials can be designed by using the dispersion characteristic <strong>of</strong> the complex permittivity<strong>and</strong> permeability [1–5]. Ferrite is one <strong>of</strong> materials used as an electromagnetic_________* Corresponding author, e-mail: shengz3@126.com
328G. SHEN et al.wave absorber, <strong>and</strong> a number <strong>of</strong> studies have been reported on the dependence <strong>of</strong> theelectromagnetic wave absorption properties on their composition [6–12]. However,a pure ferrite microwave absorber is insufficient to achieve wideb<strong>and</strong> absorption. Inthis work, emphasis has been laid on the synthesis <strong>of</strong> <strong>nanocrystalline</strong> BaFe 12 O 19 ferritepowders <strong>and</strong> improving the dielectric properties <strong>of</strong> ferrite composites.In the present study, M type ferrite nanoparticles were obtained by adopting thecitrate sol-gel method. Various heating processes <strong>of</strong> the precursors were used to obtaindifferent morphologies <strong>of</strong> nanoparticles. The flake-like nan<strong>of</strong>errite was selected toproduce ferrite epoxy resin composites. In order to improve the dielectric properties <strong>of</strong>ferrite composites, short carbon fibres (T700) were filled into the composites. Theelectromagnetic parameters <strong>of</strong> the ferrite composites were measured in the Ku waveb<strong>and</strong>by a network analyzer, <strong>and</strong> the microwave reflectivity <strong>of</strong> a single layer coating <strong>of</strong>the ferrite composites was calculated.2. ExperimentalM type BaFe 12 O 19 hexaferrites were fabricated by the citrate sol-gel technique.The starting materials were Ba(NO 3 ) 2 , Fe(NO 3 ) 3·9H 2 O <strong>and</strong> citric acid. In a typicalprocedure for the preparation <strong>of</strong> BaFe 12 O 19 , firstly, aqueous solutions <strong>of</strong> barium <strong>and</strong>ferric salts were obtained separately by dissolving the salts in distilled water, <strong>and</strong> thenadded together in stoichiometric proportions. Solution <strong>of</strong> citric acid was added to theaqueous salt solution in an appropriate proportion under constant stirring <strong>and</strong> pH <strong>of</strong>the solution was adjusted to 7.0 with ammonia. The solution was then heated to 80 °C<strong>and</strong> maintained at that temperature for 3 h in a water bath. Finally, the solution wasdried at 100 °C to form a dry gel. To obtain different structural features <strong>of</strong> ferrites, thedried gel precursor was treated by various heating methods in a muffle furnace. Theprecursor was heated to 900 °C at the rate <strong>of</strong> 50 °C/h, <strong>and</strong> then calcined at the sametemperature for 4 h (sample A). Other samples were fabricated by a double heattreatmentmethod. First, the precursor was pre-heated at 450 °C for 3 h, <strong>and</strong> then the itwas heated to 900 °C at the rate <strong>of</strong> 50 °C/h <strong>and</strong> calcined at 900 °C for 4 h to form ferritesample B. Ferrite sample C was obtained by a similar method as sample B; theonly difference was that the pre-heated product was rapidly heated to 900 °C.The X-ray diffraction patterns <strong>of</strong> the ferrite powder were obtained with an X-raypowder diffractometer with CuK α radiation (D/max-2550). The morphology <strong>of</strong> thecrystal grain was observed under a transmission electron microscope (H-800). Theelectromagnetic parameters, complex permittivity <strong>and</strong> permeability, were measured bya network analyzer (Agilent E8363B) in the Ku waveb<strong>and</strong>. In order to measure theelectromagnetic parameters <strong>of</strong> composites, rectangular samples were made from theferrite sample C <strong>and</strong> epoxy resin composite with 60 wt. % <strong>of</strong> ferrite. To obtain material<strong>of</strong> higher permittivity, ferrite composite samples containing 0.2 wt. % <strong>of</strong> shortcarbon fibres (3 mm long) were also obtained.
M type ferrite nanoparticle composites 3293. Results <strong>and</strong> discussion3.1. Characterization <strong>of</strong> samplesXRD patterns <strong>of</strong> the ferrites samples synthesized by the sol-gel route are shown inFig. 1. They show that the heating method affects the structural features <strong>of</strong> ferriteproducts. M type hexaferrite BaFe 12 O 19 <strong>and</strong> α-Fe 2 O 3 phases can be detected in sampleA which fabricated by direct heating <strong>of</strong> dried precursors to 900 °C. Curves b <strong>and</strong> cin Fig. 1 show that pure crystalline M type ferrite can be obtained when the precursorsare first preheated at 450 °C for 3 h, <strong>and</strong> then calcined at 900 °C.Fig. 1. XRD patterns <strong>of</strong> the ferrite samples: a) sample A, b) sample B, c) sample CWhen the dried precursors are heated, the following reactions occur [8]:Dried precursors → γ-Fe 2 O 3 + Ba 2+γ-Fe 2 O 3 + Ba 2+ → BaFe 2 O 4BaFe 2 O 4 + 5γ-Fe 2 O 3 → BaFe 12 O 19First <strong>of</strong> all, precursors decompose <strong>and</strong> produce γ-Fe 2 O 3 , <strong>and</strong> then the reaction proceedsas shown in the above equations during the subsequent heat treatment. Finally,
330G. SHEN et al.the ferrite BaFe 12 O 19 is obtained. However, when precursors are heated to 900 °C directly,α-Fe 2 O 3 forms a stable phase <strong>and</strong> does not react with Ba 2+ at 900 °C. As a result,a small amount <strong>of</strong> residual exists in sample A. However, the pre-heat treatment at450 °C can effectively prevent precursors from producing α-Fe 2 O 3 [13, 14].Fig. 2. TEM images <strong>of</strong> thesamples: a) sample A, b) sample B,c) sample CThe morphology <strong>of</strong> the ferrite particles was examined by TEM. Homogeneousrod-like particles 60 nm in diameter, 0.7–1.0 μm long were found in sample A, asshown in Fig. 2a. Figure 2b shows that the particles <strong>of</strong> sample B are both rod-like <strong>and</strong>flake-like. However, the rod-like particles are not as homogeneous as sample A. Theparticles <strong>of</strong> sample C are mostly flake-like, <strong>and</strong> the average size <strong>of</strong> the grains is about80 nm. The crystal morphology is determined by the growth rate <strong>of</strong> every crystal face,according to the crystal growth mechanism described in [15, 16]. Under slow heating,the crystallization time is enough long <strong>and</strong> the growth rate is higher along the longaxisfor the hexaferrite. Thus a slow heating rate is conducive to fabrication <strong>of</strong> onedimensionalnanorods [17, 18] but a detailed mechanism <strong>of</strong> formation <strong>of</strong> the aspreparedrods <strong>and</strong> flakes is still under investigation.3.2. Microwave absorptionThe dependences <strong>of</strong> the complex permittivity <strong>and</strong> permeability <strong>of</strong> ferrite compositeson frequency are shown in Figs. 3 <strong>and</strong> 4. Figure 3 represents the frequency dependences<strong>of</strong> the real part ε′ <strong>and</strong> the imaginary part ε′′ <strong>of</strong> the complex permittivity <strong>of</strong>the ferrite composite (M) <strong>and</strong> the ferrite composite filled with short carbon fibre (MC),respectively. The values <strong>of</strong> ε′ <strong>and</strong> ε′′ for the composite MC are higher than for the
M type ferrite nanoparticle composites 331composite M in the Ku waveb<strong>and</strong>. The dielectric properties <strong>of</strong> polycrystalline ferritecomposites arise mainly from the interfacial polarization <strong>and</strong> the intrinsic electric dipolepolarization. However, the dielectric properties <strong>of</strong> the composite MC arise notonly from the polarization <strong>of</strong> ferrite but also from the electric dipole polarization <strong>of</strong>short carbon fibres [19].Fig. 3. Dependences <strong>of</strong> complex permittivity <strong>of</strong> ferrite compositeson frequency: a) real part, b) imaginary partIt is seen from Fig. 4 that the values <strong>of</strong> μ′ <strong>and</strong> μ′′ <strong>of</strong> the complex permeability <strong>of</strong>the ferrite composite M <strong>and</strong> the composite MC are similar over the considered frequencyrange. The reason is that addition <strong>of</strong> carbon fibre has affects the magneticproperties <strong>of</strong> the composites.The reflectivity <strong>of</strong> the incident electromagnetic wave normal to the planar singlelayercoated on a metal plate is given as
332G. SHEN et al.R = 20lgμr⎛ 2πf⎞tanh⎜j μεr rd⎟− 1ε ⎝ c ⎠rμr⎛ 2πf⎞tanh⎜j μεr rd⎟+ 1ε ⎝ c ⎠r(1)Here d, ε r <strong>and</strong> μ r are the thickness <strong>of</strong> the coating, the relative complex permittivity<strong>and</strong> the permeability <strong>of</strong> the composite, respectively [15].Fig. 4. Dependences <strong>of</strong> complex permeability <strong>of</strong> ferrite compositeson frequency: a) real part, b) imaginary partFigure 5 shows the predicted microwave absorption properties <strong>of</strong> a single layercoating 2 mm thick for the composite M <strong>and</strong> composite MC, according to Eqs. (1). Itis observed that the reflective loss <strong>of</strong> the ferrite composite M is worse than that <strong>of</strong> MC.
M type ferrite nanoparticle composites 333Fig. 5. Absorption curves <strong>of</strong> ferrite composite coatingsHowever, the absorption properties <strong>of</strong> the composite MC, which is filled withshort carbon fibres, are improved obviously. Its reflectivity decreases as frequencyincreases, for frequencies below 13.3 GHz, <strong>and</strong> begins to increase gradually for frequenciesabove 13.3 GHz. The reflectivity is about –11.0 dB at 13.3 GHz, <strong>and</strong> –4.2 dBat 18 GHz. The absorption b<strong>and</strong>width lower than –10.0 dB is 1.4 GHz, which is from12.7 GHz to 14.1 GHz. The reason that the absorption properties <strong>of</strong> the composite MCare better than those <strong>of</strong> the composite M is that short conductive carbon fibres in ferritecomposite can act as electric dipoles <strong>and</strong> resonate with the incident wave. Addingshort carbon fibres can increase the dielectric loss <strong>of</strong> the considered composites.4. ConclusionM type BaFe 12 O 19 hexaferrite nanoparticles were successfully synthesized by the citratesol-gel process. Rod like <strong>and</strong> flake like nanoparticles were obtained by various heatingmethods. Ferrite composites containing short carbon fibres were designed to test the electromagneticparameters <strong>of</strong> the composites. The results show that addition <strong>of</strong> short carbonfibres can effectively improve the microwave absorption properties <strong>of</strong> M type ferritenanocomposites. Absorption b<strong>and</strong>width lower than –10.0 dB <strong>of</strong> the composite is 1.4 GHz,between 12.7 GHz <strong>and</strong> 14.1 GHz. The method <strong>of</strong> preparation <strong>and</strong> design may potentiallybe applied to produce light weight <strong>and</strong> high performance absorption materials.AcknowledgementsThis work was supported by funding from the Nanjing University <strong>of</strong> Information Science <strong>and</strong> Technology(Grant No. 20080284).
334G. SHEN et al.References[1] ZHANG B.S., LU G., FENG Y., XIONG J., LU H.X., J. Magn. Magn. Mater., 299 (2006), 205.[2] LI D.S., HORIKAWA T., LIU J.R., ITOH M., MACHIDA K.I., J. Alloy Compd., 408–412 (2006), 1429.[3] RAHUL SHARMA, AGARWALA R.C., VIJAYA AGARWALA, Mater. Lett., 62 (2008), 2233.[4] DENG Y.D., LIU X., SHEN B., LIU L., HU W.B., J. Magn. Magn. Mater., 303 (2006), 181.[5] PARK K.Y., LEE S.E., KIM C.G., HAN J.H., Compos. Sci. Tech., 66 (2006), 576.[6] GHASEMI A., HOSSIENPOUR A., MORISAKO A., SAATCHI A., SALEHI M., J. Magn. Magn. Mater., 302(2006), 429.[7] SHEN G.Z., XU Z., LI Y., J. Magn. Magn. Mater., 301 (2006), 325.[8] KIMURA S., KATO T., HYODO T., SHIMIZU Y., EGASHIRA M., J. Magn. Magn. Mater., 312 (2007), 181.[9] ZHANG H.J., LIU Z.C., MA C.L., YAO X., ZHANG L.Y., WU M.Z., Mater. Chem. Phys., 80 (2003), 129.[10] TABATABAIE F., FATHI M.H., SAATCHI A., GHASEMI A., J. Alloy Compd., 474 (2009), 206.[11] LIMA U.R., NASAR M.C., NASAR R.S., REZENDE M.C., ARAUJO J.H., OLIVEIRA J.F., Mater. Sci.Eng. B, 151 (2008), 238.[12] STEIER H.P., GALLAGHER P.K., J. Mater. Res., 14(1999), 3647.[13] HUANG J.G., ZHUANG H.R., LI W.L., Mater. Res. Bull., 38(2003), 149.[14] XU J.F., GUO F.F., XU Z., J. Tongji University., 32 (2004), 929.[15] VEKILOV P.G., KUZNETSOV Y.G., CHERNOV A.A., J. Cryst. Growth., 121(1992), 643.[16] TRACY S.L., WILLAMS D.A., JENNINGS H.M., J. Cryst. Growth, 193(1998), 374.[17] WANG J.M., GAO L., J. Mater. Chem., 13 (2003), 2551.[18] GUO L., JI Y.L., XU H.B., WU Z.Y., SIMON P., J. Mater. Chem., 13 (2003), 754.[19] SHEN G.Z, XU M., XU Z., Mater. Chem. Phys., 105 (2007), 268.Received 16 March 2009Revised 4 August 2009
Materials Science-Pol<strong>and</strong>, Vol. 28, No. 1, 2010Effect <strong>of</strong> thermal ageing on the evolution <strong>of</strong>microstructure <strong>and</strong> degradation <strong>of</strong> hardness<strong>of</strong> 2.25Cr-1Mo steelB.B. JHA 1* , B.K. MISHRA 1 , B. SATPATI 2 , S.N. OJHA 31 Advanced Materials Technology Division, IMMT, Bhubaneswar-751013, India2 Materials Characterization Division, IMMT, Bhubaneswar-751013, India3 Department <strong>of</strong> Metallurgical Engineering, IT- BHU, Varanasi-221005, IndiaThermal ageing <strong>of</strong> various durations <strong>and</strong> at various temperatures was performed in order to underst<strong>and</strong>microstructural changes associated with precipitation <strong>and</strong> coarsening <strong>of</strong> carbides in 2.25Cr-1Mosteel. The severity <strong>of</strong> thermal ageing is expressed in terms <strong>of</strong> the Larson–Miller parameter (LMP). Themicrostructural examinations were carried out by optical <strong>and</strong> scanning electron microscopy techniques.A transmission electron microscope (TEM) <strong>and</strong> an electron probe micro analyzer (EPMA) were used toidentify the carbide particles, <strong>and</strong> to analyse the shape, size <strong>and</strong> distribution <strong>of</strong> the precipitate phases.Influence <strong>of</strong> these precipitates on hardness degradation <strong>of</strong> the steel has been examined. The reasons forthe variation in the microstructure <strong>and</strong> for the hardness degradation <strong>of</strong> steel arising from thermal ageingare discussed.Keywords: thermal ageing; microstructure; hardness degradation; 2.25Cr-1Mo steel1. IntroductionFerritic 2.25Cr-1Mo steel is a popular engineering alloy used for high temperatureapplications such as heat exchangers, steam receivers, high temperature headers <strong>and</strong>piping in various power generating units [1]. As the service temperatures have beenincreasing to improve the thermal efficiency <strong>of</strong> power generating systems, materialshaving strong stability <strong>of</strong> microstructures <strong>and</strong> increased corrosion resistance at operatingtemperatures are needed for such applications. The main advantage <strong>of</strong> the steelunder consideration is an improved high-temperature strength derived from molybdenum<strong>and</strong> chromium additions <strong>and</strong> the enhanced corrosion resistance derived from_________* Corresponding author, e-mail: bbjha@immt.res.in
336B.B. JHA et al.chromium [2]. The high temperature strength <strong>of</strong> this steel is derived mainly from twosources: solid solution strengthening <strong>of</strong> the ferrite matrix by carbon, molybdenum <strong>and</strong>chromium <strong>and</strong> precipitation hardening by carbides [3]. Due to its properties at elevatedtemperatures, this steel satisfies the safety criteria for operational use, as specifiedunder section 3-ASME Case-47 <strong>of</strong> Ref. [4].2.25Cr-1Mo ferritic steel has always been used in the normalized <strong>and</strong> temperedconditions or annealed conditions, depending upon the thickness <strong>of</strong> the component.Thin boiler tubes are made from steel in the annealed condition, whereas thick piping<strong>and</strong> headers are used mostly in the normalized <strong>and</strong> tempered conditions. Depending oncooling rates employed in these treatments, the microstructures <strong>of</strong> 2.25Cr-1Mo steelmay vary from ferrite–pearlite aggregates to ferrite-bainite aggregates. The carbidesobtained during the heat treatments are <strong>of</strong> the required morphology <strong>and</strong> distribution,so that the steel can maintain its strength at high temperature. However, due to themetastable nature <strong>of</strong> these precipitates, they undergo an undesirable transformationunder operating conditions or during repair welding. Occasionally thermal transientscan cause excessive local heating <strong>of</strong> the tubes, resulting in microstructural alteration[2, 5]. All these situations would result in microstructural variation <strong>of</strong> componentsquite different from the initial, optimized microstructure obtained in the normalized<strong>and</strong> tempered conditions, or after annealing.2.25Cr-1Mo ferritic steel consists <strong>of</strong> bainite <strong>and</strong> ferrite containing iron carbides<strong>and</strong> fine M 2 C type carbides in annealed condition. As the duration <strong>of</strong> ageing increases,a variety <strong>of</strong> secondary carbides like M 7 C 3 , M 23 C 6 <strong>and</strong> M 6 C gets precipitated [6, 7]. Theprecipitates also get coarsened with ageing. Such an evolution <strong>of</strong> precipitates, <strong>and</strong>their coarsening, influences the performance <strong>of</strong> this material at high temperatures.Although the microstructural instability <strong>of</strong> the steel, in terms <strong>of</strong> its cavity formation<strong>and</strong> its linkage under stress (leading to microcrack generation), is well documented[8, 9], but no systematic data is available on the microstructural deterioration due tocarbide precipitation <strong>and</strong> coarsening. For this reason an investigation was made intomicrostructural degradation at various temperatures, together with subsequent analysisinto how this influences hardness. Determination <strong>of</strong> the true state <strong>of</strong> degradation is animportant consideration in the accurate assessment <strong>of</strong> the remaining operational lifetime<strong>of</strong> components.2. ExperimentalMaterials. 2.25Cr-1Mo ferritic steel having nominal chemical composition(wt. %) C – 0.07, Mn – 0.42, Si – 0.019, S – 0.025, Cr – 2.28, P – 0.02, Mo – 0.98, Ni– 0.09, Fe – balance, has been used in the present investigation.Thermal ageing.The starting material used in this study was shaped in the form <strong>of</strong>a plate 12 mm thick. From this plate strips measuring 12 ×12 × 250 mm 3 were cutusing a power hacksaw <strong>and</strong> then machined to a size <strong>of</strong> 10 × 10 × 80 mm 3 : the rollingdirections were parallel to the length <strong>of</strong> the strips. These strips were then sealed in
Thermal ageing <strong>of</strong> 2.25Cr-1Mo steel 337evacuated quartz tubes <strong>and</strong> subject to annealing at 1223 K for 2 h. The temperature <strong>of</strong>the furnace was maintained constant, within an accuracy <strong>of</strong> ±1.0 K.In order to study the microstructural degradation, these annealed strips were subjectto ageing treatments at 873 K for 10 h, 923 K for 20 h, 973 K for 40 h <strong>and</strong> 973 Kfor 80 h using a tubular furnace. These treatments correspond to the values <strong>of</strong> the Larson–Millerparameter (LMP) <strong>of</strong> 33 012, 35 402, 37 846 <strong>and</strong> 38 374, respectively.Scales <strong>of</strong> the heat treated samples were then removed by coarse polishing on siliconcarbide papers.Metallography. Cubes <strong>of</strong> 10 × 10 × 50 mm 3 were cut from the heat treated samples,annealed <strong>and</strong> thermally aged to various degrees. These specimens were suitablymounted in a cold setting resin <strong>and</strong> were ground using successive grades <strong>of</strong> siliconcarbide papers <strong>and</strong> then polished mechanically using 0.25 μ diamond paste for final,scratch-free polishing. Chemical etching was then done using a solution <strong>of</strong> 2 cm 3HNO 3 in 100 cm 3 <strong>of</strong> methanol (i.e., 2% Nital) maximum for 10 s.Chemically etched <strong>and</strong> dried specimens were examined under a Nikon make, metallurgicalmicroscope (Model LV-150). Complete scanning was done at the lowermagnification in order to extract the most representative microstructural features,which were then captured at higher magnification <strong>and</strong> presented as observations.Scanning electron microscopy (SEM) <strong>and</strong> electron probe micro analysis (EPMA).All the heat treated samples, after chemical etching, were examined using a SEM (JoelModel-804 <strong>and</strong> a Hitachi Model S-3400 N) for phase identification. Energy dispersiveX-ray Analysis (EDX) together with SEM was used for determination <strong>of</strong> the surfacecomposition. An electron probe micro analyzer (Joel Model JXA-8100) was used toobtain the line scan pr<strong>of</strong>ile showing the compositional variation <strong>of</strong> various elements inthe matrix. X-ray images showing the elemental distribution <strong>of</strong> various elements indifferent phases was also obtained using EPMA. These analyses enabled identifyingthe concentration <strong>of</strong> solute atoms within the grains <strong>and</strong> at the grain boundaries: thestate <strong>of</strong> deterioration <strong>of</strong> a given microstructure, namely the result <strong>of</strong> a particular ageingtreatment, corresponded to a specific LMP value.Transmission electron microscopy (TEM). For the transmission electron microscopy(TEM), very thin specimens ca. 0.5 mm thick were cut from various heat treatedsamples by electric discharge machining (EDM). These specimens were furtherthinned, using fine grade silicon carbide papers, up to a thickness <strong>of</strong> about 0.2 mm <strong>and</strong>then discs 3 mm in diameters were cut. They were further thinned by polishing bothsides using silicon carbide papers <strong>and</strong> emery papers, up to the thickness <strong>of</strong> about 80 μ.The thickness <strong>of</strong> the discs was further reduced at the central portion, using a dimpler(M/s Gattan make), to a thickness <strong>of</strong> about 30 μ. Dimpled discs were then subject toion milling till a fine perforated hole was made at the centre <strong>of</strong> the disc, enabling theadjacent area <strong>of</strong> the hole to be electron transparent.A FEI make (model Tecnai G 2 20 twin) analytical transmission electron microscopeoperating at an accelerated voltage <strong>of</strong> 200 kV was used to identify carbides pre-
338B.B. JHA et al.cipitated as a result <strong>of</strong> various degrees <strong>of</strong> ageing. Using this microscope it was possibleto resolve the precipitates <strong>of</strong> size down to Angstrom level. Selected area diffraction(SAD) patterns from matrix containing precipitates, <strong>and</strong> also from precipitatesalone, were obtained to ascertain the orientation difference <strong>of</strong> various carbide precipitateswith that <strong>of</strong> the matrix. Microchemical analyses <strong>of</strong> precipitates were carried outusing an EDX facility attached with TEM. The EDX attachment had a super ultra thinwindow with Si (Li) detector for analyzing the constituents. A combination <strong>of</strong> brightfield <strong>and</strong> dark field imaging was carried out to ascertain a detailed morphology <strong>of</strong> theprecipitates <strong>and</strong> their coarsening with respect to the increase in the degree <strong>of</strong> ageing.Hardness measurement. Microhardness measurement <strong>of</strong> annealed (1223 K, 2 h)<strong>and</strong> aged specimens subject to various degrees <strong>of</strong> ageing, corresponding to LMP values<strong>of</strong> 33 012, 35 402, 37 846 <strong>and</strong> 38 374 was carried out using a microhardness tester(model RZD-00 <strong>of</strong> Leitz make). Indentations in both the phases were made witha diamond indenter using 0.5 N force <strong>and</strong> after measuring both the diagonals <strong>of</strong> theindentations, hardness values in VHN were obtained. Minimum <strong>of</strong> about five datapoints were taken for each measurement <strong>and</strong> the reported hardness values (Hv) in Table1 are the average values <strong>of</strong> these five points. The maximum variation in the scatter<strong>of</strong> data was about 7.0%. This variation has also been indicated as an interval <strong>of</strong> confidencewhile plotting these hardness values in function <strong>of</strong> the L–M parameters.3. Results <strong>and</strong> discussion3.1. Microstructural analysisFigure 1a shows the optical micrograph <strong>of</strong> 2.25Cr-1Mo steel in annealed conditions<strong>and</strong> Fig. 1b shows the same observed under SEM. The average initial grain sizewas measured <strong>and</strong> found to be 35 μm. Transmission electron micrographs <strong>of</strong> this sampleshowed fine precipitation <strong>of</strong> lenticular shaped carbides uniformly distributedwithin the grains <strong>of</strong> the bainitic matrix.Fig. 1. Optical (a) <strong>and</strong> SEM (b) micrographs <strong>of</strong> 2.25Cr-1Mo steelshowing bainite <strong>and</strong> ferrite phases after annealing (1223 K, 2h)
Thermal ageing <strong>of</strong> 2.25Cr-1Mo steel 339Fig. 2. Transmission electron micrograph<strong>of</strong> annealed 2.25Cr-1Mo steel showinglenticular precipitates <strong>of</strong> M 3 C typein a bainite matrixThe shape <strong>of</strong> carbides is mostly lenticular, aligned parallel to each other alongtheir axes, as shown in Fig. 2. It is observed that the size <strong>of</strong> these precipitates is <strong>of</strong> theorder <strong>of</strong> about 100 nm. Figures 3a, b show the SAD pattern <strong>of</strong> a bainitic matrix containingthese precipitates <strong>and</strong> their schematic indexing, respectively. The EDX results<strong>of</strong> 10–15 carbides showed them to be rich in iron. An EDX spectrum from typicalcarbide is shown in Fig. 4, which clearly revealed that these lenticular shaped carbidesare <strong>of</strong> M 3 C type, as observed by other workers [7, 10].Fig. 3. SAD pattern <strong>of</strong> the bainitic matrix (a) containing precipitates <strong>of</strong> M 3 C type in annealed2.25Cr-1Mo steel <strong>and</strong> schematic indexing <strong>of</strong> a SAD pattern (b) shown in Fig. 3aTransmission electron micrographs <strong>of</strong> the samples corresponding to the treatment<strong>of</strong> 873 K for 10 h (LMP = 33 012) showed the evolution <strong>of</strong> the needle type <strong>of</strong> precipitates,as shown in Fig. 5. The EDX results showed them to be rich in chromium withconsiderable iron contents. An EDX spectrum from typical carbide is shown in Fig. 6.
340B.B. JHA et al.Fig. 4. Typical EDX spectrum <strong>of</strong> lenticular shaped iron rich carbide (M 3 C type)Fig. 5. Transmission electron micrograph<strong>of</strong> thermally aged 2.25Cr-1Mo steel (LMP = 33 012)showing precipitation <strong>of</strong> needle shaped carbides<strong>of</strong> a M 7 C 3 type in a bainite matrixFig. 6. Typical EDX spectrum <strong>of</strong> needle shaped carbide rich in chromiumwith considerable iron content (M 7 C 3 type)
Thermal ageing <strong>of</strong> 2.25Cr-1Mo steel 341Selected area diffraction pattern, along with indexing <strong>of</strong> this kind <strong>of</strong> precipitates,showed a streaking pattern (Fig. 7) which is a typical characteristic <strong>of</strong> the M 7 C 3 type<strong>of</strong> precipitates. These precipitates ca. 300 nm in size are also found to be oriented inthe same direction.Fig. 7. SAD pattern <strong>of</strong> bainitic matrixcontaining precipitates <strong>of</strong> a M 7 C 3 type showingstreaking pattern along with indexing in thermallyaged 2.25Cr-1Mo steel (LMP = 33 012)Fig. 8. Transmission electron micrograph<strong>of</strong> thermally aged 2.25Cr-1Mo steel (LMP = 35 402)showing precipitation <strong>of</strong> globular carbides<strong>of</strong> M 23 C 6 type within the bainitic grain.The inset displays [100] zone <strong>of</strong> this phaseFig. 9. Typical EDX spectrum <strong>of</strong> globular shaped carbiderich in iron with a considerable chromium content (M 23 C 6 type)Transmission electron micrographs <strong>of</strong> the samples corresponding to the treatment<strong>of</strong> 923 K for 20 h (LMP = 35 402) showed precipitation <strong>of</strong> globular carbides (size ca.500 nm) within the bainitic matrix (Fig. 8). The inset <strong>of</strong> Fig. 8 also shows the SADpattern from the precipitates along the zone axis [100]. The EDX results <strong>of</strong> these
342B.B. JHA et al.globular shaped carbides showed them to be rich in iron with considerable chromiumcontent. An EDX spectrum from typical globular shaped carbide is shown in Fig. 9.The spectrum revealed that these carbides are <strong>of</strong> M 23 C 6 type, being at this stage rich iniron with a considerable chromium content. These observations suggest that globularprecipitates evolved in bainitc matrix are different from those observed after thetreatment at 873 K for 10 h (LMP = 33 012). The presence <strong>of</strong> M 23 C 6 has also beenreported by other workers [10] for this variety <strong>of</strong> steel <strong>and</strong> under this condition.Fig. 10. Transmission electron micrographshowing precipitation <strong>of</strong> globular carbides <strong>of</strong>M 23 C 6 type <strong>of</strong> at grain boundary in thermallyaged 2.25Cr-1Mo steel (LMP = 37 846)Fig. 11. Transmission electron micrographshowing precipitation <strong>of</strong> plate shaped carbides<strong>of</strong> M 6 C type <strong>of</strong> at grain boundary in thermallyaged 2.25Cr-1Mo steel (LMP = 37 846)Fig. 12. Typical EDX spectrum <strong>of</strong> globular carbides rich in iron <strong>and</strong> chromium (M 23 C 6 type)Transmission electron micrographs <strong>of</strong> the specimen corresponding to the treatmentat 973 K for 40 h (LMP = 37 846) are shown in Figs. 10 <strong>and</strong> 11. It is observedthat by this treatment (LMP value <strong>of</strong> 37 846), the globular carbides have coarsened
Thermal ageing <strong>of</strong> 2.25Cr-1Mo steel 343<strong>and</strong> they are aligned at the grain boundaries. Their size has also increased (ca. 1 μ).Some plate shaped precipitates have also been observed (Fig. 11) as a result <strong>of</strong> thistreatment. An EDX spectrum <strong>of</strong> typical globular shaped carbide is shown in Fig. 12.The spectrum indicates that these carbides contain a considerable amount <strong>of</strong> iron <strong>and</strong>chromium, being identified as M 23 C 6 type. Figure 13 shows the EDX spectrum <strong>of</strong> theplate shaped precipitates shown in Fig. 11.Fig. 13. Typical EDX spectrum <strong>of</strong> plate shaped carbiderich in molybdenum with a considerable iron content (M 6 C type)Fig. 14. X-ray images showingthe elemental distribution<strong>of</strong> Fe, Cr, Mo <strong>and</strong> Cin thermally aged 2.25Cr-1Mosteel (LMP = 38 374)The spectrum indicates that the plate shaped precipitates are molybdenum richwith significant iron content. They are a typical M 6 C type <strong>of</strong> precipitate [7, 10, 11].Therefore, it is observed that at this stage <strong>of</strong> ageing, precipitated carbides are a mix-
344B.B. JHA et al.ture <strong>of</strong> M 23 C 6 <strong>and</strong> M 6 C type. In this case, the M 23 C 6 type <strong>of</strong> precipitate containsa greater amount <strong>of</strong> chromium as compared with the same precipitate having the LMPvalue 35 402. Observations <strong>of</strong> other workers [7, 10–12] have also showed that theseglobular carbides are <strong>of</strong> M 23 C 6 type, rich in iron <strong>and</strong> chromium, <strong>and</strong> that the plateshaped carbides are <strong>of</strong> M 6 C type, rich in molybdenum.Figure 14 shows X-ray images <strong>of</strong> a specimen thermally aged at 973 K for 80 h,corresponding to the LMP value <strong>of</strong> 38 374. Precipitation <strong>of</strong> chromium <strong>and</strong> molybdenumcarbides at grain boundaries is clearly evident in these figures. Thus, these micrographsvery clearly show that as the exposure temperature or time is increased,molybdenum <strong>and</strong> chromium carbides get precipitated in the sequence <strong>of</strong> M 3 C, M 7 C 3,M 23 C 6 <strong>and</strong> M 6 C at the grain boundaries <strong>and</strong> within the grains themselves. Precipitatesalso get coarser as we increase the values <strong>of</strong> the L–M parameters.3.2. Hardness degradationThe hardness values <strong>of</strong> both phases, i.e. bainite <strong>and</strong> ferrite in function <strong>of</strong> the Larson–Millerparameters are shown in Fig. 15 for both annealed (virgin) material(1223 K for 2 h) <strong>and</strong> thermally aged specimens. Degradation in hardness <strong>of</strong> bainiticphase is much stronger (62%) as compared with ferritic phase (12%).Fig. 15. Dependences <strong>of</strong> hardness variation <strong>of</strong> Virgin <strong>and</strong> thermally aged2.25Cr-1Mo steel on the L–M parameterTable 1 gives the hardness values for annealed <strong>and</strong> thermally aged specimens correspondingto various values <strong>of</strong> LMP. Hardness has been found to be a sensitive materialdegradation parameter, sufficient to predict the remaining life <strong>of</strong> components operatingat higher temperatures. It has been reported [13, 14] that in low alloy ferriticsteel, solute depletion <strong>and</strong> precipitate coarsening are the two predominant modes <strong>of</strong>material degradation during high temperature exposure.
Thermal ageing <strong>of</strong> 2.25Cr-1Mo steel 345Table 1. Hardness values <strong>of</strong> samples <strong>of</strong> annealed <strong>and</strong> thermally aged 2.25Cr-1Mo steelMicrostructural conditionsBainite hardness[HV]Ferrite hardness[HV]Annealed (1223 K/2 hr) 397 138Thermally aged (LMP 33.012) 412 162Thermally aged (LMP 35.402) 324 156Thermally aged (LMP 37.846) 251 152Thermally aged (LMP 38.374) 157 141Results on hardness measurements <strong>of</strong> samples <strong>of</strong> thermally aged 2.25Cr-1Mo steelindicate that solute depletion plays a minimum role in the degradation <strong>of</strong> hardness <strong>of</strong>this material. This is because the hardness degradation in the ferrite matrix is found tobe only up to ca. 12.0%. This could be either because the amounts <strong>of</strong> solute atoms arevery small or their diffusion with time <strong>and</strong> temperature is very fast. Hardness degradation<strong>of</strong> up to about 62.0% has been observed in the bainitic phase (Fig. 15). Microstructuralexamination <strong>of</strong> this steel at various degrees <strong>of</strong> ageing indicated a coarsening<strong>of</strong> carbide particles (Figs. 5, 8, 10 <strong>and</strong> 11) <strong>and</strong> a gradual change <strong>of</strong> their shapes <strong>and</strong>morphologies. All these observations, therefore, indicate that the predominant modes<strong>of</strong> hardness degradation in 2.25Cr-1Mo steel are due to a coarsening <strong>of</strong> alloy carbideprecipitates, <strong>and</strong> a change in their shapes <strong>and</strong> morphologies. These phenomena aremore predominant in bainitic phase, resulting in increased extent <strong>of</strong> hardness decline<strong>of</strong> this phase as compared with ferritic phase.In addition, the variation <strong>of</strong> the hardness (<strong>of</strong> both the phases) could be applied toassess the life expectancy <strong>of</strong> components made out <strong>of</strong> this material, because the degradation<strong>of</strong> thermally aged specimens is expected to share similar features with the degradationpr<strong>of</strong>ile <strong>of</strong> materials exposed to high temperatures under normal operatingconditions. By measuring the hardness <strong>of</strong> any phase (preferably bainite) after certain,known, number <strong>of</strong> hours <strong>of</strong> service, one can ascertain the temperature at which thetube is actually operating. Then, by using the stress rupture plot <strong>of</strong> this steel, the remaininglife <strong>of</strong> the tube can be estimated [8, 9] <strong>and</strong> preventive measures could then betaken to avoid potentially catastrophic component failures.4. ConclusionsThe present investigation indicated that in 2.25Cr-1Mo steel, as the ageing temperatureor time is increased, molybdenum <strong>and</strong> chromium carbides get precipitated inthe sequence <strong>of</strong> M 3 C, M 7 C 3, M 23 C 6 <strong>and</strong> M 6 C at the grain boundaries <strong>and</strong> within thegrains. Precipitation <strong>of</strong> chromium <strong>and</strong> molybdenum carbides <strong>and</strong> coarsening <strong>of</strong> carbideprecipitates are the main contributors <strong>of</strong> microstructural deterioration in this steel,as a result <strong>of</strong> increase in the severity <strong>of</strong> thermal ageing.
346B.B. JHA et al.The hardness <strong>of</strong> the both phases (i.e., bainite <strong>and</strong> ferrite) degrades in function <strong>of</strong>the L–M parameters, <strong>and</strong> the hardness degradation <strong>of</strong> bainite is greater than that <strong>of</strong> theferrite phase.It has been observed that the coarsening <strong>of</strong> alloy carbide precipitates <strong>and</strong> thechange in their shapes <strong>and</strong> morphologies are the two predominant factors influencingdegradation <strong>of</strong> hardness in this variety <strong>of</strong> steel when exposed to service temperatures.Degradation <strong>of</strong> hardness in function <strong>of</strong> LMP could be used as a tool for predicting thelifetime <strong>of</strong> components made up <strong>of</strong> this steel <strong>and</strong> operating at higher temperatures.References[1] SANDERSON J., [In:] Ferritic steels for high temperature applications, Proc. Conf. ASM,A. Khare (Ed.), (1983), p. 178.[2] PATTERSON S.R., KUNTZ T.A., MOSER R.S., VAILLANCOURT H., [In:] Boiler tube failure metallurgicalguide, Vol. 1, Techn. Rep.(TR-102433), Electric Power Research Institute, Palo Alto, CA, (1993), p. 26.[3] VISWANATHAN R., Damage mechanisms <strong>and</strong> life assessment <strong>of</strong> high temperature components, ASMInt., Metal Park, Ohio, (1989), p. 205.[4] PATRIARCA D., [In:] Topical conference on ferritic steels for use in nuclear technologies, Metall.Soc. AMIE, J.W. Davies, D.J. Michel (Eds.), (1984), p. 107.[5] THOMSON R.C., Bhadeshia H.K.D.H., Mater. Sci. Tech., 10 (1994), 193.[6] GOPE N., MUKHERJEE T., SARMA D.S., Mater. Trans. JIM, 33 (1992), 110.[7] SAROJA S., PARAMESWARAN P., VIJAYALAXMI M., RAGHUNATHAN V.S., Acta Metall. Mater.,43 (1995), 2985.[8] VISWANATHAN R., PATTERSON S.R., GRUNLOH H., GEHL S., J. Press. Vessel Techn., 116 (1994), 1.[9] CANE B.J., APLINE P.F., BREAR J.M., J. Press. Vessel Techn., 107 (1985), 295.[10] JAYAN V., MANDAL P.K., HIRANI M., SANYAL S.K., Mater. Sci. Techn., 15 (1999), 1308.[11] GANESAN V., RODRIGUEZ P., [In:] Materials aging <strong>and</strong> life management, B. Raj [Ed.], Proc. Int.Symp. Materials Ageing <strong>and</strong> Life Management, Kalpakkam, India, Allied Publishers Ltd., Chennai,(2000), p. 293.[12] JAYAN V., KHAN M.Y., HUSAIN M., Mater. Lett., 58 (2004), 2569.[13] FUJIAMA K., KIMURA K., MURAMATSU M., YAMADA M., ISIJ Int., 30 (1990), 869.[14] GOPE N., CHATTERJEE A., MUKHERJEE T., SARMA D.S., Metall. Trans. A, 24 (1993), 315.Received 20 March 2009Revised 23 April 2009
Materials Science-Pol<strong>and</strong>, Vol. 28, No. 1, 2010First-principles study <strong>of</strong> the elastic <strong>and</strong> mechanicalproperties <strong>of</strong> Ni 3 Al under high pressureS. BOUCETTA 1* , T. CHIHI 1 , B. GHEBOULI 2 , M. FATMI 31 Laboratoire d’Elaboration de Nouveaux Matériaux et Caractérisations (ENMC),Département de Physique, Université Ferhat Abbas, Sétif 19000, Algérie2 Laboratoire d’Etudes de Surfaces et Interfaces des Matériaux Solides (LESIMS),Département de Physique, Université Ferhat Abbas, Sétif 19000, Algérie3 Laboratoire de Physique et Mécanique des Matériaux Métalliques (LP3M),Département d’Optique et Mécanique de Précision, Université Ferhat Abbas, Sétif 19000, AlgérieA first-principles study <strong>of</strong> the structural <strong>and</strong> elastic properties <strong>of</strong> the intermetallic compound Ni 3 Alwas undertaken, exploiting density-functional theory <strong>and</strong> generalized gradient approximation (GGA). Theelastic constants C 11 , C 12 , <strong>and</strong> C 44 were shown to be sufficiently close to the density <strong>of</strong> the k-point mesh inthe deformed Brillouin zone to conclude that the elastic anisotropy <strong>of</strong> the coefficient A increases as thepressure increases. Young’s modulus <strong>of</strong> Ni 3 Al along {100} is approximately two times higher than thatalong {111}. The computed elastic constants from first principles satisfy C 11 > C 12 > C 44 , which are ingood agreement with the experiment data. The cubic Ni 3 Al possesses a bulk modulus <strong>of</strong> 312 GPa, comparableto that <strong>of</strong> cubic hafnium nitride. Theoretical calculations for Ni 3 Al show that all elastic moduliincrease monotonically as the pressure increases. These results suggest there are potential technologicalapplications <strong>of</strong> such materials in extreme environments.Keywords: intermetallics; structural properties; elastic properties1. IntroductionNi 3 Al, an intermetallic compound, is representative <strong>of</strong> a class <strong>of</strong> systems exhibitingunique mechanical properties which make them attractive for structural applications.Hence Ni 3 Al is a very promising material for high temperature <strong>and</strong> pressureapplications [1]. In an early theoretical study on the Ni 3 Al, Dobrina et al. [2] investigatedits electronic structure <strong>and</strong> elastic properties by using the ab initio density func-_________* Corresponding author, e-mail: boucetta_said02@yahoo.fr
348S. BOUCETTA et al.tional theory <strong>and</strong> the FLMTO method. Sot <strong>and</strong> Kurzydłowski [3] studied the elasticproperties <strong>of</strong> Ni 3 Al, using the ab initio calculations for lower pressures. Hsu [21] studiedelectronic absorption spectra <strong>of</strong> Ni 3 Al <strong>and</strong> Ni 3 Ga. Sob et al. [22] investigated themagnetism <strong>of</strong> Ni 3 Al <strong>and</strong> Fe 3 Al under extreme pressure <strong>and</strong> shape deformation from abinitio study. Hsu <strong>and</strong> Wang [23] investigated optical properties <strong>of</strong> Ni 3 Al, Ni 3 Ga <strong>and</strong>Ni 3 In. Guo et al. [24] studied the electronic structure, mechanical <strong>and</strong> magnetic properties<strong>of</strong> Ni 3 Al, Ni 3 Ga <strong>and</strong> Ni 3 In from the first-principles <strong>and</strong> experimental studies. Tothe best <strong>of</strong> our knowledge, no other theoretical studies on Ni 3 Al at high pressures havebeen reported.In this paper, we report first-principles calculations <strong>of</strong> total energy electronicstructure <strong>and</strong> the elastic constants <strong>of</strong> Ni 3 Al. The elastic constants C ij determine theresponse <strong>of</strong> the crystal to external forces, as characterised by the bulk modulus, shearmodulus, Young’s modulus, <strong>and</strong> Poisson’s ratio, playing an important role in determiningthe strength <strong>of</strong> a material. The elastic constants are the measure <strong>of</strong> the shear<strong>and</strong> tensile strength <strong>of</strong> crystals in the long-wavelength limit. They provide valuableinformation on the bonding characteristics between adjacent atomic planes <strong>and</strong> theanisotropic character <strong>of</strong> the bonding. Here, we report a theoretical study <strong>of</strong> the equation<strong>of</strong> state, elasticity <strong>and</strong> mechanical properties <strong>of</strong> the intermetallic compound Ni 3 Al.2. Computational methodThe use <strong>of</strong> computer simulation techniques is becoming more important in the underst<strong>and</strong>ing<strong>of</strong> the microscopic behaviour <strong>of</strong> materials. Our first-principles calculationsare performed with the plane-wave pseudo potential (PWPP) method implementedwith the CASTEP (Cambridge Serial Total Energy Package) simulationprogram [4]. This is based on the density functional theory (DFT) [5, 6] which is, inprinciple, an exact theory <strong>of</strong> the ground state. The generalized gradient approximation(GGA) method, proposed by Perdew <strong>and</strong> Wang, known as PW91 [7], is applied fordetermining the electronic exchange-correlation potential energy. The Coulomb potentialenergy caused by electron–ion interaction is described according to the ultras<strong>of</strong>tscheme [8], in which the orbitals <strong>of</strong> Ni (3d 8 4s 2 ) <strong>and</strong> Al (3s 2 p 1 ), are treated as valenceelectrons. By the norm-conservation condition, the pseudo-wave function related topseudopotential matches the plane wave function exp<strong>and</strong>ed with Kohn–Sham formationbeyond the cut-<strong>of</strong>f energy. Using high cut-<strong>of</strong>f (660 eV) energy, accurate resultscan be obtained at the expense <strong>of</strong> long computational time. The cut-<strong>of</strong>f energy for theplane wave expansion is 330 eV <strong>and</strong> the Brillouin zone sampling was carried out usingan 8×8×8 set <strong>of</strong> the Monkhorst–Pack mesh [9].The structural parameter a 0 <strong>of</strong> Ni 3 Al was determined using the Broyden–Fletcher–Goldfarb–Shenno (BFGS) minimization technique. Therefore, the present parametersare sufficient to obtain well converged total energy <strong>and</strong> geometrical configurations.
Elastic <strong>and</strong> mechanical properties <strong>of</strong> Ni 3 Al under high pressure 3493. Numerical results <strong>and</strong> discussion3.1. Structural propertiesThe Ni 3 Al is known to crystallize in a cubic lattice <strong>of</strong> Cu 3 Au structure type withthe space group Pm3 m,<strong>and</strong> the equilibrium lattice parameter is 3.572 Å [10–12]. Twoinequivalent atomic sites, the aluminium atom is positioned at (0,0,0) <strong>and</strong> the nickelatoms at (1/2,1/2,0), (1/2,0,1/2) <strong>and</strong> (0,1/2,1/2) (Fig. 1).Fig. 1. The cubic structure <strong>of</strong> Ni 3 AlTable 1. Calculated <strong>and</strong> experimental values <strong>of</strong> the equilibrium lattice constanta 0 [Å], bulk modulus B 0 [GPa] <strong>and</strong> bulk derivative in cubic Ni 3 Al compound.a 0 B 0 [GPa] B' 0 Source3.558 130.13 8.67 This work3.572 a3.56 b 171 b Experiment3.588 a3.48 b 234 b Othera Ref. [3].b Ref. [2].The lattice parameter <strong>of</strong> Ni 3 Al calculated using the (PP-PW) method is given inTable 1, along with the available experimental <strong>and</strong> theoretical data. Our calculatedequilibrium lattice parameter a 0 is in a good agreement with the experimental data.The calculated lattice constant a 0 is only 0.4% smaller than the experimental value.The calculated unit cell volume at an applied hydrostatic pressure in the range from0 to 30 GPa were used to construct the equation <strong>of</strong> state (EOS), which was fitted tothe third order Birch–Murnagham equation [13] (Fig. 2):
350S. BOUCETTA et al.−7/3 −5/3 −2/33 ⎛⎛V ⎞ ⎛V ⎞ ⎞⎛3 ⎛⎛V⎞ ⎞⎞P= B 0 ⎜ ⎟ − ⎜ ⎟ ⎜1+ ( B′−4)⎜ ⎟ −1⎟2 ⎜⎝V0 ⎠ ⎝V ⎟0 ⎠ ⎜ 4 ⎜⎝V⎟0 ⎠ ⎟⎝ ⎠⎝⎝ ⎠⎠With V 0 fixed at the value determined from the zero pressure data, we obtained byleast-squares fitting the bulk modulus B 0 <strong>and</strong> its pressure derivative B′ 0under zeropressure. These are listed in Table 1. We can see that the calculated value <strong>of</strong> the bulkmodulus B 0 from the elastic constants B 0 = (C 11 +2C 12 )/3 has nearly the same value asthe one obtained from the EOS fitting. This might be an estimate <strong>of</strong> the reliability <strong>and</strong>accuracy <strong>of</strong> our calculated elastic constants for Ni 3 Al.Fig. 2. Dependence <strong>of</strong> the calculated pressure on the normalized volume for Ni 3 Al; the solid lineis the plot <strong>of</strong> the Birch–Murnaghan equation <strong>of</strong> state with the parameters listed in Table 13.2. Elastic propertiesThe elastic constants are important parameters describing the response to an appliedmacroscopic stress. In Table 2, the calculated elastic constants <strong>and</strong> shearmodulus <strong>of</strong> Ni 3 Al under zero pressure are presented. We next study the pressure dependence<strong>of</strong> the elastic properties. In Figure 3, we present the variation <strong>of</strong> the elasticconstants (C 11 , C 12 <strong>and</strong> C 44 ) <strong>and</strong> the bulk modulus B <strong>of</strong> Ni 3 Al with respect to the variation<strong>of</strong> pressure. We observe a linear dependence in all curves in the considered range<strong>of</strong> pressure. It is easy to observe that the elastic constants C ij <strong>and</strong> the bulk modulus Bincrease when the pressure is enhanced in this compound.For a cubic crystal under a pressure P, the generalized elastic stability criteria[14, 15] are:K = C + 2C + P> 0, K = C − P> 0, K = C −C − 2P>011 12 1 44 2 11 12
Elastic <strong>and</strong> mechanical properties <strong>of</strong> Ni 3 Al under high pressure 351Fig. 3. Calculated pressure derivatives <strong>of</strong> the elastic constantsC 11 , C 12 <strong>and</strong> C 44 <strong>and</strong> the bulk modulus B 0 for Ni 3 AlTable 2. Calculated <strong>and</strong> experimental values <strong>of</strong> the elastic constants C ij [GPa],shear moduli G [GPa], anisotropy factor A, Young’s modulus E <strong>and</strong> Poisson’s ratio ν in cubic Ni 3 AlC 11 C 12 C 44 G A E ν Source228.4 160.41 123.75 34 3.64 96.04 0.41 This work230 a 150 a 131 a221 b 146 b 124 b – 3.31 b – 0.40 b Experiment230 a 139 a 123 a278 b 212 b 186 b – 5.64 b – 0.43 b Othera Ref. [3].b Ref. [2].Fig. 4. Pressure dependences <strong>of</strong> the stability criteria
352S. BOUCETTA et al.The obtained results are shown in Fig. 4. These criteria are satisfied in the studiedpressure range. From our calculated C ij , it is known that this compound is mechanicallystable.3.3. Mechanical propertiesFrom the theoretical elastic constants, we computed the elastic wave velocities.The single crystal elastic wave velocities in different directions are given by the resolution<strong>of</strong> the Crist<strong>of</strong>fel equation [16]:2( − ρ δ )C n n v uijkl j k il lwhere C ijkl is the single crystal elastic constant tensor, n is the propagation direction,ρ is the density <strong>of</strong> material, u is the wave polarisation <strong>and</strong> ν is the wave velocity. Thesolutions <strong>of</strong> this equation are <strong>of</strong> two types: a longitudinal wave with polarisation parallelto the direction <strong>of</strong> propagation v l <strong>and</strong> two shear waves v T1 <strong>and</strong> v T2 with polarisationsperpendicular to n. Another important parameter is the elastic anisotropy factor, A,which gives a measure <strong>of</strong> the anisotropy <strong>of</strong> the elastic wave velocity in a crystal. In acubic crystal, the elastic anisotropy factor is given by [17]:A2C+ C44 12= −C11which is zero for an isotropic material. The plot <strong>of</strong> the elastic anisotropy factor isshown in Fig. 5.1Fig. 5. Pressure dependence <strong>of</strong> the elastic anisotropy
Elastic <strong>and</strong> mechanical properties <strong>of</strong> Ni 3 Al under high pressure 353The calculated elastic wave velocities along the [100], [110] <strong>and</strong> [111] directionsfor Ni 3 Al under zero pressure are given in Table 3. Under zero pressure, longitudinalwaves propagate faster along [111] <strong>and</strong> shear waves are slowest along [110] for Ni 3 Al,which has a positive elastic anisotropy factor.Table 3. The elastic wave velocities [m·s –1 ] for different propagation directions for Ni 3 AlDirection100v L100v T1100v T 2110v L110v T1110v T 2111v L111v T1111v T 2Value 5733.18 4215.78 4215.78 6819.54 2211.83 4220.04 7077.49 3032.77 3032.77Once the elastic constants are determined, we compare our results with experimentaldata, or predict what the elastic constants should be for a given experiment. Forcubic systems, the isotropic bulk modulus B is given exactly by:CB =+ 2C311 12The bounds on the shear modulus are given by:GR( )( )5 C C − C 3,C − C += G =C4C 3 C C544 11 12 11 12 44V44+11−12We also calculated Young’s modulus E <strong>and</strong> Poisson’s ratio ν which are frequentlymeasured for polycrystalline materials when investigating their hardness.These quantities relate to the bulk modulus <strong>and</strong> the shear modulus by the followingequations [18]:9 BG 3,B −E = v=E3B + G 6BThe shear moduli G R <strong>and</strong> G V , Young’s modulus E <strong>and</strong> Poisson’s ratio ν for Ni 3 Alcalculated from the elastic constants are listed in Table 2.3.4. Calculation <strong>of</strong> the Debye temperatureHaving calculated Young’s modulus E, the bulk modulus B <strong>and</strong> the shear modulus G,we can calculate the Debye temperature, which is an important fundamental parameterclosely related to many physical properties such as elastic constants, the specific heat<strong>and</strong> the melting temperature. At low temperatures, the vibrational excitation arisessolely from acoustic mode. Hence, at low temperatures, the Debye temperature calculatedfrom the elastic constants is the same as that determined from specific heatmeasurements. One <strong>of</strong> the st<strong>and</strong>ard methods to calculate the Debye temperature θ D is
354S. BOUCETTA et al.based on the elastic data, since θ D may be estimated from the average sound velocityv m by the following equation [19]:h ⎛ 3n⎞θD= ⎜ ⎟kB⎝4πVa⎠where h is Planck’s constant, k B Boltzmann’s constant <strong>and</strong> V a the atomic volume. Theaverage sound velocity in the polycrystalline material is given by [20]:vm1/3⎛1⎛2 1 ⎞⎞= +⎜⎜ 2 3 ⎟3 vlv ⎟⎝ ⎝ t ⎠⎠where v l <strong>and</strong> v t are the longitudinal <strong>and</strong> transverse sound velocities <strong>of</strong> an isotropic aggregateobtained using the shear modulus G <strong>and</strong> the bulk modulus B from Navier’sequation [18]:vm−1/3vl1/2 1/2⎛3 B + 4 G ⎞ ⎛<strong>and</strong> vG ⎞= ⎜ ⎟ t= ⎜ ⎟⎝ 3ρ⎠ ⎝ ρ ⎠The calculated sound velocity <strong>and</strong> Debye temperature as well as the density forNi 3 Al are given in Table 4.Table 4. The calculated density ρ, the longitudinal, transverse <strong>and</strong> average sound velocityv l , v l <strong>and</strong> v m calculated from polycrystalline elastic modulus, <strong>and</strong> the Debye temperatures θ Dcalculated from the average sound velocity for Ni 3 AlParameter ρ [g cm –3 ] ν l [m·s –1 ] ν t [m·s –1 ] ν m [m·s –1 ] Θ D [K]Value 6.94882 6712.24 3590.82 4010.63 516.844. ConclusionIn this paper, the elastic <strong>and</strong> mechanical properties <strong>of</strong> the Ni 3 Al intermetalliccompound have been studied based on density functional theory (DFT), <strong>and</strong> the generalisedgradient approximation (GGA) method. It has been shown that the equilibriumlattice parameter <strong>of</strong> the Ni 3 Al compound is in excellent agreement with theavailable experimental data. It has also been shown that the elastic constants <strong>of</strong>Ni 3 Al compound, obtained from the calculations, satisfy the criterion <strong>of</strong> mechanicalstability in a cubic structure under an applied pressure. The computed results for thebulk <strong>and</strong> shear moduli suggest that the hardness <strong>of</strong> this material increases upon increasingpressure.
Elastic <strong>and</strong> mechanical properties <strong>of</strong> Ni 3 Al under high pressure 355AcknowledgementsPr<strong>of</strong>essor L. Louail is acknowledged for providing the CASTEP s<strong>of</strong>tware used to perform this calculations.This work is supported by the ENMC Laboratory, University <strong>of</strong> Setif.References[1] LAKHTINE I., Métallographie et Traitement Thermiques des Métaux, Mir, Moscow, 1982 (in French).[2] DOBRINA I., KIOUSSIS N., SAY PENG LIM, Phys. Rev. B, 54 (1996), 14413.[3] SOT R., KURZYDŁOWSKI K.J., Mater. Sci.-Pol<strong>and</strong>, 23 (2005), 587.[4] SEGALL M.D., LINDAN P.J.D., PROBERT M.J., PICKARD C.J., HASNIP P.J., CLARK S.J., PAYNE M.C.,J. Phys. Cond. Matter., 14 (2002), 2717.[5] HOHENBERG P., KOHN W., Phys. Rev. B, 136 (1964), 864.[6] KOHN W., SHAM L.J., Phys. Rev. A, 140 (1965), 113.[7] PERDEW J.P., CHEVARY J.A., VOSKO S.H., JACKSON K.A., PEDERSON M.R., SINGH D.J., FIOLHAIS C.,Phys. Rev. B, 46 (1992), 6671.[8] VANDERBILT D., Phys. Rev. B, 41 (1990), 7892.[9] MONKHORST H.J., PACK J.D., Phys. Rev. B, 13 (1976), 5188.[10] ICDD 09-0097, J. Met., 9 (1957), 865.[11] SIMMONS G., WANG H., Single Crystal Elastic Constants <strong>and</strong> Calculated Aggregate Properties:A H<strong>and</strong>book, MIT Press, Cambridge, MA, 1971.[12] Smithells, Metals Reference Book, 6th Ed. E.A. Br<strong>and</strong>es (Ed.), Butterworths, London, 1983.[13] BIRCH F., J. Geophys. Res., 83 (1978), 1257.[14] YIP S., LI J., TANG M., WANG J., Mater. Sci. Eng. A, 317 (2001), 236.[15] SINKO G.V., SMIMOV A., J. Phys. Cond. Matter., 14 (2002), 6989.[16] KARKI B.B., STIXRUDE L., CLARK S.J., WARREN M.C., ACKLAND G.J., GRAIN J., J. Am. Mineral. Soc.,(1997), 8251.[17] BOUHEMADOU A., Model. Sim. Mater. Sci. Eng., 16 (2008), 055007.[18] SCHREIBER E., ANDERSON O.L., SOGA N., Elastic Constants <strong>and</strong> their Measurements, McGraw-Hill,New York, 1973.[19] WACHTER P., FILZMOSER M., REBISANT J., J. Phys. B, 293 (2001), 199.[20] ANDERSON O.L., J. Phys. Chem. Solids, 24 (1963), 909.[21] HSU L.-S., WANG Y.-K., TAI Y.L., LEE J.F., J. Alloys Compd., 413 (2006), 11.[22] SOB M., LEGUT D., FRIAK M., FIALA J., J. Magn. Magn. Mater., 272 (2004), E205.[23] HSU L.-S., WANG Y.-K., J. Alloys Compd., 377 (2004), 29.[24] GUO G.Y., WANG Y.-K., HSU L.-S., J. Magn. Magn. Mater., 239 (2002), 91.Received 13 May 2009Revised 23 June 2009
Materials Science-Pol<strong>and</strong>, Vol. 28, No. 1, 2010Density functional study <strong>of</strong> Mg 2 FeH 6 complex hydrideJ. ZHANG 1* , Y.N. HUANG 2 , C.G. LONG 2 , D.W. ZHOU 2 , J.S. LIU 21 Institute <strong>of</strong> Automobile <strong>and</strong> Mechanical Engineering,Changsha University <strong>of</strong> Science <strong>and</strong> Technology, Changsha 410114, China2 College <strong>of</strong> Materials Science <strong>and</strong> Engineering, Hunan University, Changsha 410082, China3 State Key Laboratory <strong>of</strong> Advanced Design <strong>and</strong> Manufacturing for Vehicle Body,Hunan University, Changsha 410082, ChinaMg 2 FeH 6 , which has the highest volumetric hydrogen density, is considered a promising hydrogenstorage material. Within the framework <strong>of</strong> the density functional theory, the crystal structure, physicalproperties, electronic structure <strong>and</strong> formation capacity <strong>of</strong> Mg 2 FeH 6 complex hydride have been investigated.The optimized structural parameters correspond closely with the experimental data from X-ray <strong>and</strong>neutron powder diffraction measurements. A detailed study <strong>of</strong> the electronic structures, including theenergy b<strong>and</strong>, density <strong>of</strong> states (DOS) <strong>and</strong> charge density distribution, reveals the orbital hybridization <strong>and</strong>bonding characteristics within this hydride. It was shown that Mg 2 FeH 6 is a semiconductor with the energygap <strong>of</strong> ca. 2.3347 eV, <strong>and</strong> that a mixed ionic-covalent bond between Fe <strong>and</strong> H in FeH 6 complexes isembedded in the matrix <strong>of</strong> Mg 2+ cations. The calculated formation enthalpies <strong>of</strong> Mg 2 FeH 6 , based on thepossible synthesis routes, indicate that optimum conditions are achieved if this hydride is fabricated frompure elements, <strong>and</strong> that the preparation <strong>of</strong> other compounds would lead to inferior synthesis.Keywords: hydrogen storage materials; density functional theory; electronic structure; enthalpy <strong>of</strong> formation1. IntroductionWith the growing pressure <strong>of</strong> energy shortage <strong>and</strong> environmental contamination,a common issue becomes to develop sustainable <strong>and</strong> clean energy sources. Hydrogenhas been viewed as a highly appealing energy carrier for renewable energy because <strong>of</strong>its abundance <strong>and</strong> environmental friendliness. In the exploitation <strong>of</strong> hydrogen energy,hydrogen storage is one <strong>of</strong> the key challenges influencing the success <strong>of</strong> the hydrogeneconomy. Great efforts have been made to develop advanced hydrogen storage tech-_________* Corresponding author, e-mail: zj4343@163.com
358J. ZHANG et al.nology, <strong>and</strong> the solid state materials that chemically bind or physically adsorb hydrogenat volume densities higher than that <strong>of</strong> gas <strong>and</strong> liquid hydrogen are proved to bethe most promising way <strong>of</strong> storing hydrogen. Mg <strong>and</strong> Mg based alloys have receivedgreat interest because <strong>of</strong> their high hydrogen volumetric-gravimetric capacity, lightweight <strong>and</strong> low cost. However, a slow sorption kinetics <strong>and</strong> high dissociation temperaturehamper their practical applications. Up to now, considerable research has beenundertaken to identify a suitable material that absorbs hydrogen close to room temperature<strong>and</strong> desorbs it at temperatures low enough to use the waste heat <strong>of</strong> exhaustgas [1–3].Complex hydrides are considered to be the most useful <strong>of</strong> all known hydrogenstorage materials because they exhibit mixed ionic-covalent bonding between metal<strong>and</strong> the hydrogen complex, thereby making them adaptable <strong>and</strong> suitable for facilitatingthe hydrogenation/dehydrogenation process [4–6]. In particular, this makes them suitablefor the storage <strong>of</strong> renewable fuel, which is used in both power cells as well ascombustion engines. The ternary Mg 2 FeH 6 hydride shows the highest volumetric hydrogendensity, <strong>of</strong> 150 kg H 2·m –3 , among all the known transition metal complex hydrides<strong>and</strong> has a high gravimetric hydrogen density <strong>of</strong> 5.47 wt. %. Furthermore, thishydride is based on an inexpensive metallic element, Mg, <strong>and</strong> Fe, <strong>and</strong> its commercialprice should be much lower than that <strong>of</strong> other complex hydrides, which makes it moreappealing. However, this ternary hydride has the particularity that Mg <strong>and</strong> Fe do notform stable binary compounds themselves [7]. Therefore, the synthesis <strong>and</strong> study <strong>of</strong>Mg 2 FeH 6 becomes difficult to carry out. Several investigations regarding Mg 2 FeH 6have been mainly focused on enhancing the hydride yield by adopting different preparationroutes [8–12]. In order to improve effectively the performance <strong>of</strong> Mg 2 FeH 6involved in reversible hydrogenation/dehydrogenation processes for practical applications,beginning with an underst<strong>and</strong>ing <strong>of</strong> the fundamental physical properties <strong>of</strong> thiscomplex hydride, is <strong>of</strong> key importance <strong>and</strong> great interest. Theoretical investigationsinto complex metal hydrides including calculations from first principles have beenvery common in recent years [13–15]. However, few studies on Mg 2 FeH 6 asa potential hydrogen storage material have been reported. In the present work, firstprinciple calculations based on density functional theory are conducted in a comprehensivestudy <strong>of</strong> the structural <strong>and</strong> electronic properties, as well as the formation ability,<strong>of</strong> Mg 2 FeH 6 complex hydride. The results are expected to provide theoretical guidancefor designing <strong>and</strong> improving this potential hydrogen storage material.2. Models <strong>and</strong> method <strong>of</strong> calculationsX-ray <strong>and</strong> neutron powder diffraction experimental analysis showed that Mg 2 FeH 6has a K 2 PtCl 6 type structure, as shown in Fig. 1a [8]. Its unit cell has the cubic symmetry,space group Fm3m (No. 225), <strong>and</strong> 36 atoms with the lattice constant a = 6.443 Å.Mg, Fe <strong>and</strong> H atoms occupy the 8c, 4a <strong>and</strong> 24e sites in the crystal, respectively. The
Density functional study <strong>of</strong> Mg 2 FeH 6 complex hydride 359atomic coordinates in the unit cell are: Mg (8c) – (0.25, 0.25, 0.25); Fe (4a) – (0, 0, 0);H (24e): (x, 0, 0), x ≈ 0.24.Figure 1b presents the cluster model <strong>of</strong> Mg 2 FeH 6 . It is an octahedral FeH 6 complex,surrounded by 8 Mg atoms in a cubic configuration. These complexes are arrangedon an fcc lattice such that each Mg atom is tetrahedrally surrounded by 4 FeH 6complexes <strong>and</strong> has 12 H atoms as the nearest neighbours. The metal–hydrogen bonddistances are d(Fe–H) = 1.556 Å <strong>and</strong> d(Mg–H) = 2.2739 Å, respectively. The shortestseparations between the hydrogen atoms within (intra) <strong>and</strong> between (inter) the FeH 6complexes are d intra (H–H) = 2.201 Å <strong>and</strong> d inter (H–H) = 2.346 Å, respectively. Theprimitive cell <strong>of</strong> Mg 2 FeH 6 is used in the calculations as shown in Fig. 1c. It has 9 atoms,comprising 2 Mg atoms, 1 Fe atom <strong>and</strong> 6 H atoms.Fig. 1. Models <strong>of</strong>: a) a crystal cell, b) a cluster, c) primitive cell <strong>of</strong> Mg 2 FeH 6In the present work, the structural optimization <strong>and</strong> total energy calculations areperformed with the DMol 3 package [16-18] which is based on the density functionaltheory (DFT) [19, 20], <strong>and</strong> the Perdew–Burke–Eruzerh<strong>of</strong> (PBE) exchange-correlationfunctional [21] is adopted for generalized gradient approximation (GGA) correction.All electron Kohn–Sham wave functions are exp<strong>and</strong>ed in a double numerical basiswith a polarized orbital (DNP). The cell parameters, including lattice constants, <strong>and</strong>the atomic positions in the structure are fully relaxed to get the final structure withminimum total energy. The convergences criteria <strong>of</strong> optimization are 2.721×10 –4 eV,0.054eV/ Å <strong>and</strong> 0.005 Å for energy, gradient <strong>and</strong> atomic displacement, respectively.3. Results <strong>and</strong> discussions3.1. Parameters <strong>of</strong> crystal structure <strong>and</strong> physical propertiesTo assess the accuracy <strong>of</strong> the computational method, a series <strong>of</strong> preliminary calculationson crystal structure parameters <strong>and</strong> physical properties were performed on therelated solids, such as hcp-Mg, bcc-Fe, rutile type α-MgH 2 , <strong>and</strong> H 2 molecule. Thecorresponding results are listed in Table 1. It was found that their equilibrium latticeconstants, atomic positions, interatomic distances <strong>and</strong> cohesive energies are all ingood agreement with the experimental data. For example, the lattice constants a, c <strong>and</strong>
360J. ZHANG et al.the c/a ratio <strong>of</strong> hcp-Mg are 3.1715 Å, 5.1504 Å <strong>and</strong> 1.6240, respectively, which are closeto the experimental values [22] <strong>of</strong> a = 3.21 Å, c = 5.21 <strong>and</strong> c/a = 1.623, <strong>and</strong> the error <strong>of</strong> c/aratio, calculated here relative to the experimental result, is about 0.06%. The calculatedcohesive energy E coh = 1.4942 eV/atom <strong>of</strong> hcp-Mg, which is close to the experimentalvalue [22] <strong>of</strong> E coh = 1.51 eV/atom, <strong>and</strong> the error <strong>of</strong> cohesive energy, calculated hererelative to the experimental result, is about 1.05%. The lattice constant <strong>of</strong> bcc-Fe is2.8619 Å, which is close to the experimental value [22] <strong>of</strong> a = 2.87 Å, <strong>and</strong> the error <strong>of</strong>the lattice constant calculated here relative to the experimental result, is about 0.28%.Table 1. The equilibrium lattice constants a <strong>and</strong> c [Å], cohesive energy E coh[eV/formula unit], bulk modulus B 0 [GPa], atomic positions <strong>and</strong> interatomic distance d [Å]for hcp-Mg, bcc-Fe, rutile type α-MgH 2 , <strong>and</strong> H 2 moleculeMg 2 FeH 6Material Property This work Experimental Referencea 3.1751 3.21hcp-Mgc 5.1504 5.21E coh 1.4942 1.51[22]B 0 32.4579 35.4a 2.8619 2.87bcc-FeE coh 5.4088 4.28[22]B 0 248.3762 168.3d(H–H) 0.7490 0.741H 2E coh 4.5502 4.74[23]α-MgH 2 E coh 6.6185 -a 4..5124 4.501 [24]c 3.0240 3.010B 0 47.7486 51 [25]u H 0.3040 0.304y 0 0z 0 0[8]a 6.3977 6.443E coh 24.9536 -B 0 77.1010 -Mg(8c)x 0.2501 0.25y 0.2500 0.25z 0.2484 0.25Fe(4a)x 0 0H(24e)x 0.2456 0.24y 0 0z 0 0d (Mg-H) 2.2667 2.2739d (Mg-Fe) 2.7717 –d (Fe-H) 1.5720 1.5560d intra (H-H) 2.2165 2.2010d inter (H-H) 2.3178 2.3460
Density functional study <strong>of</strong> Mg 2 FeH 6 complex hydride 361The bond length <strong>of</strong> a free H 2 molecule is 0.7490 Å, which is close to the experimentalvalue [23] <strong>of</strong> d H–H = 0.741 Å, <strong>and</strong> the error <strong>of</strong> the bond length, calculated here relatedto the experimental result, is about 1.08%. The lattice constants a, c <strong>and</strong> c/a ratio <strong>of</strong>α-MgH 2 are 4.5124 Å, 3.0240 Å <strong>and</strong> 0.6702, respectively, which are close to the experimentalvalues [24, 25] <strong>of</strong> a = 4.501 Å, c = 3.010 Å <strong>and</strong> c/a = 0.6687, the error <strong>of</strong>the c/a ratio, calculated here related to the experimental result, being about 0.22%.Evidently, a good agreement exists between the predictions based on calculations <strong>and</strong>experimental values. Although the calculated bulk moduli <strong>of</strong> solids such as Fe havelarger errors relative to the experimental results [22], they are sufficiently acceptablefor the purpose <strong>of</strong> the verifying calculations.Next, the lattice constants, atomic positions <strong>and</strong> interatomic distances <strong>of</strong> Mg 2 FeH 6primitive cell are estimated from the minimized total energy. The final results are alsolisted in Table 1. It is found that the optimized structure <strong>of</strong> a Mg 2 FeH 6 primitive cellmaintains Fm3m symmetry, which is in good agreement with the experimental structurerevealed by X-ray <strong>and</strong> neutron powder diffraction data [8]. The lattice constant <strong>of</strong>Mg 2 FeH 6 is 6.3977 Å (the value is obtained by conversion <strong>of</strong> the lattice constant4.5311 Å <strong>of</strong> the Mg 2 FeH 6 primitive cell), which is close to the experimental value [8]<strong>of</strong> a = 6.443 Å, <strong>and</strong> the error <strong>of</strong> the lattice constant, calculated here with respect to theexperimental result, is about 0.70%. The present positions <strong>of</strong> Mg, Fe, H atoms as wellas interatomic distances in the Mg 2 FeH 6 primitive cell are also in good agreement withthe experimental results [8]. In particular, the hydrogen positions in Mg 2 FeH 6 are preciselydetermined as to be (0.2456, 0, 0), which are very close to the deuterium positions(0.2420, 0, 0) in Mg 2 FeD 6 obtained in the neutron diffraction measurement [8].In addition, we also present the cohesive energy E coh <strong>and</strong> bulk modulus B 0 <strong>of</strong>Mg 2 FeH 6 , <strong>and</strong> they are 24.9536eV per formula unit <strong>and</strong> 77.1010 GPa, respectively.Since no experimental values <strong>of</strong> E coh <strong>and</strong> B 0 <strong>of</strong> Mg 2 FeH 6 are available, no comparisonscan be made with either <strong>of</strong> their theoretically computed values. However, the results<strong>of</strong> this paper are expected to be useful as a reference for future investigations into thiscomplex hydride.3.2. Electronic structureThe energy b<strong>and</strong> structure <strong>and</strong> electronic density <strong>of</strong> states (DOS) <strong>of</strong> Mg 2 FeH 6 arecalculated <strong>and</strong> shown in Figs. 2, 3, respectively. Both <strong>of</strong> these figures exhibit an energygap <strong>of</strong> about 2.3347 eV between valence <strong>and</strong> conduction b<strong>and</strong>s, indicating thatMg 2 FeH 6 hydride exhibits a semiconducting behaviour. The eight valence b<strong>and</strong>s inFig. 2 have a width <strong>of</strong> about 9.2519eV. From these figures it can be seen that the firstvalence b<strong>and</strong> in the low energy range between –9.2519 <strong>and</strong> –6.1226eV mainly originatesfrom the contribution <strong>of</strong> H(s), a few Mg(s) <strong>and</strong> a few Fe(s) orbitals, while thenext seven interlapping valence b<strong>and</strong>s in the higher energy range between –5.4423 <strong>and</strong>0 eV are mainly from H(s) , Fe(p) <strong>and</strong> Fe (d) states. This suggests that there is a stronghybridization between H <strong>and</strong> Fe orbitals, while there is a weak one between H <strong>and</strong> Mg
362J. ZHANG et al.orbitals. The conduction b<strong>and</strong>s are mainly from Mg (<strong>and</strong> to lesser extent Fe <strong>and</strong> H)empty states. Mg has hardly any projection in the occupied states, as is shown inFig. 3, indicating that each Mg donates two electrons to the FeH 6 complex [13]. Basedon the analysis, it can be concluded that significant charge transfer leads to the formation<strong>of</strong> Mg 2+ ions <strong>and</strong> a negatively charged FeH 6 complex, which constitutes the ionicbonding between them. At the same time, there exists a strong covalent bonding interactionbetween hydrogen <strong>and</strong> iron within the FeH 6 complex. The covalent bondingplays a comparatively more dominant role than ionic bonding in this complex hydride.Fig. 2. Energy b<strong>and</strong> structure <strong>of</strong> Mg 2 FeH 6Fig. 3. Total <strong>and</strong> partial densities <strong>of</strong> states <strong>of</strong> Mg 2 FeH 6
Density functional study <strong>of</strong> Mg 2 FeH 6 complex hydride 363Further analysis <strong>of</strong> the charge distribution <strong>of</strong> Mg 2 FeH 6 <strong>and</strong> the charge transfer inthe FeH 6 complexes is performed. The total charge density ρ (r) <strong>and</strong> the difference chargedensity Δρ (r) in the plane containing Mg, Fe, H atoms are shown in Figs. 4a, b. The differencecharge density Δρ (r) [26] is defined as the difference between the total chargedensity <strong>of</strong> the solid <strong>and</strong> a superposition <strong>of</strong> atomic charge densities with the same spatialcoordinates as in the solid. In Figure 4a, the total charge density plot shows thatthere is a strong bond between Fe <strong>and</strong> H atoms in FeH 6 complexes, while weak bondinginteractions exist between Mg <strong>and</strong> FeH 6 complexes. The electron density is highestin the vicinity <strong>of</strong> FeH 6 complexes, which are consistent with the analytical resultsobtained from electronic density <strong>of</strong> states (DOS).a) b)Fig. 4. Total (a) <strong>and</strong> difference (b) charge density plots <strong>of</strong> Mg 2 FeH 6 in the (110) planeFrom the difference density plot shown in Fig. 4b, it can be seen that there is significantcharge transfer, leading to positively charged Mg <strong>and</strong> negatively chargedFeH 6 complexes. For FeH 6 complexes, it was found that there is partial charge transferfrom Fe to H, indicating that, besides the covalent bonding, there is also a weak ionicbonding interaction between Fe <strong>and</strong> H in FeH 6 complexes. These features are highlyconducive to mixed ionic-covalent bonding between Fe <strong>and</strong> H in FeH 6 complexesembedded in the matrix <strong>of</strong> Mg 2+ cations.3.3. Enthalpy <strong>of</strong> formationThe enthalpy <strong>of</strong> formation is the most important thermodynamic parameter used toidentify <strong>and</strong> classify hydrogen storage materials, since it determines the heat <strong>of</strong> theoverall hydriding reaction, which, in turn, affects the temperatures <strong>of</strong> the reversiblehydrogenation/dehydrogenation processes. It is the best aid to establish whether theoreticallypredicted phases are likely to be stable, <strong>and</strong> also such data may serve asguides for possible synthesis routes <strong>of</strong> materials. Commonly, the enthalpy <strong>of</strong> formationis negative, <strong>and</strong> the lower the enthalpy <strong>of</strong> formation, the greater the phase stability<strong>and</strong> the easier the synthesis <strong>of</strong> the material is [27]. As far as Mg 2 FeH 6 is concerned,due to the absence <strong>of</strong> the binary Mg 2 Fe compound, the synthesis <strong>of</strong> this complex hydridebecomes very difficult. Experimentally, Mg 2 FeH 6 are usually fabricated by ball
364J. ZHANG et al.milling pure elements such as Mg <strong>and</strong> Fe or ball milling <strong>of</strong> other mixtures such asMgH 2 <strong>and</strong> Fe in an hydrogen atmosphere. In order to investigate the formation ability<strong>of</strong> Mg 2 FeH 6 under various conditions <strong>of</strong> syntheses, it is necessary to calculate the enthalpy<strong>of</strong> formation. In the present work, three possible synthesis routes are consideredas follows [8, 13]:2MgH 2 + Fe + H 2 → Mg 2 FeH 6 (1)Mg + MgH 2 + Fe + 2H 2 → Mg 2 FeH 6 (2)2Mg + Fe + 3H 2 → Mg 2 FeH 6 (3)The corresponding enthalpy <strong>of</strong> formation (ΔH) is calculated according to the followingexpressions [28]:1Δ H1 = ( Etot(Mg2FeH 6) −2 Etot(MgH 2) −Etot(Fe bcc) − Etot(H 2)) (4)31Δ H2 = ( Etot (Mg2FeH 6) −Etot (Mghcp) −Etot (MgH2) −Etot (Febcc) − 2 Etot (H2)) (5)31Δ H3 = ( Etot (Mg2FeH 6) −2 Etot (Mghcp) −Etot (Febcc) − 3 Etot (H2)) (6)3Here E tot (Mg 2 FeH 6 ) refers to the total energy <strong>of</strong> the Mg 2 FeH 6 primitive cell at the equilibriumlattice constant, E tot (Mg hcp ), E tot (Fe bcc ), E tot (MgH 2 ) are the single atomic energies <strong>of</strong>hcp-Mg, bcc-Fe in the solid states <strong>and</strong> α-MgH 2 in the primitive cell, respectively, <strong>and</strong>E tot (H 2 ) refers to the total energy <strong>of</strong> the gaseous H 2 molecule. In this paper, we calculatethe single atomic energy <strong>of</strong> hcp-Mg <strong>and</strong> fcc-Fe by the following method: firstly, the energy<strong>of</strong> a pure metal crystal in the solid state is calculated, then the energy is divided by thenumber <strong>of</strong> atoms belonging to the crystal, <strong>and</strong> the result from the above calculation is justthe energy <strong>of</strong> a single atom in the pure metal. The calculated values <strong>of</strong> E tot (Mg 2 FeH 6 ),E tot (Mg hcp ), E tot (Fe bcc ), E tot (MgH 2 ) <strong>and</strong> E tot (H 2 ) are –45368.3726eV, –5442.5222eV,–34385.1223eV, –5474.8548eV <strong>and</strong> –31.6795eV, respectively. From Eqs. (1)–(3), theformation enthalpies <strong>of</strong> Mg 2 FeH 6 based on various synthesis routes are estimated as ΔH 1= –0.6204eV per H 2 molecule (i.e., –59.8200kJ/mol H 2 ), ΔH 2 = –0.8381eV per H 2 molecule(i.e., –80.9065kJ/mol H 2 ), ΔH 3 = –1.0558eV per H 2 molecule (i.e., –101.9929kJ/mol H 2 ). The calculated formation enthalpies are all negative, which indicatesthat these reactions are favourable from the thermodynamic point <strong>of</strong> view. By furthercomparing the values <strong>of</strong> ΔH, it is obvious that the route having the lowest reactionenergy is the one that starts with pure elements. Hence, for the three considered synthesisroutes, reaction (3) is clearly the optimum one. However, it should be noted thatthe kinetic aspects <strong>of</strong> these reaction pathways are not considered in the present calculation<strong>and</strong> this picture may be changed in a practical procedure. If there is no othercompelling reason such as kinetics, the preparation <strong>of</strong> Mg 2 FeH 6 the pure elements
Density functional study <strong>of</strong> Mg 2 FeH 6 complex hydride 365should be the best synthesis route. This result is expected to be the guidance for enhancingthe yield <strong>of</strong> Mg 2 FeH 6 complex hydride.4. ConclusionsThe structural, electronic <strong>and</strong> formation ability <strong>of</strong> Mg 2 FeH 6 complex hydride wereinvestigated by using the first principles calculation based on density functional theory(DFT). The calculated structural parameters <strong>and</strong> physical properties are in goodagreement with the experimental results, the hydrogen positions in Mg 2 FeH 6 are preciselydetermined as (0.2456, 0, 0), being very close to the deuterium positions inMg 2 FeD 6 obtained in the neutron diffraction measurement. Detailed calculations <strong>of</strong>electronic structures suggest that the complex Mg 2 FeH 6 hydride is a semiconductorwith the energy b<strong>and</strong> gap <strong>of</strong> about 2.3347 eV. The total <strong>and</strong> partial densities <strong>of</strong> statesas well as the charge density plots indicate a significant charge transfer to Mg 2+ ions<strong>and</strong> negatively charged FeH 6 complex. The bonding within the FeH 6 complex mainlyinvolves the hybridization between Fe(p), Fe(d) <strong>and</strong> H(s) orbitals but exhibits a littleionic character for partial charge transfer from Fe to H. The calculations <strong>of</strong> formationenthalpy are used to estimate the heat change in hydrogenation process according tothree possible synthesis routes. It is found that without considering the influence <strong>of</strong>kinetic aspects, the preparation <strong>of</strong> Mg 2 FeH 6 is likely to perform via pure elements.AcknowledgementsThe work was supported by the Talents Foundation <strong>of</strong> Changsha University <strong>of</strong> Science <strong>and</strong> Technology(No. 20091026), the Hunan Provincial Innovation Foundation for Postgraduates (No. 521298294).References[1] TERZIEVA M., KHRUSSANOVA M., PESHEV P., RADEV D., Int. J. Hydrogen Energy, 20 (1995), 53.[2] GARCÍA G.N., ABRIATA J.P., SOFO J.O., Phys. Rev. B, 59 (1999), 11746.[3] LIANG G., HUOT J., BOILY S., SCHULZ R., J. Alloys Compd., 305 (2000), 239.[4] ZÜTTEL A., Mater. Today, 6 (2003), 24.[5] SEAYAD A., ANTONELLI D.M., Adv. Mater., 16 (2004), 765.[6] FICHTNER M., Adv. Eng. Mater., 7 (2005), 443.[7] Binary Alloy Phase Diagrams, 2nd Ed., T. Massalski, H. Okamoto, P. Subramanian, L. Kacprzak (Eds.),Am. Soc. Metals, Metals Park, OH,1990.[8] DIDISHEIM J.-J., ZOLLIKER P., YVON K., FISCHER P., SCHEFER J., GUBELMANN M., WILLIAMS A.F.,Inorg. Chem., 23 (1984), 1953.[9] SELVAM P., YVON K., Int. J. Hydrogen Energy, 16 (1991), 615.[10] SAI RAMAN S.S., DAVISON D.J., BOBET J.-L., SRIVASTAVA O.N., J. Alloys Compd., 333 (2002), 282.[11] CASTRO F., GENNARI F.C., J. Alloys Compd., 375 (2004), 588.[12] LI S., VARIN R.A., MOROZOVA O., KHOMENKO T., J. Alloys Compd., 384 (2004), 231.[13] MYERS W.R., WANG L.-W., RICHARDSON T.J., RUBIN M.D., J. Appl. Phys., 91 (2002), 4879.[14] VAN SETTEN M.J., DE WIJS G.A., POPA V.A., BROCKS G., Phys. Rev. B, 72 (2005), 073107.[15] VELIKOKHATNYI O.I., KUMTA P.N., Mater. Sci. Eng. B, 140 (2007), 114.
366J. ZHANG et al.[16] DELLEY B., J. Chem. Phys., 92 (1990), 508.[17] DELLEY B., J. Chem. Phys., 94 (1991), 7245.[18] DELLEY B., J. Chem. Phys., 113 (2000), 7756.[19] HOHENBERG P.C., KOHN W., Phys. Rev. B, 136 (1964), 864.[20] KOHN W., SHAM L.J., Phys. Rev. A, 140 (1965), 1133.[21] PERDEW J.P., BURK K., ERNZERHOF M., Phys. Rev. Lett., 77 (2006), 3865.[22] KITTEL C., Introduction to Solid State Physics, 6th Ed., Wiley, New York, 1986.[23] FUKAI Y., The Metal–Hydrogen System, Vol. 21, <strong>of</strong> Springer Series in Mater. Sci., Springer, Berlin, 1993.[24] BORTZ M., BERTHEVILLE B., BØTTGER G., YVON K., J. Alloys Compd., 287 (1999), 4.[25] VAJEESTON P., RAVINDRAN P., KJEKSHUS A., FJELLVÅG H., Phys. Rev. Lett., 89 (2002), 175506.[26] PELES A., ALFORD J.A., MA Z., YANG L., CHOU M.Y., Phys. Rev. B, 70 (2004), 165105.[27] TAKAHASHI Y., YUKAWA H., MORINAGA M., J. Alloys. Compd., 242 (1996), 98.[28] MEDVEDEVA M.I., GORNOSTYREV Y.N., NOVIKOV D.L., MRYASOV O.N., FREEMAN A.J., Acta Mater.,46 (1998), 3433.Received 19 May 2009Revised 23 July 2009
ContentsH. Eslami, M. Solati-Hashjin, M. Tahriri, F. Bakhshi, <strong>Synthesis</strong> <strong>and</strong> <strong>characterization</strong> <strong>of</strong><strong>nanocrystalline</strong><strong>hydroxyapatite</strong> obtained by the wet chemical technique.................................................... 5Q. -H. Chen, W.-J. Wang, W.-0. Zhang, Structure <strong>and</strong> optical properties <strong>of</strong> (Alqr)/Al 2 0 3 ethanolcolloids......................................................................................................................................................... 15T. Zaremba, D. Witkowska, Methods <strong>of</strong> manufacturing <strong>of</strong> potassium titanate fibres <strong>and</strong> whiskers.A review....................................................................................................................................... 25D. W. Zhou, J.S. Liu, J. Zhang, Z.G. Huang, P. Peng, Electronic mechanism <strong>of</strong> dehydrogenation<strong>of</strong> the Mg-Ge mixture during milling under hydrogen.......................................................... ....... 43N. Suresh, S. Venkateswaran, S. Seetharamu, Influence <strong>of</strong>cenospheres <strong>of</strong> fly ash on the mechanicalproperties <strong>and</strong> wear <strong>of</strong> permanent moulded eutectic Al-Si alloys ... ........... .. ......... .. ......... ...... 55W.Z. Nie, J. Li, X.H. Sheng, Tribological properties <strong>of</strong> oxidation modified carbon fibre-reinforced polyamide 6 composites............................................................................................. 67L. Z. Pei, H.S. Zhao, W. Tan, H.Y. Yu, Q.-F. Zhang, Fabrication <strong>of</strong> core-shell Ge-Ge0 2 nanoneedles................ .................................... ........................................................................................ 77S. Vatansever, F. Oksiizomer, S. Naci Kory, M. Somer, H. Deligoz, M. A. Giirkaynak, Fabrication<strong>of</strong> yttria stabilized zirconia nanoparticles by the reverse microemulsion method for SOFC applications..................................................................................................................... ................. 85N. Dukstiene, L. Tatariskinaite, M. Andrulevicius, Characterization <strong>of</strong> electrochemically depositedthin Mo-0-C-Se film layers............................................. ...................................... ............. . 93C. Ludwig, M.F. Beug, K.-H. Kiisters, Advances in flash memory devices................... .................. 105K. Henkel, B. Seime, I. Paloumpa, K. Miiller, D. Schmeisser, Optimization <strong>of</strong> MFIS structurescontaining poly(vinylidene-fluoride trifluoroethylene) for non-volatile memory applications..... 117V. Tyrpek, J. Poltierova-Vejpravova, J. Plocek, D. Niznansky, Preparation <strong>and</strong> <strong>characterization</strong> <strong>of</strong>Si0 2 microspheres doped with CoFe 2 0 4 nanocrystals.................................................................. 129K. Dehghani, A. Jafari, Finite element stress analysis <strong>of</strong>forging dies to improve their fatigue life.. 139C. Wang, Z. Chen, Y. He, L. Li, D. Zhang, Raman scattering <strong>of</strong>ZnO films prepared by the lasermolecular beam epitaxy ................................................................................................... ... .. ........ 153R. Sitek, J. Kaminski, P. Sallot, K.J. Kurzydlowski, Structure <strong>and</strong> properties <strong>of</strong> iron aluminidelayers fabricated by the chemical vapour deposition on 316L steel.............................................. 163M.K. Halimah, W.M. Daud, H.A. A. Sidek, A.W. Zaidan, A.S. Zainal, Optical properties <strong>of</strong>ternary tellurite glasses................................................................................................................. 173L. -P. Li, H.-Y. Zhang, J.-S. Pang, J. Lin, Fabrication <strong>and</strong> performance <strong>of</strong> carbon coated coppernanoparticles.............. .. ... .. ................. .... ................................................ ................. ............... .. ..... 181R. I. Zhao, Y. Ma, J. Zhang, F. Li, W. Liu, Q. Cui, Nitrogen doped carbon nanotubes <strong>and</strong> curvedlamellas produced via pyrolysis <strong>of</strong> melamine by direct current arc discharge.............................. 189D. Pathak, R.K. Bedi, D. Kaur, Characterization <strong>of</strong>laser ablated AglnSe 2 films.............................. 199B. Wang, Y. Guo, G. Hu, On the design <strong>of</strong> biodegradable hydrogels both thermosensitive <strong>and</strong> pHsensitive.................................................. ...................................................................................... 207M. Ban ski, A. Podhorodecki, J. Misiewicz, Influence <strong>of</strong> sol-gel matrices on the optical excitation<strong>of</strong> europium ions........................................................................................................................... 217D. W. Zhou, J.S. Liu, S.H. Xu, G.Y. Chen, First principles study on the improved dehydrogenatingproperties <strong>of</strong>MgH 2 systems with metal fluorides........... ... ............................ .. ............... ........ 229I. S. El-Hallag, Characterization <strong>of</strong> electrodeposited nanostructured macroporous cobalt filmsusing polystyrene sphere templates ........ ...................................................... ................................ 245A. Chorfa, M. Hamidouche, M.A. Madjoubi, F. Petit, Mechanical behaviour <strong>of</strong> glass duringcyclic instrumented indentation.................................................................................................... 255
368S. Sen, P. Sahu, K. Prasad, A novel technique for the synthesis <strong>of</strong>CaCu 3 Ti 4 0 12 ceramics.............. 265M.Jiang, X. Liu, H. Wang, J. Xu, Growth orientation transition <strong>and</strong> metal-like conductivity <strong>of</strong>Ti, AIeo-doped ZnO films............................ ........................................................................................... 273S. Rani, P.K. Shishodia, R.M. Mehra, Enhancement <strong>of</strong> photovoltaic performance <strong>of</strong> quasi-solidstate dye sensitized solar cell with dispersion <strong>of</strong>a hole conducting agent.. ............ -...................... · 281K. Baltakys, E. Prichockiene, Influence <strong>of</strong> CaO reactivity on the formation <strong>of</strong> low-base c;alciumsilicate hydrates .................................................... : ...................................... ; ............ ;.................... 295S. Bindra Narang, S. Bahel, Influence <strong>of</strong> frequency variations on the dielectric properties <strong>of</strong> Smdoped Ba 4 La 9 .33 Ti 18 0 54 dielectric ceramics at various temperatures .. .. ;........................................ 305B. K. Sharma, G. Misra, S.C. Goyal, Quantum computations for temperature variation <strong>of</strong> refractiveindices <strong>of</strong> covalent semiconductors .............................................. ;........................................ 313K. Prasad, S. Bhagat, K. Amamath, S.N. Choudhary, K.L. Yadav, Electrical conduction inBa(Bi 05 Nb 0 . 5 )0 3 ceramics. Impedance spectroscopy analysis...................................................... 317G. Z. Shen, G.S. Cheng, Y. Cao, Z. Xu, Preparation <strong>and</strong> microwave absorption <strong>of</strong> M type ferritenanoparticle composites .................... ..... ...................................... ;., ........... ,................................. 327B. B. Jha, B.K. Mishra, B. Satpati, S.N. Ojha, Effect <strong>of</strong>thermal ageing on the evolution <strong>of</strong> microstructure<strong>and</strong> degradation <strong>of</strong> hardness <strong>of</strong>2.25Cr-1Mo steel.......................................................... 335S. Boucetta, T.Chihi, B. Ghebouli, M. Fatmi, First-principles study <strong>of</strong> th.e elastic <strong>and</strong> mechanicalproperties <strong>of</strong>Ni 3 AI under high pressure ......................................... ,............................................. 347J. Zhang, Y.N. Huang, C. G. Long, D.W. Zhou, J.S. Liu, Density functional study <strong>of</strong> Mg 2 FeH 6complex hydride........... .................................................................................... ............................ 357
Instructions for Authors1. Submission <strong>of</strong> ManuscriptsManuscripts can be sent by e-mail or by conventional mail. Submission <strong>of</strong> a manuscript toMaterials Science-Pol<strong>and</strong> implies that it is not being considered for publication elsewhere, <strong>and</strong>the authors have a necessary authorisation to publish the material contained in the paper.1.1. First Submission1.1.1. By Electronic MailAuthors are encouraged to submit electronic versions <strong>of</strong> the manuscript to thee-mail address <strong>of</strong>the journal (vide infra). A single PDF file containing text, references, figures, tables etc. shouldbe sent. When the size <strong>of</strong> such a file exceeds acceptable limits, the manuscript can be split intoa few files (this should be clearly indicated in the covering letter). Files in the DOC or RTFformats will be accepted only exceptionally.1.1.2. By Conventional MailThe manuscripts can also be submitted by conventional mail. Authors are requested to send aCD with a PDF file containing a complete manuscript (text, references, tables, figures, etc.).The disk, accompanied by a covering letter, should be mailed to the Editor-in-Chief at hisaddress given below.1.2. Final SubmissionAfter the manuscript has received preliminary acceptance, the authors will be requested to sendthe following material:-A PDF file containing the complete manuscript (text, literature, tables, figures, etc). The fileshould be c.arefully checked as it will serve as a hard copy in case <strong>of</strong> doubts.-A DOC or RTF file containing the text, references, tables <strong>and</strong> figure captions. The content <strong>of</strong>the file should be identical with that <strong>of</strong> the hard copy, <strong>and</strong> should exactly match the versionseen <strong>and</strong> accepted be the referee(s).- File(s) in appropriate formats containing figures. Please consult Section 2.5 <strong>of</strong> thisdocument.The files should be preferentially sent bye-mail, to the address <strong>of</strong> the Journal (vide infra), orby conventional mail, on a CD, to the Editor-in-Chief.-Additionally, the corresponding author is requested to send a copyright transfer form.The form should be copied from the web page <strong>of</strong> the Journal, filled .out, .signed <strong>and</strong>mailed to the Editor-in-Chief via conventional mail.
2. Organisation <strong>of</strong> the ManuscriptThe hard copy <strong>of</strong> the manuscript, submitted as a PDF file, should contain the material that canbe reproduced in the A4 or letter size format, double spaced with ample margins throughout.All pages <strong>of</strong> the manuscript should be numbered consecutively, including references, figurecaptions <strong>and</strong> tables.2.1. The First PageThe first page should be organised as follows:Title <strong>of</strong> the paperJ.A. White 1 , T.J. Brown 2·, M. Green 2 • •1 Affiliation l2Affiliation 2E-mail (only the corresponding author)AbstractAn abstract <strong>of</strong> no more than 200 wordsKey words3 to 5 keywords, separated by semicolons (;)* (**)Footnote(s)2.2. Headings, Sub-headingsThese should be placed in the main text as appropriate. The authors are encouraged to conformto the st<strong>and</strong>ard sequence <strong>of</strong> sections (e.g., Introduction; Experimental; Results; Discussion;Conclusions; etc.)2.3. ReferencesIn the main text, references should be numbered consecutively by Arabic numerals in squarebrackets (e.g., [1]; [3, 4]; [7-11]). Each reference should contain names <strong>of</strong> all authors. Thelist <strong>of</strong> references should follow the main text <strong>and</strong> should be <strong>of</strong> the following format:For a paper in a journal:[1] KITAMURA T., YOKOYAMA M., J. Appl. Phys., 69 (1991), 821.For a book:[2] SWALTN R.A., Thermodynamics <strong>of</strong> Solids, Wiley, New York, 1962.For a chapter in a book:[3] WILD U.P., RENN A., Spectral Hole-Burning, [in:] H. Diirr <strong>and</strong> H. Bouas-Laurent (Eds.),Photochromism. Molecules <strong>and</strong> Systems, Elsevier, Amsterdam, 1990, p. 930.Journal abbreviations should be in accordance with the st<strong>and</strong>ards <strong>of</strong> Chemical Abstracts.
GUIDELINES FOR AUTHORSManuscripts can be sent by conventional mail or by e-mail. Submission <strong>of</strong> a manuscript to MaterialsScience-Pol<strong>and</strong> implies that it is not being considered for the publication elsewhere, <strong>and</strong> the authors havea necessary authorization to publish the material contained in the paper. The manuscripts should conformto the formal st<strong>and</strong>ards <strong>of</strong> the Journal which may be found in the first issue <strong>of</strong> each volume<strong>and</strong> on the web page.Authors are encouraged to submit electronic versions <strong>of</strong> the manuscript by e-mail, to the address <strong>of</strong>the Journal. A single PDF file should be sent, containing text, references, figures, tables etc. Alternatively,the authors can submit the manuscript by conventional mail, sending a CD with the PDF file mentionedabove, to the Editor-in-Chief at his address given below.Each submitted manuscript will be reviewed, the final decision concerning its acceptance resting withthe editors. Upon acceptance, the corresponding author will be requested to submit the following material(viae-mail or by conventional mail, on CD)• A DOC or RTF file containing the final version <strong>of</strong> the text, references, tables <strong>and</strong> figure captions.The content <strong>of</strong> the file should be identical with that <strong>of</strong> the hard copy, <strong>and</strong> should exactly match the versionseen <strong>and</strong> accepted be the referee(s).• File(s) in appropriate formats containing figures. The required formats <strong>of</strong> the drawings (plots,schemes <strong>of</strong> technological processes) must be vector files such as XLS, OPJ, cdr (Excel, Origin, CorelDraw) which may also be exported as EPS, EMF or WMF files. Drawings submitted in tiff or jpg formats(bitmaps, raster graphics), even if exported as EPS, EMF or WMF files, will not be accepted. Bitmapsare acceptable only in the case <strong>of</strong> photographs. The photographs (only in grayscale) should ha,·c theresolution not lower than 300 dpi (estimated for the size in which they are expected to be reproduced).• A PDF file containing the complete manuscript (text, literature, tables, figures, etc). The file shouldbe carefully checked as it will serve as a hard copy in case <strong>of</strong> doubts. The contents <strong>of</strong> the PDF fileshould exactly match the material in other files.Irrespective <strong>of</strong> whether the final version is submitted by e-mail or by conventional mail, the authorsshould also send via conventional mail a signed copy <strong>of</strong> the Copyright Transfer Agreement (available onthe web page <strong>of</strong> the Journal).For detailed information consult the first issue <strong>of</strong> each volume or the web page <strong>of</strong> the Journal.The mail should be addressed to:Pr<strong>of</strong>essor Juliusz SworakowskiEditor-in-Chief, Materials Science-Pol<strong>and</strong>Politechnika Wroclawska, W-3Wybrzei:e Wyspianskiego 2750-370 Wroclaw, Pol<strong>and</strong>Electronic correspondence should be sent to: MatSci@pwr.wroc.plWeb page <strong>of</strong> Materials Science-Pol<strong>and</strong>: www.MaterialsScience.pwr.wroc.plThe Publisher reserves the right to make necessary alterations to the text. Each corresponding authorwill be supplied with one free copy <strong>of</strong> the journal. Orders for additional <strong>of</strong>fprints can be placed with thePublisher.