Sub-Regional Profiles - Sydney Local Health District - NSW ...
Sub-Regional Profiles - Sydney Local Health District - NSW ...
Sub-Regional Profiles - Sydney Local Health District - NSW ...
- No tags were found...

You also want an ePaper? Increase the reach of your titles
YUMPU automatically turns print PDFs into web optimized ePapers that Google loves.
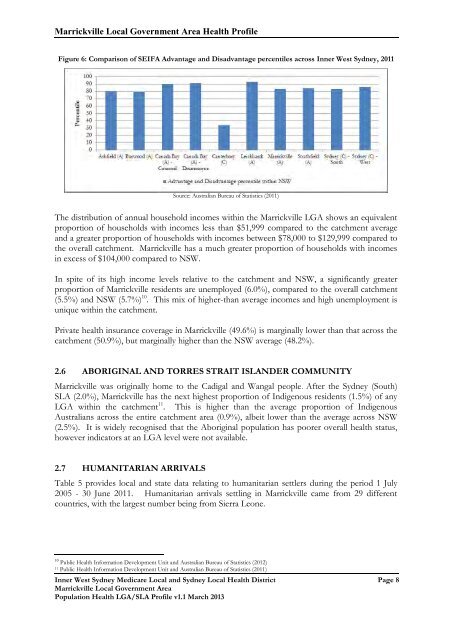
Marrickville <strong>Local</strong> Government Area <strong>Health</strong> ProfileFigure 6: Comparison of SEIFA Advantage and Disadvantage percentiles across Inner West <strong>Sydney</strong>, 2011Source: Australian Bureau of Statistics (2011)The distribution of annual household incomes within the Marrickville LGA shows an equivalentproportion of households with incomes less than $51,999 compared to the catchment averageand a greater proportion of households with incomes between $78,000 to $129,999 compared tothe overall catchment. Marrickville has a much greater proportion of households with incomesin excess of $104,000 compared to <strong>NSW</strong>.In spite of its high income levels relative to the catchment and <strong>NSW</strong>, a significantly greaterproportion of Marrickville residents are unemployed (6.0%), compared to the overall catchment(5.5%) and <strong>NSW</strong> (5.7%) 10 . This mix of higher-than average incomes and high unemployment isunique within the catchment.Private health insurance coverage in Marrickville (49.6%) is marginally lower than that across thecatchment (50.9%), but marginally higher than the <strong>NSW</strong> average (48.2%).2.6 ABORIGINAL AND TORRES STRAIT ISLANDER COMMUNITYMarrickville was originally home to the Cadigal and Wangal people. After the <strong>Sydney</strong> (South)SLA (2.0%), Marrickville has the next highest proportion of Indigenous residents (1.5%) of anyLGA within the catchment 11 . This is higher than the average proportion of IndigenousAustralians across the entire catchment area (0.9%), albeit lower than the average across <strong>NSW</strong>(2.5%). It is widely recognised that the Aboriginal population has poorer overall health status,however indicators at an LGA level were not available.2.7 HUMANITARIAN ARRIVALSTable 5 provides local and state data relating to humanitarian settlers during the period 1 July2005 - 30 June 2011. Humanitarian arrivals settling in Marrickville came from 29 differentcountries, with the largest number being from Sierra Leone.10 Public <strong>Health</strong> Information Development Unit and Australian Bureau of Statistics (2012)11Public <strong>Health</strong> Information Development Unit and Australian Bureau of Statistics (2011)Inner West <strong>Sydney</strong> Medicare <strong>Local</strong> and <strong>Sydney</strong> <strong>Local</strong> <strong>Health</strong> <strong>District</strong> Page 8Marrickville <strong>Local</strong> Government AreaPopulation <strong>Health</strong> LGA/SLA Profile v1.1 March 2013