Sub-Regional Profiles - Sydney Local Health District - NSW ...
Sub-Regional Profiles - Sydney Local Health District - NSW ...
Sub-Regional Profiles - Sydney Local Health District - NSW ...
- No tags were found...

Create successful ePaper yourself
Turn your PDF publications into a flip-book with our unique Google optimized e-Paper software.
Inner West <strong>Sydney</strong> Medicare <strong>Local</strong>MARRICKVILLE LOCALGOVERNMENT AREAFinal Population <strong>Health</strong> <strong>Sub</strong> <strong>Regional</strong> ProfileHEALTH PROFILEMarrickville <strong>Local</strong> Government Area<strong>Health</strong>Consult Pty LtdACN 118 337 8214409/93 Liverpool Street, <strong>Sydney</strong>, New South Wales, 2000Phone (02) 9261 3707 Fax (02) 9261 370598 Stonebridge Way, Attwood, Victoria 3049Phone (03) 9333 2209 (02) 9261 370520 January, 2013 / v5.0
Marrickville <strong>Local</strong> Government Area <strong>Health</strong> ProfileContentsINTRODUCTION ...................................................................................................................................... 1POPULATION AND COMMUNITY CHARACTERISTICS ........................................................................... 32.1 POPULATION CHARACTERISTICS ......................................................................................................................................32.2 BIRTHS AND MATERNAL HEALTH ...................................................................................................................................52.3 CULTURAL CHARACTERISTICS ...........................................................................................................................................62.4 EDUCATION LEVELS ...........................................................................................................................................................72.5 SOCIO-ECONOMIC CHARACTERISTICS .............................................................................................................................72.6 ABORIGINAL AND TORRES STRAIT ISLANDER COMMUNITY.......................................................................................82.7 HUMANITARIAN ARRIVALS ...............................................................................................................................................82.8 HOMELESSNESS ...................................................................................................................................................................9HEALTH RISKS OF THE POPULATION ................................................................................................. 123.1 HEALTH RISK FACTORS ................................................................................................................................................... 12LONG TERM CONDITIONS, CHRONIC DISEASE AND DISABILITY ....................................................... 144.1 CHRONIC DISEASES .......................................................................................................................................................... 144.2 CANCER ............................................................................................................................................................................. 174.3 MORTALITY ....................................................................................................................................................................... 204.4 INFECTIOUS DISEASES ..................................................................................................................................................... 224.5 DISABILITY ........................................................................................................................................................................ 23HEALTH SERVICE UTILISATION .......................................................................................................... 245.1 PRIMARY CARE UTILISATION .......................................................................................................................................... 245.2 EMERGENCY ..................................................................................................................................................................... 255.3 AMBULATORY-CARE SENSITIVE ADMISSIONS ............................................................................................................. 265.4 HOME AND COMMUNITY CARE .................................................................................................................................... 27HEALTH SERVICE AVAILABILITY ....................................................................................................... 286.1 HOSPITALS AND DAY SURGERY ..................................................................................................................................... 286.2 MEDICAL ........................................................................................................................................................................... 286.3 ALLIED HEALTH .............................................................................................................................................................. 296.4 COMMUNITY HEALTH SERVICES .................................................................................................................................. 306.5 AGED CARE ....................................................................................................................................................................... 31APPENDIX A: POSTCODE TO LGA / SLA CORRESPONDENCES ....................................................... 33APPENDIX B: DATA LIMITATIONS AND ASSUMPTIONS ..................................................................... 34
Marrickville <strong>Local</strong> Government Area <strong>Health</strong> Profile1IntroductionThis health profile is one of a series of profiles thatoutlines the health of residents of the Inner West<strong>Sydney</strong> Medicare <strong>Local</strong> (IWSML) and <strong>Sydney</strong><strong>Local</strong> <strong>Health</strong> <strong>District</strong> (SLHD) catchmentarea. The catchment comprises <strong>Local</strong>Government Areas (LGAs) of Ashfield,Burwood, Canada Bay, Canterbury,Leichhardt, Marrickville, Strathfield andStatistical <strong>Local</strong> Areas (SLAs) of<strong>Sydney</strong> South and <strong>Sydney</strong> West and isreferred to as the Inner West <strong>Sydney</strong>catchment. The profile describes the characteristics of the Marrickville <strong>Local</strong> Government Area(LGA) population and compares it with the populations of the Inner West <strong>Sydney</strong> catchmentand <strong>NSW</strong>. 1Marrickville <strong>Local</strong> Government Area (pop: 76,500) is located less than 10 kilometres west ofthe City of <strong>Sydney</strong> and is comprised of Enmore and Newtown (postcode 2042), St Peters,Sydenham and Tempe (postcode 2044), Stanmore and Westgate (postcode 2048), Lewisham,Petersham and Petersham North (postcode 2049), Camperdown (postcode 2050), Dulwich Hill(postcode 2203) and Marrickville / Marrickville South (postcode 2204).At the 2011 census, 58% of Marrickville residents reported being born in Australia, 1.5%identified as Aboriginal and Torres Strait Islander, and 34% reported being born overseas. Ofthe total population, 25% were born in non-English speaking countries. The median age is 36years, with almost 50% of Marrickville residents classified as young workforce, parents andhomebuilders, or 25-49 years of age.From a population health perspective, there is a higher level of smoking, overweight and obesity,as well as most chronic disease types when compared to other LGAs within the Inner West<strong>Sydney</strong> catchment. There is a higher prevalence of mood disorders (8.7%) and respiratoryconditions (25.9%) than any other locality across the catchment. 4.3% report having a disabilityfor which they need assistance in their daily lives.1 Users of this information are strongly advised to refer to the source data to ensure accuracy, and to take note of the data explanations whichaccompany the profile to ensure the information provided is interpreted appropriately and that the data limitations are understood. Referencecan be made to the source data through the links and/or references provided.This health profile should be read in conjunction with more detailed information on the health of the local population provided by IWSML andSLHD on their websites: www.iwsml.org.au and www.slhd.nsw.gov.au. Additional information can also be obtained from the <strong>NSW</strong> Chief <strong>Health</strong>Officer’s Report 2010 and <strong>Health</strong> Statistics <strong>NSW</strong>. Available at http://www.healthstats.nsw.gov.au/ and from the <strong>NSW</strong> Adult Population <strong>Health</strong>Surveys: http://www.health.nsw.gov.au/surveys/Pages/default.aspx.Inner West <strong>Sydney</strong> Medicare <strong>Local</strong> and <strong>Sydney</strong> <strong>Local</strong> <strong>Health</strong> <strong>District</strong> Page 1Marrickville <strong>Local</strong> Government AreaPopulation <strong>Health</strong> LGA/SLA Profile v1.1 March 2013
Marrickville <strong>Local</strong> Government Area <strong>Health</strong> ProfileTable 1: Characteristics of the Marrickville LGA at a glanceIndicatorLGARank within Inner WestValue Inner West <strong>Sydney</strong><strong>NSW</strong><strong>Sydney</strong>Population^ 76,500* 2 nd 548,627 6,917,656Population growth forecast (2011 to 2025) # 11.8% 9 th 22.1% 20.3%% Indigenous persons # 1.5% 2 nd 0.9% 2.5%Median annual household income^ 83,460 5 th $78,930 α $64,324Unemployment # 6.0% 5 th 5.5% 5.7%% English as primary language^ 68.3% 3 rd 54.9% 72.5%Private <strong>Health</strong> Insurance coverage # 49.6% 6 th 50.9% 48.2%Broadband internet penetration # 73.7% 7 th 73.4% 69.9%Disability – has need for assistance withcore activities^4.3% 4 th 4.2% 4.9%Actual Births 2011^1,279 3 rd 9,041 97,602Source: ^Australian Bureau of Statistics; # Public <strong>Health</strong> Information Development Unit and Australian Bureau of StatisticsNote: α Derived by <strong>Health</strong>Consult based on income data published by the Australian Bureau of Statistics (2011)* This population number is based on first count data. The values based on estimated resident data (ERP) are 81,489 and 582,100 respectively.Inner West <strong>Sydney</strong> Medicare <strong>Local</strong> and <strong>Sydney</strong> <strong>Local</strong> <strong>Health</strong> <strong>District</strong> Page 2Marrickville <strong>Local</strong> Government AreaPopulation <strong>Health</strong> LGA/SLA Profile v1.1 March 2013
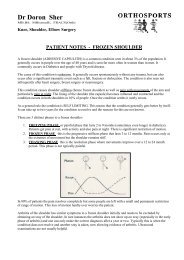
Marrickville <strong>Local</strong> Government Area <strong>Health</strong> ProfileFigure 3: Marrickville LGA projected population age groups 2006, 2011, 2016, 2021 and 203140,00035,000Population number30,00025,00020,00015,00010,0000 - 4 years5 - 14 years15 - 24 years25 - 44 years45 - 64 years65 - 84 years85 years+5,00002006201120162021202620312036Age groupsSource: <strong>NSW</strong> <strong>Health</strong> Population Projection Series 1, 2009Concurrent with population growth are proposed increases in the number of local homes andjobs. The <strong>NSW</strong> Government’s Metropolitan Strategy, South <strong>Sub</strong>region, Draft <strong>Sub</strong>regional Strategy has set atarget of an additional 4,150 local dwellings in the Marrickville LGA in the years 2004 – 2031 anda target of 28,500 local jobs by 3031, an increase of 500 from 2001. 32.2 BIRTHS AND MATERNAL HEALTHTable 3 and Figure 4 show the number of births to Marrickville LGA residents in the period2006 - 2011. The annual number of births has fluctuated between 2006 and 2011 but shows anoverall increase. The fertility rate has increased steadily between 2006 and 2010 and thendecreased in 2011, although it was consistently lower than that for <strong>NSW</strong>.Table 3: Births to Marrickville LGA Residents and Fertility Rate 2006 - 2011Year Marrickville births Marrickville totalfertility rate<strong>NSW</strong> total fertilityrate2006 1,170 1.45 1.792007 1,231 1.48 1.812008 1,335 1.54 1.852009 1,270 1.58 1.872010 1,396 1.63 1.902011 1,279 1.59 1.91Source: ABS 2011 Catalogue No. 330010DO004_20113<strong>NSW</strong> Government Metropolitan Strategy, South <strong>Sub</strong>region, Draft <strong>Sub</strong>regional Strategy. Available athttp://www.metrostrategy.nsw.gov.au/LinkClick.aspx?fileticket=xII8fmMisiA%3d&tabid=65Inner West <strong>Sydney</strong> Medicare <strong>Local</strong> and <strong>Sydney</strong> <strong>Local</strong> <strong>Health</strong> <strong>District</strong> Page 5Marrickville <strong>Local</strong> Government AreaPopulation <strong>Health</strong> LGA/SLA Profile v1.1 March 2013
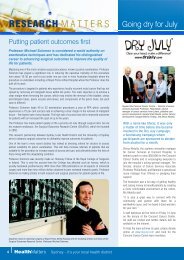
Marrickville <strong>Local</strong> Government Area <strong>Health</strong> ProfileFigure 4: Births to Marrickville Residents 2006 - 2011Source: ABS 2011 Catalogue No. 330010DO004_2011Maternal health indicators are presented in Table 4 and have been extracted from <strong>NSW</strong> <strong>Health</strong>’s<strong>Health</strong> Statistics and Australian Bureau of Statistics web pages.These indicators show that the rate of attendance for antenatal care is lower than <strong>NSW</strong>. The rateof smoking during pregnancy in Marrickville is also significantly lower than the state.Table 4: Maternal health indicators, Marrickville LGA and <strong>NSW</strong>Maternal indicator Marrickville LGA <strong>NSW</strong>Actual births 2011 4 1,279 99,054Total fertility rate 2011 5 6 1.59 1.91Smoking at all during pregnancy, 2008 to 2010 combined,number of mothers who smoked per year, smoothedstandardised prevalence ratio 7First antenatal visit before 14 weeks of gestation, 2008 to2010 combined, smoothed percent of pregnancies,smoothed standardised prevalence ratio109(68.2) -59%(73.3) -Source: ABS 2011 Catalogue No. 330010DO004_2011 and <strong>NSW</strong> <strong>Health</strong> Statistics# Estimated number per year; Below the state average at 1% level of significance11,235(100)79.3% #(100)2.3 CULTURAL CHARACTERISTICSMarrickville is a diverse population, with residents representing over 100 cultures and speakingover 70 languages. Nonetheless, over 68% report speaking English as a first language, as shownin Figure 3. Other notable primary languages include Greek (6.1%), Mon-Khmer (4.1%), Iberian4Australian Bureau of Statistics Births Australia 2011. Available athttp://www.abs.gov.au/AUSSTATS/abs@.nsf/DetailsPage/3301.02011?OpenDocument. Accessed 11 November 2011.5Total fertility rate represents the number of children a female would bear during her life if she experienced current age-specific fertility rates ateach age of her reproductive life. (ABS 2007)6Australian Bureau of Statistics Births Australia 2011. Available athttp://www.abs.gov.au/AUSSTATS/abs@.nsf/DetailsPage/3301.02011?OpenDocument. Accessed 11 November 2011.7http://www.healthstats.nsw.gov.au/Indicator/mum_smomum_lgamap accessed 11 November 2012Inner West <strong>Sydney</strong> Medicare <strong>Local</strong> and <strong>Sydney</strong> <strong>Local</strong> <strong>Health</strong> <strong>District</strong> Page 6Marrickville <strong>Local</strong> Government AreaPopulation <strong>Health</strong> LGA/SLA Profile v1.1 March 2013
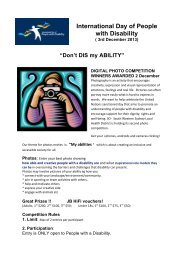
Marrickville <strong>Local</strong> Government Area <strong>Health</strong> ProfileRomance/Portuguese (3.9%) Chinese (3.4%).English ‘not well’ or ‘not at all’.7.1% of residents indicated that they speakThe five largest ancestries in Marrickville are English (25.9%), Australian (23.7%), Irish (12.2%),Scottish (7.9%) and Greek (6.5%). In comparing Marrickville to the catchment overall,Marrickville has a greater percentage of people from Greece, Vietnam and Portugal, while havingless residents originating from China.Figure 5: Primary language spoken at home vs Inner West <strong>Sydney</strong> and state comparators, 2011Source: Australian Bureau of Statistics (2011)2.4 EDUCATION LEVELSIn the Marrickville LGA, 64% of people aged over 15 years have completed Year 12 schooling(or equivalent). 8 This rate of completion is well-above the state of <strong>NSW</strong> (47.6%).2.5 SOCIO-ECONOMIC CHARACTERISTICSThe Socio-Economic Indexes For Areas (SEIFA) are used to rank geographic areas acrossAustralia according to their socio-economic characteristics. The Index of RelativeSocioeconomic Disadvantage (IRSD) contains indicators of disadvantage such as low income,high unemployment and low levels of education. Relative disadvantage is associated with a lownumber. The average across Australia is 1,000. A number below 1,000 indicates lowersocioeconomic status.The Socio-Economic Indexes For Areas (SEIFA) score for Advantage and Disadvantage in theMarrickville LGA is 1,043, which ranks it at the 83 rd percentile of Socio-Economic Advantageand Disadvantage 9 for <strong>NSW</strong> and 7 th out of the 10 LGAs / SLAs within Inner West <strong>Sydney</strong> interms of relative advantage. It should be noted that Inner West <strong>Sydney</strong> is generally moreadvantaged than the <strong>NSW</strong> average and, as shown in Figure 6 Marrickville is not significantly lessadvantaged than most other LGAs / SLAs within the catchment, despite its ranking.8Profile ID-Marrickville (2012), accessed from http://profile.id.com.au/marrickville9Australian Bureau of Statistics (2011)Inner West <strong>Sydney</strong> Medicare <strong>Local</strong> and <strong>Sydney</strong> <strong>Local</strong> <strong>Health</strong> <strong>District</strong> Page 7Marrickville <strong>Local</strong> Government AreaPopulation <strong>Health</strong> LGA/SLA Profile v1.1 March 2013
Marrickville <strong>Local</strong> Government Area <strong>Health</strong> ProfileFigure 6: Comparison of SEIFA Advantage and Disadvantage percentiles across Inner West <strong>Sydney</strong>, 2011Source: Australian Bureau of Statistics (2011)The distribution of annual household incomes within the Marrickville LGA shows an equivalentproportion of households with incomes less than $51,999 compared to the catchment averageand a greater proportion of households with incomes between $78,000 to $129,999 compared tothe overall catchment. Marrickville has a much greater proportion of households with incomesin excess of $104,000 compared to <strong>NSW</strong>.In spite of its high income levels relative to the catchment and <strong>NSW</strong>, a significantly greaterproportion of Marrickville residents are unemployed (6.0%), compared to the overall catchment(5.5%) and <strong>NSW</strong> (5.7%) 10 . This mix of higher-than average incomes and high unemployment isunique within the catchment.Private health insurance coverage in Marrickville (49.6%) is marginally lower than that across thecatchment (50.9%), but marginally higher than the <strong>NSW</strong> average (48.2%).2.6 ABORIGINAL AND TORRES STRAIT ISLANDER COMMUNITYMarrickville was originally home to the Cadigal and Wangal people. After the <strong>Sydney</strong> (South)SLA (2.0%), Marrickville has the next highest proportion of Indigenous residents (1.5%) of anyLGA within the catchment 11 . This is higher than the average proportion of IndigenousAustralians across the entire catchment area (0.9%), albeit lower than the average across <strong>NSW</strong>(2.5%). It is widely recognised that the Aboriginal population has poorer overall health status,however indicators at an LGA level were not available.2.7 HUMANITARIAN ARRIVALSTable 5 provides local and state data relating to humanitarian settlers during the period 1 July2005 - 30 June 2011. Humanitarian arrivals settling in Marrickville came from 29 differentcountries, with the largest number being from Sierra Leone.10 Public <strong>Health</strong> Information Development Unit and Australian Bureau of Statistics (2012)11Public <strong>Health</strong> Information Development Unit and Australian Bureau of Statistics (2011)Inner West <strong>Sydney</strong> Medicare <strong>Local</strong> and <strong>Sydney</strong> <strong>Local</strong> <strong>Health</strong> <strong>District</strong> Page 8Marrickville <strong>Local</strong> Government AreaPopulation <strong>Health</strong> LGA/SLA Profile v1.1 March 2013
Marrickville <strong>Local</strong> Government Area <strong>Health</strong> ProfileTable 5: Humanitarian migration stream, settlers arriving 2005 – 2011, Marrickville LGA and <strong>NSW</strong>Population characteristics Marrickville <strong>NSW</strong>Humanitarian Stream, number of settlers arriving from 135 25,4602005 to 2011Top 3 countries of birth for humanitarian migrationstream, number of settlers arriving 2005 – 2011Iraq ^ 8,270Afghanistan 0 1,554Iran 7+ 1,385Sierra Leone 26+ 8,270Source: Department of Immigration and Citizenship Settlement Database 12 ; # Not one of the top 3 countries of birth; ^ Actual numbersuppressed due to low numbers in reported age cohorts; + actual number is greater but some data has been suppressed due to small numbers inreported age cohorts2.8 HOMELESSNESSHomelessness data published by the Australian Bureau of Statistics shows that the per-capita rateof homelessness in Marrickville (14.2 persons per 1,000) is the highest of any LGA in thecatchment area 13 . The rate of homelessness in Marrickville is more than twice as high as theentire catchment (6.9 persons per 1,000) and more than three times higher than across <strong>NSW</strong> (3.4persons per 1,000).‘Severe’ crowding is also a significant problem within Marrickville (1.65 persons per 1,000), witha rate that is approximately 25% higher than the entire catchment area (1.33 persons per 1,000).Figure 7: Housing and homelessness indicators vs Inner West <strong>Sydney</strong> and state comparators, 2006Source: Australian Bureau of Statistics (2006)Population Characteristics of the Marrickville LGA are provided in Table 6. They includeindicators reflecting people and culture, disability, the labour force, education and familycomposition from the Australian Bureau of Statistics (ABS) 2011 Census of Population andHousing.12Department of Immigration and Citizenship Settlement Database. Accessed 21 February 2012. Available at: http://www.immi.gov.au/livingin-australia/delivering-assistance/settlement-reporting-facility/13Australian Bureau of Statistics (2011)Inner West <strong>Sydney</strong> Medicare <strong>Local</strong> and <strong>Sydney</strong> <strong>Local</strong> <strong>Health</strong> <strong>District</strong> Page 9Marrickville <strong>Local</strong> Government AreaPopulation <strong>Health</strong> LGA/SLA Profile v1.1 March 2013
Marrickville <strong>Local</strong> Government Area <strong>Health</strong> ProfileTable 6: Population characteristics of the Marrickville LGAPopulation characteristics Marrickville <strong>NSW</strong>People and CultureTotal persons 76,500 6,917,658Indigenous persons (comprises Aboriginal and Torres 1,111 (1.5%) 172,651 (2.5%)Strait Islander)Persons born overseas 26,094 (34.1%) 1,778,548 (25.7%)Country of birth – three most common responses otherthan AustraliaUnited Kingdom 3,490 (4.6%) 274,823 (4.0%)China * 156,034 (2.3%)New Zealand * 114,233 (1.7%)Greece 2,307 (3.0%) *Vietnam 2,251 (2.9%) *Language spoken at home – English only spoken at home 47,700 (62.4%) 5,031,343 (72.5%)Three most common languages other than English spokenat homeArabic 1,791 (2.3%) 184,252 (2.7%)Mandarin ** 139,825 (2.0%)Cantonese ** 136,374 (2.0%)Greek 4,235 (5.5%) **Vietnamese 2,827 (3.7%) **Disability 14Core activity need for assistance 3,282 (4.3%) 338,362 (4.9%)Carers 15Unpaid assistance to a person with a disability 6,190 (8.1%) 638,614 (9.2%)Education 16Highest Year of School Completed – Year 12 or equivalent 41,742 (65.4%) 2,631,287 (49.2%)Highest Year of School Completed – Year 10 or equivalent 6,966 (10.9%) 1,278,047 (23.9%)Labour Force StatusTotal labour force 44,205 3,334,857Employed full time 28,704 (64.9%) 2,007,925 (60.2%)Unemployed 2,325 (5.3%) 196,526 (5.9%)IncomeMedian individual income ($/weekly) 772 561Median household income ($/weekly) 1,605 1,237Family characteristicsCouple families with children 7,286 (39.1%) 831,850 (45.5%)Couple families without children 7,798 (41.9%) 669,019 (36.6%)One parent families 2,946 (15.8%) 297,904 (16.3%)14Source: ABS 2006 CDATA Online. This variable has been developed to measure the number of people with a profound or severe disability.(ABS, 2006, 2901.0 – Census Dictionary, 2006, (Reissue)http://www.abs.gov.au/ausstats/abs@.nsf/Lookup/2901.0Chapter9908902006+(Reissue)?OpenDocument15Source: ABS 2006 CDATA Online. This variable recorded people who in the two weeks prior to Census Night spent time providing unpaidcare, assistance or help to family members or others because of a long term illness, disability or problems related to old age. It included peoplewho were in receipt of a Carer Payment or Carer Allowance. It did not include work performed via a voluntary group or organisation. (ABS,2006, 2901.0 – Census Dictionary, 2006, (Reissue)http://www.abs.gov.au/ausstats/abs@.nsf/Lookup/2901.0Chapter9943002006+(Reissue)?OpenDocument16Proportion calculated on the total persons 15 years and over who are no longer attending primary or secondary schoolInner West <strong>Sydney</strong> Medicare <strong>Local</strong> and <strong>Sydney</strong> <strong>Local</strong> <strong>Health</strong> <strong>District</strong> Page 10Marrickville <strong>Local</strong> Government AreaPopulation <strong>Health</strong> LGA/SLA Profile v1.1 March 2013
Marrickville <strong>Local</strong> Government Area <strong>Health</strong> ProfileHousehold composition – occupied private dwellingsFamily household 18,110 (60.4%) 1,777,398 (71.9%)Lone person household 8,773 (29.3%) 599,148 (24.2%)Dwelling characteristicsTotal private dwellings 32,364 2,736,637Median rent ($/weekly) 370 300Median housing loan repayment ($/monthly) 2,485 1,993Occupied private dwellings - fully owned 7,012 (21.7%) 820,006 (30.0%)Occupied private dwellings - rented including rent-free 12,891 (39.8%) 743,050 (27.2%)Source: ABS 2011* Not one of the three most common responses** Not one of the three most common languages other than English spoken at homeInner West <strong>Sydney</strong> Medicare <strong>Local</strong> and <strong>Sydney</strong> <strong>Local</strong> <strong>Health</strong> <strong>District</strong> Page 11Marrickville <strong>Local</strong> Government AreaPopulation <strong>Health</strong> LGA/SLA Profile v1.1 March 2013
Marrickville <strong>Local</strong> Government Area <strong>Health</strong> Profile3<strong>Health</strong> risks of the populationHeadlines Slightly higher prevalence of smokers, overweight persons and obese personscompared to the catchment average; and Highest rate of child mortality across the catchment, by a significant margin.3.1 HEALTH RISK FACTORSFigure 8 shows that the health risk profile of Marrickville residents is slightly higher than thecatchment in terms of the prevalence of smoking (19.5%), psychological distress (13.2%),overweight (22.5%) and obese persons (14.4%). Marrickville has a slightly lower risk profile interms of the proportion of physically inactive persons (31.8%) and risky alcohol consumption(4.1%) compared to the catchment area.Figure 8: <strong>Health</strong> risk factors vs Inner West <strong>Sydney</strong> and state comparators, 2007-08Source: Public <strong>Health</strong> Information Development Unit and Australian Bureau of Statistics 2007-08 National <strong>Health</strong> SurveyRefer to Appendix B 1.3 for definitions of <strong>Health</strong> Risk Factors described aboveHowever, data collected by the Australian Bureau of Statistics (Figure 9) shows that childmortality rates in Marrickville are significantly higher than all other areas within the catchment, at158.9 cases per 100,000.Inner West <strong>Sydney</strong> Medicare <strong>Local</strong> and <strong>Sydney</strong> <strong>Local</strong> <strong>Health</strong> <strong>District</strong> Page 12Marrickville <strong>Local</strong> Government AreaPopulation <strong>Health</strong> LGA/SLA Profile v1.1 March 2013
Marrickville <strong>Local</strong> Government Area <strong>Health</strong> ProfileFigure 9: Child mortality per 100,000 births across the catchment, 2005 to2007Source: Public <strong>Health</strong> Information Development Unit and Australian Bureau of Statistics (2012)Table 7 provides detail reflecting health behaviours of residents covered by the catchment and<strong>NSW</strong> and has been extracted from the <strong>NSW</strong> Population <strong>Health</strong> Survey 2011 Report on Adult<strong>Health</strong>.Table 7: <strong>Health</strong> behaviours of the residents of Inner West <strong>Sydney</strong> and <strong>NSW</strong>IndicatorConsumes more than 2 standard drinks perday when drinking alcohol, persons aged 16years and over, 2011Current smoking, persons aged 16 years andover, 2011Recommended fruit consumption, personsaged 16 years and over, 2011Recommended vegetable consumption,persons aged 16 years and over, 2011Adequate physical activity, persons aged 16years and over, 2011InnerWest<strong>Sydney</strong>IWS trend <strong>NSW</strong> <strong>NSW</strong> trend23.9% Since 2002 steady 29.6% Steadywith slightreduction14.9% Decreasing since 14.7% Decreasing1997since 199751.5% Steady 50.4% Steady7.1% Steady 8.4% Steady56.1% Overall slight 54.6% Overall slightincrease since increase since1998. Recent 1998. Recentdecline.decline.Vaccinated against influenza in the last 12 67.3% Increase since 72.4% Increase sincemonths, persons aged 65 years and over, 201119971997Vaccinated against pneumococcal disease, 54.0% Increase since 59.5% Increase sincepersons aged 65 years and over, 201120022002Source: <strong>NSW</strong> Adult Population <strong>Health</strong> Survey (SaPHaRI); Centre for Epidemiology and Evidence, <strong>NSW</strong> Ministry of <strong>Health</strong> available at <strong>Health</strong>Statistics.Vaccination rates for adults within Inner West <strong>Sydney</strong> are lower than that for <strong>NSW</strong>, with otherindicators reflecting a similar health behaviour pattern to the rest of the state.Inner West <strong>Sydney</strong> Medicare <strong>Local</strong> and <strong>Sydney</strong> <strong>Local</strong> <strong>Health</strong> <strong>District</strong> Page 13Marrickville <strong>Local</strong> Government AreaPopulation <strong>Health</strong> LGA/SLA Profile v1.1 March 2013
Marrickville <strong>Local</strong> Government Area <strong>Health</strong> Profile4Long term conditions, chronic disease and disabilityHeadlines Significant range and mix of health issues overall; High prevalence of most chronic disease compared to the catchment, particularly mooddisorders, circulatory and respiratory system conditions; Higher rate of preventable mortality than the catchment and <strong>NSW</strong> that appears to belargely driven by circulatory system diseases and cancer; High prevalence of sexually transmissible infections compared to the catchment and<strong>NSW</strong>, particularly chlamydia, gonorrhea and hepatitis C; Lower prevalence of most types of cancer than the catchment and <strong>NSW</strong>, which issurprising considering the high mortality rates reported from cancer in Marrickville; and Greater proportion of persons aged 60 years and above that require assistance withcore activities, compared to the catchment and <strong>NSW</strong>. This gap widens with age.4.1 PREVALENCE OF CHRONIC DISEASEData obtained through the 2007-08 National <strong>Health</strong> Survey (provided in Figure 10) shows thatthe prevalence of chronic diseases in the Marrickville LGA is consistently higher for all diseasetypes compared to the prevalence across the catchment. Marrickville exhibits the highestprevalence of mood disorders (8.7%) and respiratory conditions (25.9%) across the catchment.The prevalence of circulatory system diseases (14.2%) and musculoskeletal conditions (28.3%) inthis locality are also among the highest. 17Marrickville ranks second across the catchment in high psychological distress behind Canterbury(14.3%) 18 , and this is a strong correlate with the very high prevalence of mood disorders such asdepression, anxiety, dysrhythmia and bipolar disorder.17Public <strong>Health</strong> Information Development Unit and Australian Bureau of Statistics (2012)18ibid.Inner West <strong>Sydney</strong> Medicare <strong>Local</strong> and <strong>Sydney</strong> <strong>Local</strong> <strong>Health</strong> <strong>District</strong> Page 14Marrickville <strong>Local</strong> Government AreaPopulation <strong>Health</strong> LGA/SLA Profile v1.1 March 2013
Marrickville <strong>Local</strong> Government Area <strong>Health</strong> ProfileFigure 10: Prevalence of selected chronic conditions vs Inner West <strong>Sydney</strong> and state comparators, 2007-08Source: Public <strong>Health</strong> Information Development Unit and Australian Bureau of Statistics 2007-08 National <strong>Health</strong> SurveyNote: ‘Mood disorders’ include depression, anxiety, dysthymia and bipolar ; ‘Circulatory system conditions’ include ICD-10-AM codes I00 to I99;‘Respiratory system diseases’ include ICD-10-AM codes J00 to J99; Musculoskeletal conditions’ include ICD-10-AM codes M00 to M99.The information in Tables 8 and 9 reflecting the health status of <strong>NSW</strong> residents and residentscovered by the Inner West <strong>Sydney</strong> catchment has been extracted from the <strong>NSW</strong> Population<strong>Health</strong> Survey 2010 and 2011 Report on Adult <strong>Health</strong> and <strong>NSW</strong> <strong>Health</strong> Chief <strong>Health</strong> Officer’sReport 2010. Marrickville is one of the eight LGA’s in the catchment.People living in Inner West <strong>Sydney</strong> generally consider themselves to have good health. Ofparticular note is that self-reported diabetes rates are higher than for <strong>NSW</strong>.Table 8: Indicators reflecting health status of residents of Inner West <strong>Sydney</strong> and <strong>NSW</strong>IndicatorInner West <strong>NSW</strong><strong>Sydney</strong>Excellent, very good, or good self-rated health status by age, 81.3% 80.4%persons aged 16 years and over, 2011Current asthma, persons aged 16 years and over, 2010 8.8% 11.3%Diabetes or high blood glucose, persons aged 16 years and over, 8.5% 7.4%2010Hysterectomy, females aged 20-69, 2010 6.6% 11.3%Overweight and obesity, persons aged 16 years and over, 2011 46.7% 52.2%Visited a dental professional in the last 12 months, people aged 16 59.1% 58.6%and over, 2010Has private health insurance for dental expenses, people aged 16 51.3% 51.2%and over, 2010Source: <strong>NSW</strong> Population <strong>Health</strong> Survey 2010 and 2011 (HOIST). Centre for Epidemiology and Research, <strong>NSW</strong> Ministry of <strong>Health</strong>.Table 9 highlights various health indicators and compares residents of Marrickville to those of<strong>NSW</strong> overall. This data is reported on the <strong>NSW</strong> <strong>Health</strong> Statistics website and is drawn fromvarious <strong>NSW</strong> Ministry of <strong>Health</strong> and Australian Bureau of Statistics sources. Of note is thatMarrickville residents are significantly more likely to be hospitalised for chronic obstructivepulmonary disease, fall related injuries (for people aged 65+) and for alcohol attributable causesthan the rest of the State. However, Marrickville residents are significantly less likely to behospitalised in general (including for preventable reasons, for diabetes, coronary heart disease,smoking and high body mass (BMI) attributable reasons) than in general for <strong>NSW</strong>. They are alsosignificantly less likely than the overall <strong>NSW</strong> population to die from high BMI attributablecauses.Inner West <strong>Sydney</strong> Medicare <strong>Local</strong> and <strong>Sydney</strong> <strong>Local</strong> <strong>Health</strong> <strong>District</strong> Page 15Marrickville <strong>Local</strong> Government AreaPopulation <strong>Health</strong> LGA/SLA Profile v1.1 March 2013
Marrickville <strong>Local</strong> Government Area <strong>Health</strong> ProfileTable 9: Indicators reflecting health status of residents, Marrickville LGA and <strong>NSW</strong>Indicator Marrickville <strong>NSW</strong>(Ratio only)Hospitalisations 2009-10 to 2010-11, smoothed number of 24,605 (100)separations per year, Smoothed Standardised Separation Ratio(sSSR) 19(90.7) -Potentially preventable hospitalisations 2009-10 to 2010-11, 1,533(100)smoothed number of separations (sSSR)(86.6) -Diabetes hospitalisations 2009-10 to 2010-11, smoothed number of 164(100)separations per year (sSSR)(88.1) --Coronary heart disease hospitalisations 2009-10 to 2010-11 247(100)smoothed number of hospitalisations per year (sSSR)Chronic obstructive pulmonary disease hospitalisations, personsaged 65+, 2008-09 to 2009-10 smoothed number of hospitalisationsper year (sSSR)High body mass index attributable hospitalisations, smoothednumber of separations per year 2008-09 to 2009-10 (sSSR)Alcohol attributable hospitalisations, 2009 – 2010 to 2010 – 2011,smoothed number of hospitalisations per year, (sSSR)Smoking attributable hospitalisations, 2009 – 2010 to 2010 – 2011,smoothed number of hospitalisations per year (sSSR)Fall-related injury hospitalisations, persons aged 65 years andover, 2008-2009 to 2009-2010 combined, smoothed number ofhospitalisations per year (sSSR)Potentially avoidable deaths, persons aged under 75 years, 2006 to2007 combined, smoothed number of deaths per year, SmoothedStandardised Mortality Ratio (sSMR) 20Deaths potentially avoidable by primary prevention, persons agedunder 75 years, 2006 to 2007 combined, smoothed number ofdeaths per year (sSMR)Potentially avoidable deaths from causes amenable to health care,persons aged under 75 years, 2006 to 2007 combined, smoothednumber of deaths per year (sSMR)(56.2) -148(121.6) +262(71.6) -633(118.1) +354(86.3) -284(125.7) +111(106.4)68(107.9)43(102.9)High body mass attributable deaths 2006 to 2007, Smoothed 20(100)Number of Deaths per Year (sSMR)(74.9) --Smoking attributable deaths, 2006 to 2007, smoothed number of 50(100)deaths per year (sSMR)(111.5)Alcohol attributable deaths, 2006 to 2007, smoothed number of 15(100)deaths per year (sSMR)(119.6)Source: <strong>NSW</strong> <strong>Health</strong> Chief <strong>Health</strong> Officer’s Report 2010, http://www.health.nsw.gov.au/Public<strong>Health</strong>/hsnsw/indicator_list.asp--below State average at 5% level of significance; - below State average at 1% level of significance++ above State average at 5% level of significance, + above State average at 1% level of significance(100)(100)(100)(100)(100)(100)(100)(100)Table 10 provide details of the ten most common reasons for hospitalisation in 2010/11 forMarrickville residents:19The smoothed Standardised Separation Ratio (sSSR,) can be interpreted as a 'relative risk', and is compared to the <strong>NSW</strong> average which is set to100.20The smoothed Standardised Mortality Ratio (sSMR,) can be interpreted as a 'relative risk', and is compared to the <strong>NSW</strong> average which is set to100.Inner West <strong>Sydney</strong> Medicare <strong>Local</strong> and <strong>Sydney</strong> <strong>Local</strong> <strong>Health</strong> <strong>District</strong> Page 16Marrickville <strong>Local</strong> Government AreaPopulation <strong>Health</strong> LGA/SLA Profile v1.1 March 2013
Marrickville <strong>Local</strong> Government Area <strong>Health</strong> ProfileTable 10: Ten most common reasons for hospitalisation in 2010/11 in the Ashfield LGA and <strong>NSW</strong><strong>NSW</strong> 2010/11s Marrickville MarrickvilleRank<strong>NSW</strong>Separations<strong>NSW</strong>RankDigestive system 2944 (16.63%) 1 27803 (16.59%) 1Pregnancy, childbirth and the puerperium 2497 (14.10%) 2 17482 (10.43%) 2Musculoskeletal system and connective 1840 (10.39%) 3 16756 (10.00%) 3tissueCirculatory system 1179 (6.66%) 4 13753 (8.21%) 4Female reproductive system 1155 (6.52%) 5 9897 (5.91%) 5Respiratory system 1045(5.90%) 6 9627 (5.75%) 6Ear, nose, mouth and throat 1010 (5.70%) 7 8905 (5.31%) 7Nervous system 869 (4.91%) 8 8877 (5.30%) 8Skin, subcutaneous tissue and breast 831 (4.69%) 9 8296 (4.95%) 9Eye 728( 4.11%) 10 7632 (4.55%) 11Source: <strong>Sydney</strong> <strong>Local</strong> <strong>Health</strong> <strong>District</strong>, Flow Info V. 11.04.2 CANCERFigure 11 shows that the incidence of all cancer types within the Marrickville LGA is equal to orslightly lower than the catchment and <strong>NSW</strong> benchmark rates, with the exception of lung cancer.This high incidence of lung cancer may be attributed to the high prevalence of smoking inMarrickville. As illustrated in Figure 12, there is a direct link between the prevalence of smokingand the incidence of lung cancer in most LGAs within the catchment.Figure 11: Incidence of selected cancers per 1,000 persons vs Inner West <strong>Sydney</strong> and state comparators,2004 to 2008Source: Cancer Institute <strong>NSW</strong> (2010); Note: Incidences reported are crude rates (not age-standardised)Inner West <strong>Sydney</strong> Medicare <strong>Local</strong> and <strong>Sydney</strong> <strong>Local</strong> <strong>Health</strong> <strong>District</strong> Page 17Marrickville <strong>Local</strong> Government AreaPopulation <strong>Health</strong> LGA/SLA Profile v1.1 March 2013
Marrickville <strong>Local</strong> Government Area <strong>Health</strong> ProfileFigure 12: Smokers as % of total population versus lung cancer incidence across the Inner West <strong>Sydney</strong>Source: Cancer Institute <strong>NSW</strong> (2010)Information on cancer screening rates is not available at an LGA level. At an LHD level, cancerscreening information is available for both breast and cervical cancer screening.The <strong>NSW</strong> Cancer Plan includes a target to increase breast cancer screening participation in theage group 50-69 years so that over 70% of women aged 50-69 years have 2 yearly mammogramsby 2010. In the period 2009-2010, the participation rate in SLHD was 47%, compared to 52.7%for <strong>NSW</strong>. 21Cervical cancer screening rates in <strong>NSW</strong> for women aged 20 - 69 in 2009 and 2010 combinedwere 56.5% and in Inner West <strong>Sydney</strong> were for the period 2009 - 2010 were 54.9% 22The count and age standardised incidence rates (per 100,000) for cancers (2004-2008) in theMarrickville LGA and <strong>NSW</strong> are presented in Table 11. Over this period, 1,540 people from theMarrickville LGA were diagnosed with cancer, a rate of 61.5 per 100,000 (less than the state rateof 483.2 per 100,000). The most common cancers were prostate, breast and lung. Incidencerates for colon, rectal, stomach, thyroid, ovarian, liver, brain, uterine and cervical cancer andnon-Hodgkins lymphoma were higher than for the state.21<strong>Health</strong> Statistics <strong>NSW</strong> http://www.healthstats.nsw.gov.au/Indicator/can_brstscr_lhn. Accessed 19 November 201222<strong>Health</strong> Statistics <strong>NSW</strong> http://www.healthstats.nsw.gov.au/Indicator/can_cervscr_lhn. Accessed 19 November 2012Inner West <strong>Sydney</strong> Medicare <strong>Local</strong> and <strong>Sydney</strong> <strong>Local</strong> <strong>Health</strong> <strong>District</strong> Page 18Marrickville <strong>Local</strong> Government AreaPopulation <strong>Health</strong> LGA/SLA Profile v1.1 March 2013
Marrickville <strong>Local</strong> Government Area <strong>Health</strong> ProfileTable 11: Count and age standardised incidence rates (per 100,000) for cancers, 2004 – 2008, Marrickville LGAand <strong>NSW</strong>Cancer Site Marrickville <strong>NSW</strong>CountStandardisedIncidenceRate/100,000CountStandardisedIncidenceRate/100,000All Cancers 1,540 461.5 177,519 483.2Bladder 32 10.4 3,631 9.7Brain 17 5.1 2,356 6.6Breast 201 55.4 21,102 58.2Cervix 14 3.4 1,228 3.5Colon 141 44.6 15,072 40.6Head and Neck 54 15.5 4,686 12.8Kidney 45 13.4 4,857 13.2Leukaemia 39 11.8 4,605 12.6Lip 8 2.4 1,203 3.3Liver 36 11 2,088 5.7Lung 178 56 15,905 43Melanoma 94 26.2 17,716 48.8Mesothelioma 8 2.5 1,047 2.8Non-Hodgkins Lymphoma 67 19.9 6,828 18.6Oesophagus 16 4.9 2,024 5.4Ovaries 26 7.7 2,191 6Pancreas 44 13.2 4,062 10.9Prostate 202 63.2 31,321 84.4Rectal 58 18 8,338 22.6Stomach 30 9.5 3,275 8.8Testicles 11 2 1,084 3.2Thyroid 45 11.2 3,301 9.4Uterus 27 8.4 3,043 8.3Cancer at Indef & Unspec Site 46 14.7 6,014 16Other Cancers 101 31.1 10,542 28.8Source: Incidence and Mortality data is from the <strong>NSW</strong> Central Cancer Registry. Population estimates are from HOIST, Epidemiology andSurveillance Branch, <strong>NSW</strong> <strong>Health</strong> Department. 23The count and age standardised mortality rates (per 100,000) for cancers (2004 – 2008) in theMarrickville LGA and <strong>NSW</strong> are presented in Table 12. Over this period 673 residents ofMarrickville LGA died from cancer, representing a higher rate than that for <strong>NSW</strong>. The threemain cancers causing death were (in descending order) lung, colon and breast. Mortality ratesfor lung, colon, breast, prostate, pancreatic, head and neck, stomach, liver, ovarian, oesophagus,kidney and uterine cancer, non-Hodgkins lymphoma, leukaemia were higher than for the state.23Cancer Institute <strong>NSW</strong>, Central Cancer Registry Statistical Reporting Module website. Accessed 10 November 2012. Available at:http://www.cancerinstitute.org.au/data-and-statistics/cancer-statistics/online-statistics-moduleInner West <strong>Sydney</strong> Medicare <strong>Local</strong> and <strong>Sydney</strong> <strong>Local</strong> <strong>Health</strong> <strong>District</strong> Page 19Marrickville <strong>Local</strong> Government AreaPopulation <strong>Health</strong> LGA/SLA Profile v1.1 March 2013
Marrickville <strong>Local</strong> Government Area <strong>Health</strong> ProfileTable 12: Count and age standardised mortality rates (per 100,000) for cancers, 2004 – 2008,Marrickville LGA and <strong>NSW</strong>Cancer Site Marrickville <strong>NSW</strong>CountMortalityRate/100,000CountMortalityRate/100,000All Cancers 673 213.5 66,228 176.9Bladder 11 3.6 1,644 4.3Brain 13 3.9 1,716 4.7Breast 52 15.9 4,693 12.6Cervix NA NA 415 1.1Colon 61 19.9 5,511 14.6Head and Neck 23 7.3 1,762 4.7Kidney 14 4.4 1,605 4.3Leukaemia 19 6.2 2,248 6Lip NA NA NA NALiver 20 6.1 1,527 4.1Lung 157 50.2 12,781 34.4Melanoma of skin 13 4 2,314 6.2Mesothelioma 7 2.3 947 2.5Non-Hodgkins Lymphoma 30 9.5 2,569 6.8Oesophagus 16 4.9 1,590 4.2Ovaries 20 6.2 1,394 3.7Pancreas 38 11.7 3,611 9.6Prostate 40 13.3 4,904 12.8Rectal 24 7.8 3,018 8.1Stomach 21 6.7 2,232 6Testicles NA NA NA NAThyroid NA NA 168 0.4Uterus 7 2 614 1.6Cancer at Indef & Unspec Site 38 12.2 4,473 11.8Other Cancers 41 12.9 4,411 11.8Source: Incidence and Mortality data is from the <strong>NSW</strong> Central Cancer Registry. Population estimates are from HOIST, Epidemiology andSurveillance Branch, <strong>NSW</strong> <strong>Health</strong> Department. 24 ; NA denotes no figure available as total count was under 5 254.3 MORTALITYThe median age of death for and deaths from all causes for residents of the Marrickville LGAand <strong>NSW</strong> is provided in Table 13.24Cancer Institute <strong>NSW</strong>, Central Cancer Registry Statistical Reporting Module website. Accessed 10 November 2012. Available at:http://www.cancerinstitute.org.au/data-and-statistics/cancer-statistics/online-statistics-module25 Additional information relating to Cancer can be obtained from the Cancer Institute <strong>NSW</strong>, Central Cancer Registry Statistical ReportingModule web page. Available at: http://www.statistics.cancerinstitute.org.au/Inner West <strong>Sydney</strong> Medicare <strong>Local</strong> and <strong>Sydney</strong> <strong>Local</strong> <strong>Health</strong> <strong>District</strong> Page 20Marrickville <strong>Local</strong> Government AreaPopulation <strong>Health</strong> LGA/SLA Profile v1.1 March 2013
Marrickville <strong>Local</strong> Government Area <strong>Health</strong> ProfileTable 13: Life expectancy and deaths from all causes for residents of the Marrickville LGA and <strong>NSW</strong>Indicator Marrickville <strong>NSW</strong>Deaths from all causes 2011, Indirectly Standardised 5.9 5.7Death Rate ^Deaths from suicide and self-inflicted injuries 2003- 9.8 9.32007, average annual ASR 26 per 100,000 population #Males Females Males FemalesMedian Age of Death 2003 - 2007 27 74 82 77 83Source: ^SSWLHD & SLHD Centre for Research, Evidence Management and Surveillance; # Public <strong>Health</strong> Information Development Unit(2012)Rates of avoidable mortality in Marrickville are approximately 20% higher than both Inner West<strong>Sydney</strong> and <strong>NSW</strong>, as illustrated in Figure 13. This rate is the third-highest of any LGA in thecatchment, behind <strong>Sydney</strong> South and <strong>Sydney</strong> West.Figure 13: Avoidable mortality * per 1,000 persons vs Inner West <strong>Sydney</strong> and state comparatorsSource: Public <strong>Health</strong> Information and Development Unit and Australian Bureau of Statistics (2012)Note: * Data relates to persons aged from 0 to 74 years where mortality is caused by a number of conditions specified by the Public <strong>Health</strong>Information Development Unit. Mortality rates reported are crude rates (not age-standardised).Figure 14 illustrates the causes of premature mortality, by condition, and shows that deaths fromcancer (1.09 persons per 1,000) and to a lesser extent circulatory system disease (0.77 persons per1,000) are likely to be significant drivers underpinning the high rate of premature mortality inMarrickville.26ASR denotes indirectly age-standardised rate per 100,000 population27Public <strong>Health</strong> Information Development Unit Social <strong>Health</strong> Atlas of Australia: Statistical <strong>Local</strong> Area and <strong>Local</strong> Government Area 2012 http://http://www.publichealth.gov.au/data/social-health-atlas-of-australia%3a-statistical-local-area-and-local-government-area_-published-2012.htmlaccessed 10/11/12Inner West <strong>Sydney</strong> Medicare <strong>Local</strong> and <strong>Sydney</strong> <strong>Local</strong> <strong>Health</strong> <strong>District</strong> Page 21Marrickville <strong>Local</strong> Government AreaPopulation <strong>Health</strong> LGA/SLA Profile v1.1 March 2013
Marrickville <strong>Local</strong> Government Area <strong>Health</strong> ProfileFigure 14: Premature mortality * from chronic disease (ages 0 to 74 years) and external causes per 1,000persons vs Inner West <strong>Sydney</strong> and state comparators, 2003 to 2007Source: Public <strong>Health</strong> Information and Development Unit and Australian Bureau of Statistics (2012)Note: * ‘Premature mortality’ is defined by PHIDU as mortality occurring prior to 75 years of age;‘Circulatory system conditions’ include ICD-10-AM codes I00 to I99; ‘Respiratory system diseases’ include ICD-10-AM codes J00 to J99;‘External causes’ include deaths arising from transport accidents, accidental falls, accidental poisoning, assault and suicide;Death rates reported are crude rates (not age-standardised).4.4 INFECTIOUS DISEASESIn New South Wales, Inner West <strong>Sydney</strong> has the highest rate of Hepatitis B virus reflecting ahigh population from East Asian countries. Inner West <strong>Sydney</strong> has the second highest rate ofHIV (reflecting a high population of gay and other homosexually active men) and the secondhighest rate of HCV (reflecting high rates of injecting drug use). <strong>Sydney</strong> and Marrickville havethe highest rates Chlamydia. 28The prevalence of Chlamydia (16.5 cases per 1,000 persons) is 18% higher than the catchmentoverall 29 and the second-highest of any LGA in the catchment, behind <strong>Sydney</strong> (37.0 cases per1,000 persons).The challenges posed by sexually transmissible infections are underlined by the fact thatMarrickville is also second-only to the City of <strong>Sydney</strong> in terms of the prevalence of Gonorrhoea(5.4 cases per 1,000 persons), Syphilis (1.6 cases per 1,000 persons) and Hepatitis C (4.3 cases per1,000 persons).28 Australian Society for HIV Medicine29STI prevalence across the ML have been derived by <strong>Health</strong>Consult based on data obtained from the <strong>Sydney</strong> <strong>Local</strong> <strong>Health</strong> <strong>District</strong>Inner West <strong>Sydney</strong> Medicare <strong>Local</strong> and <strong>Sydney</strong> <strong>Local</strong> <strong>Health</strong> <strong>District</strong> Page 22Marrickville <strong>Local</strong> Government AreaPopulation <strong>Health</strong> LGA/SLA Profile v1.1 March 2013
Marrickville <strong>Local</strong> Government Area <strong>Health</strong> ProfileFigure 15: Prevalence of sexually transmissible infections per 1,000 persons vs Inner West <strong>Sydney</strong> and statecomparators, 1998 to 2009Source: <strong>Sydney</strong> <strong>Local</strong> <strong>Health</strong> <strong>District</strong> and <strong>NSW</strong> <strong>Health</strong> Centre for Epidemiology and Research (2010)Note: Rates reported are crude (not age standardised)4.5 DISABILITYFigure 16 shows that the proportion of persons that require assistance with core activities ishigher in Marrickville than across both the catchment and <strong>NSW</strong> for all persons aged 60 yearsand above. This gap widens with age, with 4.1% more persons in Marrickville aged 70 to 79years requiring assistance compared to the overall catchment. The difference between rates ofdisability in Marrickville and the overall catchment rise to 6.4% for persons aged 80 years andabove.Figure 16: Proportion of persons requiring assistance with core activities * vs Inner West <strong>Sydney</strong> and statecomparators, 2011Source: Australian Bureau of Statistics (2011)Note: * ‘Core activities’ are defined by the ABS as needing help in one or more of three activity areas of self-care, mobility and communication’Inner West <strong>Sydney</strong> Medicare <strong>Local</strong> and <strong>Sydney</strong> <strong>Local</strong> <strong>Health</strong> <strong>District</strong> Page 23Marrickville <strong>Local</strong> Government AreaPopulation <strong>Health</strong> LGA/SLA Profile v1.1 March 2013
Marrickville <strong>Local</strong> Government Area <strong>Health</strong> Profile5<strong>Health</strong> service utilisationHeadlines Primary care services in Marrickville during 2009/10 were approximately equivalent tothe per-capita rates across the catchment and <strong>NSW</strong>; Higher rates of service for GP mental health care plans (93.1 per 1,000 persons) thanthe Inner-West <strong>Sydney</strong> (76.1 per 1,000 persons) and <strong>NSW</strong> (81.2 per 1,000 persons); Practice Nurse services per-capita in Marrickville are among the highest of any LGAin the catchment, just behind Canada Bay (Concord) and Canada Bay (Drummoyne) On a per-capita basis, Marrickville residents present to emergency departments for alltriage classifications much more often than across the broader catchment; Highest rate of preventable hospitalisations for ambulatory-care sensitive conditionsof any LGA in the catchment; and The proportion of the Indigenous population that are HACC clients (3.6%) is wellbelow the proportion within the overall catchment (4.8%) and <strong>NSW</strong> (5.5%).5.1 PRIMARY CARE UTILISATIONMedicare data shows that primary care services billed to the Medicare Benefits Schedule (MBS)in Marrickville during 2009/10 were approximately equivalent to the per-capita rates across thecatchment and <strong>NSW</strong>, but included marginally higher rates of service for GP mental health careplans (93.1 per 1,000 persons) than Inner West <strong>Sydney</strong> (76.1 per 1,000 persons) and <strong>NSW</strong> (81.2per 1,000 persons). This may be due to the high level of psychological distress and mooddisorders in Marrickville, which are illustrated in Figures 8 and 10 respectively.Figure 17 also shows a lower number of Practice Nurse services per-capita in Marrickville (170.9services per 1,000 persons), compared to the average across <strong>NSW</strong> (296.2 services per 1,000persons). In spite of this result, Practice Nurse services per-capita in Marrickville are among thehighest of any LGA in the catchment, just behind Canada Bay (Concord) and Canada Bay(Drummoyne) 30 .30Public <strong>Health</strong> Information Development Unit and Department of <strong>Health</strong> and Ageing (2012)Inner West <strong>Sydney</strong> Medicare <strong>Local</strong> and <strong>Sydney</strong> <strong>Local</strong> <strong>Health</strong> <strong>District</strong> Page 24Marrickville <strong>Local</strong> Government AreaPopulation <strong>Health</strong> LGA/SLA Profile v1.1 March 2013
Marrickville <strong>Local</strong> Government Area <strong>Health</strong> ProfileFigure 17: Selected primary care services per 1,000 persons, vs Inner West <strong>Sydney</strong> and state comparators,2010Source: Public <strong>Health</strong> Information Development Unit and Department of <strong>Health</strong> and Ageing (2012)5.2 EMERGENCYTable 14 provides analysis of 2011-12 Emergency Department (ED) data across all three publichospitals within Inner West <strong>Sydney</strong>, and shows that residents of the Marrickville LGA made17,304 visits to EDs within the catchment area, which represents 12.5% of all ED visits tohospitals within Inner West <strong>Sydney</strong> catchment area overall, and 17.2% of ED visits for allpersons living within Inner West <strong>Sydney</strong> catchment area.Table 14 shows that Marrickville residents presented most often to the Royal Prince AlfredHospital when seeking emergency services (90.3%). Services provided to Marrickville residentscomprised 23.1% of the Royal Prince Alfred Hospital’s total ED caseload in 2011-12.Table 14: Emergency department presentations by hospital, 2011-12Canterbury Concord Royal PrinceHospital Hospital Alfred HospitalTotalPresentations from Marrickville LGA 1,378 (7.9%) 306 (1.8%) 15,620 (90.3%) 17,304 (100%)ED presentations for all persons (within and outside Inner West <strong>Sydney</strong> Medicare <strong>Local</strong>)Total ED presentations for hospital(all persons)35,998 (26.0%) 34,629 (25.1%) 67,586 (48.9%) 138,213 (100%)Marrickville % of Total 3.8% 0.9% 23.1% 12.5%Source: Statewide Emergency DataData relating to patient triage classification per 1,000 persons is provided in Table 15. Table 15shows that on a per-capita basis, Marrickville residents present to emergency departments for alltriage classifications much more often than across the broader catchment.Within the overall Inner West <strong>Sydney</strong> catchment area, Marrickville has the highest crudeincidence of ‘emergency’ and ‘non-urgent’ ED presentations per-capita; the second most numberof ‘resuscitation’ and ‘urgent’ presentations per-capita; and the fourth-highest number of ‘semiurgent’ED presentations per-capita. The results for ‘emergency’ and ‘non-urgent’ triageclassifications, are 41% and 80% higher respectively, than across the overall catchment.Inner West <strong>Sydney</strong> Medicare <strong>Local</strong> and <strong>Sydney</strong> <strong>Local</strong> <strong>Health</strong> <strong>District</strong> Page 25Marrickville <strong>Local</strong> Government AreaPopulation <strong>Health</strong> LGA/SLA Profile v1.1 March 2013
Marrickville <strong>Local</strong> Government Area <strong>Health</strong> ProfileTable 15: Emergency department presentations per capita, by triage category, 2011-12LGATriage classification - number of persons per 1,000Resuscitation Emergency Urgent Semi-urgent Non-urgentAshfield 1.36 13.15 58.57 64.01 13.66Burwood 1.94 17.52 90.55 119.81 14.16Canada Bay 1.17 14.26 62.45 87.51 11.43Canterbury 1.33 14.17 82.05 90.89 10.35Leichhardt 0.84 14.81 59.20 55.92 20.10Marrickville 1.70 20.77 82.51 80.17 28.20Strathfield 0.99 9.49 48.74 72.50 7.25<strong>Sydney</strong> South 0.69 8.76 35.15 33.17 12.88<strong>Sydney</strong> West 0.75 15.31 60.39 59.30 23.67Inner West <strong>Sydney</strong> 1.24 14.73 68.56 77.22 15.63Source: Statewide Emergency Data provided by Inner West <strong>Sydney</strong> Medicare <strong>Local</strong>5.3 AMBULATORY-CARE SENSITIVE ADMISSIONSFigure 18 shows potentially preventable hospitalisations resulting from Ambulatory-CareSensitive Conditions (ACSCs). ACSCs are those conditions for which hospitalisation is thoughtto be avoidable with the application of primary care, public health interventions and earlyinterventions. High rates of hospital admissions for ACSCs may provide indirect evidence ofproblems with patient access to primary healthcare, inadequate skills and resources, ordisconnection with specialist services. 31 ACSC’s include vaccine-preventable conditions, selectedacute conditions and selected chronic conditions that are modifiable through behaviour andlifestyle change.Preventable hospitalisations resulting from ACSCs in Marrickville (22.6 per 1,000 persons) areapproximately 19% higher than the average across the catchment (18.9 per 1,000 persons) 32 ,which places Marrickville as the LGA with the greatest number of preventable hospitalisationsfor ACSCs of any LGA or SLA within Inner West <strong>Sydney</strong> 33 .Figure 18: Preventable hospitalisations for ambulatory-care sensitive conditions per 1,000 persons * vs InnerWest <strong>Sydney</strong> and state comparators, 2009-10 to 2011-12Source: <strong>NSW</strong> <strong>Health</strong> Centre for Epidemiology and Evidence (2011); Rates reported are indirectly standardised by age and gender.31 Victorian Department of <strong>Health</strong>, http://www.health.vic.gov.au/healthstatus/admin/acsc/index.htm32Average across the Medicare <strong>Local</strong> has been derived by <strong>Health</strong>Consult using 2010-11 data sourced from the <strong>NSW</strong> <strong>Health</strong> Centre forEpidemiology and Evidence33<strong>NSW</strong> <strong>Health</strong> Centre for Epidemiology and Evidence (2010-11)Inner West <strong>Sydney</strong> Medicare <strong>Local</strong> and <strong>Sydney</strong> <strong>Local</strong> <strong>Health</strong> <strong>District</strong> Page 26Marrickville <strong>Local</strong> Government AreaPopulation <strong>Health</strong> LGA/SLA Profile v1.1 March 2013
Marrickville <strong>Local</strong> Government Area <strong>Health</strong> Profile5.4 HOME AND COMMUNITY CAREFigure 19 shows the profile of Home and Community Care (HACC) clients in Marrickville, ascompared to the total Inner West <strong>Sydney</strong> catchment and <strong>NSW</strong>. The proportion of theIndigenous population that are HACC clients (3.6%) is well below the proportion within theoverall catchment (4.8%) and <strong>NSW</strong> (5.5%). This rate is somewhat surprising, considering thehigh proportion of Indigenous persons within the Marrickville LGA. The proportion of HACCclients that do not speak English is marginally higher than the catchment overall, and theproportion of clients with a carer and those living alone are broadly in line with the catchmentaverage.Figure 19: HACC client profile vs Inner West <strong>Sydney</strong> and state comparators, 2010-11Source: Public <strong>Health</strong> Information Development Unit and Department of <strong>Health</strong> and Ageing (2012)Figure 20 provides a comparison of selected HACC services in Marrickville, compared to thecatchment and <strong>NSW</strong>. It shows that HACC clients located in Marrickville received a much lowernumber of allied health services at home, care counseling, care coordination and domesticassistance instances of care per 1,000 persons, compared to the catchment overall. However, theper-capita number of case management, centre-based day care and transport instances of care arefar higher in Marrickville than across the catchment.Figure 20: HACC service profile vs Inner West <strong>Sydney</strong> and state comparators, 2010-11Source: Public <strong>Health</strong> Information Development Unit and Department of <strong>Health</strong> and Ageing (2012);Note: Rates reported are indirectly standardised by age and gender.Inner West <strong>Sydney</strong> Medicare <strong>Local</strong> and <strong>Sydney</strong> <strong>Local</strong> <strong>Health</strong> <strong>District</strong> Page 27Marrickville <strong>Local</strong> Government AreaPopulation <strong>Health</strong> LGA/SLA Profile v1.1 March 2013
Marrickville <strong>Local</strong> Government Area <strong>Health</strong> Profile6<strong>Health</strong> service availabilityHeadlines The number of GPs per-capita in Marrickville is among the lowest of any LGA inInner West <strong>Sydney</strong> (1.23 GPs per 1,000 persons), and these doctors represent thegreatest proportion of GPs aged 55 years and over of any LGA in the catchment(48.9%); Marrickville has a lower average in the availability of almost all Allied <strong>Health</strong>practitioner types compared to the catchment; and The number of high-care and community aged care places per 1,000 persons aged 70+years is significantly greater than the number across the catchment overall.6.1 HOSPITALS AND DAY SURGERYThe Marrickville LGA has access to the 710 bed Royal Prince Alfred Hospital (RPAH) inCamperdown, the largest principal referral hospital in Inner West <strong>Sydney</strong>.The Marrickville LGA is also serviced by the Metropolitan Rehabilitation Private Hospital, whichis a 37 bed rehabilitation facility located in Petersham, and a public oral health clinic, as shown inTable 16.Table 16: Acute, aged care, mental health and day surgery facilities in Marrickville<strong>Health</strong> Service Name Service Type LocationPublic sector health servicesMarrickville Oral <strong>Health</strong> Clinic Oral <strong>Health</strong> Services MarrickvillePrivate sector health servicesInner West Endoscopy Centre Day Surgery MarrickvillePreterm Foundation Day Procedure Centre Day Surgery CamperdownMetropolitan Rehabilitation Private Hospital Private Hospitals PetershamSource: <strong>NSW</strong> <strong>Health</strong> Establishments Registration Online (HERO) database6.2 GENERAL PRACTICESelected characteristics of General Practitioners currently practicing in the Marrickville LGA arecompared to other LGAs in Figure 21. The number of GPs per-capita in Marrickville is amongthe lowest of any LGA in Inner West <strong>Sydney</strong> (1.23 GPs per 1,000 persons), and these doctorsrepresent the greatest proportion of GPs aged 55 years and over of any LGA in the catchment(48.9%) 34 . The number of GPs per-capita delivering aged care services and under the Access to34Based upon data provided by the Inner-West <strong>Sydney</strong> Medicare <strong>Local</strong>Inner West <strong>Sydney</strong> Medicare <strong>Local</strong> and <strong>Sydney</strong> <strong>Local</strong> <strong>Health</strong> <strong>District</strong> Page 28Marrickville <strong>Local</strong> Government AreaPopulation <strong>Health</strong> LGA/SLA Profile v1.1 March 2013
Marrickville <strong>Local</strong> Government Area <strong>Health</strong> ProfileAllied Psychological Services (ATAPS) program are broadly in line with the overall rate acrossthe catchment.Considering the overall poor health risks and diverse health needs of the Marrickville population,the availability and age profile of GPs within Marrickville poses a significant concern. Attractingadditional GPs and Practice Nurses to provide services in the area will be crucial to maintainingadequate supply to meet population health demands.Figure 21: GPs and services provided per 1,000 persons, comparison across the catchmentSource: Inner West <strong>Sydney</strong> Medicare <strong>Local</strong> (2012); Note: Rates reported are crude (not age standardised).6.3 ALLIED HEALTHFigure 22 shows the number of private allied health practitioners within the Marrickville LGA ona per-capita basis as compared to the catchment. Marrickville appears to have significantshortfalls in clinical psychology, optometry, pharmacy, physiotherapy and psychology.It will be important to ensure that the shortfall in allied health providers on a per-capita basis isaddressed to ensure the availability of services, particularly for those services which addressvarious health risks, such as overweight / obesity (dieticians), aged care /disability requirements(occupational therapists) and mental health issues (clinical psychologists and psychologists).Inner West <strong>Sydney</strong> Medicare <strong>Local</strong> and <strong>Sydney</strong> <strong>Local</strong> <strong>Health</strong> <strong>District</strong> Page 29Marrickville <strong>Local</strong> Government AreaPopulation <strong>Health</strong> LGA/SLA Profile v1.1 March 2013
Marrickville <strong>Local</strong> Government Area <strong>Health</strong> ProfileFigure 22: Number of selected private allied health practitioners per 1,000 personsSource: Inner West <strong>Sydney</strong> Medicare <strong>Local</strong>.Note: Data is not available at the state level regarding per-capita availability of all service providers. As a result, comparisons to <strong>NSW</strong> have notbeen shown in this Figure; Rates reported are crude (not age standardised).6.4 COMMUNITY HEALTH SERVICESThe availability of community health services in Marrickville is extensive, with a number offacilities that provide multiple services on the one campus, such as the Marrickville Child,Adolescent and Family <strong>Health</strong> Centre, Marrickville Community Mental <strong>Health</strong> Centre and theMarrickville Community <strong>Health</strong> CentreTable 17 shows that Marrickville is served by a large number of public and private mental healthfacilities.Marrickville also has the highest number of community child and family health services availableof any LGA in the catchment, based on listings of services published by the <strong>Sydney</strong> <strong>Local</strong> <strong>Health</strong><strong>District</strong> 35 . There are 15 listings for child and family health services using this source, includingpublicly available services in the areas of child health, occupational therapy, speech pathology,physiotherapy, social work, psychology, child health nursing, and child / family medical services.35 <strong>Sydney</strong> <strong>Local</strong> <strong>Health</strong> <strong>District</strong> (2012), accessed from http://www.slhd.nsw.gov.au/services.htmlInner West <strong>Sydney</strong> Medicare <strong>Local</strong> and <strong>Sydney</strong> <strong>Local</strong> <strong>Health</strong> <strong>District</strong> Page 30Marrickville <strong>Local</strong> Government AreaPopulation <strong>Health</strong> LGA/SLA Profile v1.1 March 2013
Marrickville <strong>Local</strong> Government Area <strong>Health</strong> ProfileTable 17: Community health facilities in Marrickville<strong>Health</strong> Service Name Service Type LocationPublic sector health servicesDulwich Hill Early Childhood Centre Child <strong>Health</strong> Services Dulwich HillMarrickville Child, Adolescent & Family <strong>Health</strong> Centre Child <strong>Health</strong> Services MarrickvilleNewtown Early Childhood <strong>Health</strong> Centre Child <strong>Health</strong> Services NewtownGladstone Hall Drug & Alcohol Program Community <strong>Health</strong> Services Dulwich HillMarrickville Child, Adolescent & Family <strong>Health</strong> Centre Community <strong>Health</strong> Services MarrickvilleMarrickville Community Mental <strong>Health</strong> Centre Community <strong>Health</strong> Services MarrickvilleMarrickville Living Skills Centre Community <strong>Health</strong> Services MarrickvilleGROW Mental <strong>Health</strong> Services LewishamMarrickville Community <strong>Health</strong> Centre Mental <strong>Health</strong> Services MarrickvilleMarrickville Community Mental <strong>Health</strong> Centre Mental <strong>Health</strong> Services MarrickvilleThe Cottage- Marrickville Living Skills Mental <strong>Health</strong> Services MarrickvilleMarrickville Child, Adolescent & Family <strong>Health</strong> Centre Youth <strong>Health</strong> Services MarrickvilleSource: <strong>NSW</strong> <strong>Health</strong> Establishments Registration Online (HERO) database6.5 AGED CAREMuch of the health-related care delivered to older people, people requiring rehabilitation, andtheir carers is delivered directly by the Aged Care and Rehabilitation (AC&R) service, a core partof the <strong>Sydney</strong> <strong>Local</strong> <strong>Health</strong> <strong>District</strong>. Other religious, charitable and community organisationsthroughout the inner-west areas of <strong>Sydney</strong> also provide services. As shown in Table 18, the<strong>NSW</strong> <strong>Health</strong> Establishment Registration Online database lists 12 private nursing home facilities,which are predominantly located within the suburb of Marrickville.Table 18: Aged care facilities in MarrickvillePrivate Nursing HomesArmon Nursing HomePetershamBethesda Nursing HomeMarrickvilleBooth House Nursing HomeMarrickvilleCastle Leap Nursing HomeMarrickvilleLewisham Nursing HomeLewishamMacellen Residential Aged Care FacilityMarrickvilleMaronite Sisters of the Holy Family Village, TheMarrickvilleMayfair Residential Aged Care FacilityMarrickvilleParkland Nursing HomeMarrickvilleRosedale Nursing HomeMarrickvilleStanmore Nursing HomeStanmoreWillandra Residential Aged Care FacilityMarrickvilleSource: <strong>NSW</strong> <strong>Health</strong> Establishments Registration Online (HERO) databaseLocationCommunity and residential aged care places available within the Marrickville LGA are illustratedin Figure 23. Overall, Marrickville appears to be very well-serviced in terms of aged care places,with the number of high-care and community aged care places per 1,000 persons aged 70+ beingsignificantly greater than the number across the catchment overall.Inner West <strong>Sydney</strong> Medicare <strong>Local</strong> and <strong>Sydney</strong> <strong>Local</strong> <strong>Health</strong> <strong>District</strong> Page 31Marrickville <strong>Local</strong> Government AreaPopulation <strong>Health</strong> LGA/SLA Profile v1.1 March 2013
Marrickville <strong>Local</strong> Government Area <strong>Health</strong> ProfileFigure 23: Aged care places per 1,000 persons aged 70+ vs Inner West <strong>Sydney</strong> and state comparators, 2010Source: Public <strong>Health</strong> Information Development Unit and Department of <strong>Health</strong> and Ageing (2012)Inner West <strong>Sydney</strong> Medicare <strong>Local</strong> and <strong>Sydney</strong> <strong>Local</strong> <strong>Health</strong> <strong>District</strong> Page 32Marrickville <strong>Local</strong> Government AreaPopulation <strong>Health</strong> LGA/SLA Profile v1.1 March 2013
Marrickville <strong>Local</strong> Government Area <strong>Health</strong> ProfileAppendix A: Postcode to LGA / SLA correspondencesIn a number of cases, data was only available at the postcode level, rather than a LGA or SLAlevel. Where this occurred, the data at the postcode level has been mapped to the LGA or SLAaccording to the correspondences shown in Table A.1. The correspondences in Table A.1 arebased upon published data sourced from the Australian Bureau of Statistics regarding postcodeto SLA or LGA mappings detemined under the Australian Standard Geographical Classification.In a number of cases, a single postcode spans a number of LGAs or SLAs. Where this occurs,<strong>Health</strong>Consult has only considered those postcode where more than 10% are within an LGA orSLA boundary.Table A.1: Postcode to SLA / LGA correspondencesLGA / SLAAshfieldBurwoodCanterburyCanada Bay% WITHINPOSTCODE LGABOUNDARY2045 99.62LGA / SLA% WITHINPOSTCODE LGABOUNDARY2038 98.952130 99.97 2039 100.00Leichhardt2131 100.00 2040 99.992132 40.71 2041 100.002132 59.292042 60.982133 51.54 2044 99.742134 100.00 2048 99.952135 20.33 Marrickville2049 100.002136 52.34 2050 40.172133 40.35 2203 100.002191 78.20 2204 99.962192 100.002129 100.002193 95.86 2135 72.702194 100.00 Strathfield2136 47.662195 100.00 2140 100.002196 74.57 2191 21.802206 100.002008 33.622208 50.22 2015 100.002209 32.92 2016 100.002210 17.78 <strong>Sydney</strong> South 2017 100.002046 100.00 2018 37.022047 100.00 2042 39.022137 100.00 2043 100.002138 100.00<strong>Sydney</strong> West2006 100.002139 100.00 2007 92.592008 66.382009 100.002037 100.002050 59.83Inner West <strong>Sydney</strong> Medicare <strong>Local</strong> and <strong>Sydney</strong> <strong>Local</strong> <strong>Health</strong> <strong>District</strong> Page 33Marrickville <strong>Local</strong> Government AreaPopulation <strong>Health</strong> LGA/SLA Profile v1.1 March 2013
Marrickville <strong>Local</strong> Government Area <strong>Health</strong> ProfileAppendix B: Data limitations and assumptionsB.1.DATA SOURCESThe background paper to Medicare <strong>Local</strong>s <strong>Health</strong> Needs Assessment and Planning released bythe Commonwealth Department of <strong>Health</strong> and Ageing states that “Medicare <strong>Local</strong>s will berequired to have an excellent understanding of their catchment area…which will involveMedicare <strong>Local</strong>s carrying out comprehensive and robust health needs assessment exercises andplanning”. The Department has not prescribed an approach to health needs assessment andplanning at this stage, but has developed an interim approach that aims to ensure that Medicare<strong>Local</strong>s’ Needs Assessment Reports “reflect on the specific characteristics and health care needsof their populations in determining which priority activities to pursue”.Unfortunately the breadth of detail required to inform the LGA/SLA profiles is not availablewithin a single data source. Accordingly, data has been sourced on a range of relevant indicatorsusing the most appropriate, recently available source for each indicator. In some cases, theabsence of complete data consistency across all indicators may require consumers of theLGA/SLA profiles to interpret some findings with caution, and this document aims to identifythose areas where this is most likely to be the case.The Consultant has attempted to source and attribute external data collections where possiblethroughout the document, either directly below tables or in footnotes at the bottom of eachpage. These references should be used in conjunction with this document when interpreting theLGA/SLA profiles.B.1.1PHIDU Social <strong>Health</strong> Atlas of AustraliaWherever possible, data underpinning the development of the LGA/SLA profiles have beendrawn from a single data source. In many cases data has been sourced from the August andOctober 2012 releases of the Social <strong>Health</strong> Atlas of Australia, which is compiled by the Public<strong>Health</strong> Information Development Unit (PHIDU), which is under the auspices of the Universityof Adelaide.The data obtained from PHIDU is provided at the LGA/SLA, Medicare <strong>Local</strong>, state andnational levels and includes a broad number of indicators that are relevant to population healthneeds. However, in a number of cases the data collections that underpin these indicators havebeen compiled by different organisations that use different sampling techniques andassumptions. Furthermore, the range of indicators presented in PHIDU’s Social <strong>Health</strong> Atlasuse data collected over different years. The breadth of data sources, collection techniques andcollection timeframes used in PHIDU’s Social <strong>Health</strong> Atlas should therefore be taken intoconsideration when interpreting the data, and readers should be cautious about drawing directcomparisons between indicators that are based upon data that has been collected at differenttimeframes, by different organisations, or using different assumptions.Some indicators presented within PHIDU’s Social <strong>Health</strong> Atlas of Australia are ‘syntheticpredictions’ that have been derived by PHIDU at the LGA or SLA level, based upon variousdifferent data collections. As a result, these predictions do not represent data collected inadministrative or other data sets, should be used with caution, and be treated as indicative of theprevalence of the health condition or risk factor in an area with these demographic andsocioeconomic characteristics. Synthetic predictions within the PHIDU dataset have been madeInner West <strong>Sydney</strong> Medicare <strong>Local</strong> and <strong>Sydney</strong> <strong>Local</strong> <strong>Health</strong> <strong>District</strong> Page 34Marrickville <strong>Local</strong> Government AreaPopulation <strong>Health</strong> LGA/SLA Profile v1.1 March 2013
Marrickville <strong>Local</strong> Government Area <strong>Health</strong> Profilefor indicators relating to the prevalence of chronic disease, private health insurance coverage andhealth risk factors.B.1.2 Other data sourcesAlthough PHIDU’s Social <strong>Health</strong> Atlas of Australia provides an excellent repository of datarelating to population health needs, it does not contain data on some other variables of interestthat <strong>Health</strong>Consult has deemed important to inform the LGA/SLA profiles.As a result, these data items have been sourced by the Consultant from a range of publicly andprivately-held data collections; predominantly the Australian Bureau of Statistics and <strong>Health</strong>Statistics New South Wales, but also a range of others.As stated above in relation to PHIDU data, the need to obtain data from a range of sourcesintroduces the possibility for misalignment of populations and assumptions when comparingdata across time periods, or from different data sources. Nonetheless, it has been necessary aspart of the development of the LGA/SLA profiles to draw conclusions between indicators thatare based upon different data collections. Although the LGA/SLA profiles have beenconstructed in such a way that the most relevant, recently available data has been used for eachindicator, it is important to recognise the limitations inherent in comparing data sourced fromdifferent collections, and over different timeframes.Considering the diversity of data sources used to construct the LGA/SLA profiles, data was notalways available for all indicators at the state, Medicare <strong>Local</strong> or LGA/SLA level. As a result,some indicators have been derived in order to provide comparisons between indicators at thesedifferent levels. Where benchmarks have been calculated by the Consultant they have beenidentified in footnotes to Tables and figures included in the LGA/SLA profiles. Consumersshould exercise caution when making comparisons between derived benchmarks and reportedresults.Inner West <strong>Sydney</strong> Medicare <strong>Local</strong> provided workforce data on private allied health provider forthis report. Note that this database is still being constructed and is subject to review.B.1.3 <strong>Health</strong> Risk Factors – definitionsThe data in Figure 8 are self-reported data, reported to interviewers in the 2007–08 National<strong>Health</strong> Survey.A current smoker is an adult (over 18 years of age) who reported at the time of interview thatthey smoked cigarettes, cigars or pipes at least once a week.Risky alcohol consumption was based on estimated alcohol consumption in the seven days priorto interview using two components – the number of days on which the respondent reportedconsuming alcohol in the previous week; and the quantity consumed in the most recent days onwhich they consumed alcohol. For people who drank on no more than three days in the lastweek, their daily consumption was simply the total consumed divided by seven. Harmful use ofalcohol is defined as average daily consumption of more than 75 ml (three standard drinks) formales and 50 ml (two standard drinks) for females.Physical inactivity is defined as those aged 15 years and over who did not exercise in the twoweeks prior to interview for the 2007–08 NHS, through sport, recreation or fitness (includingwalking).Inner West <strong>Sydney</strong> Medicare <strong>Local</strong> and <strong>Sydney</strong> <strong>Local</strong> <strong>Health</strong> <strong>District</strong> Page 35Marrickville <strong>Local</strong> Government AreaPopulation <strong>Health</strong> LGA/SLA Profile v1.1 March 2013
Marrickville <strong>Local</strong> Government Area <strong>Health</strong> ProfilePsychological Distress: This data is derived from the Kessler Psychological Distress Scale (K-10),which is a scale of non-specific psychological distress based on 10 questions asked ofrespondents about negative emotional states in the 4 weeks prior to interview. 'High' and ‘veryhigh’ distress are the two highest levels of distress categories (of a total of four categories).Overweight and Obesity: The BMI was calculated from self-reported height and weightinformation and grouped as follows to allow reporting against both World <strong>Health</strong> Organizationand National <strong>Health</strong> & Medical Research Council guidelines – normal range: 18.5 to less than20.0 and 20.0 to less than 25.0; overweight: 25.0 to less than 30.0; obese: 30.0 and greater.A list of ICD codes used as the basis for the calculation of ‘preventable mortality’ (Figure 14) isavailable at:http://www.publichealth.gov.au/pdf/atlases/avoid_mortality_aust_2006/avoid_mortality_appendix_full.pdfInner West <strong>Sydney</strong> Medicare <strong>Local</strong> and <strong>Sydney</strong> <strong>Local</strong> <strong>Health</strong> <strong>District</strong> Page 36Marrickville <strong>Local</strong> Government AreaPopulation <strong>Health</strong> LGA/SLA Profile v1.1 March 2013