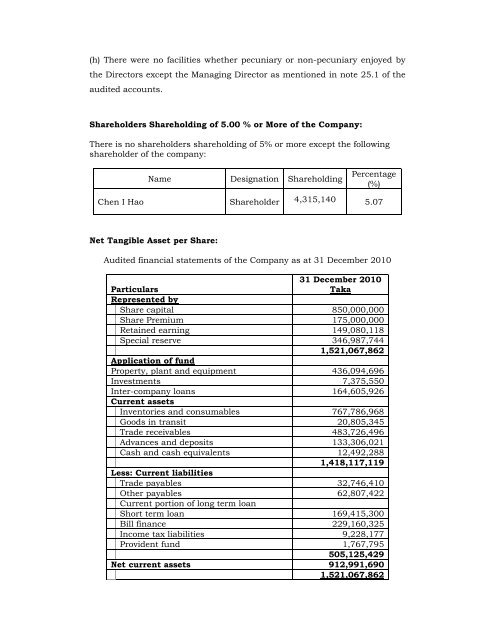
(h) There were no facilities whether pecuniary or non-pecuniary enjoyed bythe Directors except the Managing Director as mentioned in note 25.1 of theaudited accounts.Shareholders Shareholding of 5.00 % or More of the Company:There is no shareholders shareholding of 5% or more except the followingshareholder of the company:NameDesignation ShareholdingPercentage(%)Chen I Hao Shareholder 4,315,140 5.07Net Tangible Asset per Share:Audited financial statements of the Company as at 31 December 201031 December 2010ParticularsTakaRepresented byShare capital 850,000,000Share Premium 175,000,000Retained earning 149,080,118Special reserve 346,987,7441,521,067,862Application of fundProperty, plant and equipment 436,094,696Investments 7,375,550Inter-company loans 164,605,926Current assetsInventories and consumables 767,786,968Goods in transit 20,805,345Trade receivables 483,726,496Advances and deposits 133,306,021Cash and cash equivalents 12,492,2881,418,117,119Less: Current liabilitiesTrade payables 32,746,410Other payables 62,807,422Current portion of long term loanShort term loan 169,415,300Bill finance 229,160,325Income tax liabilities 9,228,177Provident fund 1,767,795505,125,429Net current assets 912,991,6901,521,067,862
Net Tangible Assets per ordinaryShare(Tk.) 17.89From the above calculation it appears that Net Tangible Assets Value perShare is Tk.17.89 which is higher than the offering price.Determination of Offering PriceThe issue price at Tk. 30 each including a premium of Tk. 20 per share isjustified as details below:(I)Net asset Value Per Share (NAV)The offering price of the common stock of <strong>LSI</strong> Industries Limited hasbeen determined by assessing the Net Asset Value (NAV). The financialcalculations are presented from the audited accounts as at 31December, 2010.NAV is also equivalent to the Equity Based Value per Share which isdepicted below:ParticularsAmount(BDT)Share capital 850,000,000Share premium 175,000,000Retained earnings 149,080,118Special reserve 346,987,744Total Shareholders’ Equity 1,521,067,862Total number of shares 85,000,000Equity Based Value Per Share 17.89(II)Earning Based Value per sharePeriodNet ProfitAfter TaxEarningsPer ShareJuly 2010-December2010 133,702,829 1.572009-2010 215,203,031 2.532008-2009 140,113,799 2.802007-2008 116,822,652 161.822006-2007 246,198,306 246.202005-2006 42,890,306 42.89Average 62,714,713 83.24(Amount in BDT)The weighted average net profit after tax for the last 5.50 years stands at Tk.162,714,713 and the weighted average EPS stands at Tk.83.24. The PriceEarning Multiple (PE) at issue price of Tk. 30.00 each including a premiumof Tk. 20.00 per share stands at PE 0.36 as opposed to the present PE ofTextile Industry 52.44 (as per DSE record) as on 30.12.2010. On the basis ofprice earnings multiple of 52.44 of Textile sector as on 30.12.2010, theearning based value of shares of the Company stands at Tk.4365.10 (52.44 x83.24), a price much higher than the price offered.Convertismly, If we consider average EPS of the last 2.5 years 2.76(1.57+2.53+2.80/2.5) and PE 15 (though PE of Textile sector is 52.44 as on30.12.2010) the earning based value of shares of the Company standsTk.41.40 (15.00 x 2.76), a price higher than the price offered.