Contents - ä¸å½æ£®æçç©å¤æ ·æ§çæµç½ç»
Contents - ä¸å½æ£®æçç©å¤æ ·æ§çæµç½ç»
Contents - ä¸å½æ£®æçç©å¤æ ·æ§çæµç½ç»
- No tags were found...

Create successful ePaper yourself
Turn your PDF publications into a flip-book with our unique Google optimized e-Paper software.
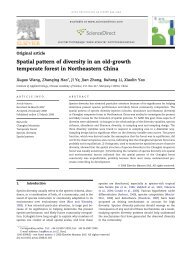
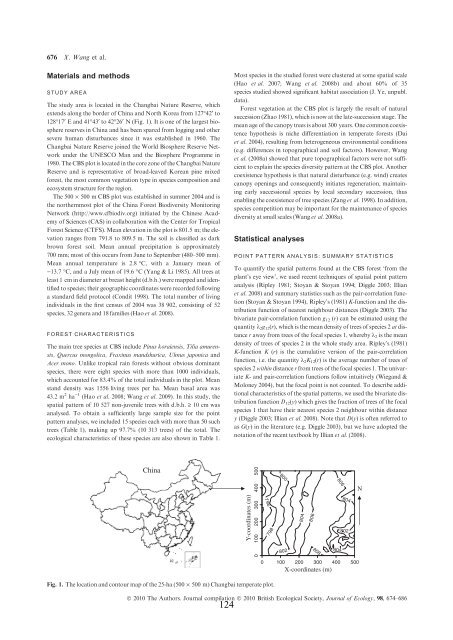
676 X. Wang et al.Materials and methodsSTUDY AREAThe study area is located in the Changbai Nature Reserve, whichextends along the border of China and North Korea from 127°42¢ to128°17¢ E and 41°43¢ to 42°26¢ N (Fig. 1). It is one of the largest biospherereserves in China and has been spared from logging and othersevere human disturbances since it was established in 1960. TheChangbai Nature Reserve joined the World Biosphere Reserve Networkunder the UNESCO Man and the Biosphere Programme in1980. The CBS plot is located in the core zone of the Changbai NatureReserve and is representative of broad-leaved Korean pine mixedforest, the most common vegetation type in species composition andecosystem structure for the region.The 500 · 500 m CBS plot was established in summer 2004 and isthe northernmost plot of the China Forest Biodiversity MonitoringNetwork (http://www.cfbiodiv.org) initiated by the Chinese Academyof Sciences (CAS) in collaboration with the Center for TropicalForest Science (CTFS). Mean elevation in the plot is 801.5 m; the elevationranges from 791.8 to 809.5 m. The soil is classified as darkbrown forest soil. Mean annual precipitation is approximately700 mm; most of this occurs from June to September (480–500 mm).Mean annual temperature is 2.8 °C, with a January mean of)13.7 °C, and a July mean of 19.6 °C (Yang & Li 1985). All trees atleast 1 cm in diameter at breast height (d.b.h.) were mapped and identifiedto species; their geographic coordinates were recorded followinga standard field protocol (Condit 1998). The total number of livingindividuals in the first census of 2004 was 38 902, consisting of 52species, 32 genera and 18 families (Hao et al. 2008).FOREST CHARACTERISTICSThe main tree species at CBS include Pinus koraiensis, Tilia amurensis,Quercus mongolica, Fraxinus mandshurica, Ulmus japonica andAcer mono. Unlike tropical rain forests without obvious dominantspecies, there were eight species with more than 1000 individuals,which accounted for 83.4% of the total individuals in the plot. Meanstand density was 1556 living trees per ha. Mean basal area was43.2 m 2 ha )1 (Hao et al. 2008; Wang et al. 2009). In this study, thespatial pattern of 10 527 non-juvenile trees with d.b.h. ‡ 10 cm wasanalysed. To obtain a sufficiently large sample size for the pointpattern analyses, we included 15 species each with more than 50 suchtrees (Table 1), making up 97.7% (10 313 trees) of the total. Theecological characteristics of these species are also shown in Table 1.Most species in the studied forest were clustered at some spatial scale(Hao et al. 2007; Wang et al. 2008b) and about 60% of 35species studied showed significant habitat association (J. Ye, unpubl.data).Forest vegetation at the CBS plot is largely the result of naturalsuccession (Zhao 1981), which is now at the late-succession stage. Themean age of the canopy trees is about 300 years. One common coexistencehypothesis is niche differentiation in temperate forests (Daiet al. 2004), resulting from heterogeneous environmental conditions(e.g. differences in topographical and soil factors). However, Wanget al. (2008a) showed that pure topographical factors were not sufficientto explain the species diversity pattern at the CBS plot. Anothercoexistence hypothesis is that natural disturbance (e.g. wind) createscanopy openings and consequently initiates regeneration, maintainingearly successional species by local secondary succession, thusenabling the coexistence of tree species (Zang et al. 1998). In addition,species competition may be important for the maintenance of speciesdiversity at small scales (Wang et al. 2008a).Statistical analysesPOINT PATTERN ANALYSIS: SUMMARY STATISTICSTo quantify the spatial patterns found at the CBS forest ‘from theplant’s eye view’, we used recent techniques of spatial point patternanalysis (Ripley 1981; Stoyan & Stoyan 1994; Diggle 2003; Illianet al. 2008) and summary statistics such as the pair-correlation function(Stoyan & Stoyan 1994), Ripley’s (1981) K-function and the distributionfunction of nearest neighbour distances (Diggle 2003). Thebivariate pair-correlation function g 12 (r) can be estimated using thequantity k 2 g 12 (r), which is the mean density of trees of species 2 at distancer away from trees of the focal species 1, whereby k 2 is the meandensity of trees of species 2 in the whole study area. Ripley’s (1981)K-function K (r) is the cumulative version of the pair-correlationfunction, i.e. the quantity k 2 K 12 (r) is the average number of trees ofspecies 2 within distance r from trees of the focal species 1. The univariateK- and pair-correlation functions follow intuitively (Wiegand &Moloney 2004), but the focal point is not counted. To describe additionalcharacteristics of the spatial patterns, we used the bivariate distributionfunction D 12 (y) which gives the fraction of trees of the focalspecies 1 that have their nearest species 2 neighbour within distancey (Diggle 2003; Illian et al. 2008). Note that D(y) is often referred toas G(y) in the literature (e.g. Diggle 2003), but we have adopted thenotation of the recent textbook by Illian et al. (2008).ChinaY-coordinates (m)0 100 200 300 400 5007967988008028048068088068048048020 100 200 300 400 500X-coordinates (m)NFig. 1. The location and contour map of the 25-ha (500 · 500 m) Changbai temperate plot.Ó 2010 The Authors. Journal compilation Ó 2010 British Ecological Society, Journal of Ecology, 98, 674–686124