- Page 3 and 4:
庆 研 究 员 、 曹 敏 研 究
- Page 5 and 6:
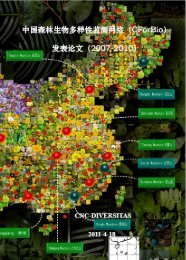
published based on CForBio platform
- Page 7 and 8:
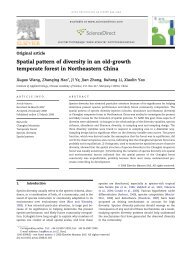
Spatial distributions of species in
- Page 9 and 10:
Isolation and characterization of m
- Page 11 and 12:
Oecologiaand Connell (1971) reporte
- Page 13 and 14:
Oecologiaenvironmental factors. In
- Page 15 and 16:
Oecologiafifth-lowest and fifth-hig
- Page 17 and 18:
Oecologiadensity-dependent thinning
- Page 19 and 20:
Oecologiastronger in tropical than
- Page 21 and 22:
Estimate of Leaf Area Index in an O
- Page 23 and 24:
Estimate of Leaf Area Indexobtained
- Page 25 and 26:
Estimate of Leaf Area IndexpPinus k
- Page 27 and 28:
Estimate of Leaf Area IndexFigure 1
- Page 29 and 30:
Estimate of Leaf Area IndexFigure 3
- Page 31 and 32:
Estimate of Leaf Area Index25. Mont
- Page 33 and 34:
J For Resnet primary productivity,
- Page 35 and 36:
J For ResGðhÞ ¼exp½ KðhÞX E L
- Page 37 and 38:
J For ResFig. 1 Representativehemis
- Page 39 and 40:
J For ResFig. 5 Results of the mode
- Page 41 and 42:
J For ResLeblanc SG, Chen JM, Ferna
- Page 43 and 44:
OecologiaSimilarly, important dimen
- Page 45 and 46:
OecologiaStatistical analysisWe mod
- Page 47 and 48:
OecologiaModel parameterNconNhetAco
- Page 49 and 50:
OecologiaFig. 4 Odds ratios of seed
- Page 51 and 52:
OecologiaComita LS, Muller-Landau H
- Page 53 and 54:
Downloaded from rspb.royalsocietypu
- Page 55 and 56:
Downloaded from rspb.royalsocietypu
- Page 57 and 58:
Downloaded from rspb.royalsocietypu
- Page 59 and 60:
Downloaded from rspb.royalsocietypu
- Page 61 and 62:
Downloaded from rspb.royalsocietypu
- Page 63 and 64:
Tree Survival in a Chinese Temperat
- Page 65 and 66:
Tree Survival in a Chinese Temperat
- Page 67 and 68:
Tree Survival in a Chinese Temperat
- Page 69 and 70:
Tree Survival in a Chinese Temperat
- Page 71 and 72:
Tree Survival in a Chinese Temperat
- Page 73 and 74:
Soil Water and Nitrogen Affect Phot
- Page 75 and 76:
Soil Water and Nitrogen Affect Phot
- Page 77 and 78:
Soil Water and Nitrogen Affect Phot
- Page 79 and 80:
Soil Water and Nitrogen Affect Phot
- Page 81 and 82:
Soil Water and Nitrogen Affect Phot
- Page 83 and 84:
Soil Water and Nitrogen Affect Phot
- Page 85 and 86:
these interactions can also be depe
- Page 87 and 88:
was used to analyze the structural
- Page 89 and 90:
Table 3. SEM results for the model
- Page 91 and 92:
Table 5. Results of the ordinary le
- Page 93 and 94:
Journal of Vegetation Science 23 (2
- Page 95 and 96:
B. Li et al. Seed rain dynamics in
- Page 97 and 98:
B. Li et al. Seed rain dynamics in
- Page 99 and 100:
B. Li et al. Seed rain dynamics in
- Page 101 and 102:
B. Li et al. Seed rain dynamics in
- Page 103 and 104:
Detecting underlying mechanisms con
- Page 105 and 106:
Detecting underlying mechanisms con
- Page 107 and 108:
Detecting underlying mechanisms con
- Page 109 and 110:
Detecting underlying mechanisms con
- Page 111 and 112:
Detecting underlying mechanisms con
- Page 113 and 114:
Detecting underlying mechanisms con
- Page 115 and 116:
Author's personal copyZ. Yuan et al
- Page 117 and 118:
Author's personal copyZ. Yuan et al
- Page 119 and 120:
Author's personal copyZ. Yuan et al
- Page 121 and 122:
Author's personal copyZ. Yuan et al
- Page 123 and 124:
1012 Can. J. For. Res. Vol. 40, 201
- Page 125 and 126:
1014 Can. J. For. Res. Vol. 40, 201
- Page 127 and 128:
1016 Can. J. For. Res. Vol. 40, 201
- Page 129 and 130:
1018 Can. J. For. Res. Vol. 40, 201
- Page 131 and 132:
Journal of Ecology 2010, 98, 674-68
- Page 133 and 134:
676 X. Wang et al.Materials and met
- Page 135 and 136:
678 X. Wang et al.Scheme to charact
- Page 137 and 138:
680 X. Wang et al.(b) Acer trifloru
- Page 139 and 140:
682 X. Wang et al.1.5(a)Pinus korai
- Page 141 and 142:
684 X. Wang et al.fine-scale patter
- Page 143 and 144:
686 X. Wang et al.Supporting Inform
- Page 145 and 146:
30J. Zhang et al. / Acta Oecologica
- Page 147 and 148:
32J. Zhang et al. / Acta Oecologica
- Page 149 and 150:
34J. Zhang et al. / Acta Oecologica
- Page 151 and 152:
36J. Zhang et al. / Acta Oecologica
- Page 153 and 154:
38J. Zhang et al. / Acta Oecologica
- Page 155 and 156:
2116J. Zhang et al. / Forest Ecolog
- Page 157 and 158:
2118J. Zhang et al. / Forest Ecolog
- Page 159 and 160:
2120J. Zhang et al. / Forest Ecolog
- Page 161 and 162:
E18The American Naturaliststructure
- Page 163 and 164:
Figure 1: Highly simplified illustr
- Page 165 and 166:
E22The American Naturalista communi
- Page 167 and 168:
Table 2: Mann-Kendall trend test of
- Page 169 and 170:
E26The American NaturalistTable 3:
- Page 171 and 172:
E28The American Naturalistalmost al
- Page 173 and 174:
E30The American NaturalistBaillie.
- Page 175 and 176:
Traits, Soil Fertility and Distribu
- Page 177 and 178:
Traits, Soil Fertility and Distribu
- Page 179 and 180:
Traits, Soil Fertility and Distribu
- Page 181 and 182:
Traits, Soil Fertility and Distribu
- Page 183 and 184:
Author's personal copyTrees (2012)
- Page 185 and 186:
Author's personal copyTrees (2012)
- Page 187 and 188:
Author's personal copyTrees (2012)
- Page 189 and 190:
Author's personal copyTrees (2012)
- Page 191 and 192:
ArticleEcologyFebruary 2012 Vol.57
- Page 193 and 194:
Feng G, et al. Chin Sci Bull Februa
- Page 195 and 196:
Feng G, et al. Chin Sci Bull Februa
- Page 197 and 198:
Feng G, et al. Chin Sci Bull Februa
- Page 199 and 200:
Acta Oecologica 39 (2012) 87e93Cont
- Page 201 and 202:
Y. Du et al. / Acta Oecologica 39 (
- Page 203 and 204:
Y. Du et al. / Acta Oecologica 39 (
- Page 205 and 206:
Y. Du et al. / Acta Oecologica 39 (
- Page 207 and 208:
2Y. Du et al. / Acta Oecologica xxx
- Page 209 and 210:
4Y. Du et al. / Acta Oecologica xxx
- Page 211 and 212:
6Y. Du et al. / Acta Oecologica xxx
- Page 213 and 214:
8Y. Du et al. / Acta Oecologica xxx
- Page 215 and 216:
Journal of Theoretical Biology 276
- Page 217 and 218:
J. Huang et al. / Journal of Theore
- Page 219 and 220:
J. Huang et al. / Journal of Theore
- Page 221 and 222:
J. Huang et al. / Journal of Theore
- Page 223 and 224:
212 Plant Soil (2011) 347:211-220TC
- Page 225 and 226:
214 Plant Soil (2011) 347:211-22020
- Page 227 and 228:
216 Plant Soil (2011) 347:211-220Ta
- Page 229 and 230:
218 Plant Soil (2011) 347:211-220nu
- Page 231 and 232:
220 Plant Soil (2011) 347:211-220Ro
- Page 233 and 234:
(Plotkin and Muller-Landau 2002, Ha
- Page 235 and 236:
Figure 1. 95% confidence intervals
- Page 237 and 238:
Figure 2. Plots of the observed and
- Page 239 and 240:
Gutian plot. But large-scale habita
- Page 241 and 242:
Oikos 119: 109119, 2010doi: 10.1111
- Page 243 and 244: Figure 1. The location and contour
- Page 245 and 246: Figure 2. Example of the analysis o
- Page 247 and 248: As a stabilizing force in the maint
- Page 249 and 250: that in tropical forests. The preva
- Page 251 and 252: Ratikainen, I. I. et al. 2008. When
- Page 253 and 254: ARTICLE IN PRESS400J. Du et al. / F
- Page 255 and 256: ARTICLE IN PRESS402J. Du et al. / F
- Page 257 and 258: Journal of Ecology 2009, 97, 1383-1
- Page 259 and 260: Plant detection probability 1385Tab
- Page 261 and 262: Plant detection probability 13870.6
- Page 263 and 264: Plant detection probability 1389use
- Page 265 and 266: 3034 GUOCHUN SHEN ET AL.Ecology, Vo
- Page 267 and 268: 3036 GUOCHUN SHEN ET AL.Ecology, Vo
- Page 269 and 270: 3038 GUOCHUN SHEN ET AL.Ecology, Vo
- Page 271 and 272: 3040 GUOCHUN SHEN ET AL.Ecology, Vo
- Page 273 and 274: Ecological Archives E090-217-A1Guoc
- Page 275 and 276: ased on the above intensity functio
- Page 277 and 278: Forest Ecology and Management 258 (
- Page 279 and 280: Y. Du et al. / Forest Ecology and M
- Page 281 and 282: Y. Du et al. / Forest Ecology and M
- Page 283 and 284: Journal ofPlant EcologyVolume PAGES
- Page 285 and 286: Luo 348et al. | Analyzing plant spe
- Page 287 and 288: 350 Luo et al. | Analyzing plant sp
- Page 289 and 290: 352 Luo et al. | Analyzing plant sp
- Page 291 and 292: 354 Luo et al. | Analyzing plant sp
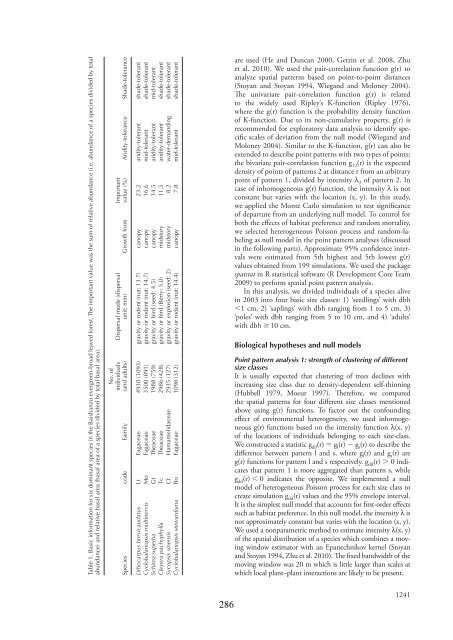
- Page 293: Oikos 121: 1239-1250, 2012doi: 10.1
- Page 297 and 298: 1 (a) Lt0.8 (b) Mo0.50.50-0.50.2-0.
- Page 299 and 300: Neighborhood analysis alone does no
- Page 301 and 302: on tree seedling establishment in G
- Page 303 and 304: 0.8 (a) Lt0.6 (b) Mo0.20.1-0.4-0.4-
- Page 305 and 306: Oikos 000: 001-008, 2012doi: 10.111
- Page 307 and 308: Sample collection and microsatellit
- Page 309 and 310: Axis 20.080.060.040.020.00-0.02-0.0
- Page 311 and 312: inherited maternally in angiosperms
- Page 313 and 314: American Journal of Botany: e123-e1
- Page 315 and 316: March 2012] AJB PRIMER NOTES & PROT
- Page 317 and 318: Plant Species Biology (2012) ••
- Page 319 and 320: TOPOGRAPHIC EFFECTS ON GENETIC STRU
- Page 321 and 322: TOPOGRAPHIC EFFECTS ON GENETIC STRU
- Page 323 and 324: TOPOGRAPHIC EFFECTS ON GENETIC STRU
- Page 325 and 326: G ModelECOCOM-323; No. of Pages 72S
- Page 327 and 328: G ModelECOCOM-323; No. of Pages 74S
- Page 329 and 330: G ModelECOCOM-323; No. of Pages 76S
- Page 331 and 332: Eur J Forest Res (2012) 131:453-461
- Page 333 and 334: Eur J Forest Res (2012) 131:453-461
- Page 335 and 336: Eur J Forest Res (2012) 131:453-461
- Page 337 and 338: Eur J Forest Res (2012) 131:453-461
- Page 339 and 340: Eur J Forest Res (2012) 131:453-461
- Page 341 and 342: Journal of Tropical Forest Science
- Page 343 and 344: Journal of Tropical Forest Science
- Page 345 and 346:
Journal of Tropical Forest Science
- Page 347 and 348:
Journal of Tropical Forest Science
- Page 349 and 350:
Journal of Tropical Forest Science
- Page 351 and 352:
Phylogenetic Community StructureTab
- Page 353 and 354:
Phylogenetic Community StructureTab
- Page 355 and 356:
Phylogenetic Community StructureFig
- Page 357 and 358:
Phylogenetic Community Structureusi
- Page 359 and 360:
Short Note: Isolation and Character
- Page 361 and 362:
Spatial Distribution and Interspeci
- Page 363 and 364:
Spatial Patterns and Associations o
- Page 365 and 366:
Spatial Patterns and Associations o
- Page 367 and 368:
Spatial Patterns and Associations o
- Page 369 and 370:
Spatial Patterns and Associations o
- Page 371 and 372:
Page 2 of 6Journal of Plant Ecology
- Page 373 and 374:
Page 4 of 6Journal of Plant Ecology
- Page 375 and 376:
Page 6 of 6Journal of Plant Ecology
- Page 377 and 378:
906 L. Lin et al.2002; Blundell & P
- Page 379 and 380:
908 L. Lin et al.seedling neighbour
- Page 381 and 382:
910 L. Lin et al.Table 4. Results o
- Page 383 and 384:
912 L. Lin et al.fewer encounters b
- Page 385 and 386:
914 L. Lin et al.Janzen, D.H. (1970
- Page 387 and 388:
Although various methods have been
- Page 389 and 390:
The third group of explanatory vari
- Page 391 and 392:
Figure 4. Principal component analy
- Page 393 and 394:
non-dominant tree species across li
- Page 395 and 396:
Strong Neutral Spatial Effects Shap
- Page 397 and 398:
Spatial Effects Shape Tree Species
- Page 399 and 400:
Spatial Effects Shape Tree Species
- Page 401 and 402:
Spatial Effects Shape Tree Species
- Page 403 and 404:
Spatial Effects Shape Tree Species
- Page 405 and 406:
J For Res (2012) 17:432-439 433Tabl
- Page 407 and 408:
J For Res (2012) 17:432-439 435Numb
- Page 409 and 410:
J For Res (2012) 17:432-439 437Tabl
- Page 411 and 412:
J For Res (2012) 17:432-439 439Cao
- Page 413 and 414:
308 Tang Y, et al. Chin Sci Bull Fe
- Page 415 and 416:
310 Tang Y, et al. Chin Sci Bull Fe
- Page 417 and 418:
312 Tang Y, et al. Chin Sci Bull Fe
- Page 419 and 420:
1508 G. Lan et al. / Forest Ecology
- Page 421 and 422:
1510 G. Lan et al. / Forest Ecology
- Page 423 and 424:
1512 G. Lan et al. / Forest Ecology
- Page 425 and 426:
附 录 Ⅰ: 中 文 及 其 他
- Page 427 and 428:
43. 刘 妍 妍 , 金 光 泽 *. 20
- Page 429 and 430:
15. Gong GQ, Huang ZL, Huang JX, Ye
- Page 431 and 432:
23(9): 24-30.45. Chen Z and Zhu H.
- Page 433 and 434:
13. Huang GM, Hong L, Ye WH, Shen H
- Page 435 and 436:
19. Luo ZR, Ding BY, Mi XC, Yu JH,
- Page 437 and 438:
9. Li C, Li FR, Wang SL, Yue SF, Wa
- Page 439:
40. Jin GZ, Li R, Li ZH and Kim JH*