Contents - ä¸å½æ£®æçç©å¤æ ·æ§çæµç½ç»
Contents - ä¸å½æ£®æçç©å¤æ ·æ§çæµç½ç»
Contents - ä¸å½æ£®æçç©å¤æ ·æ§çæµç½ç»
- No tags were found...

Create successful ePaper yourself
Turn your PDF publications into a flip-book with our unique Google optimized e-Paper software.
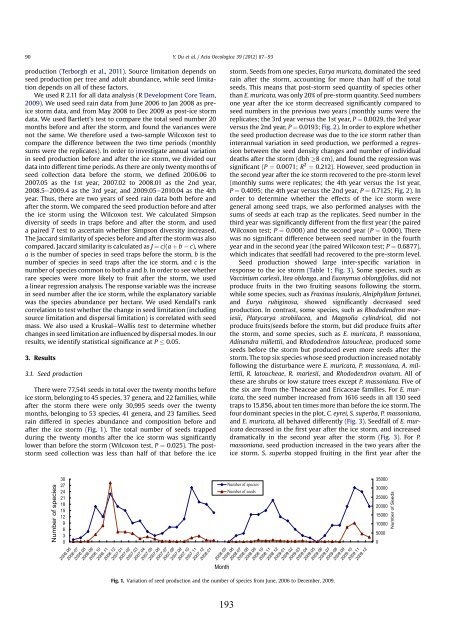
90Y. Du et al. / Acta Oecologica 39 (2012) 87e93production (Terborgh et al., 2011). Source limitation depends onseed production per tree and adult abundance, while seed limitationdepends on all of these factors.We used R 2.11 for all data analysis (R Development Core Team,2009). We used seed rain data from June 2006 to Jan 2008 as preicestorm data, and from May 2008 to Dec 2009 as post-ice stormdata. We used Bartlett’s test to compare the total seed number 20months before and after the storm, and found the variances werenot the same. We therefore used a two-sample Wilcoxon test tocompare the difference between the two time periods (monthlysums were the replicates). In order to investigate annual variationin seed production before and after the ice storm, we divided ourdata into different time periods. As there are only twenty months ofseed collection data before the storm, we defined 2006.06 to2007.05 as the 1st year, 2007.02 to 2008.01 as the 2nd year,2008.5e2009.4 as the 3rd year, and 2009.05e2010.04 as the 4thyear. Thus, there are two years of seed rain data both before andafter the storm. We compared the seed production before and afterthe ice storm using the Wilcoxon test. We calculated Simpsondiversity of seeds in traps before and after the storm, and useda paired T test to ascertain whether Simpson diversity increased.The Jaccard similarity of species before and after the storm was alsocompared. Jaccard similarity is calculated as J ¼ c/(a þ b c), wherea is the number of species in seed traps before the storm, b is thenumber of species in seed traps after the ice storm, and c is thenumber of species common to both a and b. In order to see whetherrare species were more likely to fruit after the storm, we useda linear regression analysis. The response variable was the increasein seed number after the ice storm, while the explanatory variablewas the species abundance per hectare. We used Kendall’s rankcorrelation to test whether the change in seed limitation (includingsource limitation and dispersal limitation) is correlated with seedmass. We also used a KruskaleWallis test to determine whetherchanges in seed limitation are influenced by dispersal modes. In ourresults, we identify statistical significance at P 0.05.3. Results3.1. Seed productionThere were 77,541 seeds in total over the twenty months beforeice storm, belonging to 45 species, 37 genera, and 22 families, whileafter the storm there were only 30,995 seeds over the twentymonths, belonging to 53 species, 41 genera, and 23 families. Seedrain differed in species abundance and composition before andafter the ice storm (Fig. 1). The total number of seeds trappedduring the twenty months after the ice storm was significantlylower than before the storm (Wilcoxon test, P ¼ 0.025). The poststormseed collection was less than half of that before the icestorm. Seeds from one species, Eurya muricata, dominated the seedrain after the storm, accounting for more than half of the totalseeds. This means that post-storm seed quantity of species otherthan E. muricata, was only 20% of pre-storm quantity. Seed numbersone year after the ice storm decreased significantly compared toseed numbers in the previous two years (monthly sums were thereplicates; the 3rd year versus the 1st year, P ¼ 0.0029, the 3rd yearversus the 2nd year, P ¼ 0.0193; Fig. 2). In order to explore whetherthe seed production decrease was due to the ice storm rather thaninterannual variation in seed production, we performed a regressionbetween the seed density changes and number of individualdeaths after the storm (dbh 8 cm), and found the regression wassignificant (P ¼ 0.0071; R 2 ¼ 0.212). However, seed production inthe second year after the ice storm recovered to the pre-storm level(monthly sums were replicates; the 4th year versus the 1st year,P ¼ 0.4095; the 4th year versus the 2nd year, P ¼ 0.7125; Fig. 2). Inorder to determine whether the effects of the ice storm weregeneral among seed traps, we also performed analyses with thesums of seeds at each trap as the replicates. Seed number in thethird year was significantly different from the first year (the pairedWilcoxon test; P ¼ 0.000) and the second year (P ¼ 0.000). Therewas no significant difference between seed number in the fourthyear and in the second year (the paired Wilcoxon test; P ¼ 0.6877),which indicates that seedfall had recovered to the pre-storm level.Seed production showed large inter-specific variation inresponse to the ice storm (Table 1; Fig. 3). Some species, such asVaccinium carlesii, Itea oblonga, and Euonymus oblongifolius, did notproduce fruits in the two fruiting seasons following the storm,while some species, such as Fraxinus insularis, Alniphyllum fortunei,and Eurya rubiginosa, showed significantly decreased seedproduction. In contrast, some species, such as Rhododendron mariesii,Platycarya strobilacea, and Magnolia cylindrical, did notproduce fruits/seeds before the storm, but did produce fruits afterthe storm, and some species, such as E. muricata, P. massoniana,Adinandra millettii, and Rhododendron latoucheae, produced someseeds before the storm but produced even more seeds after thestorm. The top six species whose seed production increased notablyfollowing the disturbance were E. muricata, P. massoniana, A. millettii,R. latoucheae, R. mariesii, and Rhododendron ovatum. All ofthese are shrubs or low stature trees except P. massoniana. Five ofthe six are from the Theaceae and Ericaceae families. For E. muricata,the seed number increased from 1616 seeds in all 130 seedtraps to 15,856, about ten times more than before the ice storm. Thefour dominant species in the plot, C. eyrei, S. superba, P. massoniana,and E. muricata, all behaved differently (Fig. 3). Seedfall of E. muricatadecreased in the first year after the ice storm, and increaseddramatically in the second year after the storm (Fig. 3). For P.massoniana, seed production increased in the two years after theice storm. S. superba stopped fruiting in the first year after theNumber of species3027242118151296302006.062006.072006.082006.092006.102006.112006.122007.012007.022007.032007.042007.052007.062007.072007.082007.092007.102007.112007.122008.012008.062008.072008.082008.092008.102008.112008.122009.012009.022009.032009.042009.052009.062009.072009.082009.092008.05MonthNumber of speciesNumber of seedsFig. 1. Variation of seed production and the number of species from June, 2006 to December, 2009.2009.102009.112009.1235000300002500020000150001000050000Number of Seeds193