Contents - ä¸å½æ£®æçç©å¤æ ·æ§çæµç½ç»
Contents - ä¸å½æ£®æçç©å¤æ ·æ§çæµç½ç»
Contents - ä¸å½æ£®æçç©å¤æ ·æ§çæµç½ç»
- No tags were found...

You also want an ePaper? Increase the reach of your titles
YUMPU automatically turns print PDFs into web optimized ePapers that Google loves.
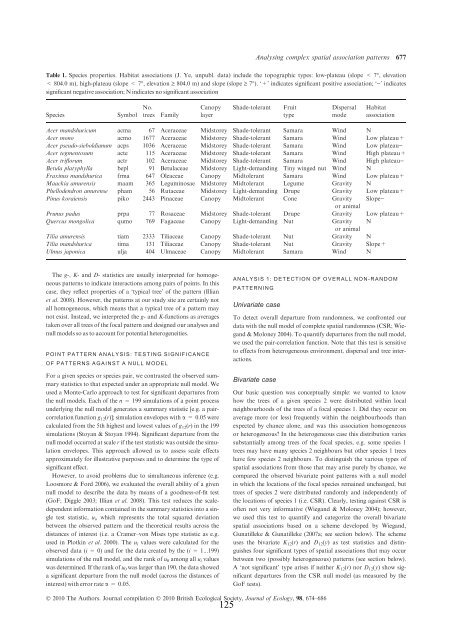
Analysing complex spatial association patterns 677Table 1. Species properties. Habitat associations (J. Ye, unpubl. data) include the topographic types: low-plateau (slope < 7°, elevation< 804.0 m), high-plateau (slope < 7°, elevation‡ 804.0 m) and slope (slope ‡ 7°). ‘+’ indicates significant positive association; ‘)’ indicatessignificant negative association; N indicates no significant associationSpeciesSymbolNo.treesFamilyCanopylayerShade-tolerantFruittypeDispersalmodeHabitatassociationAcer mandshuricum acma 67 Aceraceae Midstorey Shade-tolerant Samara Wind NAcer mono acmo 1677 Aceraceae Midstorey Shade-tolerant Samara Wind Low plateau+Acer pseudo-sieboldianum acps 1036 Aceraceae Midstorey Shade-tolerant Samara Wind Low plateau)Acer tegmentosum acte 115 Aceraceae Midstorey Shade-tolerant Samara Wind High plateau+Acer triflorum actr 102 Aceraceae Midstorey Shade-tolerant Samara Wind High plateau)Betula platyphylla bepl 91 Betulaceae Midstorey Light-demanding Tiny winged nut Wind NFraxinus mandshurica frma 647 Oleaceae Canopy Midtolerant Samara Wind Low plateau+Maackia amurensis maam 365 Leguminosae Midstorey Midtolerant Legume Gravity NPhellodendron amurense pham 56 Rutaceae Midstorey Light-demanding Drupe Gravity Low plateau+Pinus koraiensis piko 2443 Pinaceae Canopy Midtolerant Cone Gravity Slope)or animalPrunus padus prpa 77 Rosaceae Midstorey Shade-tolerant Drupe Gravity Low plateau+Quercus mongolica qumo 769 Fagaceae Canopy Light-demanding Nut Gravity Nor animalTilia amurensis tiam 2333 Tiliaceae Canopy Shade-tolerant Nut Gravity NTilia mandshurica tima 131 Tiliaceae Canopy Shade-tolerant Nut Gravity Slope+Ulmus japonica ulja 404 Ulmaceae Canopy Midtolerant Samara Wind NThe g-, K- andD- statistics are usually interpreted for homogeneouspatterns to indicate interactions among pairs of points. In thiscase, they reflect properties of a ‘typical tree’ of the pattern (Illianet al. 2008). However, the patterns at our study site are certainly notall homogeneous, which means that a typical tree of a pattern maynot exist. Instead, we interpreted the g- andK-functions as averagestaken over all trees of the focal pattern and designed our analyses andnull models so as to account for potential heterogeneities.POINT PATTERN ANALYSIS: TESTING SIGNIFICANCEOF PATTERNS AGAINST A NULL MODELFor a given species or species pair, we contrasted the observed summarystatistics to that expected under an appropriate null model. Weused a Monte-Carlo approach to test for significant departures fromthe null models. Each of the n = 199 simulations of a point processunderlying the null model generates a summary statistic [e.g. a paircorrelationfunction g 12 (r)]; simulation envelopes with a = 0.05 werecalculated from the 5th highest and lowest values of g 12 (r) in the 199simulations (Stoyan & Stoyan 1994). Significant departure from thenull model occurred at scale r if the test statistic was outside the simulationenvelopes. This approach allowed us to assess scale effectsapproximately for illustrative purposes and to determine the type ofsignificant effect.However, to avoid problems due to simultaneous inference (e.g.Loosmore & Ford 2006), we evaluated the overall ability of a givennull model to describe the data by means of a goodness-of-fit test(GoF; Diggle 2003; Illian et al. 2008). This test reduces the scaledependentinformation contained in the summary statistics into a singletest statistic, u i , which represents the total squared deviationbetween the observed pattern and the theoretical results across thedistances of interest (i.e. a Cramer–von Mises type statistic as e.g.used in Plotkin et al. 2000). The u i values were calculated for theobserved data (i = 0) and for the data created by the (i = 1...199)simulations of the null model, and the rank of u 0 among all u i valueswas determined. If the rank of u 0 was larger than 190, the data showeda significant departure from the null model (across the distances ofinterest) with error rate a =0.05.ANALYSIS 1: DETECTION OF OVERALL NON-RANDOMPATTERNINGUnivariate caseTo detect overall departure from randomness, we confronted ourdata with the null model of complete spatial randomness (CSR; Wiegand& Moloney 2004). To quantify departures from the null model,we used the pair-correlation function. Note that this test is sensitiveto effects from heterogeneous environment, dispersal and tree interactions.Bivariate caseOur basic question was conceptually simple: we wanted to knowhow the trees of a given species 2 were distributed within localneighbourhoods of the trees of a focal species 1. Did they occur onaverage more (or less) frequently within the neighbourhoods thanexpected by chance alone, and was this association homogeneousor heterogeneous? In the heterogeneous case this distribution variessubstantially among trees of the focal species, e.g. some species 1trees may have many species 2 neighbours but other species 1 treeshave few species 2 neighbours. To distinguish the various types ofspatial associations from those that may arise purely by chance, wecompared the observed bivariate point patterns with a null modelin which the locations of the focal species remained unchanged, buttrees of species 2 were distributed randomly and independently ofthe locations of species 1 (i.e. CSR). Clearly, testing against CSR isoften not very informative (Wiegand & Moloney 2004); however,we used this test to quantify and categorize the overall bivariatespatial associations based on a scheme developed by Wiegand,Gunatilleke & Gunatilleke (2007a; see section below). The schemeuses the bivariate K 12 (r) andD 12 (y) as test statistics and distinguishesfour significant types of spatial associations that may occurbetween two (possibly heterogeneous) patterns (see section below).A ‘not significant’ type arises if neither K 12 (r) norD 12 (y) showsignificantdepartures from the CSR null model (as measured by theGoF tests).Ó 2010 The Authors. Journal compilation Ó 2010 British Ecological Society, Journal of Ecology, 98, 674–686125