Flexural creep of all-polypropylene composites: Model analysis
Flexural creep of all-polypropylene composites: Model analysis
Flexural creep of all-polypropylene composites: Model analysis

You also want an ePaper? Increase the reach of your titles
YUMPU automatically turns print PDFs into web optimized ePapers that Google loves.
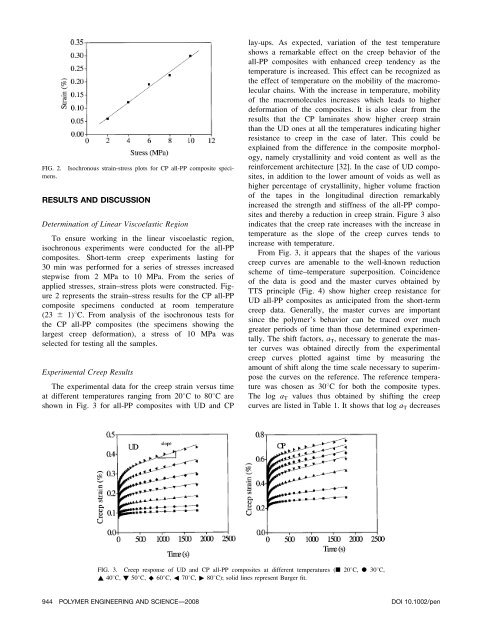
Isochronous strain-stress plots for CP <strong>all</strong>-PP composite speci-FIG. 2.mens.RESULTS AND DISCUSSIONDetermination <strong>of</strong> Linear Viscoelastic RegionTo ensure working in the linear viscoelastic region,isochronous experiments were conducted for the <strong>all</strong>-PP<strong>composites</strong>. Short-term <strong>creep</strong> experiments lasting for30 min was performed for a series <strong>of</strong> stresses increasedstepwise from 2 MPa to 10 MPa. From the series <strong>of</strong>applied stresses, strain–stress plots were constructed. Figure2 represents the strain–stress results for the CP <strong>all</strong>-PPcomposite specimens conducted at room temperature(23 6 1)8C. From <strong>analysis</strong> <strong>of</strong> the isochronous tests forthe CP <strong>all</strong>-PP <strong>composites</strong> (the specimens showing thelargest <strong>creep</strong> deformation), a stress <strong>of</strong> 10 MPa wasselected for testing <strong>all</strong> the samples.Experimental Creep ResultsThe experimental data for the <strong>creep</strong> strain versus timeat different temperatures ranging from 208C to808C areshown in Fig. 3 for <strong>all</strong>-PP <strong>composites</strong> with UD and CPlay-ups. As expected, variation <strong>of</strong> the test temperatureshows a remarkable effect on the <strong>creep</strong> behavior <strong>of</strong> the<strong>all</strong>-PP <strong>composites</strong> with enhanced <strong>creep</strong> tendency as thetemperature is increased. This effect can be recognized asthe effect <strong>of</strong> temperature on the mobility <strong>of</strong> the macromolecularchains. With the increase in temperature, mobility<strong>of</strong> the macromolecules increases which leads to higherdeformation <strong>of</strong> the <strong>composites</strong>. It is also clear from theresults that the CP laminates show higher <strong>creep</strong> strainthan the UD ones at <strong>all</strong> the temperatures indicating higherresistance to <strong>creep</strong> in the case <strong>of</strong> later. This could beexplained from the difference in the composite morphology,namely cryst<strong>all</strong>inity and void content as well as thereinforcement architecture [32]. In the case <strong>of</strong> UD <strong>composites</strong>,in addition to the lower amount <strong>of</strong> voids as well ashigher percentage <strong>of</strong> cryst<strong>all</strong>inity, higher volume fraction<strong>of</strong> the tapes in the longitudinal direction remarkablyincreased the strength and stiffness <strong>of</strong> the <strong>all</strong>-PP <strong>composites</strong>and thereby a reduction in <strong>creep</strong> strain. Figure 3 alsoindicates that the <strong>creep</strong> rate increases with the increase intemperature as the slope <strong>of</strong> the <strong>creep</strong> curves tends toincrease with temperature.From Fig. 3, it appears that the shapes <strong>of</strong> the various<strong>creep</strong> curves are amenable to the well-known reductionscheme <strong>of</strong> time–temperature superposition. Coincidence<strong>of</strong> the data is good and the master curves obtained byTTS principle (Fig. 4) show higher <strong>creep</strong> resistance forUD <strong>all</strong>-PP <strong>composites</strong> as anticipated from the short-term<strong>creep</strong> data. Gener<strong>all</strong>y, the master curves are importantsince the polymer’s behavior can be traced over muchgreater periods <strong>of</strong> time than those determined experiment<strong>all</strong>y.The shift factors, a T , necessary to generate the mastercurves was obtained directly from the experimental<strong>creep</strong> curves plotted against time by measuring theamount <strong>of</strong> shift along the time scale necessary to superimposethe curves on the reference. The reference temperaturewas chosen as 308C for both the composite types.The log a T values thus obtained by shifting the <strong>creep</strong>curves are listed in Table 1. It shows that log a T decreasesFIG. 3. Creep response <strong>of</strong> UD and CP <strong>all</strong>-PP <strong>composites</strong> at different temperatures (n 208C, l 308C,~ 408C, ! 508C, ^ 608C, 3 708C, " 808C); solid lines represent Burger fit.944 POLYMER ENGINEERING AND SCIENCE—-2008 DOI 10.1002/pen