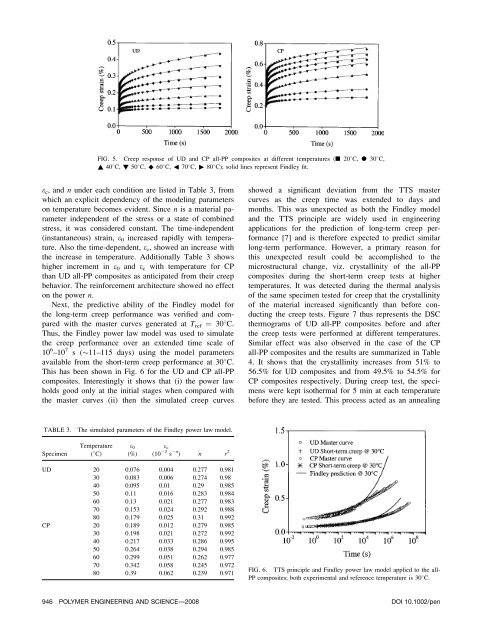
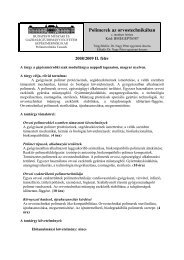
FIG. 5. Creep response <strong>of</strong> UD and CP <strong>all</strong>-PP <strong>composites</strong> at different temperatures (n 208C, l 308C,~ 408C, ! 508C, ^ 608C, 3 708C, " 808C); solid lines represent Findley fit.e c , and n under each condition are listed in Table 3, fromwhich an explicit dependency <strong>of</strong> the modeling parameterson temperature becomes evident. Since n is a material parameterindependent <strong>of</strong> the stress or a state <strong>of</strong> combinedstress, it was considered constant. The time-independent(instantaneous) strain, e 0 increased rapidly with temperature.Also the time-dependent, e c , showed an increase withthe increase in temperature. Addition<strong>all</strong>y Table 3 showshigher increment in e 0 and e c with temperature for CPthan UD <strong>all</strong>-PP <strong>composites</strong> as anticipated from their <strong>creep</strong>behavior. The reinforcement architecture showed no effecton the power n.Next, the predictive ability <strong>of</strong> the Findley model forthe long-term <strong>creep</strong> performance was verified and comparedwith the master curves generated at T ref ¼ 308C.Thus, the Findley power law model was used to simulatethe <strong>creep</strong> performance over an extended time scale <strong>of</strong>10 6 –10 7 s (11–115 days) using the model parametersavailable from the short-term <strong>creep</strong> performance at 308C.This has been shown in Fig. 6 for the UD and CP <strong>all</strong>-PP<strong>composites</strong>. Interestingly it shows that (i) the power lawholds good only at the initial stages when compared withthe master curves (ii) then the simulated <strong>creep</strong> curvesshowed a significant deviation from the TTS mastercurves as the <strong>creep</strong> time was extended to days andmonths. This was unexpected as both the Findley modeland the TTS principle are widely used in engineeringapplications for the prediction <strong>of</strong> long-term <strong>creep</strong> performance[7] and is therefore expected to predict similarlong-term performance. However, a primary reason forthis unexpected result could be accomplished to themicrostructural change, viz. cryst<strong>all</strong>inity <strong>of</strong> the <strong>all</strong>-PP<strong>composites</strong> during the short-term <strong>creep</strong> tests at highertemperatures. It was detected during the thermal <strong>analysis</strong><strong>of</strong> the same specimen tested for <strong>creep</strong> that the cryst<strong>all</strong>inity<strong>of</strong> the material increased significantly than before conductingthe <strong>creep</strong> tests. Figure 7 thus represents the DSCthermograms <strong>of</strong> UD <strong>all</strong>-PP <strong>composites</strong> before and afterthe <strong>creep</strong> tests were performed at different temperatures.Similar effect was also observed in the case <strong>of</strong> the CP<strong>all</strong>-PP <strong>composites</strong> and the results are summarized in Table4. It shows that the cryst<strong>all</strong>inity increases from 51% to56.5% for UD <strong>composites</strong> and from 49.5% to 54.5% forCP <strong>composites</strong> respectively. During <strong>creep</strong> test, the specimenswere kept isothermal for 5 min at each temperaturebefore they are tested. This process acted as an annealingTABLE 3.The simulated parameters <strong>of</strong> the Findley power law model.SpecimenTemperature(8C)e 0(%)e c(10 22 s 2n ) n r 2UD 20 0.076 0.004 0.277 0.98130 0.083 0.006 0.274 0.9840 0.095 0.01 0.29 0.98550 0.11 0.016 0.283 0.98460 0.13 0.021 0.277 0.98370 0.153 0.024 0.292 0.98880 0.179 0.025 0.31 0.992CP 20 0.189 0.012 0.279 0.98530 0.198 0.021 0.272 0.99240 0.217 0.033 0.286 0.99550 0.264 0.038 0.294 0.98560 0.299 0.051 0.262 0.97770 0.342 0.058 0.245 0.97280 0.39 0.062 0.239 0.971FIG. 6. TTS principle and Findley power law model applied to the <strong>all</strong>-PP <strong>composites</strong>; both experimental and reference temperature is 308C.946 POLYMER ENGINEERING AND SCIENCE—-2008 DOI 10.1002/pen
effect and increased the total cryst<strong>all</strong>inity <strong>of</strong> the testspecimens by secondary cryst<strong>all</strong>ization. The <strong>creep</strong> resistance<strong>of</strong> the <strong>all</strong>-PP <strong>composites</strong> at higher temperature wastherefore supposed to be higher than would have beenexpected without a change in material property. Hencethe master curves, generated by superimposing the <strong>creep</strong>data obtained at different temperatures to the reference,predicted lower <strong>creep</strong> strains or higher <strong>creep</strong> resistancefor the <strong>all</strong>-PP <strong>composites</strong> compared with the Findleypower law prediction. Note that Fig. 7 also shows that themelting temperature increased from 1658C to 1678C forUD <strong>all</strong>-PP <strong>composites</strong> as a result <strong>of</strong> secondary cryst<strong>all</strong>ization.This also supports our explanation that additionalcryst<strong>all</strong>ization occurred while conducting short-term <strong>creep</strong>tests at different temperatures. However it raises a questionwhether the TTS principle or the Findley equationcan be used univers<strong>all</strong>y to successfully predict the longterm<strong>creep</strong> performance <strong>of</strong> semicryst<strong>all</strong>ine thermoplastics,like the <strong>all</strong>-PP <strong>composites</strong>, whose T g (about 08C) issignificantly lower than the test temperatures. It can beargued here that the Findley power law is an oversimplified<strong>creep</strong> model that does not take into account <strong>of</strong> thechange in material property during the test. On the otherhand TTS can be considered as more precise since it is asuperposition <strong>of</strong> the <strong>creep</strong> data obtained at different temperatures.The debate will, however, continue as towhether Findley or TTS can be considered reliable insuch cases. Nevertheless the predicted <strong>creep</strong> strain wasfound to be obviously lower for the UD <strong>composites</strong>,which once more showed the effectiveness <strong>of</strong> the reinforcingarchitecture on the <strong>creep</strong> behavior. Thus from themodel <strong>analysis</strong> <strong>of</strong> the <strong>creep</strong> curves it appears that the basicproperty that changes due to the change in the reinforcementarchitecture is the viscoelasticity. When the <strong>all</strong>-PP tapes were consolidated unidirection<strong>all</strong>y, the elastic aswell as the retardant modulus <strong>of</strong> the <strong>composites</strong> increased;correspondingly their viscosity also became higher whichlead to a lower instantaneous <strong>creep</strong> strain followed bydecreasing coefficient <strong>of</strong> the time-dependent term, e F .SpecimenTABLE 4.Summary <strong>of</strong> the results <strong>of</strong> DSC <strong>analysis</strong>.Cryst<strong>all</strong>inity (%)T m (8C)Before After Before AfterUD 51 56.5 165 167CP 49.5 54.5 161 162CONCLUSIONThe experimental results showed a dependency <strong>of</strong> the<strong>creep</strong> behavior on the reinforcement architecture <strong>of</strong> <strong>all</strong>-PP<strong>composites</strong> with higher <strong>creep</strong> resistance achievable whenthe <strong>all</strong>-PP tapes are reinforced unidirection<strong>all</strong>y. Both theBurger and Findley power law model could be satisfactorilyapplied to simulate the short-term <strong>creep</strong> behavior andthe modeling results provided a comprehensive understanding<strong>of</strong> the deformation mechanism for these <strong>composites</strong>ystems. The parameter <strong>analysis</strong> based on the Burgermodel showed higher elastic and viscous componentsassociated with the <strong>all</strong>-PP <strong>composites</strong> when the PP tapeswere consolidated unidirection<strong>all</strong>y. Analysis <strong>of</strong> the Findleymodel showed lower instantaneous <strong>creep</strong> strain and adecreasing coefficient <strong>of</strong> the time-dependent <strong>creep</strong> termfor unidirection<strong>all</strong>y laid up <strong>all</strong>-PP tapes. The viscoelasticmodels thus indicated that viscoelastic property changedconsiderably by changing the reinforcement architecture.It could also be concluded from the above results that the<strong>creep</strong> mechanism <strong>of</strong> the <strong>all</strong>-PP <strong>composites</strong> is not alteredby the reinforcement architecture but their <strong>creep</strong> behavioris affected significantly. A comparison between the Findleyprediction based on the model parameters at 308C andthe TTS principle (obtained at T ref ¼ 308C) showed thatthe later predicted a lower <strong>creep</strong> strain at larger timescales. This unexpected behavior could be explained bythe change in cryst<strong>all</strong>inity <strong>of</strong> the material while performingthe short-term <strong>creep</strong> at higher temperatures. Howevera question still remains whether the TTS principle or theFindley equation can be successfully applied to predictthe long-term <strong>creep</strong> for material systems like <strong>all</strong>-PP <strong>composites</strong>whose glass transition temperature is well belowthe test temperature and the microstructural change canoccur during the test. Nevertheless it has been suggestedhere that TTS can provide a more precise prediction insuch cases since it involves a superposition <strong>of</strong> the <strong>creep</strong>data at different temperatures.REFERENCESFIG. 7. DSC thermograms <strong>of</strong> the UD <strong>all</strong>-PP <strong>composites</strong> before andafter performing the <strong>creep</strong> test.1. T. Peijs, Mater. Today, 6, 30 (2003).2. N. Cabrera, B. Alcock, J. Loos, and T. Peijs, Proc. Inst.Mechanical Eng. J. Mater.: Design Appl., 218, 145 (2004).3. B. Alcock, N.O. Cabrera, N.-M. Barkoula, J. Loos, and T.Peijs, Compos. A, 37, 716 (2006).4. B. Alcock, N.O. Cabrera, N.-M. Barkoula, J. Loos, and T.Peijs, Compos. A, 38, 147 (2007).DOI 10.1002/pen POLYMER ENGINEERING AND SCIENCE—-2008 947