Fraser River sockeye salmon: data synthesis and cumulative impacts
Fraser River sockeye salmon: data synthesis and cumulative impacts
Fraser River sockeye salmon: data synthesis and cumulative impacts
- No tags were found...

You also want an ePaper? Increase the reach of your titles
YUMPU automatically turns print PDFs into web optimized ePapers that Google loves.
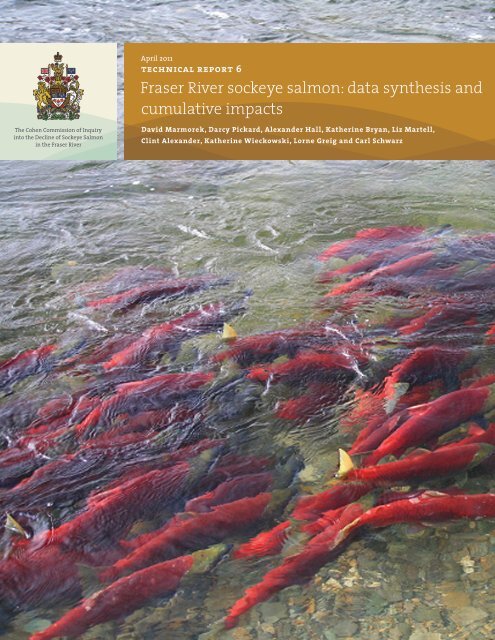
April 2011technical report 6<strong>Fraser</strong> <strong>River</strong> <strong>sockeye</strong> <strong>salmon</strong>: <strong>data</strong> <strong>synthesis</strong> <strong>and</strong><strong>cumulative</strong> <strong>impacts</strong>The Cohen Commission of Inquiryinto the Decline of Sockeye Salmonin the <strong>Fraser</strong> <strong>River</strong>David Marmorek, Darcy Pickard, Alex<strong>and</strong>er Hall, Katherine Bryan, Liz Martell,Clint Alex<strong>and</strong>er, Katherine Wieckowski, Lorne Greig <strong>and</strong> Carl Schwarz
Preface<strong>Fraser</strong> <strong>River</strong> <strong>sockeye</strong> <strong>salmon</strong> are vitally important for Canadians. Aboriginal <strong>and</strong> non-Aboriginalcommunities depend on <strong>sockeye</strong> for their food, social, <strong>and</strong> ceremonial purposes; recreationalpursuits; <strong>and</strong> livelihood needs. They are key components of freshwater <strong>and</strong> marine aquaticecosystems. Events over the past century have shown that the <strong>Fraser</strong> <strong>sockeye</strong> resource is fragile<strong>and</strong> vulnerable to human <strong>impacts</strong> such as rock slides, industrial activities, climatic change,fisheries policies <strong>and</strong> fishing. <strong>Fraser</strong> <strong>sockeye</strong> are also subject to natural environmental variations<strong>and</strong> population cycles that strongly influence survival <strong>and</strong> production.In 2009, the decline of <strong>sockeye</strong> <strong>salmon</strong> stocks in the <strong>Fraser</strong> <strong>River</strong> in British Columbia led to theclosure of the fishery for the third consecutive year, despite favourable pre-season estimates ofthe number of <strong>sockeye</strong> <strong>salmon</strong> expected to return to the river. The 2009 return marked a steadydecline that could be traced back two decades. In November 2009, the Governor General inCouncil appointed Justice Bruce Cohen as a Commissioner under Part I of the Inquiries Act toinvestigate this decline of <strong>sockeye</strong> <strong>salmon</strong> in the <strong>Fraser</strong> <strong>River</strong>. Although the two-decade declinein <strong>Fraser</strong> <strong>sockeye</strong> stocks has been steady <strong>and</strong> profound, in 2010 <strong>Fraser</strong> <strong>sockeye</strong> experienced anextraordinary rebound, demonstrating their capacity to produce at historic levels. The extremeyear-to-year variability in <strong>Fraser</strong> <strong>sockeye</strong> returns bears directly on the scientific work of theCommission.The scientific research work of the inquiry will inform the Commissioner of the role of relevantfisheries <strong>and</strong> ecosystem factors in the <strong>Fraser</strong> <strong>sockeye</strong> decline. Twelve scientific projects wereundertaken, including:Project1 Diseases <strong>and</strong> parasites2 Effects of contaminants on <strong>Fraser</strong> <strong>River</strong> <strong>sockeye</strong> <strong>salmon</strong>3 <strong>Fraser</strong> <strong>River</strong> freshwater ecology <strong>and</strong> status of <strong>sockeye</strong> Conservation Units4 Marine ecology5 Impacts of <strong>salmon</strong> farms on <strong>Fraser</strong> <strong>River</strong> <strong>sockeye</strong> <strong>salmon</strong>6 Data <strong>synthesis</strong> <strong>and</strong> <strong>cumulative</strong> impact analysis7 <strong>Fraser</strong> <strong>River</strong> <strong>sockeye</strong> fisheries harvesting <strong>and</strong> fisheries management8 Effects of predators on <strong>Fraser</strong> <strong>River</strong> <strong>sockeye</strong> <strong>salmon</strong>9 Effects of climate change on <strong>Fraser</strong> <strong>River</strong> <strong>sockeye</strong> <strong>salmon</strong>10 <strong>Fraser</strong> <strong>River</strong> <strong>sockeye</strong> production dynamics11 <strong>Fraser</strong> <strong>River</strong> <strong>sockeye</strong> <strong>salmon</strong> – status of DFO science <strong>and</strong> management12 Sockeye habitat analysis in the Lower <strong>Fraser</strong> <strong>River</strong> <strong>and</strong> the Strait of GeorgiaExperts were engaged to undertake the projects <strong>and</strong> to analyse the contribution of their topic areato the decline in <strong>Fraser</strong> <strong>sockeye</strong> production. The researchers’ draft reports were peer-reviewed<strong>and</strong> were finalized in early 2011. Reviewer comments are appended to the present report, one ofthe reports in the Cohen Commission Technical Report Series.
Stage 2: Smolt OutmigrationWe analyzed the same factors for Stage 2 as for Stage 1 <strong>and</strong> came to the same conclusions. Thereare however three key differences in our analyses for these two stages. First, regardless ofdifferences in their spawning <strong>and</strong> rearing habitats, all <strong>sockeye</strong> stocks pass through the highlydeveloped Lower <strong>Fraser</strong> region. Second, migrating smolts are exposed to the above-describedstressors for a much shorter time than are eggs <strong>and</strong> fry, which reduces the likelihood of effects.Third, since smolt migration occurs subsequent to enumeration of fry <strong>and</strong> smolts in rearing lakes,we have no analyses relating survival rates to potential stressors during this life history stage.Thus our conclusions have a lower level of confidence than for Stage 1. While there are somesurvival estimates for acoustically tagged smolts, these <strong>data</strong> (which only cover a few stocks)were not analyzed by any of the Cohen Commission technical studies. None of the factorsconsidered for Stage 2 is likely to have been much worse in 2007 for downstream migratingsmolts (affecting the 2009 returns), or to have been much better in 2008 (affecting the 2010returns).Stage 3: Coastal Migration <strong>and</strong> Migration to Rearing AreasThere are almost no <strong>data</strong> on exposure for pathogens making no conclusion possible. Theevidence presented suggests that <strong>sockeye</strong> <strong>salmon</strong> in the Strait of Georgia have little directexposure to human activities <strong>and</strong> development 2 , leading to a conclusion that it is unlikely thatthese factors have contributed to the decline of <strong>Fraser</strong> <strong>River</strong> <strong>sockeye</strong> <strong>salmon</strong>. Sockeye <strong>salmon</strong>have been exposed to predators, marine conditions, <strong>and</strong> climate change during this early marinephase. However, there has been no evidence presented on any correlations between key predators<strong>and</strong> <strong>sockeye</strong> <strong>salmon</strong> survival. Some important predators appear to be increasing in abundance,<strong>and</strong> some potentially important alternate prey appear to be decreasing, but many other knownpredators are decreasing or remaining stable. It therefore remains possible that predators havecontributed to the observed declines in <strong>sockeye</strong> <strong>salmon</strong>. Based on plausible mechanisms,exposure, consistency with observed <strong>sockeye</strong> productivity changes, <strong>and</strong> other evidence, marineconditions <strong>and</strong> climate change are considered likely contributors to the long-term decline of<strong>Fraser</strong> <strong>River</strong> <strong>sockeye</strong> <strong>salmon</strong>. It is also very likely that poor marine conditions during the coastalmigration life stage in 2007 contributed to the poor returns observed in 2009. Marine conditionswere much better in 2008 (much cooler temperatures), which benefited returns in 2010.Aquaculture was not considered in our report as the Commission Technical reports on thispotential stressor were not available, but will be considered in an addendum to this report.2 “Human activities <strong>and</strong> development” refers specifically to those activities <strong>and</strong> developments considered withinTechnical Report #12 (<strong>Fraser</strong> <strong>River</strong> Sockeye Habitat Use in the Lower <strong>Fraser</strong> <strong>and</strong> Strait of Georgia), which do notinclude <strong>salmon</strong> farms. Exposure to <strong>salmon</strong> farms will be covered in the technical report on aquaculture, which iscurrently in progress. The present report does not provide any conclusions regarding <strong>salmon</strong> farms.
Stage 4: Growth in North Pacific <strong>and</strong> Return to <strong>Fraser</strong>Our conclusions on this life history stage are similar to those for Stage 3, though we concludethat marine conditions <strong>and</strong> climate change remain possible contributors to the long-termdecline of <strong>Fraser</strong> <strong>River</strong> <strong>sockeye</strong> <strong>salmon</strong> (whereas in Stage 3, we considered them to be likelycontributors).Stage 5: Migration back to SpawnWhile the timing of increased en-route mortality coincides generally with the <strong>Fraser</strong> <strong>sockeye</strong>situation, the <strong>Fraser</strong> <strong>sockeye</strong> productivity indices already account for en-route mortality (i.e.,recruits = spawners + harvest + en-route mortality). Therefore, there is no point in examiningcorrelations between en-route mortality <strong>and</strong> life cycle or post-juvenile productivity indiceswithin the same generation. The only possible effects on productivity are inter-generationaleffects, for which the evidence is limited <strong>and</strong> equivocal. We therefore conclude that it is unlikelythat en-route mortality (or pre-spawn mortality 3 , which has only increased for Late Run <strong>sockeye</strong>)are a primary factor in declining indices of <strong>Fraser</strong> <strong>sockeye</strong> productivity. However, en-routemortality has definitely had a significant impact on the <strong>sockeye</strong> fishery <strong>and</strong> the numbers of adultfish reaching the spawning ground, particularly for the Early <strong>and</strong> Late runs. Pre-spawnmortality, habitat changes, <strong>and</strong> contaminants are unlikely to be responsible for the overallpattern of declining <strong>sockeye</strong> productivity. No conclusion is possible regarding pathogens due toinsufficient <strong>data</strong>. None of the factors assessed for this life history stage are likely to have shownsignificant changes between 2009 <strong>and</strong> 2010.The above conclusions are based on qualitative <strong>and</strong> quantitative analyses of existing information.There are two important caveats on these conclusions. First, there are major gaps in both ourfundamental underst<strong>and</strong>ing of how various factors interact to affect <strong>Fraser</strong> <strong>River</strong> <strong>sockeye</strong><strong>salmon</strong>, <strong>and</strong> in the <strong>data</strong> available to quantify those factors. Second, all Cohen Commissionresearchers have had a limited amount of time to analyze existing information; future <strong>data</strong>syntheses <strong>and</strong> analyses may provide deeper <strong>and</strong> different insights. Below, we summarize ourrecommendations for research, monitoring <strong>and</strong> <strong>synthesis</strong> activities.Recommendations for Research, Monitoring <strong>and</strong> SynthesisResearchers at the Cohen Commission workshop agreed with the PSC report (Peterman et al.2010) that the 2009 <strong>and</strong> long-term declines in <strong>sockeye</strong> productivity were likely due to the effects3 Pre-spawn mortality is defined as females that have arrived on spawning grounds but die with most of their eggs retained intheir body.
of multiple stressors <strong>and</strong> factors, <strong>and</strong> that a strong emphasis should be placed on studying theentire life cycle of <strong>sockeye</strong> <strong>salmon</strong> along with their potential stressors. Unlike the PSC report,participants felt that research efforts should be exp<strong>and</strong>ed outside the Strait of Georgia as apriority area, as well as increasing efforts inside the Strait.Section 5.2 of this report describes 23 recommended research <strong>and</strong> monitoring activities,organized by life history stage, based on four sources: the PSC report (Peterman et al. 2010), theCohen Commission’s research workshop, the Commission’s Technical reports, <strong>and</strong> this<strong>cumulative</strong> effects assessment. We have highlighted 12 of these 23 recommendations asparticularly high priority, but the others are also essential to provide the information needed toproperly manage <strong>Fraser</strong> <strong>sockeye</strong>. The three dominant themes are: 1) coordinated, multi-agencycollection of <strong>data</strong> on <strong>sockeye</strong> stock abundance, survival <strong>and</strong> stressors for each life history stage;2) development of an integrated <strong>data</strong>base <strong>and</strong> <strong>cumulative</strong> assessments both within <strong>and</strong> acrossmultiple life history stages; <strong>and</strong> 3) transparent dissemination of information annually to scientists<strong>and</strong> non-scientists. Since the early marine environment appears to be a major potential source ofdeclining productivity, it is particularly important to improve information on potential stressorsaffecting <strong>sockeye</strong> along their migratory path from the mouth of the <strong>Fraser</strong> <strong>River</strong> through QueenCharlotte Sound, including food, predators, pathogens, <strong>and</strong> physical, chemical, <strong>and</strong> biologicalocean conditions. Further efforts to prioritize, sequence <strong>and</strong> refine our recommendations willrequire a careful consideration of several factors: the ultimate uses of the information; giventhose uses, the appropriate space <strong>and</strong> time scales <strong>and</strong> required/achievable levels of accuracy <strong>and</strong>precision; <strong>and</strong> the most cost-effective, well-integrated designs for the overall monitoring <strong>and</strong>research program.
Table of Contents1.0 Introduction............................................................................................................... 11.1 Project Objectives ........................................................................................... 11.2 Report Overview ............................................................................................. 22.0 Cumulative Impacts or Effects .................................................................................. 52.1 What are Cumulative Impacts or Effects? ....................................................... 52.2 Cumulative Effects Assessment...................................................................... 62.3 Present Cumulative Effects Analysis............................................................... 83.0 Complexity, Caveats, <strong>and</strong> Overall Approach, ......................................................... 133.1 Complexity of the Ecological System ............................................................ 133.2 Unknowns, Unknowables, Knowledge Gaps, <strong>and</strong> Data Limitations .............. 143.3 Current Framework ....................................................................................... 163.3.1 Overview ........................................................................................ 163.3.2 Conceptual model .......................................................................... 163.3.3 Life history perspective/approach................................................... 203.3.4 Types of evidence .......................................................................... 203.3.5 A weight of evidence approach to retrospective ecological riskassessment .................................................................................... 203.3.6 Quantitative analyses ..................................................................... 244.0 Results, Synthesis <strong>and</strong> Discussion ......................................................................... 294.1 The Pattern We Need to Explain................................................................... 294.2 Stage 1: Incubation, Emergence <strong>and</strong> Freshwater Rearing............................ 394.2.1 Plausible mechanisms.................................................................... 394.2.2 Exposure of <strong>Fraser</strong> <strong>River</strong> <strong>sockeye</strong> to stressors .............................. 424.2.3 Correlation/consistency with patterns in <strong>Fraser</strong> <strong>River</strong> <strong>sockeye</strong>productivity ..................................................................................... 434.2.4 Correlation/consistency with patterns in non-<strong>Fraser</strong> <strong>River</strong><strong>sockeye</strong> productivity ....................................................................... 464.2.5 Other evidence ............................................................................... 474.2.6 Conclusions.................................................................................... 484.2.7 Key things we need to know better................................................. 494.3 Stage 2: Smolt Outmigration ......................................................................... 504.3.1 Plausible mechanisms.................................................................... 504.3.2 Exposure of <strong>Fraser</strong> <strong>River</strong> <strong>sockeye</strong> to stressors .............................. 504.3.3 Correlation/consistency with patterns in <strong>Fraser</strong> <strong>River</strong> <strong>sockeye</strong>productivity ..................................................................................... 514.3.4 Correlation/consistency with patterns in non-<strong>Fraser</strong> <strong>River</strong><strong>sockeye</strong> productivity ....................................................................... 53i
4.3.5 Other evidence ............................................................................... 534.3.6 Conclusions.................................................................................... 534.3.7 Key things we need to know better................................................. 554.4 Stage 3: Coastal Migration <strong>and</strong> Migration to Rearing Areas.......................... 554.4.1 Plausible mechanisms.................................................................... 554.4.2 Exposure of <strong>Fraser</strong> <strong>River</strong> <strong>sockeye</strong> to stressors .............................. 584.4.3 Correlation/consistency with patterns in <strong>Fraser</strong> <strong>River</strong> <strong>sockeye</strong>productivity ..................................................................................... 614.4.4 Correlation/consistency with patterns in non-<strong>Fraser</strong> <strong>River</strong><strong>sockeye</strong> productivity ....................................................................... 634.4.5 Other evidence ............................................................................... 634.4.6 Conclusions.................................................................................... 694.4.7 Key things we need to know better................................................. 704.5 Stage 4: Growth in North Pacific <strong>and</strong> Return to <strong>Fraser</strong> ................................. 714.5.1 Plausible mechanisms.................................................................... 714.5.2 Exposure of <strong>Fraser</strong> <strong>River</strong> <strong>sockeye</strong> to stressors .............................. 734.5.3 Correlation/consistency with patterns in <strong>Fraser</strong> <strong>River</strong> <strong>sockeye</strong>productivity ..................................................................................... 764.5.4 Correlation/consistency with patterns in non-<strong>Fraser</strong> <strong>River</strong><strong>sockeye</strong> productivity ....................................................................... 774.5.5 Other evidence ............................................................................... 784.5.6 Conclusions.................................................................................... 784.5.7 Key things we need to know better................................................. 794.6 Stage 5: Migration back to Spawn................................................................. 804.6.1 Plausible mechanisms.................................................................... 804.6.2 Exposure of <strong>Fraser</strong> <strong>River</strong> <strong>sockeye</strong> to stressors .............................. 814.6.3 Correlation/consistency with patterns in <strong>Fraser</strong> <strong>River</strong> <strong>sockeye</strong>productivity ..................................................................................... 834.6.4 Correlation/consistency with patterns in non-<strong>Fraser</strong> <strong>River</strong><strong>sockeye</strong> productivity ....................................................................... 854.6.5 Other evidence ............................................................................... 854.6.6 Conclusions.................................................................................... 854.6.7 Key things we need to know better................................................. 874.7 Effects over Entire Life Cycle ........................................................................ 874.7.1 Qualitative assessment of the potential for <strong>cumulative</strong> effectsover the entire life cycle.................................................................. 874.7.2 Quantitative analyses across the entire life cycle ........................... 914.8 Other Potential Factors Not Included in Cohen Commission ........................ 995.0 Conclusion............................................................................................................ 1015.1 Important Contributors to the Decline of <strong>Fraser</strong> <strong>River</strong> Sockeye .................. 101Stage 1: Incubation, Emergence <strong>and</strong> Freshwater Rearing...................... 101Stage 2: Smolt Outmigration ................................................................... 101Stage 3: Coastal Migration <strong>and</strong> Migration to Rearing Areas ................... 102ii
Stage 4: Growth in North Pacific <strong>and</strong> Return to <strong>Fraser</strong> ........................... 102Stage 5: Migration back to Spawn........................................................... 1035.2 Research <strong>and</strong> Monitoring Priorities ............................................................. 1035.2.1 Results from the workshop........................................................... 1035.2.2 Synthesis of recommendations from Cohen CommissionTechnical Reports ........................................................................ 1056.0 References ........................................................................................................... 111Appendix 1. Statement of Work................................................................................... 117Appendix 2. Reviewer Evaluations <strong>and</strong> Responses .................................................... 121Appendix 3. Data <strong>and</strong> Methods................................................................................... 165Appendix 4. Quantitative Results ................................................................................ 226Appendix 5. Data Template User Guidelines .............................................................. 265Appendix 6. Workshop Report 1 (Nov. 30-Dec. 1, 2010) ............................................ 273iii
List of TablesTable 4.2-1. Evaluation of the relative likelihood that potential stressorsencountered by <strong>Fraser</strong> <strong>River</strong> <strong>sockeye</strong> <strong>salmon</strong> during life history stage1 (including eggs, alevins, fry, <strong>and</strong> parr), have contributed to overalldeclines in productivity in recent decades. ................................................. 48Table 4.3-1. Evaluation of the relative likelihood that potential stressorsencountered by <strong>Fraser</strong> <strong>River</strong> <strong>sockeye</strong> <strong>salmon</strong> during their smoltmigration from rearing habitats to the <strong>Fraser</strong> Estuary (Stage 2) havecontributed to overall declines in productivity in recent decades. ............... 54Table 4.4-1. Variables used in the quantitative analyses of marine conditions inQueen Charlotte Sound (QCS) <strong>and</strong> the Strait of Georgia (SoG) ................ 66Table 4.4-2. Model specifications for the 1969-2004 (brood years) model set.............. 67Table 4.4-3. Model specifications for the 1980-2004 (brood years) model set.............. 67Table 4.4-4. Model specifications for the 1996-2004 (brood years) model set forQueen Charlotte Sound.............................................................................. 68Table 4.4-5. Model specifications for the 1996-2004 (brood years) model set forthe Strait of Georgia. .................................................................................. 68Table 4.4-6. Evaluation of the relative likelihood that potential stressorsencountered by <strong>Fraser</strong> <strong>River</strong> <strong>sockeye</strong> <strong>salmon</strong> during their coastalmigration <strong>and</strong> migration to ocean rearing areas have contributed tooverall declines in productivity in recent decades....................................... 70Table 4.5-1. Evaluation of the relative likelihood that potential stressorsencountered by <strong>Fraser</strong> <strong>River</strong> <strong>sockeye</strong> <strong>salmon</strong> during their growth <strong>and</strong>maturation in the ocean <strong>and</strong> return to the <strong>Fraser</strong> <strong>River</strong> (Stage 4) havecontributed to overall declines in productivity in recent decades. ............... 79Table 4.6-1. Evaluation of the relative likelihood that potential stressorsencountered by <strong>Fraser</strong> <strong>River</strong> <strong>sockeye</strong> <strong>salmon</strong> from the time returningadults enter the <strong>Fraser</strong> Estuary to when they spawn (Stage 5) havecontributed to the overall decline of the population in recent decades. ...... 86Table 4.7-1. Evaluation of the relative likelihood that potential stressorsencountered by <strong>Fraser</strong> <strong>River</strong> <strong>sockeye</strong> <strong>salmon</strong> during each life historystage have contributed to overall declines in productivity in recentdecades...................................................................................................... 90Table 4.7-2. Variables included in each model used to test the relative importanceof different life-history stages over the period of 1969-2001 (broodyears). ........................................................................................................ 93Table 4.7-3. Variables included in each model used to test the relative importanceof different stressor categories over the period of 1969-2001 (broodyears). ........................................................................................................ 96iv
Table 4.8-1. Other factors potentially contributing to the decline of <strong>Fraser</strong> <strong>River</strong><strong>sockeye</strong> <strong>salmon</strong> that were not considered within the spectrum ofCohen Commission technical reports....................................................... 100Table 5.2-1. Recommended research <strong>and</strong> monitoring priorities listed by <strong>sockeye</strong>life stage.. ................................................................................................. 108v
List of FiguresFigure 2.3-1. Cumulative stress model......................................................................... 10Figure 3.3-1. The conceptual model of the life history of <strong>Fraser</strong> <strong>River</strong> <strong>sockeye</strong><strong>salmon</strong> <strong>and</strong> potential stressors affecting each life stage.. .......................... 18Figure 3.3-2. Life history of <strong>Fraser</strong> <strong>River</strong> <strong>sockeye</strong> <strong>salmon</strong> illustrating generalizedmovement patterns among habitats. .......................................................... 19Figure 3.3-3. Flow diagram used to assign the relative likelihood that a particularfactor has made a substantial contribution to the decline of <strong>Fraser</strong><strong>River</strong> <strong>sockeye</strong> <strong>salmon</strong>, based on the answers to the questions used tochallenge the available evidence................................................................ 24Figure 4.1-1. Returns per spawner for all <strong>Fraser</strong> <strong>sockeye</strong> stocks combined.. .............. 29Figure 4.1-2. Locations of ocean entry for seaward-migrating juveniles of the 64<strong>sockeye</strong> <strong>salmon</strong> populations with time series <strong>data</strong> on annualabundances of spawners <strong>and</strong> the resulting adult returns or recruits........... 30Figure 4.1-3. Estimates of long term trends in total life cycle productivity for thefour <strong>Fraser</strong> <strong>sockeye</strong> run timing groups, by brood year. .............................. 33Figure 4.1-4. Estimates of long term trends in total life cycle productivity for non-<strong>Fraser</strong> <strong>sockeye</strong> stocks, by brood year........................................................ 34Figure 4.1-5. A) Total run size of adult Late-run <strong>sockeye</strong> <strong>salmon</strong> from 1977 to2008 with fish fate categorized into total catch, en route loss <strong>and</strong>spawning escapement................................................................................ 35Figure 4.1-6. Aggregate returns to the <strong>Fraser</strong> Basin (height of bars),recruits/spawner (line) <strong>and</strong> stock composition (colours within each bar),for each brood year.. .................................................................................. 37Figure 4.5-1. The proportion of Early Stuart <strong>sockeye</strong> returning as 5-year old adults.... 74Figure 4.5-2. Time series of the percentage of <strong>Fraser</strong> <strong>River</strong> <strong>sockeye</strong> <strong>salmon</strong> thatmigrate via the northern diversion (Johstone Strait). Source: PacificSalmon Commission unpublished <strong>data</strong>. ..................................................... 75Figure 4.6-1. Daily average temperature in the lower <strong>Fraser</strong> <strong>River</strong> averagedamong years within two time periods (thick line: 1951-1990; thin line:1991-2010) over the summer months......................................................... 82Figure 4.6-2. Number of years that en route loss by adults exceeded 50% for themajor <strong>Fraser</strong> <strong>River</strong> <strong>sockeye</strong> <strong>salmon</strong> stocks from 1996-2008...................... 83vii
1.0 Introduction1.1 Project ObjectivesOur work was organized around five objectives: workshop facilitation, <strong>data</strong> <strong>synthesis</strong> <strong>and</strong>integration, integrative analyses of <strong>cumulative</strong> <strong>impacts</strong> based on the ten technical reportscompleted to date for the Commission (the Aquaculture Report is still in progress), quantitativeanalyses of <strong>cumulative</strong> <strong>impacts</strong>, <strong>and</strong> clear communication. Each of these objectives is describedbelow.1. Workshop Facilitation. We organized <strong>and</strong> facilitated a science workshop (Nov. 30 – Dec. 1,2010) including presentations from all research groups, feedback <strong>and</strong> discussion from allresearchers <strong>and</strong> peer reviewers, <strong>and</strong> interactive discussion of linkages <strong>and</strong> interactions among allresearch projects. The results of this workshop are summarized in Appendix 6.2. Data Synthesis <strong>and</strong> Integration. Our first task under this objective was to assemble <strong>data</strong> onproductivity 4 <strong>and</strong> stressor metrics from all research projects, through development of a <strong>data</strong>template sent to all researchers, <strong>and</strong> assistance to these scientists on organizing their <strong>data</strong>.. Oncereceived, we then organized these <strong>data</strong> into an integrated format to support statistical analyses(i.e., a linked <strong>data</strong>base associating productivity indices for different stocks with <strong>data</strong> on stressorsfrom appropriate locations, stocks, years <strong>and</strong> time periods). This <strong>data</strong>base was designed to beexp<strong>and</strong>able in future to include other <strong>data</strong> sets that were not available in time for this project(e.g., information on aquaculture).3. Integrative Analyses of Cumulative Impacts. We first developed integrative frameworks fororganizing <strong>and</strong> analysing potential <strong>cumulative</strong> <strong>impacts</strong>, based on a life history approach. Oursecond task was to summarize patterns in <strong>Fraser</strong> Sockeye productivity over time <strong>and</strong> space, <strong>and</strong>other indicators relevant to the <strong>Fraser</strong> <strong>sockeye</strong> fishery, building on the work of Peterman <strong>and</strong>Dorner (2011) <strong>and</strong> other Cohen Commission technical reports. Third, we synthesized the keyfindings from all Cohen Commission technical reports (representing over 2400 pages) within4 Salmon biologists calculate total productivity as the number of mature adults produced per spawner. Mature adults(or recruits) are estimated as the number of fish returning to the coast before the onset of fishing. This estimate isderived by working backwards from the numbers of adults that eventually reached the spawning ground, plus anyen-route mortality between the mouth of the <strong>Fraser</strong> <strong>and</strong> the spawning ground, plus harvest. The total abundance ofreturning adult <strong>Fraser</strong> <strong>sockeye</strong> <strong>salmon</strong> is a product of the number of spawners in the parent generation times theirproductivity. Biologists also estimate juvenile productivity (fry or smolts per spawner), <strong>and</strong> post-juvenileproductivity (mature adults per fry or spawner).1
these integrative frameworks, converging to conclusions about the relative likelihood of differentfactors explaining observed patterns in <strong>Fraser</strong> <strong>sockeye</strong> productivity. One difficulty in this processis that each researcher used their own approach for synthesizing <strong>and</strong> organizing information.Thus we recognized that the third step would involve mining key findings within each technicalreport that fit our integrative framework, <strong>and</strong> then assess potential <strong>cumulative</strong> <strong>impacts</strong> within <strong>and</strong>between life history stages.4. Quantitative Analyses of Cumulative Impacts. We first determined reasonable hypothesesworth testing, given plausible mechanisms of impact on <strong>sockeye</strong> as outlined in the CohenCommission Technical Reports. To the extent possible given available <strong>data</strong>, we then completedstatistical analyses to determine the relative ability of various factors (representing differentcombinations of stressors) to explain changing patterns of productivity in <strong>Fraser</strong> <strong>sockeye</strong>. Wherefeasible, we incorporated quantitative analyses into the Integrative Analyses of CumulativeImpacts (objective 3 above).5. Clear Communication. This is a cross-cutting objective, namely to clearly communicate howthe stressors examined by the Cohen Commission research projects could interact to affect <strong>Fraser</strong><strong>River</strong> <strong>sockeye</strong>. The intent of this objective is to develop methods of presenting <strong>and</strong> reporting keyfindings that will be accessible to the diverse audiences interested in the work of the CohenCommission, including Judge Cohen <strong>and</strong> the Cohen Commission scientific <strong>and</strong> legal staff,Cohen Commission Participants, interested members of the public, research contractors, <strong>and</strong> peerreviewers.1.2 Report OverviewThis technical report is organized into the following sections:Section 2.0: Cumulative Impacts or EffectsThis section introduces the concept of <strong>cumulative</strong> <strong>impacts</strong> or <strong>cumulative</strong> effects, some key ideasassociated with this concept, <strong>and</strong> their application to this project.Section 3.0: Complexity, Caveats <strong>and</strong> Overall ApproachThis section describes the approach we used to synthesize <strong>and</strong> integrate evidence across otherassociated technical reports, first identifying some of the overarching limitations on this type ofanalysis (e.g., the inherent complexity of the underlying ecological system, the significant gapsin our knowledge), <strong>and</strong> how these limitations enact constraints on the ability to make definitiveconclusions about cause-effect relationships.2
Section 4.0: Results, Synthesis <strong>and</strong> DiscussionThis section provides the results of our qualitative <strong>cumulative</strong> impact analysis, integratingevidence across other Cohen Commission technical reports by life history stage, as well as someof the important results from our quantitative <strong>cumulative</strong> <strong>impacts</strong> analyses. This section coversthe breadth of the evidence presented within the suite of Cohen Commission technical reports,but refers to those reports, <strong>and</strong> the appendices of this report, for greater details on the depth ofevidence available.Section 5.0: ConclusionThis section summarizes Section 4.0 along two themes. First, given existing knowledge, whatoverall conclusions can be drawn about the importance of different potential contributors to thedecline of <strong>Fraser</strong> <strong>River</strong> <strong>sockeye</strong> <strong>salmon</strong>? Second, what future research <strong>and</strong> monitoring activitiesmight best reduce critical uncertainties in our existing knowledge?Appendices:Appendix 1: Statement of Work provides the original Statement of Work from the Commissionfor this technical report.Appendix 2: Reviewer Evaluations <strong>and</strong> Responses provides the reviewers’ evaluations of ourdraft report, <strong>and</strong> our responses to their comments, including revisions that we incorporated intothis final report.Appendix 3: Data <strong>and</strong> Methods describes the <strong>data</strong> we received, how we organized it, <strong>and</strong> ourapproach to qualitative <strong>and</strong> quantitative analyses. We also suggest possible future quantitativeapproaches that could not be implemented in our project due to time limitations.Appendix 4: Quantitative Results presents the results of our quantitative analyses.Appendix 5: Data Template User Guidelines provides the guidelines that accompanied the <strong>data</strong>template we developed to guide Commission contractors supplying us with <strong>data</strong>.Appendix 6: Workshop Report contains the agenda, summary report <strong>and</strong> detailed minutes fromthe two day, Cohen Commission Scientific <strong>and</strong> Technical Workshop, November 30 – December1, 2010.3
2.0 Cumulative Impacts or Effects2.1 What are Cumulative Impacts or Effects?One of the primary goals of this project is to examine the potential <strong>cumulative</strong> <strong>impacts</strong> on <strong>Fraser</strong><strong>River</strong> <strong>sockeye</strong> <strong>salmon</strong> productivity, of multiple stressors acting at different times <strong>and</strong> places. Theterms <strong>cumulative</strong> effects <strong>and</strong> <strong>cumulative</strong> <strong>impacts</strong> are frequently used interchangeably. In Section2.0 we use the term “<strong>cumulative</strong> effects” to respect the convention of the literature to which werefer; however, throughout the rest of the report, we generally use the term “<strong>cumulative</strong> <strong>impacts</strong>”to respect the language with which our original assignment from the Cohen Commission wasdescribed.We start by exploring what is meant by “<strong>cumulative</strong> effects”. Unfortunately, while there is nouniversal definition of “<strong>cumulative</strong> effects”, there are some general concepts worthy of review.What is an effect? Greig (2010) defines an environmental effect as, “a change in a component,property or function of an ecosystem.” In the present project we are concerned specifically withadverse environmental effects that “diminish a desirable component, property, or function of anecosystem” (Greig 2010), namely, the ecosystems that support <strong>Fraser</strong> <strong>sockeye</strong>, <strong>and</strong> the <strong>sockeye</strong>stocks themselves.What is it that is being affected? To assess the consequences of particular stressors, we need todefine the Valued Ecosystem Component (VEC), the focal component that society wishes toprotect, conserve or enhance. These are the <strong>sockeye</strong> stocks occupying the 36 Conservation Unitsin the <strong>Fraser</strong> <strong>River</strong> watershed.Which effects are being examined <strong>cumulative</strong>ly? There are various conceptualizations relevant tothis question. Cumulative effects could be conceived as:• the total impact of a single type of stress that has occurred repeatedly over time,possibly increasing in frequency or magnitude (e.g., the <strong>cumulative</strong> effect of waterpollution in the <strong>Fraser</strong> <strong>River</strong> estuary over the past four decades);• the total impact of a single type of stress that occurred repeatedly over space (e.g.,the <strong>cumulative</strong> effect of multiple mountain pine beetle outbreaks across the entire <strong>Fraser</strong><strong>River</strong> watershed);• the total impact of many different types of stressors at one point in time or over aperiod of time (e.g., the <strong>cumulative</strong> effect of changing climate, increased mammalpredation, <strong>and</strong> increased harmful algal blooms).Even when multiple stressors are examined together, there is a distinction between examining therelative magnitude of <strong>impacts</strong> of each stressor, versus examining the mechanisms by which5
stressors interact or combine to affect <strong>sockeye</strong>. The first type of analysis might examine allstressors to determine which factors made the largest independent contribution to a change in theVEC. For example, what has had a larger relative effect on <strong>sockeye</strong> productivity: increases inpredators, increases in diseases <strong>and</strong> parasites, decreased food resources, or increased competitionfor food? Such a question explores the relative importance of each individual factor.The second kind of analysis looks at how multiple effects might combine (i.e., how multiplestressors might interact to produce a combined impact different (in form or magnitude) fromeach stressor acting independently). For example, how might increasing ocean temperatures haveaffected predators, diseases <strong>and</strong> parasites in a way that changes their overall impact? There aremany ways in which individual effects might combine to form types of “<strong>cumulative</strong> effects”.Sonntag et al. (1987) classified <strong>cumulative</strong> effects into the following types: linear additiveeffects, amplifying or exponential effects, discontinuous effects, <strong>and</strong> structural surprises. Greig etal. (2003) suggested an alternative categorization of types of <strong>cumulative</strong> effects: additive,compensatory, synergistic, <strong>and</strong> masking.2.2 Cumulative Effects Assessment“Cumulative Effects Assessment” (CEA) specifically refers to the process in which the effects ofa proposed project are assessed together with the effects of other past, present or future projectsto determine the overall <strong>cumulative</strong> effects on Valued Ecosystem Components (VECs). Underthe Canadian Environmental Assessment Act (CEAA) CEA is required for all projects where theAct applies <strong>and</strong> is thus a part of the project approval process. The issue at h<strong>and</strong>, a retrospectiveinvestigation into the potential causes underlying the decline of <strong>Fraser</strong> <strong>River</strong> <strong>sockeye</strong> <strong>salmon</strong>, isin many ways fundamentally different from the forward-looking Environmental ImpactAssessment process. However, there are many important shared concepts about how “<strong>cumulative</strong>effects” are defined <strong>and</strong> used, or rather how they should be, that are critical to underst<strong>and</strong>.According to current practice, two criteria may be used to determine if CEA is required for aproposed project. First, in some cases it has been argued that the effects of the individual projectmust be significant on their own (L. Greig, pers. comm.). If the effects of an individual projectare insignificant, it is assumed that the project’s contribution to potential <strong>cumulative</strong> effects willalso be insignificant <strong>and</strong> a CEA will not be required for project approval. This is inappropriatesince effects that are individually insignificant when combined with other effects can result insignificant <strong>impacts</strong>. Second, some practitioners take the view the proposed project <strong>and</strong> otherrelevant developments/projects must have effects of the same type, with the same timing, at thesame location. If multiple projects have effects that differ by type or timing or location, it is6
assumed that there is no potential for <strong>cumulative</strong> effects <strong>and</strong> a CEA will not be required (Greig2010, Golder Associates Ltd. 2008).Greig <strong>and</strong> Duinker have argued repeatedly that this narrow definition of <strong>cumulative</strong> effects isinherently flawed (e.g. Duinker <strong>and</strong> Greig 2006, 2007; Greig <strong>and</strong> Duinker 2008). They argue thatindividual projects with insignificant effects or different types, timing, or location of effects, maystill contribute to significant <strong>cumulative</strong> effects (also Berube 2007). CEA should be focused onVECs rather than projects because ultimately the <strong>cumulative</strong> effects on VEC sustainability arethe effect of greatest concern. The aggregate stress on a VEC includes all projects <strong>and</strong>developments (whether or not they meet the requirements for EIAs or CEAs) as well as manynatural drivers – a VEC must endure all these stressors <strong>cumulative</strong>ly. It is the net consequence ofthe aggregate stresses that determines the status <strong>and</strong> sustainability of a VEC (Greig et al. 2003).Cumulative effects are the “only real effect worth assessing” <strong>and</strong> need to be assessed at the scaleof ecological regions (Duinker <strong>and</strong> Greig 2006).Although the present research project is not an environmental impact assessment project, it doesaddress several of the criticisms of the st<strong>and</strong>ard approach to “<strong>cumulative</strong> effects” in Canada.First, this project is definitively centered on a focal VEC – <strong>Fraser</strong> <strong>River</strong> <strong>sockeye</strong> <strong>salmon</strong>. Second,this project uses the relevant ecological regions as a study area – the <strong>Fraser</strong> <strong>River</strong> watershed <strong>and</strong>estuary, the Strait of Georgia, <strong>and</strong> the marine migratory extent of <strong>Fraser</strong> <strong>River</strong> <strong>sockeye</strong>. Third,the analyses include a large range of factors hypothesized to be contributors to the decline in theVEC <strong>and</strong> these factors are all considered to potentially contribute to <strong>cumulative</strong> <strong>impacts</strong> on theVEC even though they differ substantially in type, timing <strong>and</strong> location of their primary effects.Another major difference between a CEA <strong>and</strong> the present research is the temporal direction offocus. A CEA is explicitly future focused. Environmental assessment is an exercise indetermining different possible future scenarios <strong>and</strong> examining the potential <strong>impacts</strong> of actionstaken today across those possible futures. In environmental assessment, past actions cannot bechanged <strong>and</strong> are only useful for discovering <strong>and</strong> calibrating cause-<strong>and</strong>-effect relationships amongactions <strong>and</strong> VEC-consequences. However, the Cohen Commission is explicitly focused on thepast. It is inherently concerned with retrospective analyses to determine the magnitude <strong>and</strong>nature of those cause-<strong>and</strong>-effect relationships. The ultimate goal of such knowledge isprospective - to facilitate more strongly informed future management decisions. However, thecritical first step is to improve our retrospective underst<strong>and</strong>ing of the fundamental relationshipsbetween impact factors <strong>and</strong> VEC sustainability (<strong>Fraser</strong> <strong>sockeye</strong> productivity <strong>and</strong> recruitment).7
2.3 Present Cumulative Effects AnalysisThe present <strong>cumulative</strong> effects analysis relies on <strong>data</strong> provided by each of the independentresearch projects investigating a different potential category of stressor. Some of the analysesexamine potential interactions among different types of stressors, but most of our quantitativework focuses on the relative impact of these different factors. Our analyses are be limited by: 1)the quality <strong>and</strong> extent of the <strong>data</strong> that are actually available; <strong>and</strong> 2) the degree of complexity inthe “true” underlying causes of the recent decline in productivity of <strong>Fraser</strong> <strong>River</strong> <strong>sockeye</strong>.We first address the issue of complexity. Figure 2.3-1 illustrates four different hypothetical pathsby which an individual <strong>sockeye</strong> <strong>salmon</strong> could be exposed to stressors over its lifetime, yet allleading to the same outcome - death as an adult. For the sake of simplicity, we have assumed it ispossible to integrate all stress factors into a single measure of <strong>cumulative</strong> stress where 0.0represents perfect health <strong>and</strong> 1.0 represents mortality. There are four scenarios described inFigure 2.3-1:o A1: the <strong>sockeye</strong> is severely affected by stressors as a fry (e.g., acquiring a disease thatalmost killed it <strong>and</strong> permanently affected its health), but does not suffer any further stressuntil, as an adult, a minor incremental impact results in death.o A2: the stressor that almost killed the <strong>sockeye</strong> as a fry killed off many other fry, reducingcompetition for food at the smolt stage, improving the health of surviving individuals;o B: the <strong>sockeye</strong> suffers moderate stress from many separate incidents over its lifetime,eventually dying at the same age as under the other scenarios even though none of thestressors experienced were even moderately severe.o C: the <strong>sockeye</strong> is only moderately affected by stressors over its lifetime until, as an adult,it is impacted severely by stressors that quickly result in death (e.g., low food, abundantpredators, high temperatures).In scenarios A <strong>and</strong> C, the rapid induction of severe stress could be either one severe stressor ormany stressors occurring simultaneously but within a similarly constrained window of time. Inscenario B, the slow induction of moderate stress could be either continued exposure to onestressor over the entire lifetime, or many different stressors occurring variably over time <strong>and</strong>space.If scenario A or C accurately represent the “true” pathway, this relationship might be detected bytesting the fit to productivity indices of models that only include sets of factors limited to fry (A)<strong>and</strong> adult (C) life history stages. If scenario B represents the “true” pathway with one keystressor, this relationship might be detected by testing model sets limited to particular stressors or8
classes of stressors. However, if scenario B represents the “true” pathway with many stressorscombining <strong>and</strong> interacting over time <strong>and</strong> space, this relationship may be very difficult to detect.The quality <strong>and</strong> extent of available <strong>data</strong> severely limits the range of analyses that can beperformed, as we discuss later.The scope of the present <strong>cumulative</strong> effects analysis is limited to the scope of the CohenCommission technical research projects as a whole. Our <strong>cumulative</strong> effects analysis has beenconducted within the universe of the other technical projects <strong>and</strong> the <strong>data</strong> available from withinthose projects. This is not a <strong>cumulative</strong> effects study of <strong>Fraser</strong> <strong>River</strong> <strong>sockeye</strong> <strong>salmon</strong> within thebroader realm of all available scientific literature, research <strong>and</strong> reports.9
Cumulative Stress (arbitrary units)1.0 MortalityHigh morbidity0.0AA1A2BEgg Fry Smolt Adult SpawnerCTime (Life-history Stages)Figure 2.3-1. Cumulative stress model. Lines illustrate four scenarios through which an individual <strong>sockeye</strong> <strong>salmon</strong>might suffer from the <strong>cumulative</strong> <strong>impacts</strong> of exposure to stressors over its lifetime. Each scenario illustratesa different pattern in the number, severity <strong>and</strong> timing of stressors experienced, yet the timing of mortality isthe same for all three scenarios. For both Scenarios A <strong>and</strong> C, it is evident that eventual mortality isprimarily the result of one particular period of substantial stress, though in Scenario A this is not theproximate reason for death. Scenario A2 reflects the possibility that density-dependence effects on thepopulation might occur within a single generation (as compared to density-dependent effects that may alsooccur across generations), which could benefit surviving individuals. That is, in Scenario A2, the stressorthat almost kills this hypothetical individual may actually kill a substantial portion of the rest of thepopulation. If so, the surviving individuals may encounter improved conditions as smolts due to lowerdensity <strong>and</strong> less competition for resources. However, in Scenario B mortality is the result of manysubsequent <strong>impacts</strong> over the individual’s entire lifetime, none of which would have resulted in mortality ontheir own or even as a small subset of the <strong>cumulative</strong> impact. A roughly similar conceptual model could bedeveloped for an entire <strong>sockeye</strong> population, though it would be more appropriate to use overall survivalrates, which would decrease over time <strong>and</strong> life history stages.Concepts of <strong>cumulative</strong> effects are embedded throughout this report. First, we have alreadydiscussed above discuss the theory of <strong>cumulative</strong> effects. Second, the conceptual model (Figure3.3-1) embodies several characteristics of <strong>cumulative</strong> effects analyses: it provides a graphicalrepresentation of how the valued ecosystem component (i.e., <strong>sockeye</strong> <strong>salmon</strong>) is potentially10
affected by many stressors over its lifetime; these stressors may be independent factors occurringsimultaneously or the interaction of several factors; <strong>and</strong> stress may accumulate over multiple lifehistory stages, as long as the <strong>salmon</strong> survives. Third, we consider the integrated responses ofeach life history stage to multiple potential stressors, rather than examining each stressorindependently, which was the focus of several of the other technical reports (e.g., climatechange, contaminants, pathogens, Lower <strong>Fraser</strong> <strong>and</strong> Strait of Georgia habitat, predators). Fourth,our quantitative analysis (introduced in Section 3.3.6; described in detail in Appendix 3 (SectionA3.5.2) examines the correlation between groups of stressors <strong>and</strong> total productivity, rather thanexamining these factors independently.11
3.0 Complexity, Caveats, <strong>and</strong> Overall Approach,3.1 Complexity of the Ecological SystemOver the 4 to 5 years of their life cycle, <strong>salmon</strong> encounter largely unmonitored variations inphysical <strong>and</strong> chemical conditions, food, competitors, predators, <strong>and</strong> disease, over severalthous<strong>and</strong> kilometres from high in the <strong>Fraser</strong> Basin to the Gulf of Alaska, with <strong>cumulative</strong> <strong>and</strong>interactive effects (most unknown), occurring over multiple life history stages in ways that varyfrom year to year. Gaps exist not only in <strong>data</strong> (limited time series <strong>and</strong> spatial coverage for manyfactors), but also in fundamental underst<strong>and</strong>ing. Under these circumstances, it is extremelydifficult for fisheries managers to accurately predict the expected returns of different <strong>salmon</strong>stocks in advance of their arrival. Indeed, pre-season predictions of <strong>sockeye</strong> returns are notreliable for 7 of 18 <strong>Fraser</strong> <strong>sockeye</strong> stocks (English et al. 2011; Executive Summary). Previouswork (Walters <strong>and</strong> Collie 1988, Walters 1989, Myers 1998) has emphasized the difficulties ofpredicting recruitment of fish populations for the purposes of fisheries management, includingthe lack of persistence of environment-recruitment correlations.Rocket science is commonly used as a benchmark when describing the relative difficulty of othersubjects (e.g., “It isn’t rocket science.”). Fisheries science also isn’t rocket science, but it isnonetheless very challenging. Rocket scientists rely on repeatable laws of physics, whereasecological interactions are much more variable over time <strong>and</strong> space, <strong>and</strong> much less understood. Ifa rocket scientist had equivalent challenges to a fisheries scientist, s/he would be launching <strong>and</strong>l<strong>and</strong>ing rockets with all the key variables determining outcomes (gravity, atmospheric pressure,temperature, solar radiation, fuel quality, cosmic rays) radically changing from year to year <strong>and</strong>place to place, with little ability to monitor this variation, <strong>and</strong> considerable uncertainty about thebasic theory behind each of these variables <strong>and</strong> their interactions.Given the above uncertainties, attributing causes to observed effects is very difficult. Peterman<strong>and</strong> Dorner (2011, pg. 13-14) express this challenge well:An important concept for readers to keep in mind when considering the evidencepresented in this <strong>and</strong> other scientific reports to the Cohen Commission is that ecologicalsystems are dynamic <strong>and</strong> constantly change across time <strong>and</strong> space. They are composed ofcomplex sets of components that interact to generate responses to concurrently operatingdisturbances arising from both natural processes (e.g., ocean conditions) <strong>and</strong> humanactivities (e.g., fish farming). Because of such simultaneously occurring natural <strong>and</strong>human processes, it can be very difficult to attribute single dominant causes to observedecological changes, <strong>and</strong> while it is important to investigate each potential causeindividually, it is important to be aware that it might have been the interaction of severalfactors, rather than one factor per se, that caused the changes. Two well-known case13
examples illustrate this problem -- the collapse of Canada's Northern cod populations inthe early 1990s <strong>and</strong> the virtual disappearance of California sardine in the 1960s -- both ofwhich fueled long debates about the relative importance of fishing, environmentalchanges, <strong>and</strong> government regulations in causing those collapses.The <strong>sockeye</strong> stocks within the <strong>Fraser</strong> Basin have widely varying life history, genetic <strong>and</strong> habitatcharacteristics that create different levels of vulnerability to the stressors each stock encounters(described in Nelitz et al. 2011). Effects of stressors on survival at any life history stage dependon both the magnitude of the stress <strong>and</strong> the vulnerability of the <strong>salmon</strong>. Characteristics that varyacross stocks include: spawning habitat (inlets, outlets, lake shore, flow rates, substrateconditions, environmental conditions), nursery lakes (area, size, productivity, temperature, icebreak-up, duration of rearing), smolt out-migration (distance, timing, temperatures, arrival atestuary, residence time in estuary), coastal migration (timing, duration, route), <strong>and</strong> adultmigration (return route, age of return, timing, estuary residence time, timing of upstreammigration, upstream distances <strong>and</strong> duration, river temperatures <strong>and</strong> other environmentalcharacteristics, pre-spawn mortality rates). Many <strong>Fraser</strong> <strong>sockeye</strong> stocks are strongly cyclical(e.g., Late Shuswap, Quesnel, Scotch) whereas others are less so. Once mobile, each <strong>salmon</strong> hasa recurring choice – eat or hide. Sockeye stocks (<strong>and</strong> sub-populations within each stock) havedeveloped complicated <strong>and</strong> varying life histories that include moving between ranges of habitatsvarying in the risks they represent (Christensen <strong>and</strong> Trites 2011, pg. 5). Finally, we are observinglarge scale effects of climate change in both freshwater <strong>and</strong> marine environments, withinfluences on many of the above attributes <strong>and</strong> their interactive relationships.3.2 Unknowns, Unknowables, Knowledge Gaps, <strong>and</strong> Data LimitationsGiven all of the above challenges, what can fisheries science achieve that is helpful to both theCohen Commission <strong>and</strong> fisheries managers? First, science can test hypotheses, rejecting thosethat are unlikely or false. Even with considerable gaps in <strong>data</strong> <strong>and</strong> underst<strong>and</strong>ing, <strong>and</strong> mostlyindirect evidence, contrasts over space <strong>and</strong> time in both <strong>salmon</strong> stock productivity <strong>and</strong> thepotential stressors allow us to judge certain stressors to be unlikely to have been the primaryfactors causing declines in <strong>sockeye</strong> productivity or abundance. Other factors may be possible oreven likely, provided that they fulfill most or all of various criteria (i.e., have a plausiblemechanism by which survival could be affected; have generally exposed <strong>Fraser</strong> <strong>sockeye</strong> toincreased stress over the period of productivity declines; correlate over space, time <strong>and</strong> stockswith variations in productivity; <strong>and</strong> (ideally) have other corroborating evidence from cause-effectstudies). The procedure by which we evaluate alternative hypotheses is described below insection 3.3. Two key principles are: 1) hypotheses can be rejected as false or unlikely, but cannotbe accepted as true (only relatively more likely); <strong>and</strong> 2) correlation does not equal causation (one14
also needs an underlying mechanism that can logically (<strong>and</strong> defensibly) link the cause withobserved effect).There are several challenges in this process of evaluating alternative hypotheses. The firstchallenge is <strong>data</strong> limitations, which include incomplete time series of information (both withineach stage of the life cycle <strong>and</strong> over multiple years), incomplete spatial coverage for all stocks,poor quality <strong>data</strong> (imprecise or inaccurate measurements), crude indicators that do not reallyreflect the condition of interest (e.g., air temperatures rather than the water temperatures where<strong>salmon</strong> eggs are incubating), <strong>and</strong> inconsistent methods of measurement. There are 36Conservation Units in the <strong>Fraser</strong> Basin (CUs). We only have estimates of spawning abundance<strong>and</strong> en-route mortality for about half of these CUs, <strong>and</strong> juvenile production estimates for aboutone quarter of these CUs. With the exception of a few detailed studies (available for only a fewyears <strong>and</strong> stocks), we do not have any estimates of survival rates or abundance between the timethat fry or smolts are sampled, <strong>and</strong> the time that adults return to be counted at Mission two tothree years later. When it comes to explanatory factors, we would ideally have <strong>data</strong> that are intergenerational(i.e., across 40 years to provide a pre-decline base period), intra-generational (acrosslife history stages <strong>and</strong> locations), <strong>and</strong> inter-stock (to explain why some have done well whileothers declined). Statistical analyses of multiple factors (to see which ones are best correlatedwith productivity patterns) require <strong>data</strong> on all of the factors for all of the stocks <strong>and</strong> yearsincluded in the analysis. As difficult as it is to retrospectively deduce which factors were more orless likely to have caused historical patterns, the one advantage that we have over predicting thefuture is that there is only one past.The second challenge is gaps in basic knowledge or underst<strong>and</strong>ing. We generally do not knowhow, where or when <strong>sockeye</strong> die. The few situations in which we can definitively determine thecauses of mortality are comparatively rare (i.e., fish harvests, stomach analyses of predators,intensive telemetry studies showing that fish died while experiencing conditions beyondestablished thresholds). In most cases, mortality must be inferred indirectly based on informationon the <strong>sockeye</strong>’s exposure to different stresses, but there are uncertainties in both fish migrationpatterns <strong>and</strong> the stresses experienced by each group of fish. McKinnell et al. (2011; pg. 4) pointout:“During the period of years of interest to the Commission, there are virtually noobservations of <strong>Fraser</strong> <strong>River</strong> <strong>sockeye</strong> <strong>salmon</strong> during about 75% of their life at sea, <strong>and</strong>the value of coincidental samples taken during their emigration from the Strait of Georgiais debatable.”Little is known about the potential impact that abundant predators may have on relatively rareprey. In such situations, it may be possible for the abundant predator to have a very large impacton, for example, a weak <strong>and</strong> declining <strong>sockeye</strong> stock, despite that prey being a minor <strong>and</strong>15
possibly even negligible component of the predators diet. This type of predator-prey relationshipmay be fundamentally important to the prey while being of virtually no importance to thepredator.The third challenge (really an extension of the second) is unknowables. We cannot know theexplanatory influence of a factor that has not been monitored in a given year or location. Whenthere are no <strong>data</strong>, one cannot make any inferences either in favour or opposed to a givenhypothesis.3.3 Current Framework3.3.1 OverviewOur approach to <strong>cumulative</strong> <strong>impacts</strong> analysis comprises three components:1. Underst<strong>and</strong> the patterns of change in the productivity of <strong>Fraser</strong> <strong>River</strong> <strong>sockeye</strong> <strong>salmon</strong>stocks (<strong>and</strong> other <strong>sockeye</strong> stocks) over the past several decades. This is the patternthat we are seeking to explain. This component is the primary focus of Project 10(Peterman <strong>and</strong> Dorner, 2011), <strong>and</strong> is summarized in section 4.1 of this report.2. Identify factors that could feasibly have contributed to the observed patterns ofchanging productivity in <strong>Fraser</strong> <strong>sockeye</strong> <strong>salmon</strong>. These potential explanatory factorsdo not necessarily need to be mutually exclusive (i.e., there may be multiple causes ofthe observed patterns). The various factors are the focus of other Cohen CommissionTechnical Reports <strong>and</strong> are covered in much greater detail therein.3. Assess the relative likelihood of feasible explanatory factors <strong>and</strong> their potentialinteractions, the focus of sections 4.2 to 4.7 of this report. We have compiled theevidence presented within other Cohen Commission Technical Reports into a weightof evidence approach.3.3.2 Conceptual modelWe developed a conceptual model illustrating the factors potentially affecting each life stage(Figure 3.3-1), so as to:1. organize the factors identified within the Technical Reports as being potentialcontributors to the <strong>Fraser</strong> <strong>sockeye</strong> productivity declines, <strong>and</strong> indicate the life stagespossibly affected by each factor;.2. represent some of the key interactions among factors, both within <strong>and</strong> across TechnicalReports;16
3. provide the Cohen Commission with some insights into the underlying complexity of thisecological system 5 ; <strong>and</strong>4. provide an organizational framework for the analysis of <strong>cumulative</strong> <strong>impacts</strong>, identifyingall of the factors to be integrated into qualitative <strong>and</strong> quantitative analyses of each lifehistory stage, <strong>and</strong> across the overall life cycle.Figure 3.3-2 illustrates a simplified version of the conceptual model projected over thegeographic habitat range of <strong>Fraser</strong> <strong>River</strong> <strong>sockeye</strong> <strong>salmon</strong>. This representation of the <strong>sockeye</strong><strong>salmon</strong> life history does not show details of specific mechanisms or all interactions amongfactors, but instead is intended to represent the general movement patterns of <strong>Fraser</strong> <strong>River</strong><strong>sockeye</strong> <strong>salmon</strong> throughout their habitat range <strong>and</strong> indicate the broad spatial scales over whichdifferent factors may influence <strong>sockeye</strong> <strong>salmon</strong> health <strong>and</strong> survival.Further details on the value of conceptual models as a central component of analyticalframeworks <strong>and</strong> the development of this particular model are provided in Appendix 3.5 Though reasonably complex, our conceptual model is certainly not an exhaustive representation of all primary <strong>and</strong>intermediate factors that influence <strong>sockeye</strong> <strong>salmon</strong> productivity.17
Figure 3.3-1. The conceptual model of the life history of <strong>Fraser</strong> <strong>River</strong> <strong>sockeye</strong> <strong>salmon</strong> <strong>and</strong> potential stressorsaffecting each life stage. The life history processes <strong>and</strong> developmental stages are shown in the centrecolumn. The blue <strong>and</strong> green outlines signify the freshwater <strong>and</strong> marine components, respectively. To avoidany more complexity, we have excluded many feedbacks <strong>and</strong> interactions from this diagram (e.g.,decreases in <strong>sockeye</strong> may affect predators; stressors that cause mortality at an earlier life history stage maylead to less competition <strong>and</strong> improved survival at a later life history stage; the nature of some interactions<strong>and</strong> feedbacks may be conditional upon other factors).18
Figure 3.3-2. Life history of <strong>Fraser</strong> <strong>River</strong> <strong>sockeye</strong> <strong>salmon</strong> illustrating generalized movement patterns among habitats. Arrows represent movements up to thereturn to the coast but do not show return passage through the Strait of Georgia <strong>and</strong> upstream migration to spawning grounds. Potential stressors areassigned to general areas/life stages, not specific locations. Box C shows the <strong>Fraser</strong> <strong>River</strong> watershed, in which spawning, incubation, emergence, nurserylake rearing, <strong>and</strong> outmigration occur. Box B shows the Lower <strong>Fraser</strong> <strong>River</strong>, Strait of Georgia, Johnstone Strait, <strong>and</strong> Strait of Juan de Fuca, throughwhich post-smolts pass on during their migration to the Gulf of Alaska, <strong>and</strong> returning adults pass on their journey back to the <strong>Fraser</strong> <strong>River</strong>. The dottedline indicates that there is limited evidence for the use of Juan de Fuca by post-smolts. Box A shows the Northeast Pacific Ocean, where maturing<strong>sockeye</strong> <strong>salmon</strong> spend two winters after completing their migration up the coast then return to the <strong>Fraser</strong> <strong>River</strong>. The movement patterns within the oceanare highly generalized, but based on McKinnell et al. (2011, Figure 4). Refer to McKinnell et al. (2011) for further details on ocean distribution <strong>and</strong>patterns.19
3.3.3 Life history perspective/approachThe present project takes a life history approach to the compilation, <strong>synthesis</strong> <strong>and</strong> evaluation ofthe evidence contained in other Cohen Commission Technical Reports. Each project focused onparticular factors (e.g., contaminants, pathogens, freshwater habitat, predators, ocean conditions).The present project cuts across factors <strong>and</strong> synthesizes the stressors that <strong>sockeye</strong> <strong>salmon</strong>encounter within each life history stage. This perspective more closely resembles the manner inwhich <strong>sockeye</strong> <strong>salmon</strong> actually experience the world they live in; as they progress through theirlifetime, they experience the world stage by stage, not factor by factor. Within each life stage orat any point in time, <strong>sockeye</strong> <strong>salmon</strong> experience many potential stressors in whatevercombination they arrive. This reflects the essence of <strong>cumulative</strong> effects – that the ValuedEcosystem Component (i.e. <strong>sockeye</strong> <strong>salmon</strong>) must endure the aggregate stress of human <strong>and</strong>natural drivers as a <strong>cumulative</strong> impact, not as individual <strong>impacts</strong>.3.3.4 Types of evidenceTo evaluate the relative likelihood of potential factors, we pulled together qualitative <strong>and</strong>quantitative evidence presented by other contractors, as well as doing our own quantitativeanalyses in this project. The Cohen Commission Technical Reports include descriptions of keyprocesses <strong>and</strong> mechanisms, <strong>data</strong> summaries, reviews of published literature <strong>and</strong> previous <strong>data</strong>analyses, new <strong>data</strong> analyses, <strong>and</strong> major conclusions, including ways to improve ourunderst<strong>and</strong>ing <strong>and</strong> fill <strong>data</strong> gaps. Additional lines of evidence emerged from the CohenCommission Scientific <strong>and</strong> Technical Workshop (held Nov. 30 <strong>and</strong> Dec. 1, 2010), includingcontractor presentations, expert feedback on the conceptual model, <strong>and</strong> expert evaluation of therelative likelihood of broad categorical factors. We also examined the Expert Panel Report to thePacific Salmon Commission (PSC) on the Decline of <strong>Fraser</strong> Sockeye (Peterman et al., 2010).However, our primary sources of information were the Cohen Commission Technical Reports,<strong>and</strong> <strong>data</strong> sets on important potential stressors provided by the authors of these reports. We usedthese <strong>data</strong> to perform statistical analyses across all factors. These statistical analyses complementother analyses performed within some of the factor-specific projects <strong>and</strong> represent anotherimportant piece of evidence for the <strong>cumulative</strong> <strong>impacts</strong> assessment.3.3.5 A weight of evidence approach to retrospective ecological riskassessmentWe apply a weight of evidence (WOE) approach to synthesize evidence presented across theCohen Commission Technical Reports <strong>and</strong> assess the overall likelihood that a particular factorhas made a substantial contribution to the decline of <strong>Fraser</strong> <strong>River</strong> <strong>sockeye</strong> <strong>salmon</strong>. Thefoundation for this approach is covered in greater detail in Appendix 3.20
The two key objectives defining our WOE approach are:1. Use the full breadth of evidence presented within the Cohen Commission projects.2. Synthesize <strong>and</strong> evaluate the evidence within a logical <strong>and</strong> systematic framework.Whereas it is not realistic to use every single piece of evidence presented in this body ofscientific work, the intent is to incorporate the breadth of evidence presented, recognizing thatthe weight of evidence <strong>synthesis</strong> cannot possibly capture the depth of evidence presented withineach project. The framework used to evaluate the evidence is based on publications in the fieldof Retrospective Ecological Risk Assessment (RERA), specifically Forbes <strong>and</strong> Callow (2002),<strong>and</strong> Burkhardt-Holm <strong>and</strong> Scheurer (2007). Their approach is considered appropriate when fourcriteria are met, all of which apply in the case of <strong>Fraser</strong> <strong>sockeye</strong>:1. The adverse ecological impact has already occurred.<strong>Fraser</strong> <strong>River</strong> <strong>sockeye</strong> <strong>salmon</strong> productivity has been declining over recent decades<strong>and</strong> the 2009 returns were exceptionally poor.2. The evidence for this impairment already exists.Data on the abundance <strong>Fraser</strong> <strong>River</strong> <strong>sockeye</strong> <strong>salmon</strong> recruits <strong>and</strong> spawnersconfirms the declines in both returns <strong>and</strong> productivity.3. Factors that could potentially be causal agents of this impairment have been identified.The Cohen Commission identified a selection of broad factors that could feasiblyhave contributed to the decline of <strong>Fraser</strong> <strong>River</strong> <strong>sockeye</strong> <strong>salmon</strong>, <strong>and</strong> within eachof the Cohen Commission Technical Reports a range of specific potentialstressors are identified. The Pacific Salmon Commission workshop in June 2010(Peterman et al.) identified a similar, though not identical, set of factors.4. The evidence available to evaluate the likelihood of each possible factor is limited.The constraints on the quantity <strong>and</strong> quality of the evidence available with whichto evaluate potential contributors to the decline of <strong>Fraser</strong> <strong>River</strong> <strong>sockeye</strong> <strong>salmon</strong>are representative of many ecological problems: 1) quantitative <strong>data</strong> are usuallyshort, incomplete, sparse, or simply non-existent; 2) where quantitative <strong>data</strong> doexist, they are likely to be complex, variable, ambiguous, <strong>and</strong>/or noisy, makingrigorous statistical analysis difficult or impossible; <strong>and</strong> 3) available evidence iscorrelative at best, <strong>and</strong> complicated by the interaction of multiple confoundingfactors that are uncontrollable, or even unknown.Forbes <strong>and</strong> Callow (2002) state that “the primary challenge in retrospective risk assessment is tomake best use of the available evidence to develop rational management strategies <strong>and</strong>/or guide21
additional analyses to gain further evidence about likely agents as causes of observed harm”,which precisely describes the challenge of the present project as well.The WOE approach to retrospective ecological risk assessment that we have utilized challengesthe available evidence for each potential factor with the same sequential set of questions asemployed by Burkhardt-Holm <strong>and</strong> Scheurer (2007) in their evaluation of the decline of browntrout in Swiss rivers, though we have grouped several questions into one step. One of ourchallenges is that we are applying this approach retrospectively to a series of projects thatthemselves did not utilize a formal RERA framework. We cannot answer questions that were notasked in the projects themselves. Within each life stage we examine the major potential causativeagents identified within the other Cohen Commission Technical Reports. For each factor, wesynthesize the evidence by addressing the following questions:1. Plausible mechanism:“Does the proposed causal relationship make sense logically <strong>and</strong> scientifically?”2. Exposure:“Is there evidence that <strong>sockeye</strong> populations are, or have been, exposed to the causalfactor?3. Correlation/Consistency:“Is there evidence for association between adverse effects in <strong>sockeye</strong> populations <strong>and</strong>presence of the causal factor, either in time or space?”4. Other Evidence:Is there further evidence available to support the likelihood of that a factor has made asubstantial contribution, such as answers to the questions below?Thresholds:“Do the measured or predicted exposure levels exceed qualitycriteria or biologically meaningful thresholds?”Specificity:“Is there an effect in the population known to be specificallycaused by exposure to the stressor?”Experiments: “Have the results from controlled experiments in the field orlaboratory led to similar effects?”Removal:effects in the population?”“Has the removal of the stressor led to an amelioration of theWithin each step of this evaluation, we emphasize both what is known <strong>and</strong> what is not known,<strong>and</strong> within each life stage we identify the key things that need to be known better. WithinQuestion 3, we synthesize the evidence on any relationship with observed patterns in <strong>Fraser</strong>22
<strong>River</strong> <strong>sockeye</strong> <strong>salmon</strong> but also, where possible, the observed patterns in non-<strong>Fraser</strong> <strong>River</strong><strong>sockeye</strong> <strong>salmon</strong> (though this evaluation is limited since the Cohen Commission did not collectstressor <strong>data</strong> for non-<strong>Fraser</strong> <strong>sockeye</strong> stocks). Based on the evidence available, a relativelikelihood is assigned to each broad category of stressor (e.g., contaminants, predators, etc.) ateach life stage, according to the framework shown in Figure 3.3-3. The conclusions from eachlife stage apply to the contribution of each broad impact factor to the overall pattern of changeobserved in <strong>Fraser</strong> <strong>River</strong> <strong>sockeye</strong> stocks. There may be cases in which the relative likelihoods ofparticular stressors do not all align perfectly with the relative likelihood assigned to the parentstressor category. For example, the evaluation of the overall impact of predators may not matchthe evaluation of particular predators. There may also be cases in which the results from thisevaluation framework might be different for individual stocks. However, the focus of the presentproject is to evaluate the likelihood that each broad factor has made a significant contribution tothe overall observed decline in the <strong>Fraser</strong> <strong>River</strong> <strong>sockeye</strong> <strong>salmon</strong> stock complex.Because this method is an inherently retrospective form of analysis, the results cannot be used tomake future predictions. Both Forbes <strong>and</strong> Callow (2002) <strong>and</strong> Burkhardt-Holm <strong>and</strong> Scheurer(2007) emphasize that it is unrealistic to expect these methods to be definitive in terms ofascribing causation. While such an approach may be able to explain retrospectively which factorsmost likely contributed to past patterns of change in productivity, the importance of particularfactors may be more or less important in the future <strong>and</strong> will vary within any given year in bothmagnitude <strong>and</strong> relative importance. Even if we had complete <strong>data</strong> on all of the factors potentiallyaffecting <strong>sockeye</strong> over the entire period of record for the stock productivity <strong>data</strong>, we would notbe able to necessarily predict in advance how these factors will combine in the future to affectproductivity. This is particularly true in the era of climate change, where the biophysicalstructure <strong>and</strong> functioning of ecosystems may move beyond the range of historical conditions. Asmentioned above in section 3.1, environment-recruitment correlations generally do not persistover time (Walters <strong>and</strong> Collie 1988, Walters 1989, Myers 1998).23
Figure 3.3-3. Flow diagram used to assign the relative likelihood that a particular factor has made a substantialcontribution to the decline of <strong>Fraser</strong> <strong>River</strong> <strong>sockeye</strong> <strong>salmon</strong>, based on the answers to the questions used tochallenge the available evidence. This structure is adapted from Burkhardt-Holm <strong>and</strong> Scheurer (2007,Figure 1).3.3.6 Quantitative analysesRegression analysis was the primary method used in our quantitative analyses. This sectionprovides a high level summary of regression intended to inform all readers (regardless ofbackground) about the general approach <strong>and</strong> the limitations of the analysis. Appendix 3 (SectionA3.5.2) provides a technical description of this approach, including details on <strong>data</strong> reduction,creation of model sets, c<strong>and</strong>idate models, model structure, <strong>and</strong> model selection. Detailed resultsof our analyses are presented in Appendix 4, with selected summaries in Sections 4.4 <strong>and</strong> 4.7.24
Multiple regression can be used to determine the relative importance of each covariate forexplaining the variability in <strong>sockeye</strong> productivity. Non-linear relationships between covariates<strong>and</strong> <strong>sockeye</strong> productivity can be explored. Covariates that are hypothesized to have an additive<strong>cumulative</strong> impact on <strong>sockeye</strong> productivity (i.e., each factor on its own may have an insignificantbiological impact but when encountered together the sum of the effects may be biologicallyimportant) can be analyzed in groups rather than one at a time. Regression can also be used totest hypothesized interactions between covariates (i.e., multiplicative <strong>cumulative</strong> <strong>impacts</strong>).Multiple regression is valuable tool for addressing the primary objective of this analysis (i.e.,underst<strong>and</strong>ing the <strong>cumulative</strong> <strong>and</strong> relative impact of all of the stressors).Regression analysis is used to underst<strong>and</strong> how different variables relate to one another. Typicallythere is one response variable (i.e., dependent variable) of interest <strong>and</strong> one or more predictorvariables (i.e., independent variables or covariates). In this case the dependent variable is anannual stock specific index of total productivity (ln (R/S), the natural logarithm ofrecruits/spawner 6 ). The independent variables are all factors identified as likely to be importantby each of the other Cohen Commission Technical Reports (e.g., sea surface temperature).Regression analysis entails specifying a mathematical model that describes the functional formof the relationship between the covariates <strong>and</strong> the response variable <strong>and</strong> using the observed <strong>data</strong>to estimate the parameters in the model. The model parameters provide information on thedirection <strong>and</strong> strength of the relationship between the covariates <strong>and</strong> the response variable.Many different models are possible. For example, models may include different covariates,linear <strong>and</strong> non-linear covariates, <strong>and</strong>/or interactions among different covariates. As long as thereare sufficient <strong>data</strong>, parameters for any model can be estimated, but this does not mean that themodel is sensible. Not surprisingly there is a vast amount of literature dedicated to the subject ofmodel selection <strong>and</strong> comparison. We use the Burnham <strong>and</strong> Anderson (1998) hypothesis-drivenapproach to model selection <strong>and</strong> inference. In hypothesis-driven analyses, the only factors thatwould be allowed to enter the analyses would be those that are connected to a logical, <strong>and</strong> in thiscase, biologically justified hypothesis. This reduces the potential that some variables will emergeas significant simply by chance <strong>and</strong> not as a result of any underlying mechanism, which is quitelikely to happen in a project where there are large numbers of covariates <strong>and</strong> hence potentialmodels. St<strong>and</strong>ard practice is to select multiple feasible c<strong>and</strong>idate models, fit each model (i.e.,estimate the parameters), <strong>and</strong> then compare the performance of each model. There are manyapproaches for comparing model performance; we used the small sample size corrected Akaike’sinformation criterion (AIC c ) (Burnham <strong>and</strong> Anderson, 1998).6 Using the natural logarithm of (R/S) transforms the Ricker spawner-recruit model into a linear form which makesit easier to apply regression analysis.25
This project is unusual in its scope. While the response variable, ln(R/S), is available for 19stocks across B.C. <strong>and</strong> approximately 50 years of <strong>data</strong> are available for each stock, the number ofpotential covariates is very large. A total of 126 quantitative <strong>and</strong> 5 qualitative <strong>data</strong> sets wereprovided to us from the other technical reports (Table A3.4-9). We then calculated an additional32 <strong>data</strong> sets (i.e., derived variables based on the <strong>data</strong> provided) that were more appropriate forour analyses.It is possible for a single <strong>data</strong> set to be linked to (i.e., hypothesized to impact) multiple life stagesof <strong>Fraser</strong> <strong>River</strong> <strong>sockeye</strong>. In addition, there are up to 4 different age types (i.e., 4sub2, 5sub2,4sub1, <strong>and</strong> 3sub1). These links result in a total of 1058 possible covariates to include in theanalysis. However, not all covariates are available for all years <strong>and</strong> stocks. Models can only becompared when the models are fit using the same <strong>data</strong>. The implication of this is that we cannotcompare all models of interest on the full <strong>data</strong> set but instead must identify time periods withcomplete <strong>data</strong> for different subsets of the covariates.For example, there is a small subset of the covariates (e.g., sea surface salinity for the Strait ofGeorgia) that have <strong>data</strong> extending back to 1950, but there are other covariates that only have <strong>data</strong>starting in 1996 (e.g., chlorophyll a). If we wish to compare models with these two covariates(i.e. salinity <strong>and</strong> chlorophyll), we would have to either reduce the <strong>data</strong> set to those years with<strong>data</strong> for both covariates (i.e., limit the model to 1996-present <strong>and</strong> sacrifice the earlier <strong>data</strong> forsalinity), or exclude covariates with limited years of <strong>data</strong> (i.e., limit the model to only salinity<strong>and</strong> ignore chlorophyll a, but extend the analysis back to 1950). Choosing any particular set ofcovariates forces you to truncate longer time series to the length of the shortest <strong>data</strong> set.Choosing any particular time period forces you to limit your analyses to those covariates with aperiod of record that is sufficiently long.We chose to evaluate different time-periods independently because each time period presents adifferent trade-off between the length of the <strong>data</strong> <strong>and</strong> the number of covariates that can beincluded. Within each time-period we generated different model sets. A model set represents aset of covariates that have complete <strong>data</strong> over the chosen time-period. Within each model set,different models (i.e. combinations of variables) can be tested to determine their ability toexplain the observed variability in the dependent variable, <strong>sockeye</strong> productivity in this case.Expressed another way, a ‘model set’ is simply a suite of c<strong>and</strong>idate models within a given timeperiodthat are organized to address a particular question. For example, one question of interest iswhether the set of factors affecting a particular life stage are more important than others.26
Key points:• Models may differ in the number <strong>and</strong> type of covariates, linear vs. non-linear terms, <strong>and</strong>the presence of interaction terms.• Many models are possible, but we should only test models that have biologically justifiedhypotheses.• In order to compare the relative performance of different models using Akaike’sInformation Criterion (AIC c ), models should be fit using the same <strong>data</strong>.• Comparison of AIC c scores does not tell us the best model possible, but rather helps us tounderst<strong>and</strong> the relative support for the models we have estimated.• You need more <strong>data</strong> than parameters in order to be able to estimate the parameters.27
4.0 Results, Synthesis <strong>and</strong> Discussion4.1 The Pattern We Need to ExplainThe Cohen Commission is interested in the causes of both longer term declines in <strong>Fraser</strong> <strong>sockeye</strong>productivity over the last 2-3 decades, as well as the poor survival of <strong>sockeye</strong> returning to spawnin 2009 (Figure 4.1-1). Another important part of the overall pattern is the surprisingly largereturns of <strong>Fraser</strong> <strong>sockeye</strong> in 2010, which were the highest returns over the last six decades. Priorto exploring the relative likelihood of different factors (i.e., why the productivity declinesoccurred), we need to underst<strong>and</strong> where <strong>and</strong> when these declines occurred (i.e., which stocks?which years? which life history stages?). Analyzing patterns in both <strong>Fraser</strong> <strong>and</strong> non-<strong>Fraser</strong> stocksis helpful for two reasons. First, including <strong>data</strong> on <strong>sockeye</strong> populations outside of the <strong>Fraser</strong><strong>River</strong> helps to determine whether the <strong>Fraser</strong>'s situation is unique, or whether other <strong>sockeye</strong>populations were suffering the same fate. Second, including more stocks increases the amount ofcontrast in the exposure to different stressors, which helps in drawing conclusions about thepossible causes of observed patterns.Returns/Spawner(moving average)108642Total <strong>Fraser</strong> <strong>River</strong> <strong>sockeye</strong> productivity(Returns/Spawner), 4-yr avg.01952 1960 1968 1976 1984 1992 2000 2008Return yearFigure 4.1-1. Returns per spawner for all <strong>Fraser</strong> <strong>sockeye</strong> stocks combined. Graph shows the four-year movingaverage of total adult returns across all <strong>Fraser</strong> <strong>River</strong> <strong>sockeye</strong> stocks (not including the minor jackscomponent) divided by total spawners 4 years before. The moving average removes much of the year toyear variability in productivity created by some large, strongly cyclical stocks. Return year is the last yearof the four used to produce the moving average. The horizontal dashed line indicates the productivity atwhich the population can replace itself, i.e., returns/spawner = 1. The graph mainly reflects time trends ofthe most abundant stocks, but most <strong>Fraser</strong> stocks show similar decreasing trends, with the exception of theHarrison <strong>and</strong> Late Shuswap stocks (see Figure 4.1-2). Source: Peterman et al. (2010). Preliminary <strong>data</strong>indicate that returns per spawner in 2010 were close to the long term average over the last six decades, <strong>and</strong>similar to levels observed in the 1980’s (Anon., <strong>Fraser</strong> Sockeye 2010 Think Tank).29
Peterman <strong>and</strong> Dorner (2011) analyzed <strong>data</strong> sets on the abundance of spawners <strong>and</strong> their resultingreturns for a total of 64 populations ("stocks") of <strong>sockeye</strong> <strong>salmon</strong>, including 19 from the <strong>Fraser</strong><strong>River</strong>, <strong>and</strong> the rest from other parts of British Columbia, Washington state, <strong>and</strong> Alaska (Figure4.1-2). Only 4 of these 64 stocks were substantially affected by other potentially confoundingfactors (Pitt, Cultus – hatcheries; Great Central Lake <strong>and</strong> Sproat - lake fertilization) so the overallproductivity patterns are representative of natural wild <strong>sockeye</strong> populations. Peterman <strong>and</strong>Dorner also obtained <strong>data</strong> on juvenile abundance in fresh water for 24 of these <strong>and</strong> other <strong>sockeye</strong>populations to determine if problems were mainly in fresh water or the ocean. They used threemeasures of productivity: 1) the number of returning adults (recruits) per spawner 7 , whichincludes the effects of spawner abundance on productivity; 2) annual residuals in productivity,which describes how productivity diverged from what would have been expected each year justbased on spawner abundance; <strong>and</strong> 3) Kalman filter estimates of long term trends in productivity,which extract productivity trends from year-to-year noise.AlaskaYukon41-4263 43386439-40 3731-3255-624833-36 3053-5444-47,2951-522849,5026-272523-24B.C.<strong>Fraser</strong> <strong>River</strong> (2-20)21-221Figure 4.1-2. Locations of ocean entry for seaward-migrating juveniles of the 64 <strong>sockeye</strong> <strong>salmon</strong> populations withtime series <strong>data</strong> on annual abundances of spawners <strong>and</strong> the resulting adult returns or recruits. Source:Peterman <strong>and</strong> Dorner (2011).7 Recruits are estimates of the abundance of returning spawners in coastal fishing areas prior to harvest <strong>and</strong> post-Mission en-route mortality, estimated for each stock as: [ (estimated adults on the spawning ground) + (estimatedmarine <strong>and</strong> freshwater harvest) + (estimated post-Mission en-route mortality) ].30
Peterman <strong>and</strong> Dorner (2011) have three key findings regarding the patterns of change in <strong>sockeye</strong>productivity:1. Life history stages of <strong>Fraser</strong> <strong>sockeye</strong> showing declining productivity. Of the nine<strong>Fraser</strong> <strong>sockeye</strong> stocks with <strong>data</strong> on juvenile abundance (Figure 13 in Peterman <strong>and</strong>Dorner 2011), only Gates <strong>sockeye</strong> have showed declines in juvenile productivity (i.e.,from spawners to juveniles) but 7 of the 9 stocks showed consistent reductions in postjuvenileproductivity (i.e., from juveniles to returning adult recruits). These resultsindicate that either: 1) the primary mortality agents causing the decline in <strong>Fraser</strong> <strong>River</strong><strong>sockeye</strong> occurred in the post-juvenile stage (i.e. after fry or smolts were enumerated), or2) that certain stressors that affected juveniles were non-lethal in fresh water but causedmortality later in the marine <strong>sockeye</strong> life stage. Note that mortality during over-winteringin nursery lakes (for most stocks), or during pre-smolt <strong>and</strong> smolt downstream migrationwould be ascribed to the post-juvenile stage. Unfortunately, juvenile <strong>data</strong> series for non-<strong>Fraser</strong> stocks are either very short or not available at all, making it difficult to judge towhat degree similarities in juvenile-to-adult survival rates are shared among B.C. stocksoutside the <strong>Fraser</strong> (Appendix P3 in Peterman <strong>and</strong> Dorner 2011).2. Stocks showing declining productivity. Within the <strong>Fraser</strong> watershed, 17 of 19 <strong>sockeye</strong>stocks have shown declines in productivity over the last two decades. Both <strong>Fraser</strong> <strong>and</strong>many non-<strong>Fraser</strong> <strong>sockeye</strong> stocks, in Canada <strong>and</strong> the U.S.A., show a similar recentdecrease in productivity. Thus, this trend has occurred over a much larger area than justthe <strong>Fraser</strong> <strong>River</strong> system <strong>and</strong> is not unique to it. This is a very important new finding.Specifically, based on smoothed estimates of productivity trends via a Kalman filter (thethird productivity measure described above), there have been relatively large, rapid, <strong>and</strong>consistent decreases in <strong>sockeye</strong> productivity starting in the late 1990s in many areasalong the west coast of North America including the following stocks (from south tonorth): Puget Sound (Lake Washington), <strong>Fraser</strong> <strong>River</strong>, Barkley Sound on the West Coastof Vancouver Isl<strong>and</strong> (Great Central <strong>and</strong> Sproat Lakes), Central Coast of B.C. (LongLake, Owikeno Lake, South Atnarko Lakes), North Coast of B.C. (Nass <strong>and</strong> Skeena),Southeast Alaska (McDonald, Redoubt, Chilkat), Yakutat (northern part of SoutheastAlaska; East Alsek, Klukshu, Italio). These patterns are illustrated in Figures 4.1-3 <strong>and</strong>4.1-4.3. The timing of productivity declines. There have been three separate phases of decline inproductivity since 1950. The first started in the 1970s, the second in the mid-1980s, <strong>and</strong>then the most recent one in the late 1990s or early 2000s, with individual stocks showingthese trends to various extents. Furthermore, periods of low productivity in southern31
<strong>sockeye</strong> stocks tended to coincide with periods of high productivity in western Alaskanstocks, <strong>and</strong> vice versa.The Cohen Commission is interested in factors affecting the <strong>Fraser</strong> <strong>sockeye</strong> fishery, not only<strong>Fraser</strong> <strong>sockeye</strong> productivity. Over the last two decades there has been an increasing amount ofen-route mortality of returning <strong>Fraser</strong> <strong>sockeye</strong> spawners (i.e., mortality between the Missionenumeration site <strong>and</strong> the spawning ground), as illustrated for late run <strong>sockeye</strong> in Figure 4.1-5.This results in reduced harvest, as fishery managers do their best to ensure enough spawnersreturn to the spawning ground in spite of considerable mortality along the way. Since en-routemortality is already included in estimates of recruits, it does not affect estimates of productivity,but it does affect the fishery.Other patterns noted by McKinnell et al. (2011) have particular relevance to the low 2009 returns(2007 ocean entry for most <strong>sockeye</strong>), <strong>and</strong> provide some interesting contrasts among stocks withdifferent life history patterns <strong>and</strong> migratory pathways:o most <strong>Fraser</strong> <strong>River</strong> <strong>sockeye</strong> stocks had very poor returns/spawner in 2009, but;o Columbia <strong>River</strong> <strong>sockeye</strong> had double their average returns in 2009 (recruits/spawner notavailable),o hatchery-reared <strong>sockeye</strong> from Cultus Lake showed typical survival rates through theStrait of Georgia in 2007 (estimated from tracking acoustic tags), <strong>and</strong>o there were record high returns of Harrison <strong>River</strong> <strong>sockeye</strong> in 2010, from underyearlingsthat reared in the Strait of Georgia in 2007.32
Figure 4.1-3. Estimates of long term trends in total life cycle productivity for the four <strong>Fraser</strong> <strong>sockeye</strong> run timinggroups, by brood year. The graph is based on productivity estimates for each stock, using a smoothedKalman filter, using the stock-recruitment model that best fit the <strong>data</strong> (methods explained in Peterman <strong>and</strong>Dorner 2011). Brood year is year of spawning. The productivity estimates are in the same units for allstocks, plotted relative to each stock’s mean <strong>and</strong> st<strong>and</strong>ard deviation. Four stocks show no trend in thissmoothed Kalman filter indicator (i.e., Raft, Scotch, Portage, Weaver). This may be due to the absence ofany long term trend, a masking of the underlying trend by high year to year variability, <strong>and</strong>/or gaps in thetime series. Annual residuals in productivity for these four stocks have however been well below their longterm means in several brood years since 2000. Source: Peterman <strong>and</strong> Dorner (2011)33
Figure 4.1-4. Estimates of long term trends in total life cycle productivity for non-<strong>Fraser</strong> <strong>sockeye</strong> stocks,by brood year. Brood year is year of spawning. The productivity estimates are in the same units for allstocks, plotted relative to each stock’s mean <strong>and</strong> st<strong>and</strong>ard deviation. Three stocks show no trend in thissmoothed Kalman filter indicator (i.e., Speel, Alsek, Situk). This may be due to the absence of any longterm trend, a masking of the underlying trend by high year to year variability, <strong>and</strong>/or gaps in the timeseries. Source: Peterman <strong>and</strong> Dorner (2011)34
Figure 4.1-5. A) Total run size of adult Late-run <strong>sockeye</strong> <strong>salmon</strong> from 1977 to 2008 with fish fate categorized intototal catch, en route loss <strong>and</strong> spawning escapement. B) The same <strong>data</strong> as presented in panel A but with fatecategories expressed as percentages of the total run size. Source: Hinch <strong>and</strong> Martins (2011)We conducted independent statistical analyses of the timing of changes in recruit per spawnerindices (the first productivity measure described above) for each <strong>Fraser</strong> stock, using a methodcalled change point detection. We found declining productivity (recruits/spawner) for 15 of the19 <strong>Fraser</strong> <strong>sockeye</strong> stocks (all except for Harrison, Late Shuswap, Raft <strong>and</strong> Weaver). While nine35
of the 15 stocks with declining productivity showed declining trends throughout the time series,the other six (Early Stuart, Birkenhead, Quesnel, Stellako, Chilko, Pitt) showed a change in theslope of the productivity trend line part of the way through the time series (in 1965, 1983, 1983,1984, 1988, <strong>and</strong> 1999, respectively). Similar to Peterman <strong>and</strong> Dorner (2011), we found decliningproductivity in most <strong>Fraser</strong> <strong>sockeye</strong> stocks, <strong>and</strong> variability across stocks in when those declinesoccurred. Details are contained in Appendix 4.The returns or recruits in any given year (R) are a function of the number of spawners (S) in thebrood year (generally four years earlier) <strong>and</strong> the productivity or number of returns/spawner(R/S). Or, mathematically, R = S * (R/S). Many <strong>Fraser</strong> <strong>sockeye</strong> stocks are strongly cyclical, witha substantial variation in the number of spawners (S) over each of the four brood years in a cycle.Strong brood years generally produce strong brood years four years later. Even if productivity(R/S) remained constant, the variation in S would cause substantial year to year changes in boththe total returns, <strong>and</strong> their stock composition. These patterns are strongly apparent in Figure 4.1-6, which shows the number of total <strong>sockeye</strong> recruits to the <strong>Fraser</strong> from each brood year, theirstock composition, <strong>and</strong> overall productivity (R/S). Stock composition can vary substantially fromyear to year (e.g., returns from the 1985, 1989, 1993, 1997 <strong>and</strong> 2001 brood years were dominatedby Quesnel <strong>sockeye</strong>, whereas returns from the 1986, 1990, 1994, 1998 <strong>and</strong> 2002 brood yearswere dominated by Late Shuswap <strong>sockeye</strong>). The above brood years are the peak years(respectively) for the Quesnel <strong>and</strong> Late Shuswap stocks, <strong>and</strong> in general provided strongeraggregate returns to the <strong>Fraser</strong> than the intervening years.36
Figure 4.1-6. Aggregate returns to the <strong>Fraser</strong> Basin (height of bars), recruits/spawner (line) <strong>and</strong> stock composition (colours within each bar), for each brood year.The <strong>data</strong> are shown in 4-year intervals, reflecting the 4-year life cycle of <strong>sockeye</strong>, <strong>and</strong> illustrating the general consistency in relative abundance <strong>and</strong>stock composition every 4 years.37
Implications of Observed Patterns in Productivity for Analysis of Factors Causing theDeclineIf just <strong>Fraser</strong> <strong>sockeye</strong> stocks had shown declines in productivity, while non-<strong>Fraser</strong> stocks weremore or less stable, that would point to stressors unique to the <strong>Fraser</strong> stocks. However, thewidespread common patterns of declining productivity suggests that the simplest explanation ofthe dominant or primary driving forces behind the declines are factors operating on a large scale,affecting both pristine <strong>and</strong> developed watersheds. While that does not exclude other local factorsfrom contributing to the overall pattern as secondary influences, or the possibility that differentfactors could cause declines in different stocks, the most parsimonious explanation of the overallpattern would be a large scale stressor, extending from Washington to SE Alaska, over the lasttwo decades. Peterman <strong>and</strong> Dorner (2011) state:The large spatial extent of similarities in productivity patterns that we found across populationssuggests that there might be a shared causal mechanism across that large area. Instead, it is alsopossible that the prevalence of downward trends in productivity across <strong>sockeye</strong> stocks from LakeWashington, British Columbia, Southeast Alaska, <strong>and</strong> the Yakutat region of Alaska is entirely orprimarily caused by a coincidental combination of processes such as freshwater habitatdegradation, contaminants, pathogens, predators, etc., that have each independently affectedindividual stocks or smaller groups of stocks. However, the fact that declines also occurredoutside the <strong>Fraser</strong> suggests that mechanisms that operate on larger, regional spatial scales, <strong>and</strong>/orin places where a large number of correlated <strong>sockeye</strong> stocks overlap, should be seriouslyexamined in other studies, such as the ones being done by the other contractors to the CohenCommission. Examples of such large-scale phenomena affecting freshwater <strong>and</strong>/or marinesurvival of <strong>sockeye</strong> <strong>salmon</strong> might include (but are not limited to) increases in predation due tovarious causes, climate-driven increases in pathogen-induced mortality, or reduced foodavailability due to oceanographic changes. Further research is required to draw definitiveconclusions about the relative influence of such large-scale versus more local processes.The above observations, plus other productivity trends included in Peterman <strong>and</strong> Dorner (2010),suggest that the combination of factors that were primarily responsible for declines in <strong>Fraser</strong><strong>River</strong> <strong>sockeye</strong> productivity over the last 2-3 decades should have the following attributes:o were generally worse during the last 2-3 decades (as compared to prior decades) for 11 ofthe 19 <strong>Fraser</strong> stocks: Early Stuart, Bowron, Fennell, Gates, Nadina, Seymour, Chilko,Late Stuart, Stellako, Cultus, Birkenhead;o were generally worse, though highly variable, during the last two decades (as comparedto prior decades) for 5 <strong>Fraser</strong> stocks: Quesnel, Weaver, Portage, Raft, <strong>and</strong> Scotch;o improved or did not change during the last two decades for two Late Run <strong>sockeye</strong> stocks(the Harrison, Shuswap) 8 ;8 The Pitt <strong>River</strong> stock is excluded from the list of non-declining stocks due to possible hatchery influence.38
o were generally worse during the last 2-3 decades (as compared to prior decades) for mostof the non-<strong>Fraser</strong> stocks;o showed a major improvement for some <strong>Fraser</strong> stocks (particularly Harrison, Chilko,Adams) that led to large returns in 2010.4.2 Stage 1: Incubation, Emergence <strong>and</strong> Freshwater RearingThe stage covers <strong>sockeye</strong> <strong>salmon</strong> from egg to the beginning of their outmigration to the ocean.4.2.1 Plausible mechanismsAs shown in the conceptual model (Figure 3.3.-1) plausible mechanisms affecting Stage 1include: 1) <strong>Fraser</strong> watershed habitat conditions (particularly the effects of forestry, mining,hydroelectricity, urbanization, agriculture, <strong>and</strong> water use); 2) delayed density dependentmortality; 3) predation, 4) disease <strong>and</strong> 5) climate change. There are cause-effect mechanisms bywhich each of these factors could at least potentially affect <strong>sockeye</strong> egg-to-fry, or egg-to-smoltsurvival rates, as described below.The potential effects of <strong>Fraser</strong> watershed habitat conditions on Stage 1 are discussed in Nelitzet al. (2011; section 3.0), <strong>and</strong> are summarized below:o The activities associated with forestry (particularly road construction, stream crossings,<strong>and</strong> upslope harvesting) can alter the amount <strong>and</strong> timing of delivery of water <strong>and</strong>sediment to streams, potentially affecting spawners, eggs <strong>and</strong> juveniles. The mountainpine beetle outbreak in BC’s Interior (due in part to warmer winters caused by climatechange) has led to extensive salvage logging, exp<strong>and</strong>ing the area potentially affected byforestry. Unlogged watersheds with mountain pine beetle have hydrological patternsintermediate between a mature forest <strong>and</strong> a clearcut.o Mining can potentially affect <strong>sockeye</strong> spawning through permanent loss of habitat,disruption of the stream bed, sedimentation on incubating eggs, or contamination by aciddrainage, heavy metals <strong>and</strong> other toxic substances.o Large scale hydroelectric facilities (in particular the Bridge/Seton <strong>River</strong> power project<strong>and</strong> Alcan’s Kemano project on the Nechako) can potentially affect <strong>Fraser</strong> <strong>sockeye</strong>through physical barriers to migration, increased stress/disease, greater vulnerability topredators <strong>and</strong> direct turbine/spillway mortality.o Smaller scale hydro facilities, including Independent Power Projects or IPPs generallydivert water from fishless stream channels, but can potentially affect downstreamspawning areas <strong>and</strong> migration corridors through changes to total gas pressure, gravel39
supply or water temperature. Unless interbasin transfers of water occur, effects on<strong>sockeye</strong> nursery lakes are unlikely.o Urbanization creates impervious surfaces that perturb natural streamflow patterns,altering the quantity, quality <strong>and</strong> accessibility of riparian habitats, <strong>and</strong> impairing waterquality; all of these effects can potentially affect <strong>sockeye</strong> egg-to-fry/smolt survival.o Agriculture can affect spawning <strong>and</strong> rearing habitats by physically altering streamchannels, riparian zones <strong>and</strong> floodplains; direct removal of surface <strong>and</strong> ground water, <strong>and</strong>degradation of water quality.o Water withdrawals for industrial, commercial, domestic <strong>and</strong> agricultural uses canreduce access to <strong>sockeye</strong> spawning, rearing <strong>and</strong> migratory habitats, <strong>and</strong> also affect theirquality.MacDonald et al. (2011) conducted a comprehensive inventory of contaminants, or chemicalsof potential concern (COPCs), within the <strong>Fraser</strong> Basin. Their inventory includes contaminantsoriginating from point sources (e.g., pulp <strong>and</strong> paper mills, sawmills, wood preservation facilities,cement <strong>and</strong> concrete plants, seafood processing facilities, mines, oil <strong>and</strong> gas developments,storage <strong>and</strong> shipping facilities, contaminated sites <strong>and</strong> spills, municipal wastewater facilities,l<strong>and</strong>fills, <strong>salmon</strong>id enhancement facilities), non-point sources (e.g., runoff from forestmanagement areas, agriculture operations, municipal stormwater <strong>and</strong> linear developments) <strong>and</strong>atmospheric sources (e.g., forest fires; volcanoes; emissions into the air from vehicles, industries,<strong>and</strong> agriculture; long range transport of atmospheric pollutants). Some of these sources ofCOPCs could potentially affect spawning <strong>and</strong> rearing habitats, while others are restricted tomigratory corridors. MacDonald et al. (2011) systematically whittled down their long list ofCOPCs through analyses of contaminant pathways <strong>and</strong> exposures relative to thresholds affecting<strong>sockeye</strong>, as described in the Executive Summary of their report.The spawners in one brood year can potentially affect the total life cycle productivity (adultrecruits per spawner) of the next three brood years. If these effects are negative, then this iscalled delayed density dependent mortality. As described in Peterman et al. (2010; section4.7), the proposed mechanisms are that a large number of spawners in one year will produce alarge number of fry the subsequent spring, which increases competition among juvenile <strong>salmon</strong>for limited food resources in the rearing lake, increases incidence of disease in <strong>salmon</strong>, <strong>and</strong>/orleads to increased predation on juvenile <strong>salmon</strong> in the rearing lake or elsewhere in the life cycle.Conversely, declining abundances of <strong>sockeye</strong> result in less nutrients being transferred frommarine to freshwater ecosystems, with potential negative effects on both subsequent generationsof <strong>sockeye</strong> <strong>and</strong> other ecosystem components (reviewed by Nelitz et al. 2006).40
Freshwater predators on juvenile <strong>sockeye</strong> could potentially increase in response to large fryproduction (discussed above), or could increase in response to other natural or anthropogenicfactors that shift the species composition of fish or wildlife communities. Christensen <strong>and</strong> Trites(2011) cite studies from along the Pacific Coast indicating that various predators can potentiallyconsume significant numbers of <strong>sockeye</strong> in freshwater, including coho, chinook, cutthroat trout,rainbow trout, steelhead, Northern pikeminnow, Yellow perch, common mergansers, Caspianterns, <strong>and</strong> double-crested cormorants. They later shrink this list of suspects based on trends in theabundance of these predators.Disease is another potential form of delayed density dependent mortality (discussed above), orcould increase for other reasons. In his review of potential c<strong>and</strong>idate diseases, Kent (2011,Executive Summary) noted that the IHN virus is well recognized as a lethal pathogen to fry, <strong>and</strong>rated IHN as “High Risk”. He also summarized studies indicating that warming temperatures,pollution <strong>and</strong> habitat alteration can potentially increase both the susceptibility of <strong>salmon</strong> todisease, as well as the abundance of certain pathogens (Kent 2011; pgs. 21-22 ).As discussed in Hinch <strong>and</strong> Martins (2011, Section 1.4) climate change can potentially affect thesurvival of eggs, alevins <strong>and</strong> fry by: shifting temperatures above the thermal optimum to whicheach stock has adapted (<strong>sockeye</strong> populations in the interior of B.C. prefer cooler water thancoastal stocks); increasing late fall stream flows <strong>and</strong> exp<strong>and</strong>ing the wetted area available forspawning (a positive effect); increasing winter stream flows <strong>and</strong> scouring more eggs from thegravel (a negative effect); <strong>and</strong> increasing rates of predation on <strong>sockeye</strong> fry rearing in lakes. Inaddition to these direct <strong>impacts</strong> on <strong>sockeye</strong> spawning <strong>and</strong> rearing, climate change can potentiallyexacerbate the <strong>impacts</strong> from other stressors (e.g., disease (discussed above); more extreme stormevents increasing forestry <strong>impacts</strong> on water <strong>and</strong> sediment delivery; climate-induced changes toseasonal patterns in stream flow combining with water withdrawals to worsen conditions foreggs, fry <strong>and</strong> smolts).The above stressors all have plausible mechanisms for potential <strong>impacts</strong> on Stage 1 of the<strong>sockeye</strong> life cycle. However, for the above factors to jointly affect egg-to-fry/smolt survival,these early life history stages must be exposed to some combination of these stressors in actualspawning <strong>and</strong> rearing locations within the <strong>Fraser</strong> Basin, <strong>and</strong> at levels that <strong>cumulative</strong>ly combineto affect survival. This is much more difficult to determine, as discussed below. Levels ofexposure <strong>and</strong> survival must be inferred indirectly from incomplete information.41
4.2.2 Exposure of <strong>Fraser</strong> <strong>River</strong> <strong>sockeye</strong> to stressorsThe intrinsic characteristics <strong>and</strong> form of a watershed, as well as the location <strong>and</strong> intensity ofstressors (i.e., forestry, mining, agriculture, hydropower facilities, water withdrawals,urbanization) affect the level of exposure of <strong>sockeye</strong> spawning <strong>and</strong> rearing habitats to thesestressors. Nelitz et al. (2011) estimated the intrinsic habitat vulnerability of the spawning <strong>and</strong>rearing habitats in each of the 36 Conservation Units within the <strong>Fraser</strong> Basin, using threeindicators: (1) migration distance; (2) total area of nursery lakes; <strong>and</strong> (3) ratio of lake influenceto total spawning extent. The CUs with the greatest relative habitat vulnerability (i.e., have longmigration distances, a low ratio of lake influence to total spawning extent, <strong>and</strong> a small tomoderate nursery lake area) include Early Stuart – Stuart, Takla/Trembleur; Early Summer –Bowron, <strong>Fraser</strong>; <strong>and</strong> Summer – Mckinley. Nelitz et al. (2011) also developed indices of thedisturbances within each Conservation Unit, including spatial analyses that estimated the percentof disturbed area within each <strong>sockeye</strong> watershed <strong>and</strong> along migration corridors, <strong>and</strong> the<strong>cumulative</strong> level of stress on different habitat types. Most indices of exposure to potential habitatstress represent current conditions; there are few <strong>data</strong> sets with trends through time. The highestlevels of stress exposure are generated by forest harvesting, roads, water use <strong>and</strong> large scalehydro facilities.MacDonald et al. (2011; Chapter 4) used a very thorough, conservative (risk averse) procedurefor assessing contaminant exposures <strong>and</strong> hazards to <strong>sockeye</strong>. They estimated the maximumobserved concentration of each contaminant as the exposure point concentration (or EPC) ineach area of interest from existing <strong>data</strong>. From the literature they determined a ‘no effect’ level ofeach contaminant, called the toxicity screening value (or TSV), which in some cases was thelowest observed background level. They then calculated a hazard quotient (HQ) equal to the ratioof EPC/TSV. Any contaminant with an HQ value greater than 1 was flagged as having apotential risk, <strong>and</strong> more closely examined to determine if these potential risks were likely to trulyaffect <strong>sockeye</strong>. To match exposures to life history stages, they sorted water chemistry <strong>data</strong> bytypes of habitats <strong>and</strong> periods of exposure for four life history stages based on the timing of<strong>sockeye</strong> life history stages. For example, contaminant exposure of eggs <strong>and</strong> alevins for the 1991brood year used contaminant <strong>data</strong> from August 1991 to May 1992 for the appropriate sites foreach stock. Exposure of fry from the 1991 brood year used contaminant <strong>data</strong> for nursery lakesfrom April 1992 to March 1993. Sediment chemistry is not sampled as often, <strong>and</strong> therefore weresorted into pre <strong>and</strong> post-1990 periods to test whether they correlated with a change fromgenerally healthy to generally poor <strong>sockeye</strong> productivity.In freshwater spawning <strong>and</strong> rearing habitats, the contaminants posing the highest risk to <strong>salmon</strong>included total suspended solids, turbidity, phosphorus <strong>and</strong> seven metals (aluminum, chromium,42
copper, iron, mercury <strong>and</strong> silver). However, these risks may be overestimated due tounderestimating the background conditions for total suspended solids <strong>and</strong> turbidity (which wouldlead to an overestimate of the hazard), uncertainties on the actual effects of phosphorus, likelycontamination of many samples analyzed for metals, <strong>and</strong> inadequate information on the form ofcontaminants (e.g., dissolved forms are more toxic than when they are attached to sedimentparticles). Notwithst<strong>and</strong>ing these caveats, MacDonald et al. (2011) stress that total suspendedsediment could potentially affect egg-to-fry survival rates, particularly in areas with increasingrates of logging during the last 20 years (e.g., Bowron, Chilko, Nechako, North Thompson,Quesnel).The potential exposure of <strong>sockeye</strong> stocks to delayed density dependent mortality is consideredby determining if the abundance of spawners in each of the previous three years negativelyaffects the overall productivity of the subsequent brood year, <strong>and</strong> in particular whether suchnegative effects are associated with large spawning abundances (Peterman <strong>and</strong> Dorner 2011).Christensen <strong>and</strong> Trites (2011) found that there were <strong>data</strong> on the relative abundance of only 4 of14 c<strong>and</strong>idate freshwater fish predators, <strong>and</strong> trend <strong>data</strong> for only one fish species. Data onc<strong>and</strong>idate bird predators are a bit better due to Christmas Bird Counts. There are virtually no <strong>data</strong>to estimate the relative exposure of eggs, alevins, fry or smolts to disease across different <strong>Fraser</strong>stocks <strong>and</strong> time periods. Hinch <strong>and</strong> Martins show that temperature <strong>and</strong> flow <strong>data</strong> within the<strong>Fraser</strong> Basin <strong>and</strong> nearby regions show evidence of increasing exposure of these life historystages to the effects of climate change, including the following patterns:o summer water temperatures in the <strong>Fraser</strong> <strong>River</strong> are 2.0 o C warmer compared to 60 yearsago, with roughly a 0.7 o C average increase during the last two decades (Figure 4.6-1);o temperatures in the Adams <strong>River</strong> during the time of spawning increased by 1.5 o C from1950 to 1989; <strong>and</strong>o over the Pacific Northwest Region as a whole, snowmelt <strong>and</strong> the spring freshet are nowoccurring 1-4 weeks earlier than in the 1950s.4.2.3 Correlation/consistency with patterns in <strong>Fraser</strong> <strong>River</strong> <strong>sockeye</strong>productivityFreshwater Habitat Factors. Nelitz et al. (2011) searched for correlations across both space(contrasts among different stocks) <strong>and</strong> time (contrasts over different stocks <strong>and</strong> years), thoughmany indicators of habitat stressors are not available over time. Looking across space, Nelitz etal. (2011) developed a <strong>cumulative</strong> index of the relative intensity of habitat stressors (i.e., forestharvesting, mountain pine beetle, road density, urban area, agricultural area, water allocation,small-scale hydro, place mines; see Tables 11-14 in Nelitz et al. 2011). This <strong>cumulative</strong> index43
did not correlate well with differences in productivity among different <strong>Fraser</strong> Basin stocks. Forexample, the two <strong>Fraser</strong> <strong>sockeye</strong> stocks that have done well over the last two decades (Harrison<strong>and</strong> Late Shuswap) have shown, respectively, moderate <strong>and</strong> high relative indices of <strong>cumulative</strong>habitat stress on spawning <strong>and</strong> rearing habitats (Table 18 in Nelitz et al. 2011). Furthermore,Nelitz et al. (unpub. analyses) found that indices of the intensity of habitat stressors <strong>and</strong> habitatvulnerability were not consistent with estimates of the current status of conservation units basedon Pestel <strong>and</strong> Cass (2009), that is, stock status did not decline with increasing indices of habitatstress <strong>and</strong> vulnerability.Looking across time, Neltiz et al. found that trends in overall <strong>sockeye</strong> productivity 9 across 17<strong>sockeye</strong> stocks were not correlated with either the intensity of habitat stressors on nursery lakesor their core measures of habitat vulnerability. 10 The only variable correlated with trends in<strong>sockeye</strong> productivity was migration distance (i.e., stocks with longer migration distances showedgreater rates of decline), which may reflect other correlated factors (e.g., watershed position,nursery lake elevation) rather than being a direct causative factor. Juvenile productivity (i.e.,juveniles/spawner) was unrelated to indices of forest harvesting <strong>and</strong> mountain pine beetledisturbance, but showed some indications of negative associations with spring air temperatures atnursery lakes (i.e. juvenile productivity decreases as spring temperatures increase). Finally, thestability over time in juvenile productivity despite declines in overall life cycle productivitysuggests that freshwater habitat factors are not a primary driving factor in the observedproductivity declines, though it is possible that some non-lethal effects during spawning <strong>and</strong>rearing affect later life history stages. These results are similar to those found in the PSC report(Peterman et al. 2010; Section 4.6).Johannes et al. (2011; Table 2) found that there was either no risk or low risk of <strong>impacts</strong> tospawning <strong>and</strong> rearing habitats in the Lower <strong>Fraser</strong> from population growth, industrial <strong>and</strong>infrastructure projects, liquid <strong>and</strong> solid wastes, ships <strong>and</strong> vessels, dredging <strong>and</strong> diking,contaminated materials <strong>and</strong> exotic species. They assigned a moderate risk level to agriculture <strong>and</strong>forestry activities in Lower <strong>Fraser</strong> watersheds where there is a longer duration <strong>and</strong> greatermagnitude of potential interactions.9 trends in annual residuals in returns/spawner, relative to the expected life cycle productivity based on the numbersof spawners in the brood year, indicator #2 in section 4.1; <strong>data</strong> from Peterman et al. (2010)10 Predictor variables included those relating to habitat vulnerability (migration distance, ratio of lakeinfluenced:total spawning extent, area of all nursery lakes) <strong>and</strong> habitat stress (total water license allocations,municipal area, forest harvested area within the last 15 years, road density, water licence restrictions, agriculturalarea, <strong>and</strong> area disturbed by Mountain Pine Beetle). Source: Table 16 in Nelitz et al. (2011).44
Several analyses by MacDonald et al. suggest that contaminants are not a primary factor in thedeclining productivity of <strong>Fraser</strong> <strong>sockeye</strong> stocks (MacDonald et al. 2001; Executive Summary,Section 5.4). First, over the last 20 years, there is either no trend in the frequency ofcontaminants exceeding toxicity screening values, or a decreasing trend. If contaminants were animportant cause of declining <strong>sockeye</strong> productivity, contaminant concentrations should have beenincreasing over time. Second, various measures of <strong>sockeye</strong> productivity (freshwater, postjuvenile,overall life cycle) were not significantly correlated with a water quality index(incorporating conventional variables, major ions, nutrients, metals <strong>and</strong> phenols). Third, whilethe results of a sediment risk assessment showed that the concentrations of iron <strong>and</strong> nickel wereelevated at various locations within the basin, exposure to these contaminants of concern insediment is unlikely to be sufficient to adversely affect the survival, growth or reproduction of<strong>sockeye</strong> <strong>salmon</strong>. However, the concentrations of selenium <strong>and</strong> dioxins occurred in <strong>salmon</strong> eggsat concentrations sufficient to adversely affect <strong>sockeye</strong> <strong>salmon</strong> reproduction, though themagnitude <strong>and</strong> extent of such effects could not be determined with existing <strong>data</strong>.Delayed Density Dependence. With the exception of the Quesnel <strong>sockeye</strong> stock, Peterman <strong>and</strong>Dorner (2011; pg. 33-45) found little evidence in the <strong>Fraser</strong> system for increased spawnerabundance (<strong>and</strong> delayed density dependence) being the primary cause of declining productivity.They found little support for the idea that extremely large spawner abundances of <strong>sockeye</strong> (i.e.,"over escapement") reduced subsequent <strong>sockeye</strong> stock productivity. These analyses were basedon various analyses of indices of total productivity over the whole life cycle (i.e.,recruits/spawner), <strong>and</strong> therefore reflect the net effects across all life history stages.Christensen <strong>and</strong> Trites (2011) found that most of the c<strong>and</strong>idate freshwater predators describedin section 4.2.1 are unlikely to have increased substantially during the period of declines in<strong>sockeye</strong> productivity; the only possible remaining suspects are Caspian terns <strong>and</strong> double-crestedcormorants, as they do feed on <strong>sockeye</strong> smolts in freshwater <strong>and</strong> may be increasing inabundance. Data on freshwater predators are however very limited.Hinch <strong>and</strong> Martins (2011) did not conduct any statistical analyses relating temperatureconditions to indices of <strong>sockeye</strong> juvenile or life cycle productivity. Based on temperatureconditions <strong>and</strong> trends, as well as thermal optima for different <strong>sockeye</strong> life history stages, Hinch<strong>and</strong> Martins (2011) concluded that survival of eggs has possibly increased as a result of climatechange (but not in all stocks); survival of alevins is unlikely to have been affected; <strong>and</strong> survivalof fry in lakes has possibly decreased.While temperature changes or other factors may have resulted in changes in the abundance ofpathogens in spawning <strong>and</strong> rearing habitats, or <strong>sockeye</strong> susceptibility to such pathogens, the45
<strong>data</strong> are insufficient to perform any systematic assessment of these hypotheses. Miller et al.(2010, presentation at June 2010 PSC Workshop) found that <strong>sockeye</strong> smolts contained a genomicsignal indicative of physiological stress prior to entering the ocean, which she attributed to stressin freshwater. However, the genomic signal detected by Miller et al. was present in smolts duringboth 2007 <strong>and</strong> 2008 (Miller, h<strong>and</strong>out provided to June 2010 PSC Workshop), yet those years ofentry apparently had very different marine survival rates (based on the very large difference inobserved vs expected adult returns in 2009 vs. 2010).4.2.4 Correlation/consistency with patterns in non-<strong>Fraser</strong> <strong>River</strong> <strong>sockeye</strong>productivityThe Cohen Commission studies did not include assembly of <strong>data</strong> on potential stressors for<strong>sockeye</strong> stocks outside of the <strong>Fraser</strong> Basin. Therefore we cannot quantitatively analyze the levelof correlation of stressors with productivity trends in non-<strong>Fraser</strong> stocks. However, we can makesome qualitative arguments, admittedly speculative regarding the consistency of hypothesizedstressors with observed productivity declines. First, it is very likely that freshwater habitatconditions (including contaminants) vary greatly across the 64 stocks analyzed by Peterman <strong>and</strong>Dorner (2011), yet most of these stocks show broadly similar patterns of decline. Second, it isvery likely that most non-<strong>Fraser</strong> stocks on the central <strong>and</strong> north coast of B.C, <strong>and</strong> in SE Alaskahave equal or better habitat conditions than most watersheds in the <strong>Fraser</strong> Basin, simply based onpopulation density. Third, with increasing efforts at regulation of l<strong>and</strong> use activities <strong>and</strong> habitatrestoration over the last two decades, <strong>salmon</strong> habitats in most non-<strong>Fraser</strong> watersheds are likely tohave shown less degradation than in prior decades with less regulation. Therefore, ourexpectation is that it is unlikely that habitat conditions would be correlated with decliningproductivity in most of the non-<strong>Fraser</strong> stocks. However, given the absence of any exposure <strong>data</strong><strong>and</strong> correlation analyses for these stocks, no rigorous conclusion is possible.Peterman et al. (2010; Section 4.7) noted that stocks outside of the <strong>Fraser</strong> Basin usually do nothave such strong <strong>and</strong> regular fluctuations in abundance; they therefore concluded that delayeddensity dependence was not a likely mechanism for observed declines in non-<strong>Fraser</strong> <strong>sockeye</strong>stocks. Peterman <strong>and</strong> Dorner (2011; Tables 2 <strong>and</strong> 3, Appendix P2) looked at 46 non-<strong>Fraser</strong><strong>sockeye</strong> stocks. They examined the level of support in the <strong>data</strong> for two spawner-recruit models:the Ricker model (without delayed density dependence), <strong>and</strong> the Larkin model (with delayeddensity dependence). While the Larkin model had more support than the Ricker model in 10 outof 46 non-<strong>Fraser</strong> stocks, the results indicate that the declines in these non-<strong>Fraser</strong> stocks were notcaused by over-escapement, for two reasons (B. Dorner, pers. comm.). First, there are not thatmany cases where spawner abundance was unusually high over the period of decliningproductivity. Second, in the cases where there were years with unusually high spawner46
abundances (Sproat, Klukshu, Chilkat, Alsek) there was either no support for delayed densitydependence or no substantial difference between the productivity trends inferred by the Ricker<strong>and</strong> Larkin models.Disease, predators <strong>and</strong> climate change were not quantitatively evaluated for non-<strong>Fraser</strong> stocksfor Stage 1 of the <strong>sockeye</strong> life history.4.2.5 Other evidenceOther evidence includes literature demonstrating thresholds, an underst<strong>and</strong>ing of the specificform of response of <strong>sockeye</strong> to certain stressors (i.e., helping to accept or reject differentsuspected causes), experiments demonstrating cause-effect linkages, or positive <strong>sockeye</strong>responses following the removal of a stressor. For the factors discussed above, such evidence isstrongest for the effects of elevated temperatures <strong>and</strong> some contaminants, which have beenwell studied in laboratory <strong>and</strong> field experiments (see Hinch <strong>and</strong> Martins 2011, MacDonald et al.2011). The physiology of diseases has been well studied in various experiments, more withhatchery fish than wild fish, but the thresholds causing mortality are less well understood (Kent2011). It is much more difficult to define thresholds for habitat conditions (e.g., the proportionof clear-cut watershed area that triggers negative <strong>impacts</strong> on <strong>sockeye</strong> spawning <strong>and</strong> rearing), asthese thresholds are very dependent on each watershed’s attributes, which determine thevulnerability of the spawning <strong>and</strong> rearing habitats therein (Nelitz et al. 2011; section 2.2.4).Evidence for density dependence is largely based on indirect insights from spawner <strong>and</strong> recruit<strong>data</strong>, as there are very few sites with continued monitoring of the various ecosystem componentsthat might transmit such effects (i.e., predators, disease, food supply), <strong>and</strong> their relativeresponses to years with high spawner abundance.47
4.2.6 ConclusionsTable 4.2-1 follows the logic of the flow chart in Figure 3.3-1, showing our conclusionsregarding the effects of each stressor on life history stage 1 (including eggs, alevins, fry, <strong>and</strong>parr). Our conclusions relate to the overall trends in <strong>sockeye</strong> productivity over the last twodecades.Table 4.2-1. Evaluation of the relative likelihood that potential stressors encountered by <strong>Fraser</strong> <strong>River</strong> <strong>sockeye</strong><strong>salmon</strong> during life history stage 1 (including eggs, alevins, fry, <strong>and</strong> parr), have contributed to overalldeclines in productivity in recent decades. Some factors may have had effects on some stocks in some years(e.g., density dependence affecting Quesnel <strong>sockeye</strong>), but are unlikely to have been responsible for theoverall pattern across all <strong>Fraser</strong> <strong>sockeye</strong> stocks. See section 4.7 for further discussions of correlations.Factor Mechanism Exposure Correlation/Consistency Other LikelihoodEvidenceForestry b Yes Yes No No a UnlikelyMining Yes Low Not done No a UnlikelyLarge hydro Yes Yes No Against UnlikelySmall hydro Yes Low No No a UnlikelyUrbanization Yes Yes No No a Unlikelyabove HopeAgriculture b Yes Yes No No a UnlikelyWater Use Yes Yes No Yes UnlikelyContaminants Yes Yes No Yes UnlikelyDensity Yes Some No No UnlikelyDependentMortalitystocksPathogens Yes Few <strong>data</strong> Not done Yes NoconclusionpossiblePredators Yes Few <strong>data</strong> No No UnlikelyL. <strong>Fraser</strong> l<strong>and</strong> Yes Yes for No No Unlikelyusesag/for; Nofor othersClimate Yes Yes Weak evidence Mixed PossibleChangeevidencea It is difficult to establish hazard thresholds for the proportion of watershed area above which there are negative<strong>impacts</strong> on <strong>sockeye</strong> spawning <strong>and</strong> rearing. Such thresholds are better defined for contaminants <strong>and</strong> water use.bAgriculture <strong>and</strong> forestry rows include evidence from both Technical Reports 3 (Nelitz et al. 2011) <strong>and</strong> 12(Johannes et al. 2011). Forestry includes logging, Mountain Pine Beetle <strong>and</strong> log storage.With the exception of climate change, which we consider to be a possible factor, <strong>and</strong> pathogens(for which no conclusion is possible due to <strong>data</strong> gaps), it is unlikely that the above factors (i.e.forestry, mining, large <strong>and</strong> small hydro, urbanization, agriculture, water use, contaminants,density dependent mortality, predators, <strong>and</strong> Lower <strong>Fraser</strong> l<strong>and</strong> use), taken <strong>cumulative</strong>ly, were theprimary drivers behind long term declines in <strong>sockeye</strong> productivity across the <strong>Fraser</strong> Basin. We48
feel reasonably confident in this conclusion because juvenile productivity (which integrates allstressors in this life history stages) has not declined over time in the eight of the nine <strong>Fraser</strong><strong>sockeye</strong> stocks where it has been measured. We would be even more confident if more stockshad smolt enumeration rather than fry estimates (only Chilko <strong>and</strong> Cultus stocks have smoltestimates). Though not primary drivers of the <strong>Fraser</strong> <strong>sockeye</strong> situation, each of these factors maystill have had some effects on some <strong>Fraser</strong> stocks in some years (the <strong>data</strong> are insufficient to rejectthat possibility). We suspect, based on qualitative arguments alone, that habitat <strong>and</strong> contaminantinfluences on Life Stage 1 were also not the primary drivers responsible for productivity declinesoccurring to most non-<strong>Fraser</strong> stocks assessed by Peterman <strong>and</strong> Dorner (2011). However, giventhe absence of any exposure <strong>data</strong> <strong>and</strong> correlation analyses for non-<strong>Fraser</strong> stocks, it is not possibleto make conclusions on the relative likelihoods of factors causing declining productivities innon-<strong>Fraser</strong> stocks.None of the factors considered in this section is likely to have been much worse in 2005 <strong>and</strong>2006 for <strong>Fraser</strong> <strong>sockeye</strong> stocks, sufficient to have significantly decreased egg-to-smolt survivalin the <strong>salmon</strong> that returned in 2009. Similarly, none of these factors is likely to have been muchbetter in 2006 <strong>and</strong> 2007, sufficient to have substantially improved egg-to-smolt survival in the<strong>salmon</strong> that returned in 2010.4.2.7 Key things we need to know betterThe various scientists working on projects for the Cohen Commission completed their analysesto the greatest degree possible given the limitations of <strong>data</strong> <strong>and</strong> time. The above conclusions,while reliable given the diverse lines of evidence, are nevertheless constrained by serious <strong>data</strong>gaps. For the spawning <strong>and</strong> rearing phase of <strong>sockeye</strong> life history, some of the critical needs forbetter <strong>data</strong> <strong>and</strong> underst<strong>and</strong>ing include:1. increased numbers of stocks with quantitative assessments of smolt outputs <strong>and</strong>condition (currently only available for Chilko <strong>and</strong> Cultus lakes), to distinguish survivalrates in pre <strong>and</strong> post-juvenile life stages <strong>and</strong> evaluate the likelihood of alternativehypotheses, <strong>and</strong> for these same stocks;2. better estimates of both watershed <strong>and</strong> in-lake conditions over time (including the<strong>cumulative</strong> effects of multiple stressors) using consistent methods, for a cross-section ofstocks with varying conditions (e.g., migration distance, levels <strong>and</strong> types of watersheddisturbance), to better underst<strong>and</strong> current status, causative mechanisms <strong>and</strong> riskthresholds;3. better underst<strong>and</strong>ing of the status of smaller conservation units, consistent withimplementation of the Wild Salmon Policy; <strong>and</strong>49
4. better integration of existing <strong>and</strong> future <strong>data</strong> sets affecting freshwater spawning <strong>and</strong>rearing habitats (a more general need, discussed in section 9.2)4.3 Stage 2: Smolt OutmigrationThis stage covers <strong>sockeye</strong> from the time they leave their nursery lake (as fry, pre-smolts orsmolts) to the time they reach the mouth of the <strong>Fraser</strong> <strong>River</strong>.4.3.1 Plausible mechanismsMost of the plausible mechanisms discussed for stage 1 (egg-to-smolt stage) also apply to stage2, since migrated smolts can be exposed to degraded habitats, contaminants, pathogens, elevatedtemperatures <strong>and</strong> the effects of delayed density dependence. Nelitz et al. (2011) point out that<strong>sockeye</strong> <strong>salmon</strong> smolts are cued to migrate towards the ocean in response to changingenvironmental conditions, which includes responding to day length, lake springtime temperatures(related to the timing of ice break-up in nursery lakes), <strong>and</strong> springtime peak flows, all of whichare influenced by year to year climate fluctuations <strong>and</strong> climate change. Earlier outmigrationcould lead to a mismatch between the arrival of <strong>salmon</strong> smolts in the <strong>Fraser</strong> estuary <strong>and</strong> Strait ofGeorgia, <strong>and</strong> the timing of plankton blooms that are essential for growth <strong>and</strong> survival in Stage 3(coastal migration).4.3.2 Exposure of <strong>Fraser</strong> <strong>River</strong> <strong>sockeye</strong> to stressorsThere are four key points to consider regarding the exposure to stressors during this stage. First,the duration of potential exposure to stressors is much less in Stage 2 than in Stage 1. Whereas<strong>sockeye</strong> spend on average 1.75 years in stage 1 (e.g, spawning in August-November of 2004 <strong>and</strong>leaving their rearing lake in May of 2006), they generally spend only two months in Stage 2migrating downstream the ocean (e.g., during May <strong>and</strong> June 2006), <strong>and</strong> will be exposed to awide range of conditions during this migration. Second, both the duration of exposure <strong>and</strong> thestressors experienced (i.e., the vulnerability of a stock’s migratory habitat) vary with thedistances over which <strong>sockeye</strong> smolts must migrate. There is a 10-fold variation in migratorydistances across the <strong>Fraser</strong> Conservation Units, from 111 km for Cultus Lake <strong>sockeye</strong>, to 1182km for Nadina <strong>sockeye</strong> (Nelitz et al. 2011, Table 18). Third, all <strong>sockeye</strong> stocks pass through the<strong>Fraser</strong> estuary, <strong>and</strong> are exposed (though briefly) to the <strong>cumulative</strong> effects of habitat disruption inthis region (Johannes et al. 2011). Fourth (<strong>and</strong> counter to the third point), while “dilution is notthe solution to pollution”, the substantial volumes of water in the lower <strong>Fraser</strong> <strong>River</strong> have animportant dilution effect on contaminant concentrations (MacDonald et al. 2011; Johannes et al.2011).50
Nelitz et al. (2011; Table 18) found that their index of <strong>cumulative</strong> habitat stress 11 to migratoryhabitats (which included the zone within a 1 km buffer along migratory habitats) was relativelyhigh for all <strong>sockeye</strong> conservation units with a migration distance greater than 750 km. The stressindex was however also relatively high for some conservation units with short migratorydistances but exposed to more intensively disturbed regions (e.g., Cultus (111 km migration),Chilliwack (156 km), Kakawa (164 km), Nahatlatch (255 km)). Two stocks of particular interestbecause of their relatively healthy trends in productivity, the Shuswap (487 km migration) <strong>and</strong>Harrison (127 km), had (respectively) relatively high <strong>and</strong> moderate levels of the migration stressindex.MacDonald et al. (2011) assessed the exposure to water contaminants during downstreammigration by selecting <strong>data</strong> during May <strong>and</strong> June for the appropriate migratory routes for eachstock. For sediment contaminants, they grouped sites into pre <strong>and</strong> post-1990 periods.4.3.3 Correlation/consistency with patterns in <strong>Fraser</strong> <strong>River</strong> <strong>sockeye</strong>productivityWe do not know smolt survival rates for most of the <strong>Fraser</strong> <strong>River</strong> stocks. There are someestimates of velocities <strong>and</strong> survival rates of <strong>sockeye</strong> smolts migrating downstream from various<strong>Fraser</strong> watersheds, based on acoustic tags (e.g., Melynchuk et al. 2010). However, these <strong>data</strong> setswere not included in any quantitative analyses conducted for the Cohen Commission, due to timelimitations. Our analyses of migratory stage stressors (<strong>and</strong> those conducted by other CohenCommission technical reports) used indices of post juvenile or full life cycle productivity as thedependent variable to be explained. These indices do not allow us to clearly separate effects onsurvival in the downstream migration from effects occurring in the ocean, though we do explorewhether stressor indices in different life history stages are better correlated with full life cycleproductivity.Nelitz et al. (2011; Table 16) found that overall life cycle <strong>sockeye</strong> productivity was negativelyassociated with migration distance (the only factor with a strong association), but they have nodirect explanation for why this occurred. It might relate to differential exposure to a suite ofstressors along the migration route, or could be capturing parallel influences on total productivitythat are unrelated to stresses associated with human activities, since migration distance is11 This index of <strong>cumulative</strong> habitat stress was developed by first applying cluster analysis to each of the l<strong>and</strong> usestressor indices, scoring each conservation unit as 1 (low), 2 (moderate) or 3 (high) relative levels of stress, with ascore of 0 assigned in cases where a habitat had no spatial overlap with a stressor. The scores across all stressorindices were then summed to give an overall index of <strong>cumulative</strong> habitat stress for each CU.51
correlated to other factors reflecting watershed position, including elevation <strong>and</strong> latitude, asnoted by Selbie et al. (2010).The available evidence does not support the hypothesis that exposure to water contaminantsduring the downstream migration could be a contributing factor to declines in <strong>Fraser</strong> <strong>sockeye</strong>productivity (MacDonald et al. 2011, Section 5.4). The post-juvenile index of <strong>sockeye</strong>productivity declined with increasing values of a water quality index for the migration period <strong>and</strong>zone (i.e. the opposite pattern from what one would expect if contaminants were a cause of theproductivity declines). There was no relationship between the water quality index <strong>and</strong> the fulllife cycle index of productivity. While the results of the sediment risk assessment showed thatthe concentrations of iron <strong>and</strong> nickel were elevated at two locations within the basin (Lower<strong>Fraser</strong> <strong>and</strong> South Thompson <strong>River</strong>s), <strong>and</strong> have likely increased in the Lower <strong>Fraser</strong>, exposure tothese contaminants of concern in sediment is unlikely to be sufficient to adversely affect thesurvival, growth or reproduction of <strong>sockeye</strong> <strong>salmon</strong>.Hinch <strong>and</strong> Martins (2011) did not examine the effects of temperature on downstream migration,though section 1.5.1 of their report describes increasing temperatures in the <strong>Fraser</strong> <strong>River</strong> in latespring <strong>and</strong> early summer, <strong>and</strong> earlier timing of the spring freshet (about 6 days earlier than in the1950’s). Nelitz et al. (2011; Section 4.2; Table 17) used springtime air temperature as anindicator of the timing of ice break-up in nursery lakes (one of the cues of smolt outmigration),<strong>and</strong> tested the hypothesis is that if lake ice breaks up significantly earlier than experiencedhistorically, smolts would leave sooner, arrive in the <strong>Fraser</strong> estuary at the wrong time, <strong>and</strong>experience lower productivity. They found that years with warmer spring time air temperaturesin nursery lakes were indeed associated with lower life cycle productivity in 14 of 18 <strong>Fraser</strong>stocks, but these negative correlations were weak <strong>and</strong> not statistically significant. The absence ofstatistical significance could be due either to the absence of a real relationship, or the fact thatfairly crude indicators (air temperatures) were used as predictors. In the recent PSC report on<strong>Fraser</strong> <strong>sockeye</strong>, Peterman et al. (2010; section 4.6) found no change in the migration timing ofsmolts from Chilko Lake, <strong>and</strong> in Cultus Lake the median date of outmigration has shifted laterby about 13 days over the past 80 years (i.e., contrary to the expected response to climatechange). Better <strong>data</strong> are needed to assess trends in the timing of smolt outmigration relative tochanging climate conditions, <strong>and</strong> how this influences later survival once smolts enter the ocean.Harrison <strong>River</strong> <strong>sockeye</strong> have a different life history from the rest of <strong>Fraser</strong> <strong>River</strong> <strong>sockeye</strong>populations. They leave their rearing habitats as fry (sometimes called underyearling smolts) inthe year after spawning occurs (rather than in the second year after spawning), <strong>and</strong> reside in the<strong>Fraser</strong> estuary for up to 5 months before entering the ocean. This life history would causeHarrison smolts to experience considerably greater exposure to contaminants <strong>and</strong> other stressors52
in the Lower <strong>Fraser</strong> than other <strong>Fraser</strong> <strong>sockeye</strong>, yet this stock is the only one of 19 with increasingproductivity. This implies that conditions in the Lower <strong>Fraser</strong> <strong>River</strong> were not sufficientlystressful to cause productivity declines in Harrison <strong>sockeye</strong>, <strong>and</strong> suggests that Lower <strong>Fraser</strong>conditions were unlikely to be a primary driver of observed productivity declines in the other<strong>Fraser</strong> stocks that pass through the <strong>Fraser</strong> estuary much more quickly.4.3.4 Correlation/consistency with patterns in non-<strong>Fraser</strong> <strong>River</strong> <strong>sockeye</strong>productivityWe do not have indicators of potential stressors for non-<strong>Fraser</strong> <strong>sockeye</strong> stocks during the smoltmigration stage. Similar arguments to those presented in section 4.2.4 apply to habitat <strong>and</strong>contaminant stressors during the smolt migration stage (i.e., we suspect they are not primarydrivers of observed productivity declines, but have no stressor <strong>data</strong> to test this hypothesis).4.3.5 Other evidenceOther evidence includes literature demonstrating thresholds, an underst<strong>and</strong>ing of the specificform of response of <strong>sockeye</strong> to certain stressors (i.e., helping to accept or reject differentsuspected causes), experiments demonstrating cause-effect linkages, or positive <strong>sockeye</strong>responses following the removal of a stressor. In general, the level evidence for Stage 2 is lessthan for Stage 1, due primarily to the challenges of experimentally evaluating responses ofrapidly migrating smolts to a continuing gradient of stressors. Evidence is strongest for suchstressors as contaminants <strong>and</strong> temperature, which are amenable to experimentation. Asdiscussed above, MacDonald et al. (2011) compared water contaminant concentrations duringthe smolt migration period with thresholds established from laboratory <strong>and</strong> field studies, <strong>and</strong>found no evidence that contaminants encountered by smolts contributed to declining <strong>sockeye</strong>productivity. Studies of smolt health conducted in other rivers (e.g., Columbia <strong>River</strong> <strong>and</strong> otherstudies reviewed in Marmorek et al. 2004) are generally not applicable to the <strong>Fraser</strong> situation.Therefore, we are left with little other evidence to evaluate stressor hypotheses.4.3.6 ConclusionsTable 4.3-1 shows our conclusions regarding the effects of each stressor on life history stage 2(smolt migration from rearing habitats to the <strong>Fraser</strong> Estuary). Again, our conclusions relate to theoverall trends in <strong>sockeye</strong> productivity over the last two decades. This table is identical to Table4.2-1 for Stage 1, except that migrating smolts are judged to have no exposure to either mines orsmall hydro, compared to low exposure for eggs, alevins <strong>and</strong> fry.53
Table 4.3-1. Evaluation of the relative likelihood that potential stressors encountered by <strong>Fraser</strong> <strong>River</strong> <strong>sockeye</strong><strong>salmon</strong> during their smolt migration from rearing habitats to the <strong>Fraser</strong> Estuary (Stage 2) have contributedto overall declines in productivity in recent decades. See section 4.7 for further statistical analyses relevantto the correlation/consistency column.Factor Mechanism Exposure Correlation/Consistency Other LikelihoodEvidenceForestry b Yes Yes No No a UnlikelyMining Yes No Not done No a UnlikelyLarge hydro Yes Yes No Against UnlikelySmall hydro Yes No No No a UnlikelyUrbanization Yes Yes No No a Unlikelyabove HopeAgriculture b Yes Yes No No a UnlikelyWater Use Yes Yes No Yes UnlikelyContaminants Yes Yes No Yes UnlikelyDensity Yes Some No No UnlikelyDependentMortalitystocksPathogens Yes Few <strong>data</strong> Not done Yes NoconclusionpossiblePredators Yes Few <strong>data</strong> No No UnlikelyL. <strong>Fraser</strong> l<strong>and</strong> Yes Yes for No No Unlikelyusesag/for; Nofor othersClimate Yes Yes Weak evidence Mixed PossibleChangea It is difficult to establish hazard thresholds for the proportion of watershed area above which there are negative<strong>impacts</strong> on <strong>sockeye</strong> spawning <strong>and</strong> rearing. Such thresholds are better defined for contaminants <strong>and</strong> water use.bAgriculture <strong>and</strong> forestry rows include evidence from both Technical Reports 3 (Nelitz et al. 2011) <strong>and</strong> 12(Johannes et al. 2011). Forestry includes logging, Mountain Pine Beetle <strong>and</strong> log storage.As for Stage 1, we conclude that with the exception of climate change, which we consider to be apossible factor, <strong>and</strong> pathogens (for which no conclusion is possible due to <strong>data</strong> gaps), it isunlikely that other factors (i.e., forestry, mining, large <strong>and</strong> small hydro, urbanization, agriculture,water use, contaminants, density dependent mortality, predators, <strong>and</strong> Lower <strong>Fraser</strong> l<strong>and</strong> use)taken <strong>cumulative</strong>ly, were the primary drivers behind long term declines in <strong>sockeye</strong> productivityacross the <strong>Fraser</strong> Basin. A major reason for this conclusion is the short time period over whichmigrating smolts are exposed to the above stressors. Though not primary drivers of the <strong>Fraser</strong><strong>sockeye</strong> situation, each of the factors considered for Stage 2 may still have had some effects onsome <strong>Fraser</strong> stocks in some years (the <strong>data</strong> are insufficient to reject that possibility).However, since smolt migration occurs subsequent to enumeration of fry <strong>and</strong> smolts in rearinglakes, we have no analyses relating survival rates during this life history stage to potential54
stressors. Thus our conclusions have a lower level of confidence than for Stage 1. While thereare some survival estimates for acoustically tagged smolts, these <strong>data</strong> (which only cover a fewstocks) were not analyzed by any of the Cohen Commission technical studies.As we found for Stage 1, none of the factors considered for Stage 2 is likely to have been muchworse in 2007 for downstream migrating smolts, sufficient to have significantly decreased smoltsurvival prior to entering the ocean, <strong>and</strong> affecting the 2009 returns. Ocean conditions in 2007are a very different story, discussed in the next section. Similarly, none of the factors affectingsmolt survival during their downstream migration are likely to have ben much better in 2008,sufficient to have substantially improved smolt to adult survival in the <strong>salmon</strong> returning in 2010.For example, Rensel (2010, Figure 4 in Appendix C of Peterman et al. 2010) found that <strong>Fraser</strong><strong>River</strong> flows in May were higher than normal in both 2007 <strong>and</strong> 2008.4.3.7 Key things we need to know betterSockeye smolt survival from rearing to the estuary is a significant gap in the current assessment.In the Columbia <strong>River</strong>, extensive PIT-tagging (Passive Induced Transponders) of hatchery fish(mostly chinook <strong>and</strong> steelhead) have provided precise estimates of in-river smolt survival rates,as well as smolt to adult survival rates, leading to considerable advancements in underst<strong>and</strong>ing(e.g., Schaller et al. 2007). The PSC Panel on <strong>Fraser</strong> <strong>sockeye</strong> declines (Peterman et al. 2010) hadthe following recommendations, with which we concur:“The survival rate of <strong>sockeye</strong> juveniles during their migration downstream within the<strong>Fraser</strong> <strong>River</strong> cannot currently be estimated separately from the overall juvenile-to-adultsurvival rate. To identify the timing <strong>and</strong> location of <strong>sockeye</strong> mortalities, this limitationshould be (<strong>and</strong> can be) corrected. In the absence of correcting this issue, focusing researchmainly on marine conditions may be insufficient for improving underst<strong>and</strong>ing, forecasting,<strong>and</strong> management. The Panel recommends research to assess <strong>sockeye</strong> smolt survivalbetween lakes <strong>and</strong> the <strong>Fraser</strong> <strong>River</strong> estuary. The priority is rated higher for futuremanagement actions because corrective actions could be taken for disease <strong>and</strong>/orcontaminant problems, for example.” (Peterman et al. 2010; pg. 21)4.4 Stage 3: Coastal Migration <strong>and</strong> Migration to Rearing AreasThis stage covers the journey of <strong>sockeye</strong> <strong>salmon</strong> from the mouth of the <strong>Fraser</strong> <strong>River</strong> to the Gulfof Alaska.4.4.1 Plausible mechanismsAs shown in the conceptual model (Figure 3.3-1) potential factors affecting Stage 3 include: 1)pathogens <strong>and</strong> disease; 2) predators, 3) marine conditions, 4) Strait of Georgia habitat55
conditions (including marine conditions <strong>and</strong> human activities <strong>and</strong> development in thesurrounding area), 5) climate change, <strong>and</strong> 6) <strong>salmon</strong> farms (note: the <strong>salmon</strong> farms technicalreport is not yet available). There are cause-effect mechanisms by which each of these factorscould at least potentially affect the health <strong>and</strong> survival of <strong>sockeye</strong> <strong>salmon</strong> post-smolts afterleaving the <strong>Fraser</strong> <strong>River</strong> <strong>and</strong> progressing through their coastal migration to the North PacificOcean, as described below.This stage is particularly important to <strong>Fraser</strong> <strong>River</strong> <strong>sockeye</strong> <strong>salmon</strong>. McKinnell et al. (2011,Section 2) explain that for <strong>Fraser</strong> <strong>River</strong> <strong>sockeye</strong> <strong>salmon</strong> in particular, this stage may equate to a“race northwards to find better feeding conditions”. The <strong>sockeye</strong> <strong>salmon</strong> populations that enterthe ocean in the more southern portions of <strong>sockeye</strong> habitat range have longer ocean migrations tothe Gulf of Alaska, with lower average growth rates <strong>and</strong> lower ocean survival than those enteringfrom more northern rivers. Therefore, <strong>Fraser</strong> <strong>River</strong> <strong>sockeye</strong> <strong>salmon</strong> may be particularly sensitiveto any increases in stress through this critical stage.Pathogens <strong>and</strong> disease could potentially lead to increased mortality of <strong>sockeye</strong> <strong>salmon</strong> postsmolts.Kent (2011) provides a list of potentially important pathogens <strong>and</strong> indicates that there aremany potential pathogens that could cause mortality in wild <strong>salmon</strong>. He identifies the followingpathogens as potentially “high risk” over the entire life of <strong>sockeye</strong> <strong>salmon</strong>: the IHN virus, threebacteria (Vibrio anguillarum, Aeromonas <strong>salmon</strong>icida, Renibacterium <strong>salmon</strong>inarum), <strong>and</strong> twoparasites (Ich -Ichthyophtheirus multifillis <strong>and</strong> the myxozoan Parvicapsula minibicornis). IHN isimportant for fry but also occurs in the marine environment <strong>and</strong> there have been outbreaks inpen-reared Atlantic <strong>salmon</strong>. Kent (2011) reports that although <strong>sockeye</strong> <strong>salmon</strong> post-smoltsappear to be less susceptible, recent evidence suggests that virulence is variable <strong>and</strong> therefore itis conceivable that some strains may be more pathogenic to <strong>sockeye</strong> <strong>salmon</strong> in the ocean.Kent (2011) describes several important interactions with pathogens <strong>and</strong> disease that mayincrease the impact on <strong>sockeye</strong> <strong>salmon</strong>. Temperature influences the immune status of fish <strong>and</strong>most pathogens increase with temperature either due to a direct response to warmer conditions oran indirect response to increases in invertebrate hosts <strong>and</strong> other intermediate vectors. Organicpollutants can increase intermediate hosts <strong>and</strong> opportunistic fungi <strong>and</strong> bacteria, <strong>and</strong> toxiccontaminants may impair fish immune systems but may also increase the mortality ofinvertebrate hosts. Some research suggests that l<strong>and</strong> use practices also have an indirect effect onpathogens. Aquaculture was not considered in our report as the Commission Technical reportson this potential stressor were not available, but will be considered in an addendum to this report.Unfortunately, there are insufficient <strong>data</strong> to evaluate the extent to which these potentialinteractions of pathogens <strong>and</strong> other stressors are (or are not) causing <strong>sockeye</strong> smolt mortalityduring their coastal migration.56
There are many marine predators that may consume <strong>sockeye</strong> post-smolts as they migrate fromthe mouth of the <strong>Fraser</strong> northward along the coast. Christensen <strong>and</strong> Trites (2011) identify spinydogfish, coho <strong>salmon</strong>, chinook <strong>salmon</strong>, juvenile sablefish, humbolt squid, <strong>and</strong> arrowtoothflounder as potential fish predators. Potential bird predators include common tern, arctic tern,pelagic cormorant, Br<strong>and</strong>t’s cormorant, gulls, <strong>and</strong> common murre. Mortality due to predation islikely to have always been high during this life stage as the sheer abundance of post-smoltsmigrating up the coast would have always attracted a diversity of predators, but if the level ofpredation has increased in recent decades, the impact on the <strong>sockeye</strong> <strong>salmon</strong> population mayhave also increased. Marine mammal predators (including pinnipeds <strong>and</strong> cetaceans) have beendocumented eating <strong>salmon</strong> post-smolts but there is no evidence of marine mammal predation on<strong>sockeye</strong> <strong>salmon</strong> post-smolts (Christensen <strong>and</strong> Trites, 2011). However, knowledge on the diet,abundance, distribution <strong>and</strong> biology of potential predators is often scarce. For example, littleinformation is known on the diet of Pacific white-sided dolphins, but <strong>salmon</strong> might represent 30-60% of their diet during June through November (Christensen <strong>and</strong> Trites, 2011). Salmon is alsoknown to be an important prey species for Steller sea lions, although the evidence suggests thatSteller sea lions predominantly eat adult <strong>salmon</strong> rather than juveniles. Knowledge of specificpredator-prey associations is largely based on diet information for predators but such informationis largely qualitative <strong>and</strong> often non-existent for particular predators of interest (Christensen <strong>and</strong>Trites, 2011). Overall, Christensen <strong>and</strong> Trites (2011) emphasize that even if it could be shownthat the aggregate rate of predation on <strong>sockeye</strong> <strong>salmon</strong> has increased substantially over the pastseveral decades, it would likely still not be possible to determine whether predation itself wascontributing to the decline of <strong>sockeye</strong> <strong>salmon</strong> or predators are simply acting as the“executioners” of <strong>sockeye</strong> <strong>salmon</strong> that were already less healthy <strong>and</strong> slower due to some otherunderlying driver.Christensen <strong>and</strong> Trites (2011) also put forth an alternate theory regarding the potential impact ofpredation on <strong>sockeye</strong> <strong>salmon</strong>. They suggest that if there have been substantial declines in thepopulations of alternate prey species that are physically comparable to <strong>sockeye</strong> <strong>salmon</strong>,predators that might otherwise not eat or not prefer <strong>sockeye</strong> <strong>salmon</strong> might increase theirconsumption. In this situation, it would be possible for predators to have an increased impact on<strong>sockeye</strong> <strong>salmon</strong> while not actually increasing in abundance.Competition is another plausible mechanism of potential importance discussed by Christensen<strong>and</strong> Trites (2011). Ruggerone et al. (2010) summarize trends in wild <strong>and</strong> hatchery populations inthe North Pacific, <strong>and</strong> discuss the potential for a “tragedy of the commons” effect due toincreased numbers of fish competing for a finite pool of food resources. In section 4.7, weconsider the extent to which total pink <strong>salmon</strong> abundance (wild plus hatchery) can explain57
changes in <strong>Fraser</strong> <strong>sockeye</strong> stock productivity. As discussed in section 4.7, these effects are mostlikely to occur in Stage 4 (growth in the North Pacific <strong>and</strong> return to the <strong>Fraser</strong>).McKinnell et al. (2011) investigate how marine conditions along the coast may potentially haveaffected <strong>Fraser</strong> <strong>River</strong> <strong>sockeye</strong> <strong>salmon</strong> over recent decades <strong>and</strong> the 2005 brood year (2009returns) in particular. The physical conditions examined include wind, river discharge, salinity,temperature, water density, <strong>and</strong> water column stability. The primary biological conditionsexamined were the timing <strong>and</strong> magnitude of chlorophyll production. Broad scale climate driverscan influence river discharge <strong>and</strong> wind regimes, which may then influence the salinity of coastalwaters. Salinity <strong>and</strong> temperature interact to affect water density, water column stability <strong>and</strong>therefore surface mixing, which <strong>impacts</strong> the productivity of the surface layer <strong>and</strong> its potential toincrease in temperature. <strong>Fraser</strong> <strong>sockeye</strong> <strong>salmon</strong> are negatively affected by warmer <strong>and</strong> lessproductive ocean conditions. McKinnell et al. (2011, Sections 6.1, 6.2) explore the oceanography<strong>and</strong> climate of the Strait of Georgia <strong>and</strong> Queen Charlotte Strait/Sound.Johannes et al. (2011) explore how human activity <strong>and</strong> development in the areas surroundingStrait of Georgia may potentially have had a negative impact on habitat quality for <strong>sockeye</strong><strong>salmon</strong> as they leave the <strong>Fraser</strong> <strong>River</strong> estuary. Changes in the human population may be a proxyfor many feasible mechanisms by which human activity <strong>and</strong> development might directly impact<strong>sockeye</strong> <strong>salmon</strong> habitat quality. Increasing contaminants in the Strait of Georgia from mills,industrial facilities, chemical inputs to farming, <strong>and</strong> liquid <strong>and</strong> solid waste inputs couldpotentially degrade habitat quality. Forestry is a major l<strong>and</strong> use in the areas surrounding theStrait of Georgia. Although forestry has been shown to often have a negative effect on freshwater<strong>and</strong> estuary habitats for <strong>salmon</strong>, the potential impact on inshore marine habitat is uncertain(Johannes et al., 2011). Increased marine traffic may also create transient disturbances upon thesurface <strong>and</strong> contribute further contaminants to the water.Climate change could potentially have driven broad scale changes to the entire ecosystem(Hinch <strong>and</strong> Martins, 2011). It is plausible that climate change may have contributed to changesin the timing, magnitude, patterns, trends <strong>and</strong> variability in physical <strong>and</strong> biological habitatconditions along the coast. The potential <strong>impacts</strong> to <strong>sockeye</strong> <strong>salmon</strong> could be direct, such asincreases in sea surface temperature, or indirect, such as changes in predation, disease, or foodabundance <strong>and</strong> quality.4.4.2 Exposure of <strong>Fraser</strong> <strong>River</strong> <strong>sockeye</strong> to stressorsMost of the evidence on exposure to particular stressors during this life stage is based on anunderst<strong>and</strong>ing of the general migration route <strong>and</strong> timing of <strong>Fraser</strong> <strong>River</strong> <strong>sockeye</strong> <strong>salmon</strong> <strong>and</strong> an58
assumption that exposure occurs where there is spatial <strong>and</strong> temporal overlap of potential factorswith the post-smolts. As <strong>sockeye</strong> <strong>salmon</strong> pass through the Strait of Georgia, Queen CharlotteSound, <strong>and</strong> along the coast they are exposed to the physical <strong>and</strong> biological conditions of theseason.Strong evidence of exposure would require a much more precise knowledge of the spatial <strong>and</strong>temporal patterns of both the <strong>sockeye</strong> <strong>salmon</strong> <strong>and</strong> each specific potential stressor, recognizingthat migration timing varies among stocks. The mere presence of a potential stressor does notnecessarily mean that exposure has occurred. For example, finding a particular contaminant atone sampling location in the Strait of Georgia does not mean that <strong>sockeye</strong> <strong>salmon</strong> were exposedto it. If an infection is detected in fish, that may implicate exposure to that pathogen, but overlapwith the pathogen alone may not. Furthermore, “exposure” in a general sense to potential sourcesmay not necessarily correspond with exposure to actual detrimental conditions. Johannes et al.(2011) show that farm area <strong>and</strong> total farm inputs (i.e. chemical fertilizers <strong>and</strong> insecticides) havebeen increasing around the Strait of Georgia, yet improved management practices have reducedrunoff from farms waste, which is the element that is most likely to directly affect <strong>sockeye</strong><strong>salmon</strong>.Exposure to many predators can only be assumed based on the likely overlap in space <strong>and</strong> timebecause knowledge of the distribution <strong>and</strong> diet of many predators is lacking. Christensen <strong>and</strong>Trites (2011) have searched the scientific literature for diet information for potential predatorsbut the <strong>data</strong> are often relatively sparse, old or only available for particular species. Physicalevidence that particular predators have consumed <strong>sockeye</strong> <strong>salmon</strong> post-smolts providesconvincing evidence of exposure, but a lack of such <strong>data</strong> does not support any conclusions aboutexposure - most <strong>sockeye</strong> that are eaten are simply never seen again <strong>and</strong> thus exposure cannot beconfirmed. The importance of potential predators is often based on knowledge about thecomposition of a predator’s diets <strong>and</strong> whether or not <strong>sockeye</strong> <strong>salmon</strong> is a preferred prey species.However, it is possible that a relatively abundant predator could have a substantial impact on<strong>sockeye</strong>, even if <strong>sockeye</strong> comprised only a small, possibly undetectable fraction of the predator’sdiet (Christensen <strong>and</strong> Trites, 2011). For example, if 0.1% of the diet of spiny dogfish were<strong>sockeye</strong> smolts, spiny dogfish would consume 14.5 million smolts within the Strait of Georgia<strong>and</strong> yet over a thous<strong>and</strong> dogfishes might need to be sampled before finding one containing<strong>sockeye</strong> <strong>salmon</strong> smolts (Christensen <strong>and</strong> Trites, 2011, p. 77). To provide some frame ofreference, the average number of smolts leaving Chilko Lake from 1997-2005, prior toaccounting for any mortality while outmigrating to the ocean, was approximately 22.5 million.The key point here is that a predator could have a substantial impact on a prey species even ifthat prey is a negligible proportion of the predator’s diet. For example, the existing evidenceshows that juvenile <strong>salmon</strong> represents a very small proportion of the diet of Steller sea lions. The59
more important question is: what is the net impact of Steller sea lions on <strong>sockeye</strong> <strong>salmon</strong>?However, predation is a major part of <strong>sockeye</strong> <strong>salmon</strong>'s natural lifecycle; substantial exposure topredation should be expected even if predation has not substantially contributed to the decline of<strong>Fraser</strong> <strong>River</strong> <strong>sockeye</strong> <strong>salmon</strong>.Very little is known about the exposure of <strong>Fraser</strong> <strong>River</strong> <strong>sockeye</strong> <strong>salmon</strong> to pathogens <strong>and</strong>disease. Relatively few outbreaks of disease have ever been documented in BC <strong>sockeye</strong> <strong>salmon</strong>(Kent, 2011). However, this is not strong evidence against exposure to potentially importantdiseases because there is simply very little research on wild fish; most research focuses onhatchery fish <strong>and</strong> there is minimal <strong>data</strong> on the marine phase at all (Kent, 2011). There iscurrently poor underst<strong>and</strong>ing of the prevalence, geographic distribution, <strong>and</strong> virulence ofpathogens that wild <strong>sockeye</strong> <strong>salmon</strong> might be exposed to in the marine environment (Kent,2011).Johannes et al. (2011, Section 4) have concluded that the potential exposure of <strong>sockeye</strong> <strong>salmon</strong>in the Strait of Georgia to <strong>impacts</strong> from human activity <strong>and</strong> development 12 (evaluated in termsof geographic overlap <strong>and</strong> magnitude of interaction) are “nil” to “low” for the followingcategories of potential stressors: population growth <strong>and</strong> urbanization; agriculture <strong>and</strong> forestryl<strong>and</strong> use; large industrial <strong>and</strong> infrastructure projects; solid <strong>and</strong> liquid waste; <strong>and</strong> dredging, diking,<strong>and</strong> disposal at sea; contaminated materials; <strong>and</strong>, nonindigenous species introductions. Thegeographic overlap is evaluated as a moderate only for shipping <strong>and</strong> vessel traffic, but themagnitude of interaction is still only evaluated as low (Johannes et al., 2011).Another poorly understood factor is the extent to which the Strait of Juan de Fuca isoccasionally used by post-smolts leaving the Strait of Georgia, <strong>and</strong> how this behavior may varyover time <strong>and</strong> among specific stocks. McKinnell et al. (2011) provide a summary of the availableevidence on the use of this alternate migration route. Any <strong>sockeye</strong> <strong>salmon</strong> that use this routemight avoid exposure to potential stressors in the northern Strait of Georgia <strong>and</strong> Johnstone Strait,but it appears that the use of this route has been relatively rare in <strong>sockeye</strong> <strong>salmon</strong>.McKinnell et al. (2011, section 7.1.1) explain how the resolution of most marine <strong>data</strong> does notcorrespond with the fine scale variability that <strong>sockeye</strong> <strong>salmon</strong> actually experience as theymigrate up the coast. Regional <strong>data</strong> is often inferred from only a single or relatively few point12 “Human activities <strong>and</strong> development” refers specifically to those activities <strong>and</strong> developments considered withinTechnical Report #12 (<strong>Fraser</strong> <strong>River</strong> Sockeye Habitat Use in the Lower <strong>Fraser</strong> <strong>and</strong> Strait of Georgia), which do notinclude <strong>salmon</strong> farms. Exposure to <strong>salmon</strong> farms will be covered in the technical report on aquaculture, which iscurrently in progress. The present report does not provide any conclusions regarding <strong>salmon</strong> farms.60
observations that are then averaged across time <strong>and</strong>/or space to capture broad scale variation;however, the specific conditions encountered by migrating <strong>sockeye</strong> <strong>salmon</strong> in a specific locationat a specific time may not be reflected in regional <strong>data</strong> (McKinnell et al., 2011, section 7.1.1).Given the absence of more spatially precise <strong>data</strong> <strong>and</strong> knowledge of <strong>sockeye</strong> location, one mustassume that <strong>sockeye</strong> <strong>salmon</strong> passing through a particular region are exposed to the regionallyaveraged conditions.4.4.3 Correlation/consistency with patterns in <strong>Fraser</strong> <strong>River</strong> <strong>sockeye</strong>productivityKent (2011) reports that the limited survey <strong>data</strong> available on pathogens <strong>and</strong> disease do notindicate any increase over time; however, it is impossible to determine whether these sparse <strong>data</strong>are representative of broader trends across other pathogens. Almost no <strong>data</strong> exist with which toassess changes in the abundance of different pathogens over time, the prevalence of diseasesover time, or the spatial distribution of important pathogens (Kent, 2011). This makes itimpossible to assess whether diseases are correlated with <strong>Fraser</strong> <strong>sockeye</strong> productivity.Christensen <strong>and</strong> Trites (2011) did not test for any statistical relationships between predatorabundance <strong>and</strong> the observed patterns in <strong>sockeye</strong> <strong>salmon</strong> abundance or productivity. One factorthat complicates such analyses is that changes in predator abundance are only a rough proxy forpotential changes in the magnitude of <strong>sockeye</strong> consumed; the ultimate impact of the <strong>sockeye</strong><strong>salmon</strong> population is going to be a product of both predator abundance <strong>and</strong> consumption rates.Christensen <strong>and</strong> Trites (2011) note that several key fish predators (including spiny dogfish, coho<strong>salmon</strong>, chinook <strong>salmon</strong>, juvenile sablefish), <strong>and</strong> key marine bird predators have been declining,or at least not increasing, over recent decades. Conversely, arrowtooth flounder, which isbelieved to be a potentially important predator of <strong>sockeye</strong> <strong>salmon</strong>, appears to be increasing inabundance. However, <strong>data</strong> on abundance over time do not generally exist for most fish <strong>and</strong> birdpredators except for a few commercially important species (Christensen <strong>and</strong> Trites, 2011).Marine mammals such as Steller sea lions <strong>and</strong> harbour seals have increased substantially overrecent decades. Christensen <strong>and</strong> Trites (2011) report that juvenile <strong>salmon</strong> do not represent asignificant proportion of the diet of these marine mammals, but as the spiny dogfish examplecited in the previous section indicates, this does not definitively exclude such predation frompossibly having an impact on <strong>salmon</strong> populations. Several important, abundant prey species havedecreased substantially over time, which might drive predators that would otherwise not favor<strong>sockeye</strong> <strong>salmon</strong> to increase their consumption (Christensen <strong>and</strong> Trites, 2011).McKinnell et al. (2011) demonstrate that the cohort from the 2005 brood year may have enduredextreme physical <strong>and</strong> biological ocean conditions in Queen Charlotte Sound during their 200761
coastal migration. Anomalous climate conditions in 2007 resulted in exceptional snowpackaccumulation in the mountain ranges of western BC during the winter, then a delayed but rapidsnowmelt in the spring that produced extreme levels of discharge into Queen Charlotte Sound.As a result of this large influx of freshwater into the Sound, salinity measurements were found tobe at or near record lows throughout the area. This anomaly was then maintained by an atypicalwind regime that kept these fresher waters “backed up” in Queen Charlotte Sound. The sea levelanomalies observed in Prince Rupert provide further support for this mechanism. The products ofthese factors were a fresher surface layer <strong>and</strong> a more stable ocean column that inhibited mixing,allowing the surface layer to warm to higher than average temperatures <strong>and</strong> potentially becomedepleted of nutrients. The spring of 2007 marked a year of very poor chlorophyll production inQueen Charlotte Sound, a factor that has been associated over time with poor survival rates of<strong>sockeye</strong> <strong>salmon</strong> from Chilko Lake. The combination of a substantial reduction in food supply<strong>and</strong> the higher energetic costs of migrating through warmer waters could potentially have led toincreased mortality of the cohort of <strong>Fraser</strong> <strong>River</strong> <strong>sockeye</strong> <strong>salmon</strong> that returned in 2009. However,by contrast, McKinnell et al. (2011) found that while some of these same physical <strong>and</strong> biologicalmeasures were higher than average in the Strait of Georgia in 2007, none of them exhibitedextreme levels. Although long records of many physical ocean properties are available, thereexists only a limited record for biological properties such as chlorophyll concentration (i.e. since1998). McKinnell et al. (2011; page ix <strong>and</strong> 135) noted that in 2007 there was typical survival ofacoustically-tagged hatchery-reared <strong>sockeye</strong> <strong>salmon</strong> from Cultus Lake northward through theStrait of Georgia in 2007, which is consistent with the non-extreme physical conditions discussedabove.McKinnell et al. (2011; page 110) emphasize that conditions in Queen Charlotte Sound werevery different in 2008 (affecting the 2010 returns) as compared to conditions in 2007 (affectingthe 2009 returns):“The summer of 2008 was the opposite of 2007. Sea surface temperatures along theNorth American coast were cool following what was the coldest year in the Gulf ofAlaska since 1972, <strong>and</strong> these cool anomalies persisted along the coast throughSeptember. Unlike the Strait of Georgia, migrating <strong>sockeye</strong> <strong>salmon</strong> in 2008 would havehad a very different thermal experience during their migration in 2008 compared to 2007once leaving the coastal straits. The temperature of surface seawater along the coast isoften an indicator of major ecological changes that accompany the warmer/colder ocean.”The much improved marine survival rates of <strong>Fraser</strong> <strong>sockeye</strong> in 2008 (relative to 2007) areconsistent with the hypothesis that sea surface temperatures strongly affect marine survival.62
Johannes et al. (2011) demonstrate that although the human population surrounding the Strait ofGeorgia has consistently increased over the past two decades, trends observed in human activity<strong>and</strong> development have been more variable (e.g., liquid <strong>and</strong> solid waste stable, substantialdecrease in the number of new large developments per decade, agricultural area increased 10%,livestock more than doubled, fertilizer inputs remained stable, insecticide inputs increasedroughly 100%, forest harvesting decreased 50%, ship movements stable, cruise ship trafficsteadily increased, concentrations of contaminants decreased substantially).Hinch <strong>and</strong> Martins (2011; section 1.4.3) summarize studies indicating an inverse relationshipbetween <strong>sockeye</strong> <strong>salmon</strong> early marine survival <strong>and</strong> increasing sea temperature. This suggeststhat there is strong evidence for a direct impact of climate change on <strong>sockeye</strong> <strong>salmon</strong>. However,because coastal sea surface temperatures experienced by <strong>Fraser</strong> <strong>River</strong> <strong>sockeye</strong> <strong>salmon</strong> remainwithin their tolerable range, it is suggested that temperature is a proxy for other regionalmechanisms or interactions affected by climate change (Hinch <strong>and</strong> Martins, 2011).4.4.4 Correlation/consistency with patterns in non-<strong>Fraser</strong> <strong>River</strong> <strong>sockeye</strong>productivityOther <strong>sockeye</strong> stocks overlap with portions of the coastal migration of <strong>Fraser</strong> <strong>River</strong> <strong>sockeye</strong><strong>salmon</strong>. Stocks that share both geographic <strong>and</strong> temporal overlap will likely encounter similarpathogens, predators <strong>and</strong> ocean conditions during this stage. The extent to which such stocksshow similar trends in productivity to those of the <strong>Fraser</strong> <strong>River</strong> (see Peterman <strong>and</strong> Dorner, 2011)would provide evidence supporting the importance of these stressors. In examining theproductivity patterns over 64 <strong>Fraser</strong> <strong>and</strong> non-<strong>Fraser</strong> <strong>sockeye</strong> populations from Washington to SEAlaska, Peterman <strong>and</strong> Dorner (2011; pg. 3) comment that: “The large spatial extent ofsimilarities in productivity patterns that we found across populations suggests that there might bea shared causal mechanism across that large area.”, though they acknowledge that further work isrequired to test this hypothesis. The Cohen Commission technical reports do not howeverinclude analyses of the relationships between stressors at this stage <strong>and</strong> productivity indices fornon-<strong>Fraser</strong> <strong>River</strong> <strong>sockeye</strong>.4.4.5 Other evidenceIn terms of factors potentially contributing to the poor 2009 returns, McKinnell et al. (2011)provide detailed evidence of physical <strong>and</strong> biological ocean properties that exceeded theirhistorical records thus exceeding the known range of natural variability, which we consider to bean exceedance of an implicit threshold. With respect to the overall relationship between seasurface temperatures <strong>and</strong> <strong>Fraser</strong> <strong>sockeye</strong> smolt survival, Hinch <strong>and</strong> Martins (2011; section 1.4.3)63
summarize the following evidence of how warmer temperatures indirectly affect <strong>sockeye</strong>(references cited in their report):o along the British Columbia coast, warm SSTs are associated with reduced upwelling <strong>and</strong>hence low food availability (i.e. zooplankton) for young <strong>sockeye</strong> <strong>salmon</strong>;o the peak timing of the copepod Neocalanus plumchrus, the main zooplankter in the Straitof Georgia, has advanced up to 30 days in the past decades <strong>and</strong> the peak duration hasshortened in response to warming;o the observed advance in timing of the <strong>Fraser</strong> <strong>River</strong> spring freshet may also becontributing to an earlier peak in zooplankton density in the Strait of Georgia;o changes in food availability as well as high metabolic rates incurred by warm waters areconsistent with the observation that early marine growth of <strong>Fraser</strong> <strong>River</strong> <strong>sockeye</strong> <strong>salmon</strong>is reduced when coastal SST is warm;o reduced growth would make juveniles more vulnerable to predation mortality;o the abundance of non-resident predatory fish in coastal waters off British Columbiaincreases in warm years; <strong>and</strong>o resident predatory fish increase food consumption so as to offset high metabolic ratesincurred by warm watersConditions in Queen Charlotte Sound versus the Strait of GeorgiaOne of the most striking differences between the conclusions reached at the Cohen Commissionworkshop (Appendix 6) <strong>and</strong> the PSC report (Peterman et al., 2010) concerned the relativeimportance of ocean conditions inside versus outside the Strait of Georgia (SoG) during thecoastal migration of <strong>sockeye</strong> <strong>salmon</strong> to the Gulf of Alaska. Peterman et al. (2010) concluded thatit was “very likely” that physical <strong>and</strong> biological ocean conditions inside SoG during this lifestage had been a “major factor” contributing to the overall decline in productivity <strong>and</strong> “likely”that they had been a major factor contributing to the poor returns in 2009 13 . By comparison, thepanel concluded that it was “possible” that ocean conditions outside SoG had been a“contributing factor” to both the overall <strong>and</strong> 2009 patterns in <strong>sockeye</strong> <strong>salmon</strong>. However, themajority of the expert participants in the Cohen Commission workshop evaluated oceanconditions inside SoG as being only a “likely” contributor to both the overall <strong>and</strong> 2009 patterns,but that ocean conditions outside SoG, within Queen Charlotte Sound (QCS) in particular, were a13 The approaches used by Peterman et al. (2010) to assess the relative likelihood of different hypothese, as well asthe approaches used at the Cohen Commission Scientific <strong>and</strong> Technical workshop, were less formal than those weapplied in this technical report, <strong>and</strong> are not directly comparable. There were also differences in the group of expertsinvolved in making these assessments. For example, Peterman et al. (2010) gave ocean conditions inside the Straitof Georgia their highest possible likelihood rating <strong>and</strong> ocean conditions outside the Strait of Georgia a lowerlikelihood rating, whereas the participants at the Cohen Commission workshop concluded the reverse.64
“likely” contributor to the overall pattern <strong>and</strong> a “very likely”, potentially major, contributor tothe poor 2009 returns.Using the <strong>data</strong> collected from the other Cohen Commission technical projects, we haveconducted quantitative analyses over several time periods. The analyses use multiple regressionto compare the ability of several different oceanographic <strong>and</strong> climatic variables (measured inQCS <strong>and</strong> SoG) to explain the observed variability in <strong>Fraser</strong> <strong>River</strong> <strong>sockeye</strong> <strong>salmon</strong> productivity(i.e., ln(recruits/spawner)). A brief overview of the approach used is provided in Section 3.3.6<strong>and</strong> the details of the methodology <strong>and</strong> results are described in Appendices 3 <strong>and</strong> 4, respectively.We tested three model sets with the <strong>data</strong> available for marine conditions in QCS <strong>and</strong> SoG (Table4.4-1). Each model set represents a set of covariates or independent variables that have complete<strong>data</strong> over a specified period of time. Within each model set, different models (i.e., combinationsof variables) can be tested to determine their ability to explain the observed variability in thedependent variable. In the present case, the dependent or response variable is <strong>sockeye</strong> <strong>salmon</strong>productivity (ln (recruits/spawner)). Models can only be directly compared to other models in thesame model set (i.e., using the same set of <strong>data</strong>) but not to models in other model sets. The timeframes of the three model sets tested in this section are brood years 1969-2004, 1980-2004, <strong>and</strong>1996-2004. The key differences among the model sets examined are that sea surfacetemperatures were not available for QCS until 1980, <strong>and</strong> chlorophyll was not available until1996. The conclusions of these results are presented below, with details in Appendix 4.For 1969-2004 (Table 4.4-2), the results show that the SoG temperature model (M8) <strong>and</strong> theQCS salinity <strong>and</strong> discharge model (M4) were the two models with the most support, but neitherperformed substantially better than the “global” model, which is the model that contains all thevariables in the model set (i.e., M1 in Table 4.4-2). For SoG during this period, temperature (M8)is more valuable for explaining the observed variability in <strong>Fraser</strong> <strong>River</strong> <strong>sockeye</strong> <strong>salmon</strong>productivity than salinity (M7). Overall, the analysis of this time period shows that there issupport for both QCS <strong>and</strong> SoG models – the top ranked model was for SoG, the second for QCS,<strong>and</strong> the third was the global model, including both regions. These results show that for theseparticular variables, over this particular time period, there is no clear evidence of any differencebetween the explanatory value of the two regions; however, the absence of temperature <strong>data</strong> forQCS is a substantial shortcoming of this model set, <strong>and</strong> chlorophyll is not included in any model.65
Table 4.4-1. Variables used in the quantitative analyses of marine conditions in Queen Charlotte Sound (QCS) <strong>and</strong>the Strait of Georgia (SoG). All of the <strong>data</strong> included in this table were available to at least 2004 (in terms ofbrood year). In many cases, even more recent <strong>data</strong> is available but the period of analysis was limited by the<strong>data</strong> for productivity (i.e. the dependent variable), which was currently only available up to brood year2004. The 2004 brood year produced adults that would have predominantly returned in 2008, with 5-yr oldsreturning in 2009.Variable Type Variable Location Data Metrics Start of available<strong>data</strong> (brood year)Dependent Productivity n/a ln (recruits/spawner) 1950Independent Sea surface QCS Average SST, July-August 1980temperature SoG Average SST, April-August 1934(SST)Independent Sea surfacesalinity (SSS)QCSSoGAverage SSS, April-August, Egg Isl<strong>and</strong>Average SSS, April-19681934August, Entrance Isl<strong>and</strong>Independent Chlorophyll a QCS Average concentration ofcholorphyll a, AprilAverage concentration ofcholorphyll a, May1996SoG Average concentration of 1996cholorphyll a, April,northern SoGAverage concentration ofcholorphyll a, May,northern SoGIndependent Discharge QCS Average discharge, July, 1959Wannock <strong>River</strong> (<strong>River</strong>sInlet)SoG Average discharge, May, 1968<strong>Fraser</strong> <strong>River</strong>Average discharge, June-July, <strong>Fraser</strong> <strong>River</strong>Independent Wind QCS Average summer windregime, June-July; principalcomponent of north-south<strong>and</strong> east-west vectors194666
Table 4.4-2. Model specifications for the 1969-2004 (brood years) model set. This table shows the variablesincluded in each of the 8 models tested (i.e., M1 to M8) within this model set. Table 4.4-1 explains whichspecific <strong>data</strong> sets were used for each of these variables. “Rank of model” reflects the AIC c score showinglevel of support (#1 ranked model had the highest level of support <strong>and</strong> lowest AIC c score).Region Variable M1 M2 M3 M4 M5 M6 M7 M8QCS Salinity X X X XQCS Discharge X X XQCS Wind X XSoG Temperature X X XSoG Salinity X X X XSoG Discharge X X XRank of model 3 4 5 2 7 8 6 1For 1980-2004 (Table 4.4-3), the three models with the lowest AICc scores were M4 (QCS SST,SSS <strong>and</strong> discharge), M5 (QCS SST <strong>and</strong> SSS), <strong>and</strong> M2 (QCS SST, SSS, discharge, <strong>and</strong> wind)(Table A4.3-16). Together they indicate that the QCS models have greater explanatory valuethan SoG models for <strong>Fraser</strong> <strong>River</strong> <strong>sockeye</strong> <strong>salmon</strong> productivity during 1980-2004. Thisconclusion is supported further by the fact that the models with the next two lowest AICc scoresare M7 (QCS SSS) <strong>and</strong> M9 (QCS SST). This finding is an important new result because it isalters the conclusion of Peterman et al. (2010) based on new <strong>data</strong> <strong>and</strong> analyses that were notavailable at the PSC workshop.Table 4.4-3. Model specifications for the 1980-2004 (brood years) model set. This table shows the variablesincluded in each of the 10 models tested (i.e. M1 to M10) within this model set. Table 4.4-1 explains whichspecific <strong>data</strong> sets were used for each of these variables. “Rank of model” reflects the AIC c score showinglevel of support (#1 ranked model had the highest level of support <strong>and</strong> lowest AIC c score).Region Variable M1 M2 M3 M4 M5 M6 M7 M8 M9 M10QCS Temperature X X X X XQCS Salinity X X X X XQCS Discharge X X XQCS Wind X XSoG Temperature X X X XSoG Salinity X X X XSoG Discharge X XRank of model 6 3 10 1 2 8 4 9 5 7Within both of the model sets discussed above (i.e. 1969-2004 <strong>and</strong> 1980-2004), <strong>and</strong> across allmodels for both QCS <strong>and</strong> SoG, temperature demonstrated a negative or inverse relationship withthe productivity of <strong>Fraser</strong> <strong>River</strong> <strong>sockeye</strong> <strong>salmon</strong>. Salinity also had a consistent relationshipacross all models within both of the model sets discussed above; however, the direction of therelationship is in the opposite direction for the two regions, positive for QCS, <strong>and</strong> negative for67
SoG. This may be due to regional differences in mechanisms, the confounding impact of otherfactors that interact with sea surface properties, or issues regarding the precise location ofmeasurements versus the precise migration routes of the <strong>sockeye</strong>. We cannot offer a definitiveexplanation for why this might be the case or suggest any underlying mechanism.For 1996-2004, it was not possible to test a model set with both QCS <strong>and</strong> SoG because the timeperiod was too short for the number of variables to be included for the two regions. Thealternative approach was to develop two model sets, one for each region, to test the importanceof chlorophyll against the other variables independently within each region (Tables 4.4-4 <strong>and</strong>4.4-5). The results show that QCS chlorophyll may be an important metric in explaining thevariation in <strong>sockeye</strong> <strong>salmon</strong> productivity over the period of 1996-2004, whereas QCStemperature <strong>and</strong> salinity are relatively uninformative parameters. To the contrary, within SoGduring this timeframe, salinity has strong support <strong>and</strong> the remaining parameters are found to beuninformative, except when they are all included together in the global model. One should bevery cautious about drawing conclusions from patterns observed over such a very short period oftime, but these results do at least indicate that there may be strong regional differences in theimportance of the potential drivers examined. During the <strong>data</strong> processing steps of this project, itwas noted that the variance in chlorophyll measured in the Northern SoG was substantiallygreater than that measured in the Central SoG across all months where <strong>data</strong> were provided(Appendix 3). It may be worth examining these regional differences more closely.Table 4.4-4. Model specifications for the 1996-2004 (brood years) model set for Queen Charolotte Sound. Thistable shows the variables included in each of the 9 models tested (i.e. M1 to M9) within this model set.Table 4.4-1 explains which specific <strong>data</strong> sets were used for each of these variables. “Rank of model”reflects the AIC c score showing level of support (#1 ranked model had the highest level of support <strong>and</strong>lowest AIC c score).Region Variable M1 M2 M3 M4 M5 M6 M7 M8 M9QCS Chlorophyll X X X X X XQCS Temperature X X X X X XQCS Salinity X X X X X XQCS Discharge X XQCS Wind XRank of model 9 6 4 2 3 8 5 7 1Table 4.4-5. Model specifications for the 1996-2004 (brood years) model set for the Strait of Georgia. This tableshows the variables included in each of the 8 models tested (i.e. M1 to M8) within this model set. Table4.4-1 explains which specific <strong>data</strong> sets were used for each of these variables. “Rank of model” reflects theAIC c score showing level of support (#1 ranked model had the highest level of support <strong>and</strong> lowest AIC cscore).68
Region Variable M1 M2 M3 M4 M5 M6 M7 M8 M9SoG Chlorophyll X X X X XSoG Temperature X X X X XSoG Salinity X X X X XSoG Discharge X XRank of model 3 9 8 6 2 1 5 4 74.4.6 ConclusionsTable 4.4-6 shows a summary of the results of the weight of evidence evaluation of potentialcontributing factors at this life stage. All of the potential factors in this life stage have plausiblemechanisms. There are almost no <strong>data</strong> on exposure for pathogens making no conclusionpossible. The evidence presented suggests that <strong>sockeye</strong> <strong>salmon</strong> in the Strait of Georgia have littledirect exposure to human activities <strong>and</strong> development, leading to a conclusion that it is unlikelythat these factors have contributed to the decline of <strong>Fraser</strong> <strong>River</strong> <strong>sockeye</strong> <strong>salmon</strong>. Sockeye<strong>salmon</strong> have been exposed to predators, marine conditions, <strong>and</strong> climate change during this earlymarine phase. However, there has been no evidence presented on any correlations between keypredators <strong>and</strong> <strong>sockeye</strong> <strong>salmon</strong> survival. Some important predators appear to be increasing inabundance, <strong>and</strong> some potentially important alternate prey appear to be decreasing, but manyother known predators are decreasing or remaining stable. It therefore remains possible thatpredators have contributed to the observed declines in <strong>sockeye</strong> <strong>salmon</strong>. Based on plausiblemechanisms, exposure, consistency with observed <strong>sockeye</strong> productivity changes, <strong>and</strong> otherevidence, marine conditions <strong>and</strong> climate change are considered likely contributors to the longtermdecline of <strong>Fraser</strong> <strong>River</strong> <strong>sockeye</strong> <strong>salmon</strong>. Peterman <strong>and</strong> Dorner’s analyses of delayeddensity dependence were applied to total productivity over the whole life cycle. Therefore, theirconclusion that delayed density dependence is unlikely to have been a primary factor causingproductivity declines (discussed in section 4.2 for life stage 1) reflects the net effect across alllife history stages. Aquaculture was not considered in our report as the Commission Technicalreports on this potential stressor were not available, but will be considered in an addendum tothis report.69
Table 4.4-6. Evaluation of the relative likelihood that potential stressors encountered by <strong>Fraser</strong> <strong>River</strong> <strong>sockeye</strong><strong>salmon</strong> during their coastal migration <strong>and</strong> migration to ocean rearing areas have contributed to overalldeclines in productivity in recent decades. See section 4.7 for further statistical analyses relevant to thecorrelation/consistency column.Factor Mechanism Exposure Correlation/Consistency Other LikelihoodEvidencePathogens Yes Few <strong>data</strong> - - NoconclusionpossiblePredators Yes Yes No <strong>data</strong> No <strong>data</strong> PossibleMarine Yes Yes Yes Yes LikelyConditionsHuman Yes No - - UnlikelyActivity <strong>and</strong>Development(SoG)ClimateChangeYes Yes Yes Yes LikelyThe only technical report to present evidence from this life stage specifically associated with the2009 returns was the report on marine factors, which outlined a set of extreme conditionsencountered by this cohort that demonstrates plausibility, exposure, correlation, the exceedanceof the observed historical range of variability for several metrics, <strong>and</strong> the differential survival ofcertain stocks <strong>and</strong> age-types. The conclusion is thus that it is very likely that marine conditionsduring the coastal migration life stage contributed to the poor returns observed in 2009.4.4.7 Key things we need to know betterThere are several major elements about the life history of <strong>Fraser</strong> <strong>River</strong> <strong>sockeye</strong> <strong>salmon</strong> that arepoorly understood <strong>and</strong> prevent a better underst<strong>and</strong>ing of the contribution of key stressors in thislife stage to the overall decline in the population. These include:1. estimates of number of smolts leaving the <strong>Fraser</strong> <strong>River</strong> (preferably by stock) wouldindicate how many <strong>sockeye</strong> <strong>salmon</strong> might actually be dying during their outmigrationbefore even encountering the stressors they face in their marine environment. Presently,there are only some estimates available for Chilko <strong>and</strong> Cultus.2. information on the health <strong>and</strong> condition of smolts leaving the <strong>Fraser</strong> <strong>River</strong>, includingsize, contaminant <strong>and</strong> disease burdens, signs of temperature stress, would providevaluable insight into the contribution of freshwater stressors prior to reaching the ocean.Even if a high proportion of smolts survive until the ocean, they may be extremelyvulnerable to only small changes in the stressors they will face during their coastalmigration if they are already in poor condition when they arrive.70
3. survival rates within key portions of the coastal migration would help determine wherethe highest levels of mortality occur, for example in the Strait of Georgia, JohnstoneStrait, or Queen Charlotte Strait/Sound.4. increased knowledge of stock-specific migration routes <strong>and</strong> timings would increase theability to look for contrast in space <strong>and</strong> time among the stressors that different <strong>sockeye</strong><strong>salmon</strong> stocks encounter (e.g., how often <strong>and</strong> to what extent do certain age-types withincertain stocks use the Strait of Juan de Fuca).5. increased knowledge of the migration route <strong>and</strong> timing of the Harrison stock wouldprovide a particularly valuable contrast to other <strong>Fraser</strong> <strong>River</strong> <strong>sockeye</strong> stocks for tworeasons: 1) the life history of the Harrison stock is quite different from all of the otherstocks, <strong>and</strong> 2) this stock has demonstrated an increase in productivity while almost allother stocks have shown decreasing productivity.6. estimates of the total consumption of <strong>sockeye</strong> <strong>salmon</strong> by particular species of marinemammals should be calculated, based on the current knowledge about the consumptionrates of <strong>sockeye</strong> <strong>salmon</strong> <strong>and</strong> other prey species, the bioenergetics of those marinemammals, <strong>and</strong> their population. Such calculations would provide a better indication ofthe <strong>cumulative</strong> potential impact of predation by marine mammals on <strong>sockeye</strong> <strong>salmon</strong>populations.All of these elements represent critical gaps in our underst<strong>and</strong>ing of the life history of <strong>Fraser</strong><strong>River</strong> <strong>sockeye</strong> <strong>salmon</strong>, where neither the current situation nor historical conditions are wellunderstood. Knowing the natural baseline for these elements would better inform ourunderst<strong>and</strong>ing of how patterns have changed, but <strong>data</strong> collected now can only inform ourunderst<strong>and</strong>ing of the current reality.4.5 Stage 4: Growth in North Pacific <strong>and</strong> Return to <strong>Fraser</strong>This stage covers the growth <strong>and</strong> maturation of <strong>sockeye</strong> <strong>salmon</strong> in the North Pacific Ocean <strong>and</strong>their return back to the <strong>Fraser</strong> <strong>River</strong>.4.5.1 Plausible mechanismsAs shown in the conceptual model (Figure 3.3-1) potential factors affecting Stage 4 include: 1)pathogens <strong>and</strong> disease; 2) predators, 3) marine conditions, 4) climate change, <strong>and</strong> 5) Strait ofGeorgia habitat conditions (including marine conditions <strong>and</strong> human activities <strong>and</strong> developmentin the surrounding area). There are cause-effect mechanisms by which each of these factorscould at least potentially affect the health <strong>and</strong> survival of immature <strong>and</strong> mature <strong>sockeye</strong> <strong>salmon</strong>in the North Pacific Ocean <strong>and</strong> adults returning to the <strong>Fraser</strong> <strong>River</strong>, as described below. In71
general, the potential mechanisms in this stage are similar to those described for Stage 3 (Section4.4) above.The high risk pathogens described earlier are known or suspected to potentially affect bothjuveniles <strong>and</strong> adults. However, although Parvicapsula minibicornis has been documented to behighly prevalent in <strong>sockeye</strong> <strong>salmon</strong> smolts, it is not found in adults, which suggests thatmortality due to this pathogen occurs within the early marine phase (Kent, 2011). Overall, verylittle is known about pathogens <strong>and</strong> disease in the marine environment (Kent, 2011).The potential mechanisms for predators to affect <strong>sockeye</strong> <strong>salmon</strong> populations are the same asabove (increased abundance, increased predation rate, or decreases in alternate prey) but theassemblage of potential predators is different. Christensen <strong>and</strong> Trites (2011) identify <strong>salmon</strong>shark <strong>and</strong> daggertooth as key predators of adult <strong>sockeye</strong> <strong>salmon</strong> that could plausibly have had anincreasing impact on <strong>sockeye</strong> <strong>salmon</strong> populations. Sockeye <strong>salmon</strong> is known to comprise a largeportion of the diet of <strong>salmon</strong> sharks. Blue sharks do not specialize on <strong>sockeye</strong> <strong>salmon</strong>, but do eat<strong>salmon</strong> in general <strong>and</strong> are much more abundant than <strong>salmon</strong> sharks. On the return journey backto the <strong>Fraser</strong>, there are many marine mammals that will prey on adult <strong>salmon</strong>. In some cases,<strong>sockeye</strong> <strong>salmon</strong> do not appear to be a substantial portion of any of their diets but, as illustratedby the spiny dogfish example in Section 4.4.2, this does not necessarily imply that such predatorsdo not have an impact on <strong>sockeye</strong> <strong>salmon</strong>. The effect of any predator on <strong>sockeye</strong> depends on thepredator’s abundance, the proportion of the predator’s diet which consists of <strong>sockeye</strong> <strong>salmon</strong>,<strong>and</strong> the resulting total biomass of <strong>sockeye</strong> consumed by the predator. Data collected by P.FOlesiuk (unpublished) on Steller sea lion scat samples was presented at both the PSC workshop<strong>and</strong> the Cohen Commission workshop. These <strong>data</strong> show that adult <strong>salmon</strong> is a commoncomponent of the diet of Steller sea lions, being found in approximately 12-30% of samples,varying by season (Peterman et al. 2010, A. Trites, workshop presentation). These samples werenot identified by species. Other research has suggested that <strong>salmon</strong> represent approximately 10%of the overall diet of Steller sea lions, <strong>and</strong> that <strong>sockeye</strong> <strong>salmon</strong> contribute to 9% of that portion(i.e. 0.9% of the total diet; A. Trites, workshop presentation). However, since Steller sea lionsconsume a large amount of biomass, a small proportion of that consumption could still plausiblyhave a meaningful effect on <strong>sockeye</strong> <strong>salmon</strong>. The technical report on predators did not includeestimates of total <strong>sockeye</strong> consumed by Steller sea lions. The bird predators described above arenot relevant to this life stage. Returning adult <strong>sockeye</strong> <strong>salmon</strong> are a very different prey then theirearlier post-smolt forms: larger, but fewer <strong>and</strong> faster.The biological <strong>and</strong> physical ocean conditions are fundamentally important for the health <strong>and</strong>survival of maturing <strong>sockeye</strong> <strong>salmon</strong> in the North Pacific Ocean. For example, oceantemperature has a critical influence on bioenergetics for <strong>sockeye</strong> <strong>salmon</strong> (McKinnell et al.,72
2011). The thermal limit hypothesis describes the role that ocean temperature has in limiting thegeographic range of <strong>sockeye</strong> <strong>salmon</strong> in the North Pacific, <strong>and</strong> suggests how this range may bereduced by warming ocean temperatures due to climate change. But McKinnell et al. (2011,Section 3.5) critique this theory because it does not consider the ability of <strong>sockeye</strong> <strong>salmon</strong> toseek cooler ocean temperatures simply by moving deeper. Inter-annual <strong>and</strong> inter-decadalvariation in ocean temperature <strong>and</strong> biological productivity are known to have substantial <strong>impacts</strong>on many marine species (McKinnell et al., 2011).Such variability in ocean conditions may be further exacerbated by climate change. Forexample, in recent decades the Pacific Decadal Oscillation has been exhibiting more frequentoscillations between phases (Hinch <strong>and</strong> Martins, 2011, Section 1.5). Hinch <strong>and</strong> Martins (2011)suggest that “it seems that interannual variations in climate conditions have contributed to theextreme variation in the abundance of returning adults that were observed in 2009 <strong>and</strong> 2010”.Habitat conditions in the Strait of Georgia, including marine conditions <strong>and</strong> human activities<strong>and</strong> development are obviously not factors during the open ocean phase, but the samemechanisms described in Section 4.4 are relevant for returning adults. Returning adults maypotentially be more resilient to some of the stressors encountered through the Strait of Georgia,especially since returning individuals are those that have survived the early marine phase <strong>and</strong>two winters in the open ocean.4.5.2 Exposure of <strong>Fraser</strong> <strong>River</strong> <strong>sockeye</strong> to stressorsThe ability to assess the exposure of <strong>Fraser</strong> <strong>River</strong> <strong>sockeye</strong> <strong>salmon</strong> to various potential stressorsin the open ocean <strong>and</strong> return journey to B.C. coastal waters is severely limited by lack ofknowledge of the distribution of <strong>sockeye</strong> <strong>salmon</strong> during this stage. McKinnell et al. (2011,Section 1.3) describe the lack of systematic monitoring <strong>and</strong> report that “there are virtually noobservations of <strong>Fraser</strong> <strong>River</strong> <strong>sockeye</strong> <strong>salmon</strong> during about 75% of their life at sea <strong>and</strong> the valueof coincidental samples taken during their emigration from the Strait of Georgia is debatable”.Aside from the following case where there is some information with which to evaluate exposure,one must simply assume that the <strong>Fraser</strong> <strong>River</strong> <strong>sockeye</strong> <strong>salmon</strong> have been exposed to themechanisms described above.The evidence presented by Christensen <strong>and</strong> Trites (2011) shows that for marine mammalpredators there has not been exposure to California sea lions because they are not present alongthe southern coast of BC during the summer. However, Steller sea lions have a large populationdistributed along with the northern <strong>and</strong> western coasts of Vancouver Isl<strong>and</strong> during the summer<strong>and</strong> the total population for BC <strong>and</strong> southeast Alaska may be upwards of 60,000 (Peterman et al.73
2010) <strong>and</strong> the Strait of Georgia has the highest harbor seal density anywhere in the world,implying exposure to both of these potential predators.The <strong>data</strong> on <strong>Fraser</strong> <strong>River</strong> <strong>sockeye</strong> <strong>salmon</strong> recruits, by stock <strong>and</strong> by age-type (i.e. differentiatingamong fish that enter the ocean or return from the ocean earlier or later than the dominantbehavior pattern), suggest that since the mid-1970s or early 1980s, the variability in theproportion of <strong>sockeye</strong> <strong>salmon</strong> returning at age-5 (rather than the dominant age-4) has beenincreasing. Figure 4.5-1 shows the proportion of adults returning in year 5 for the Early Stuartstock, as one example of this pattern. This particular example demonstrates several generalpatterns: 1) after 1980, the proportion of the stock returning in year 5 is never zero; 2) theaverage proportion of <strong>sockeye</strong> spending an additional year in the ocean before returning tospawn appears to be increasing over time, especially after approximately 1980; 3) the year-toyearvariability also appears to be increasing after approximately 1980; <strong>and</strong> 4) there areoccasional years where the proportion of Year-5 <strong>sockeye</strong> is several times greater than average.Rigorous statistical analyses of this potential phenomenon have not been conducted in thepresent project, but preliminary investigations have found that to varying degrees these types ofpatterns also appear to occur within many other <strong>Fraser</strong> <strong>River</strong> <strong>sockeye</strong> <strong>salmon</strong> stocks. Thiswarrants further analysis, because if these patterns are shown to be consistent across stocks, itwould present evidence suggesting that <strong>Fraser</strong> <strong>River</strong> <strong>sockeye</strong> <strong>salmon</strong> have been increasing theduration of their exposure to potential stressors encountered in the open ocean.Figure 4.5-1. The proportion of Early Stuart <strong>sockeye</strong> returning as 5-year old adults.74
Historically, the majority of returning adults migrated through the Strait of Juan de Fuca on thereturn journey to the <strong>Fraser</strong> <strong>River</strong>, whereas a smaller portion would return via the “northerndiversion” through Johnstone Strait. Returning via the Strait of Juan de Fuca potentially resultsin reducing the duration of exposure to potential stressors within the Strait of Georgia <strong>and</strong>eliminating exposure to potential stressors within Queen Charlotte Strait <strong>and</strong> Johnstone Strait onthe return journey. However, the balance of these alternate behaviours also appears to havechanged substantially over the past few decades. Figure 4.5-2 demonstrates that the proportion of<strong>sockeye</strong> <strong>salmon</strong> returning via the “northern diversion” has increased markedly over time, fromapproximately 10-20% in the 1950s <strong>and</strong> 1960s, to upwards of 80% in many of the years since thelate 1970s. The obvious increase in the variability evident in Figure 4.5-2 suggests that someunderlying driver changed in the late 1970s. The reason that <strong>sockeye</strong> <strong>salmon</strong> might “decide” totake one route versus the other <strong>and</strong> the point at which the decision is made both remainunknown, but it appears that greater use of the northern diversion may be associated with warmercoastal ocean temperatures (McKinnell et al., 2011, Section 4.6).Figure 4.5-2. Time series of the percentage of <strong>Fraser</strong> <strong>River</strong> <strong>sockeye</strong> <strong>salmon</strong> that migrate via the northern diversion(Johstone Strait). Source: Pacific Salmon Commission unpublished <strong>data</strong>.Whereas the Cohen Commission scientific projects are looking at changes in <strong>sockeye</strong>productivity <strong>and</strong> returns as the primary response variable, changes in both ocean residency <strong>and</strong>migration route are other potential responses that may be driven by similar factors <strong>and</strong>conditions. Underst<strong>and</strong>ing how these other response patterns have been changing over time, <strong>and</strong>75
the mechanisms responsible, may help to clarify some of the underlying mechanismscontributing to changes in the <strong>Fraser</strong> <strong>River</strong> <strong>sockeye</strong> productivity.4.5.3 Correlation/consistency with patterns in <strong>Fraser</strong> <strong>River</strong> <strong>sockeye</strong>productivityVirtually no <strong>data</strong> exists to assess changes in the abundance, prevalence, or spatial distribution ofimportant pathogens <strong>and</strong> diseases over time (Kent, 2011).Christensen <strong>and</strong> Trites (2011) did not test for any statistical relationships between predatorabundance <strong>and</strong> the observed patterns in <strong>sockeye</strong> <strong>salmon</strong> abundance or productivity. The concernsexpressed in Section 4.4.3 regarding using predator abundance as a proxy for predator impactapply equally in this stage, as does the issue regarding the difficulty in accessing the potentialimpact that a relatively abundant predator might have on a relatively rare prey. Christensen <strong>and</strong>Trites (2011) report <strong>data</strong> that show that blue shark abundance has been increasing over recentdecades. The abundance of <strong>salmon</strong> sharks <strong>and</strong> daggertooth, which are both potentially muchmore important predators, are thought to have been increasing over recent decades, possibly in asimilar pattern to blue sharks, although there are no <strong>data</strong> on their abundance (V. Christensen,pers. comm.). Marine mammals have increased substantially over the past several decades <strong>and</strong>many species have now returned to historic highs; however, the effect of these large increases on<strong>sockeye</strong> <strong>salmon</strong> are uncertain <strong>and</strong> will vary among species depending on their actualconsumption of <strong>sockeye</strong> <strong>salmon</strong>.. Similar to the previous stage, there is an overall shortfall of<strong>data</strong> on most fish <strong>and</strong> bird predators, with the exception of a few commercially important species(Christensen <strong>and</strong> Trites, 2011). However, there have been substantial declines in populations ofwalleye pollock, Pacific cod, Pacific jack mackerel, Pacific mackerel, <strong>and</strong> Pacific hake, thepredators of which might consider <strong>sockeye</strong> <strong>salmon</strong> as an alternate prey if their preferable preyare becoming less abundant (Christensen <strong>and</strong> Trites, 2011).Ocean conditions are subject to high frequency variability superimposed upon lower frequencypatterns <strong>and</strong> thus “oceanographic variability is variable” (S. McKinnell, workshop presentation).This variability means that although the spatial scale of <strong>sockeye</strong> migrations corresponds with anoceanographic spatial scale, it may be difficult to find cases where there is a clear correlationbetween <strong>sockeye</strong> <strong>salmon</strong> patterns <strong>and</strong> oceanographic conditions (S. McKinnell, workshoppresentation). However, the return timing of <strong>Fraser</strong> <strong>River</strong> <strong>sockeye</strong> <strong>salmon</strong> stocks has been shownto be associated with large-scale climate patterns in the North Pacific Ocean (McKinnell et al.,2011). In 1991/1992, many oceanographic patterns were observed to change in synchrony,marking the onset of what McKinnell et al. (2011) describe as a persistent oceanographic change,including increases in spring <strong>and</strong> summer sea surface temperature <strong>and</strong> increases in sea surface76
salinity. There is much evidence that very warm years tend to negatively affect certaincharacteristics of <strong>Fraser</strong> <strong>River</strong> <strong>sockeye</strong> <strong>salmon</strong> biology (McKinnell et al., 2001, Section 3.5).This broad scale shift in oceanographic conditions coincides with a “shift” in median <strong>Fraser</strong><strong>River</strong> <strong>sockeye</strong> <strong>salmon</strong> productivity that may have also occurred in 1992. McKinnell et al. (2011)propose that the underlying pattern of a marked shift in productivity occurring in 1992 provides abetter fit to the observed productivity <strong>data</strong> than does the idea of a gradual decline over time <strong>and</strong>that there are other comparable <strong>sockeye</strong> stocks on the west coast that exhibited similar declinesbeginning in 1992, though many of those stocks subsequently demonstrated recovery with the1998/99 la Niña. In 2007, the Gulf of Alaska was generally cool, which is not consistent with thepoor returns observed in 2009. In terms of biological ocean conditions, McKinnell et al. (2011)state that for the open ocean, “there is no trend in average nutrient concentrations in the southernGulf of Alaska (Station Papa) since the 1950s, no trend in average chlorophyll a since 1998, <strong>and</strong>no trend in average zooplankton biomass.Hinch <strong>and</strong> Martins (2011) report that it is possible that the survival of immature <strong>sockeye</strong> <strong>salmon</strong>has decreased in association with climate change. Although there are no lab <strong>data</strong> <strong>and</strong> little field<strong>data</strong> on the response of adult <strong>sockeye</strong> to climate change in the open ocean, it does appear that<strong>Fraser</strong> <strong>River</strong> <strong>sockeye</strong> <strong>salmon</strong> survival is negatively correlated to the sea surface temperature oftheir last few months at sea (Hinch <strong>and</strong> Martins, 2011, Section 1.4). They further report that seasurface temperatures in the Strait of Georgia <strong>and</strong> the Gulf of Alaska have been consistentlyincreasing since the 1950s, while sea surface salinity <strong>and</strong> pH have been decreasing over the sameperiod (Hinch <strong>and</strong> Martins, 2011, Section 1.5). However, there is also evidence that much of theobserved warming trend can be attributed to the 1977-1997 positive phase of the PDO, ratherthan longer-term changes in climate (Hinch <strong>and</strong> Martins, 2011, Section 1.5).Returning <strong>Fraser</strong> <strong>River</strong> <strong>sockeye</strong> <strong>salmon</strong> will encounter the same potential stressors associatedwith human activity <strong>and</strong> development surrounding the Strait of Georgia as described in Section4.4, though the extent of this exposure will vary based on the rate of northern diversion, asdescribed above in Section 4.5.2.4.5.4 Correlation/consistency with patterns in non-<strong>Fraser</strong> <strong>River</strong> <strong>sockeye</strong>productivityOur comments here are identical to those for Stage 3 in section 4.5.3. Many other <strong>sockeye</strong> stocksshare the same habitat of the North Pacific Ocean with <strong>Fraser</strong> <strong>River</strong> <strong>sockeye</strong> <strong>salmon</strong>. Stocks thatshare both geographic <strong>and</strong> temporal overlap in the open ocean will likely encounter similarpathogens, predators <strong>and</strong> ocean conditions during this stage. The extent to which such stocksshow similar trends in productivity to those of the <strong>Fraser</strong> <strong>River</strong> (see Peterman <strong>and</strong> Dorner, 2011)77
would provide evidence supporting the importance of these stressors. In examining the patternsover 64 <strong>Fraser</strong> <strong>and</strong> non-<strong>Fraser</strong> <strong>sockeye</strong> populations from Washington to SE Alaska, Peterman<strong>and</strong> Dorner (2011; pg. 3) comment that: “The large spatial extent of similarities in productivitypatterns that we found across populations suggests that there might be a shared causalmechanism across that large area.”, though they acknowledge that further work is required to testthis hypothesis. The Cohen Commission technical reports do not however include analyses ofthe relationships between stressors at this stage <strong>and</strong> productivity indices for non-<strong>Fraser</strong> <strong>River</strong><strong>sockeye</strong>.4.5.5 Other evidenceThe relevant technical reports do not present any further evidence for factors contributing tolong-term declines in <strong>sockeye</strong> <strong>salmon</strong> that fit within the WOE evaluation framework utilized (i.e.thresholds, specificity, experiments, or removals).4.5.6 ConclusionsTable 4.5-1 shows a summary of the results of the weight of evidence evaluation of potentialcontributing factors encountered in this stage of growth in the North Pacific <strong>and</strong> return to the<strong>Fraser</strong> <strong>River</strong>. All of the potential factors in this life stage have plausible mechanisms. There arevirtually no <strong>data</strong> on exposure for pathogens making no conclusion possible. Identical to theprevious stage, the evidence presented suggests that <strong>sockeye</strong> <strong>salmon</strong> returning through the Straitof Georgia have little direct exposure to human activities <strong>and</strong> development, leading to aconclusion that it is unlikely that these factors have contributed to the decline of <strong>Fraser</strong> <strong>River</strong><strong>sockeye</strong> <strong>salmon</strong>. Sockeye <strong>salmon</strong> have been exposed to predators, marine conditions, <strong>and</strong>climate change during this open ocean phase. There has been no evidence presented on anycorrelations between key predators <strong>and</strong> <strong>sockeye</strong> <strong>salmon</strong> survival. However, over the same timeperiod that <strong>Fraser</strong> <strong>River</strong> <strong>sockeye</strong> <strong>salmon</strong> productivity has been decreasing, some importantpredators appear or are believed to be increasing in abundance, many potentially importantalternate prey have been decreasing, <strong>and</strong> marine mammals have been increasing substantially(although it is believed there is no relationship with the changes in <strong>sockeye</strong> <strong>salmon</strong> population).It therefore remains possible that predators have contributed to the observed declines in <strong>sockeye</strong><strong>salmon</strong>. Both technical reports addressing marine conditions, as well as the report addressingclimate change, show or reference research that shows correlations with <strong>sockeye</strong> <strong>salmon</strong>patterns, but present no further evidence on thresholds, specificity, experiments, or removals.Marine conditions <strong>and</strong> climate change remain possible contributors to the long-term decline of<strong>Fraser</strong> <strong>River</strong> <strong>sockeye</strong> <strong>salmon</strong>. Peterman <strong>and</strong> Dorner’s analyses of delayed density dependencewere applied to total productivity over the whole life cycle. Therefore, their conclusions thatdelayed density dependence is unlikely to have been a primary factor causing productivity78
declines (discussed in section 4.2 for life stage 1) reflects the net effect across all life historystages. Aquaculture was not considered in our report as the Commission Technical reports onthis potential stressor were not available, but will be considered in an addendum to this report.Table 4.5-1. Evaluation of the relative likelihood that potential stressors encountered by <strong>Fraser</strong> <strong>River</strong> <strong>sockeye</strong><strong>salmon</strong> during their growth <strong>and</strong> maturation in the ocean <strong>and</strong> return to the <strong>Fraser</strong> <strong>River</strong> (Stage 4) havecontributed to overall declines in productivity in recent decades. See section 4.7 for further statisticalanalyses relevant to the correlation/consistency column.Factor Mechanism Exposure Correlation/Consistency Other LikelihoodEvidencePathogens Yes No <strong>data</strong> - - NoconclusionpossiblePredators Yes Yes No <strong>data</strong> No <strong>data</strong> PossibleMarine Yes Yes Yes No <strong>data</strong> PossibleConditionsHuman Yes No - - UnlikelyActivities <strong>and</strong>Development(Sog)ClimateChangeYes Yes Yes No <strong>data</strong> Possible4.5.7 Key things we need to know betterThere are several elements about the life history of <strong>Fraser</strong> <strong>River</strong> <strong>sockeye</strong> <strong>salmon</strong> that are poorlyunderstood <strong>and</strong> inhibit a better underst<strong>and</strong>ing of the contribution of key stressors in this life stageto the overall decline in the population.1. estimates of the abundance of <strong>sockeye</strong> <strong>salmon</strong> reaching the Gulf of Alaska would helpdistinguish mortality occurring during the open ocean phase from mortality potentiallyoccurring earlier prior to leaving the continental shelf.2. information on the health <strong>and</strong> condition of <strong>sockeye</strong> <strong>salmon</strong> reaching the Gulf of Alaska,including size, contaminant <strong>and</strong> disease burdens, signs of temperature stress, wouldprovide valuable insight into whether the population is in such poor condition that itwould be vulnerable to even moderate stresses or in such good condition that it wouldrequire stressors with very substantial <strong>impacts</strong> to affect the population in this stage.3. better underst<strong>and</strong>ing of the spatial <strong>and</strong> temporal distribution of <strong>sockeye</strong> <strong>salmon</strong> in theGulf of Alaska would guide researchers on where to focus greater attention while lookingfor potential changes in ocean conditions, predators, etc.79
4. increased <strong>data</strong> on biological ocean conditions would increase the ability to determine thebroad scale <strong>impacts</strong> of variability in physical <strong>and</strong> ocean conditions <strong>and</strong> changing climateon the whole ecosystem.5. integrated ecosystem models <strong>and</strong> bioenergetic models could help increase underst<strong>and</strong>ingof relationships among predators, prey, <strong>and</strong> food resources, under both presumed currentconditions <strong>and</strong> hypothesized future conditions. In most cases there are not enough basic<strong>data</strong> available to accurately develop such models but often they can still offer insight intowhich uncertainties are most important to resolve.6. analyses of differences in the duration of ocean residency as for each of the <strong>Fraser</strong> <strong>River</strong><strong>sockeye</strong> <strong>salmon</strong> stocks with <strong>data</strong> on recruits by age type would show whether or not theproportions of stocks remaining an extra year in the ocean are changing, <strong>and</strong> how theseproportions may very among stocks <strong>and</strong> years.Items 1-5 represent critical gaps in our underst<strong>and</strong>ing of the life history of <strong>Fraser</strong> <strong>River</strong> <strong>sockeye</strong><strong>salmon</strong>, where neither the current situation nor historical conditions are well understood.Knowing the natural baseline for these elements would better inform our underst<strong>and</strong>ing of howpatterns have changed, but <strong>data</strong> collected now can only inform our underst<strong>and</strong>ing of the currentreality. Item 6 is different in that such analyses could be performed with the available <strong>data</strong>, buthave not been done within the Cohen Commission scientific projects.4.6 Stage 5: Migration back to SpawnStage 5 includes the period from the time returning adult <strong>sockeye</strong> enter the <strong>Fraser</strong> <strong>River</strong> to thetime that they spawn. En-route mortality is estimated as the difference between spawnerabundance estimates at Mission <strong>and</strong> on the spawning ground, after accounting for in-riverharvest upstream of Mission. Pre-spawn mortality is the rate of mortality of female spawners thatarrive on the spawning ground but fail to spawn, dying with most of their eggs retained in theirbody.4.6.1 Plausible mechanismsAs illustrated in the conceptual model (Figure 3.3.2-1), the stressors of potential concern include:climate change, which alters temperatures in the <strong>Fraser</strong> <strong>River</strong> increasing en-route mortality<strong>and</strong> <strong>impacts</strong> from pathogens; pre-spawn mortality; habitat conditions in both the Lower<strong>Fraser</strong> <strong>River</strong> <strong>and</strong> migratory corridors; <strong>and</strong> contaminants.Some of the above-described mechanisms have well-established interactive effects. Strong riverflows <strong>and</strong> warm temperatures dem<strong>and</strong> considerable energy expenditures for returning spawners.80
There is indisputable evidence of the links between increasing temperatures <strong>and</strong> en-routemortality, as summarized by Hinch <strong>and</strong> Martins (2011), who also note that infection <strong>and</strong> diseasehave been implicated as a major cause of migration mortality. English et al. (2011; ExecutiveSummary) note that en-route mortality is highest where high temperatures, river constrictions,<strong>and</strong> in-river fisheries co-occur. Kent (2011) concludes that if there has been a large increase inmortality caused by the high risk pathogens he identified, it is likely due to environmentalchanges that increase both their prevalence <strong>and</strong> <strong>sockeye</strong> susceptibility to such pathogens. Henotes that both of these shifts could be triggered by changes in water temperatures. Miller et al.(2011) found that returning spawners with a genomic signature indicative of stress, possibly dueto a virus, suffered higher rates of en-route mortality than adult fish without this signature.Nelitz et al. (2011) <strong>and</strong> Johannes et al. (2011) summarize the habitat stressors experiencedalong the migratory corridor, <strong>and</strong> outline the various mechanisms by which <strong>sockeye</strong> could beaffected. MacDonald et al. (2011) summarize the mechanisms by which contaminants couldpotentially affect returning spawners.4.6.2 Exposure of <strong>Fraser</strong> <strong>River</strong> <strong>sockeye</strong> to stressorsHinch <strong>and</strong> Martins (2011) summarize changes in the exposure of returning spawners to hightemperatures. Both temperatures <strong>and</strong> flows have changed over recent decades as a result ofclimate change, shifting away from the historical ranges <strong>and</strong> timing to which each stock hasevolved. Summer water temperatures in the <strong>Fraser</strong> <strong>River</strong> are 2.0 o C warmer compared to 60 yearsago, with roughly a 0.7 o C average increase during the last two decades (Figure 4.6-1). The rateof temperature change is increasing, as 13 of the last 20 summers have been the warmest onrecord. While there have been no significant changes in the total flow accumulated over thesummer season, more of this total flow is arriving earlier in the year. One measure is the date atwhich the first half of the <strong>cumulative</strong> summer flows occurs, which is happening a day earlier perdecade. Temperature tolerance varies among stocks, but in general survival begins to declineabove 15 o C, <strong>and</strong> rapidly worsens above 17-18 o C. Surprisingly, the Summer stocks thatexperience the highest temperatures (Figure 4.6-1) have shown the lowest levels of en-routemortality (Figure 4.5-2), presumably because they are better adapted to warmer temperatures.For several stocks of Late run <strong>sockeye</strong>, the effects of increasing temperatures have beenexacerbated by their tendency in many recent years (since 1995) to enter the river 3-6 weeksearlier than normal (dashed line at top of Figure 4.6-1; from Hinch <strong>and</strong> Martins 2011).Regardless of the hypothesized factors driving this behaviour (e.g., ocean conditions, advancedmaturation, physiological stress from pathogens, Late runs joining Summer run schools), itincreases the exposure of these Late run stocks to temperatures up to 5 o C higher than their81
thermal optimum, with longer exposures to freshwater diseases <strong>and</strong> parasites. Weaver Creek<strong>sockeye</strong>, one of the Late Run stocks, have lost of 50 to 100% of their total run due to en-routemortality, with higher mortality rates generally occurring in the years with earliest migration(Hinch <strong>and</strong> Martins 2011, Figure 2.2).Hinch <strong>and</strong> Martins (2011; section 1.7.1) cite climate model studies predicting that summer watertemperature in the <strong>Fraser</strong> <strong>River</strong> may warm by ~ 2.0 o C over the next 100 years, with a worseningof en-route mortality. Other research studies predict that the number of days per year exceeding<strong>salmon</strong>id critical temperatures may triple in the <strong>Fraser</strong> <strong>River</strong> over the next 100 years <strong>and</strong> morethan 90% of a stock may be forced to migrate under suboptimal temperatures for physiologicalperformance.The methods of estimating exposure to contaminants <strong>and</strong> habitat stressors along the migrationcorridor have already been described in section 4.3 for Stage 2 (smolts).Figure 4.6-1. Daily average temperature in the lower <strong>Fraser</strong> <strong>River</strong> averaged among years within two time periods(thick line: 1951-1990; thin line: 1991-2010) over the summer months. The period of entry <strong>and</strong> passage in the lower<strong>Fraser</strong> <strong>River</strong> for the four main run timing groups are indicated by solid lines above the figure. Since 1995, segmentsof all Late-runs have been entering the river much earlier than usual <strong>and</strong> this is indicated by the dashed line. Source:Hinch <strong>and</strong> Martins (2011; Fig. 2.8)82
Figure 4.6-2. Number of years that en route loss by adults exceeded 50% for the major <strong>Fraser</strong> <strong>River</strong> <strong>sockeye</strong> <strong>salmon</strong>stocks from 1996-2008. Stocks are ordered based on run timing into the <strong>Fraser</strong> <strong>River</strong> with run-timinggroups indicated. These <strong>data</strong> are based on the percent of potential spawners that had migrated past theMission hydroacoustic facility but were not detected on spawning grounds (i.e. they are based onescapement discrepancies). Source: Hinch <strong>and</strong> Martins (2011; Figure 2.7)4.6.3 Correlation/consistency with patterns in <strong>Fraser</strong> <strong>River</strong> <strong>sockeye</strong>productivityEn route mortality began to be reported in 1992 for Early Stuart, Early Summer <strong>and</strong> Summerruns, <strong>and</strong> in 1996 for Late-runs, <strong>and</strong> has increased substantially in recent years with particularlyserious <strong>impacts</strong> on the earlier <strong>and</strong> later stock groups (Figure 4.6-2). While the timing of en-routemortality coincides generally with the <strong>Fraser</strong> <strong>sockeye</strong> situation, the life cycle productivity <strong>and</strong>post-juvenile productivity indices already account for en-route mortality (i.e., recruits = spawners+ harvest + en-route mortality, as described in section 4.1). Declines in these productivity indicestherefore reflect factors other than en-route mortality. Therefore, there is no point in examiningcorrelations between en-route mortality <strong>and</strong> life cycle or post-juvenile productivity indiceswithin the same generation. The only possible effect on productivity indices worth exploring areinter-generational effects, discussed in the next paragraph.En-route mortality affects spawning abundance <strong>and</strong> harvests, both critical components of the<strong>Fraser</strong> <strong>sockeye</strong> fishery, which is the focus of the Cohen Commission. Fishery managers havedeliberately reduced harvest to compensate for en-route mortality <strong>and</strong> allow sufficient spawning.Without en-route mortality, harvests <strong>and</strong>/or spawning escapements could have been considerablyhigher during the last two decades (Hinch <strong>and</strong> Martins 2011; Section 2.10). Hinch <strong>and</strong> Martins(2011) note that migrating females perish at much higher rates than males during years withstressful conditions, which could substantially affect the numbers of effective female spawners83
<strong>and</strong> therefore the total recruits in the following generation (though perhaps not recruits/spawner).It is also possible that sub-lethal but stressful conditions could affect the quality of eggs <strong>and</strong> fryof the next generation, which could affect recruits/spawner, though results to date exploring thisquestion are limited <strong>and</strong> equivocal. Therefore, en-route mortality is clearly correlated with thedecline in the <strong>Fraser</strong> fishery, though not with indices of productivity.With respect to conditions in 2009 <strong>and</strong> 2010, Hinch <strong>and</strong> Martins (2011) note that rivertemperatures were well above average in 2009, exceeding 18 o C during the period from a fourweek period from late July to late August, <strong>and</strong> that at least 50-60% migrated in-river earlier thantheir historical timing. While <strong>data</strong> are not yet available on 2010 en-route mortality, rivertemperatures were also warm, though not as stressful as in 2009. The big difference between2009 <strong>and</strong> 2010 was in the number of returning spawners, which is assessed prior to en-routemortality.Hinch <strong>and</strong> Martins (2011) found no clear indication that pre-spawn mortality, at the run-timinglevel, has been increasing over the recent few decades in concordance with increasing en routemortality, with the possible exception of the past 25-year trend in Late-run pre-spawn mortalitythat shows a general increase but with high variability.There are not sufficient <strong>data</strong> to examine correlations between disease in returning spawners <strong>and</strong>various productivity indicators, or with en-route mortality. Hinch <strong>and</strong> Martins (2011) note thatmortality rates from a parasitic kidney disease increase in Weaver Creek Late-run <strong>sockeye</strong> asthey are exposed to higher temperatures (measured as accumulated degree-days), <strong>and</strong> thatbacterial infections causing gill damage are more common as temperatures increase. Thus, <strong>Fraser</strong>temperature <strong>data</strong> may be a useful proxy indicator of both en-route mortality <strong>and</strong> disease <strong>impacts</strong>.As for Stages 1 <strong>and</strong> 2, the available evidence does not support the hypothesis that exposure towater contaminants during the upstream spawning migration could be a contributing factor todeclines in <strong>Fraser</strong> <strong>sockeye</strong> productivity (MacDonald et al. 2011, Section 5.4). The post-juvenileindex of <strong>sockeye</strong> productivity declined with increasing values of a water quality index for theupstream migration period (i.e., the opposite pattern from what one would expect if contaminantswere a cause of the productivity declines). There was no relationship between the water qualityindex <strong>and</strong> the full life cycle index of productivity.When examining correlations between life cycle productivity <strong>and</strong> summer air temperatureacross adult migration, Nelitz et al. (2011; Section 4.2; Table 17) found that 16 stocks of 18<strong>Fraser</strong> stocks had negative correlations (i.e., years with warm summer air temperature along themigration corridor tended to be associated with years of lower total productivity), though only 184
correlation was statistically significant. As described in section 4.3 of this report (Stage 2), Nelitzet al. (2011) found that the length of the migratory route was also negatively correlated with lifecycle productivity, though the causes of this correlation are unknown. Since the life cycleproductivity index already accounts for en-route mortality, it should already account formortality generated by the duration <strong>and</strong> magnitude of exposures to high temperatures during theupstream migration. Thus while the patterns in these two negative correlations are consistentwith the hypothesis of temperature stress on returning spawners, the true causes of thesecorrelations are unclear, <strong>and</strong> may reflect other driving forces.4.6.4 Correlation/consistency with patterns in non-<strong>Fraser</strong> <strong>River</strong> <strong>sockeye</strong>productivityThe Cohen Commission contractors did not examine estimates of en-route mortality, habitatconditions, contaminants or disease for non-<strong>Fraser</strong> <strong>River</strong> <strong>sockeye</strong> stocks. There are goodestimates of the survival rates of returning Okanagan <strong>sockeye</strong> from radio-tracking studies (e.g.,Naughton et al. 2003).4.6.5 Other evidenceOther evidence includes literature demonstrating thresholds, an underst<strong>and</strong>ing of the specificform of response of <strong>sockeye</strong> to certain stressors (i.e., helping to accept or reject differentsuspected causes), experiments demonstrating cause-effect linkages, or positive <strong>sockeye</strong>responses following the removal of a stressor. Unlike for many of the stressors discussed forprevious life history stages, there is an impressive <strong>and</strong> convincing body of evidencedemonstrating the mechanistic links between increasing temperatures <strong>and</strong> en-route mortality,which is reviewed by Hinch <strong>and</strong> Martins (2011). This evidence includes laboratory <strong>and</strong> fieldexperiments showing temperature thresholds for different stocks (e.g., Figures 2.9 <strong>and</strong> 2.10 inHinch <strong>and</strong> Martins 2011), physiological investigations, <strong>and</strong> detailed studies of the survival,temperature exposure <strong>and</strong> health of radio-tracked spawners.4.6.6 ConclusionsTable 4.6-1 shows our conclusions regarding the effects of each stressor on life history stage 2(smolt migration from rearing habitats to the <strong>Fraser</strong> Estuary). Again, our conclusions relate to theoverall trends in <strong>sockeye</strong> productivity over the last two decades. In the correlation/consistencycolumn we distinguish between 3 different sets of measures of impact on the <strong>Fraser</strong> <strong>sockeye</strong>fishery: a) life cycle <strong>and</strong> post-juvenile productivity indices; b) harvest; <strong>and</strong> c) escapement.Peterman <strong>and</strong> Dorner’s analyses of delayed density dependence were applied to totalproductivity over the whole life cycle. Therefore, their conclusions that delayed density85
dependence is unlikely to have been a primary factor causing productivity declines (discussed insection 4.2 for life stage 1) reflects the net effect across all life history stages.While the timing of en-route mortality coincides generally with the <strong>Fraser</strong> <strong>sockeye</strong> situation,the <strong>Fraser</strong> <strong>sockeye</strong> productivity indices already account for en-route mortality (i.e., recruits =spawners + harvest + en-route mortality). The only possible effect on productivity indices worthexploring are inter-generational effects, for which the evidence is limited <strong>and</strong> equivocal. Wetherefore conclude that it is unlikely that en-route mortality or pre-spawn mortality are a primaryfactor in declining indices of <strong>Fraser</strong> <strong>sockeye</strong> productivity. However, en-route mortality hasdefinitely had a significant impact on the <strong>sockeye</strong> fishery <strong>and</strong> the numbers of adult fish reachingthe spawning ground, particularly for the Early <strong>and</strong> Late runs. Pre-spawn mortality, habitat,<strong>and</strong> contaminants are unlikely to be responsible for the overall pattern of declining <strong>sockeye</strong>productivity; no conclusion is possible regarding pathogens due to insufficient <strong>data</strong>. None of thefactors assessed for this life history stage are likely to have shown significant changes between2009 <strong>and</strong> 2010.Table 4.6-1. Evaluation of the relative likelihood that potential stressors encountered by <strong>Fraser</strong> <strong>River</strong> <strong>sockeye</strong><strong>salmon</strong> from the time returning adults enter the <strong>Fraser</strong> Estuary to when they spawn (Stage 5) havecontributed to the overall decline of the population in recent decades. Since various habitat measures areidentical to Table 4.3-1, they have been grouped together. Correlation/consistency column includes 3different sets of measures of impact on the <strong>Fraser</strong> <strong>sockeye</strong> fishery: a) life cycle <strong>and</strong> post-juvenileproductivity indices; b) harvest; <strong>and</strong> c) escapement.Factor Mechanism Exposure Correlation/Consistency Other LikelihoodEvidenceHabitat d Yes Yes No No UnlikelyContaminants Yes Yes No Yes UnlikelyPathogens Yes Few <strong>data</strong> Not done Yes NoconclusionpossibleClimatechange,Yes Yes Yes b,cn.a. aYesNoDefinitely b,cUnlikely atemperatures& en-routemortalityPre-spawnmortalityYes Yes No a, b,c (only increased inLate run)Mixed Unlikely b,cUnlikely aa life cycle <strong>and</strong> post-juvenile productivity indices already incorporate en-route mortality, so correlations are notapplicable. Available (limited) <strong>data</strong> does not show that en-route stress has intergenerational effects.bharvestc escapementdHabitat row includes evidence from both Technical Report 3, discussing all <strong>Fraser</strong> <strong>sockeye</strong> conservation units(Nelitz et al. 2011) <strong>and</strong> Technical Report 12 (Johannes et al. 2011) discussing the Lower <strong>Fraser</strong>. This rowsummarizes all of the rows reported in Table 4.3-1.86
4.6.7 Key things we need to know betterHinch <strong>and</strong> Martins (2011) recommend the following improvements in knowledge for this lifehistory stage:o improved estimates of spawning, both in-season <strong>and</strong> post-season;o continued tagging programs for direct <strong>and</strong> accurate estimates of survival;o en route mortality estimates for additional stocks;o research on the extent <strong>and</strong> consequences of gender differences in upstream survival;o <strong>impacts</strong> of fisheries capture <strong>and</strong> release/escape on en route <strong>and</strong> pre-spawn mortality;o <strong>cumulative</strong> <strong>impacts</strong>, carry-over <strong>and</strong> intergenerational effects;o climate change modelling to quantify the impact of future climate warming on <strong>Fraser</strong><strong>River</strong> <strong>sockeye</strong> <strong>salmon</strong> productivity <strong>and</strong> abundance;o how <strong>sockeye</strong> <strong>salmon</strong> might adapt to climate change; <strong>and</strong>o management strategies to maximize the potential for persistence of <strong>sockeye</strong> underincreasing stress from climate change.In addition, English et al. (2011) recommend the following activities for fisheries management,which pertain largely to this life history stage:o improving the documentation of harvest by all sectors;o working with First Nations <strong>and</strong> recreational fishers to minimize the impact of in-riverfisheries on released fish;o improved escapement goals (by stock <strong>and</strong> run-timing group) <strong>and</strong> in-season managementmodels; <strong>and</strong>o improved documentation of escapement monitoring4.7 Effects over Entire Life CycleThe previous five sections explore the relative importance of different potential contributors to<strong>sockeye</strong> mortality within each life stage, <strong>and</strong> also discuss potential interactions among thesefactors. In this section we build on the previous sections with a qualitative discussion of thepotential for <strong>cumulative</strong> effects over the entire life cycle, <strong>and</strong> summarize the results of ourquantitative analyses, which assess the relative importance of different potential contributorsover the entire life cycle.4.7.1 Qualitative assessment of the potential for <strong>cumulative</strong> effects overthe entire life cycleThe conceptual model (Figure 3.3-1) shows how different factors could combine to affect<strong>sockeye</strong> survival at each life history stage. The <strong>cumulative</strong> stress model (Figure 2.3-1) illustrates87
how effects at different life history stages can accumulate over the whole life cycle, increasingthe <strong>cumulative</strong> stress on an individual <strong>salmon</strong> to the point where it dies. The accumulation ofstress may be concentrated in one life history stage or distributed across multiple life historystages. The stress experienced within each life history stage may be insufficient to causemortality, but the <strong>cumulative</strong> effect of stressors in multiple life history stages can cause death.However, mortality events at an early life history stage can also result in a compensatoryreduction in competitive stress for those fish which survived, reducing their <strong>cumulative</strong> stress<strong>and</strong> increasing their chances of survival. These two sets of processes illustrated in Figure 3.3-1<strong>and</strong> 2.3-1 (i.e., <strong>cumulative</strong> <strong>impacts</strong> from many stressors within each life history stage, <strong>cumulative</strong>effects on each fish over its life) occur concurrently within each generation of <strong>sockeye</strong>.Table 4.7-1 summarizes the results of our analyses by life history stage. We found only twofactors (marine conditions <strong>and</strong> climate change) which were likely to have been a primary factorin the observed declines in <strong>Fraser</strong> <strong>sockeye</strong> productivity (recruits/spawner) over the last twodecades. While en route mortality has definitely had an impact on the <strong>sockeye</strong> fishery <strong>and</strong>numbers of fish reaching the spawning ground, it is unlikely to have affected total productivity,since en route mortality is already included in the calculation of total recruits (i.e., recruits =spawners + en-route mortality + harvest). The effects of predators during the marine phase of the<strong>salmon</strong> life cycle (stages 3 <strong>and</strong> 4 in Table 4.7-1) were judged to be possible primary contributorsto these declines. Due to lack of <strong>data</strong> it is not possible to draw conclusions about thecontributions of pathogens, which is a particularly important <strong>data</strong> gap that we discuss further inour recommendations (Section 5). Aquaculture was not considered in our report as theCommission Technical Reports on this potential stressor were not available, but will beconsidered in an addendum to this report. All other factors (i.e., forestry, mining, large hydro,small hydro, urbanization, agriculture, water use, contaminants, density dependent mortality,human activity <strong>and</strong> l<strong>and</strong> uses in the Lower <strong>Fraser</strong> <strong>and</strong> Strait of Georgia) were judged to beunlikely as primary causes of long term productivity declines, though they may still have beencontributory factors. That is, stressors which we consider unlikely to be primary causes ofproductivity declines, may combine with other factors to create sufficient <strong>cumulative</strong> stress tokill <strong>salmon</strong> (i.e., through additive or greater than additive (synergistic) interactions) in somestocks in some years.The coastal migration phase of the <strong>sockeye</strong>’s life history provides a good example of multiplestressors interacting to cause <strong>cumulative</strong> <strong>impacts</strong>. There is indirect evidence that while oceantemperatures were not high enough to directly kill <strong>sockeye</strong> smolts in the summer of 2007, thesewarmer temperatures may have decreased the quantity <strong>and</strong> quality of available food <strong>and</strong>increased other stressors (e.g., metabolic dem<strong>and</strong>s during inshore migration, vulnerability topredators, the level of pathogens <strong>and</strong> harmful algae); see McKinnell et al (2011) <strong>and</strong> Peterman et88
al (2010). The combined effect of all these factors may have caused significant smolt mortality in2007, while each of them independently would have been insufficient to kill smolts. Inlaboratory situations there is sufficient experimental control to explore the <strong>cumulative</strong> effects ofmultiple factors across the full range of possible stressor combinations. However in the oceanenvironment, multiple stressors will tend to covary together (like those described above which allincrease with warmer temperatures), so it is much more difficult to discern their relative <strong>impacts</strong>on survival.89
Table 4.7-1. Evaluation of the relative likelihood that potential stressors encountered by <strong>Fraser</strong> <strong>River</strong> <strong>sockeye</strong><strong>salmon</strong> during each life history stage have contributed to overall declines in productivity in recent decades,based on sections 4.2 to 4.6. n.a. = not applicable to a given life history stage. Note that aquaculture wasnot considered as the Commission Technical reports were not available, but will be considered in anaddendum to this report.Factor1. Incubation,Emergence <strong>and</strong>Freshwater RearingLife History Stage2. Smolt 3. CoastalOutmigration Migration &Migration toRearingAreas4. Growth inN. Pacific<strong>and</strong> Returnto <strong>Fraser</strong>5. Migrationback to spawnForestry a Unlikely Unlikely n.a. n.a. UnlikelyMining Unlikely Unlikely n.a. n.a. UnlikelyLarge hydro Unlikely Unlikely n.a. n.a. UnlikelySmall hydro Unlikely Unlikely n.a. n.a. UnlikelyUrbanization Unlikely Unlikely n.a. n.a. Unlikelyabove HopeAgriculture Unlikely Unlikely n.a. n.a. UnlikelyWater Use Unlikely Unlikely n.a. n.a. UnlikelyContaminants Unlikely Unlikely n.a. n.a. UnlikelyDensityDependentMortalityUnlikely Unlikely Unlikely b Unlikely b Unlikely bPathogens No conclusion possible No conclusion No conclusion No conclusion No conclusionpossible possible possible possiblePredators Unlikely Unlikely Possible Possible Unlikely bL. <strong>Fraser</strong> l<strong>and</strong> Unlikely Unlikely n.a. n.a. UnlikelyusesStrait ofGeorgia humanactivity & l<strong>and</strong>usesn.a. n.a Unlikely Unlikely n.a.ClimateChangePossible Possible Likely Possible Definitely cUnlikely dMarine n.a. n.a. Likely Possible n.a.ConditionsaForestry includes logging, Mountain Pine Beetle <strong>and</strong> log storage.bNot addressed directly for these life stages but conclusions from section 4.2 apply across the whole life cycle.cdefinitely affected harvest <strong>and</strong> escapementd life cycle <strong>and</strong> post-juvenile productivity indices already incorporate en-route mortality in definition of recruits, soen-route mortality cannot explain trends in recruits / spawner. Available (limited) <strong>data</strong> does not show that en-routestress has intergenerational effects.Cumulative effects may cause significant mortality in some years but not in others. For example,Miller et al. (2011) found that in 2006, returning <strong>sockeye</strong> <strong>salmon</strong> with a genomic signalindicative of poor physiological condition (<strong>and</strong> possibly related to a viral infection) were much90
more likely to suffer en-route <strong>and</strong> pre-spawning mortality mortality. The genomic signal detectedby Miller et al. was also present in smolts during both 2007 <strong>and</strong> 2008 (Miller, h<strong>and</strong>out providedto June 2010 PSC Workshop), yet those years of entry had very different marine survival rates(based on the very large difference in observed vs expected adult returns in 2009 vs. 2010). Asdiscussed by McKinnel et al. (2011) ocean conditions in Queen Charlotte Sound <strong>and</strong> the Gulf ofAlaska were much cooler in 2008 than in 2007. It may be that when ocean conditions are poor(as in 2007) disease contributes to mortality, but when ocean conditions are good (as in 2008) thefish survive despite carrying diseases.As noted by McKinnel et al (2011), biologists rarely observe death by natural causes of <strong>Fraser</strong><strong>River</strong> <strong>sockeye</strong> at sea. Therefore, unlike with autopsies of humans, we can generally only infer the<strong>cumulative</strong> causes of mortality through indirect evidence. Even with very detailed informationon the exposure of <strong>salmon</strong> to different stressors (e.g., Petrosky <strong>and</strong> Schaller 2010), it is difficultto draw strong conclusions on the relative contributions of each factor to observed patterns ofsurvival. Often there are multiple explanations that are generally consistent with the observed<strong>data</strong>.4.7.2 Quantitative analyses across the entire life cycleWe performed quantitative analyses across the entire life cycle from two different perspectives –by life history stage <strong>and</strong> by stressor category. An overview of our methodology is described inSection 3.3.6, a technical description of the methodology is presented in Appendix 3 (Section3.5.2), <strong>and</strong> the detailed results are reported in Appendix 4. In this section we provide anoverview of the results of our quantitative analyses <strong>and</strong> a broad discussion of the majorconclusions. First, we describe our analysis of the relative importance of different life stages inexplaining variation in <strong>sockeye</strong> productivity. Second, we describe our analysis of the relativeimportance of categories of potential stressors across all life stages, as organized by the CohenCommission Technical Reports.The Relative Importance of Different Life History StagesWe analyzed <strong>data</strong> across all projects <strong>and</strong> life stages that were available for brood years 1969-2001. This particular time period was the result of the trade-off between choosing a window ofanalysis short enough to include a wide selection of variables <strong>and</strong> long enough to generatemeaningful results with respect to the observed decline in the productivity of <strong>Fraser</strong> <strong>River</strong><strong>sockeye</strong> <strong>salmon</strong>. To assess the relative importance of each life history stage, multiple modelswere tested, each of which contained all of the available variables associated with a particularlife history stage (Table 4.7-2). The life history stages examined include: incubation <strong>and</strong>freshwater rearing, outmigration, coastal migration, ocean rearing, return to the <strong>Fraser</strong>, upstream91
migration, <strong>and</strong> spawning. Three additional models were tested within the model set: a “global”model, including all available variables for 1969-2001; an aggregate model of the freshwater lifestages preceding ocean-entry; <strong>and</strong>, an aggregate model of all three marine life stages. Thesemodels were then tested using the same <strong>data</strong> set to determine which models have the greatestamount of relative support (i.e., strongest ability to explain the observed variation in <strong>sockeye</strong>productivity across years <strong>and</strong> stocks).The results show that the aggregate marine model (M10) has the greatest relative level ofsupport. Model M10 includes many more variables than the next two models. The AICc criterionthat is used to assess the relative level of support for different models rewards models which do abetter job of explaining the variation in the response variable (in our case <strong>sockeye</strong> stockproductivity), but penalizes models for including more variables to explain this variation, sinceeach additional variable requires another model parameter to be estimated. A model with highexplanatory power from only a few variables would receive a strong AICc score (AICc scoresare like golf; lower is better). The fact that model M10 achieves a high relative level of supportdespite having so many variables indicates that the extra variables are informative for explainingvariation in <strong>sockeye</strong> productivity, relative to the other models included in Table 4.7-2.Model M10 represents an aggregate of several life stages with the marine phase. We are alsointerested in which marine life stages appear to be most important. The models of individual lifestages with the highest level of support are coastal migration (M4) <strong>and</strong> the return to the <strong>Fraser</strong>(M6). Although coastal migration ranks higher, the results show that there is roughly equalsupport for these two models, suggesting that both of these life stages are important in explainingthe variability in the productivity of <strong>Fraser</strong> <strong>River</strong> <strong>sockeye</strong> <strong>salmon</strong>. However, the analysis scoresalso indicate that both of these models have marginal support relative to the aggregate marinemodel (M10), suggesting that there is a definite benefit to using all of the marine variables toexplain variation in <strong>sockeye</strong> productivity. These results imply that factors within the marinephase are more important relative to the available freshwater factors in explaining the patternsobserved in <strong>Fraser</strong> <strong>River</strong> <strong>sockeye</strong> <strong>salmon</strong> over the 1969-2001 brood years.92
Table 4.7-2. Variables included in each model used to test the relative importance of different life-history stages over brood years 1969-2001.Variables in the<strong>data</strong> set are organized by life history stage. The M2 <strong>and</strong> M8 models are empty because there were no variables applicable to those life history stagesavailable for the period of 1969-2001; however, they are maintained here in order for consistency in naming models among different time frames. LFR= lower <strong>Fraser</strong> <strong>River</strong>. SoG = Strait of Georgia.VariablesModelsM1 M2 M3 M4 M5 M6 M7 M8 M9 M10Life stageStressor category(i.e. CohenCommissionTechnical Report)Variable DescriptionGlobalIncubation toLake RearingOutmigrationCoastalMigrationGrowth inNorth PacificReturn to the<strong>Fraser</strong>UpstreamMigrationSpawningAggregateFreshwaterAggregateMarineSmolt outmigration Contaminants Qualitative water quality index. Stock specific. X X XSmolt outmigrationFreshwater habitatconditionsSpring air temperature CU specific X X XSmolt outmigrationHabitat conditions inLFR & SoGDischarge, SoG, April total X X XSmolt outmigrationHabitat conditions inLFR & SoGDischarge SoG, May total X X XSmolt outmigrationHabitat conditions inLFR & SoGLower <strong>Fraser</strong> total dredge volume X X XSmolt outmigrationPredators/Double Crested Cormorant <strong>and</strong> Common Merganser: Quantile basedAlternative Prey aggregate estimateX X XCoastal migrationHabitat conditions inLFR & SoGSoG discharge , June-July average (<strong>Fraser</strong> <strong>River</strong>) X X XCoastal migrationHabitat conditions inLFR & SoGSoG discharge, May average (<strong>Fraser</strong> <strong>River</strong> X X XCoastal migrationHabitat conditions inLFR & SoGSea surface salinity. SoG, April-Aug average. X X XCoastal migrationHabitat conditions inLFR & SoGSea surface temperature. SoG, April-Aug average. X X XCoastal migration Marine conditions QCS discharge, June-Sept average (Wannock <strong>River</strong>) X X XCoastal migration Marine conditions Sea surface salinity. QCS, April-Aug average. X X XCoastal migration Marine conditions Summer wind regime. QCS. X X XCoastal migrationPredators/Alternative Prey5 marine bird species: Quantile based aggregate estimate X X XCoastal migrationPredators/Alternative PreyArrowtooth flounder biomass X X X93
VariablesModelsM1 M2 M3 M4 M5 M6 M7 M8 M9 M10Coastal migrationPredators/Alternative PreyCalifornia sea lion estimate X X XCoastal migrationPredators/Alternative PreyHarbour seal estimate X X XCoastal migrationPredators/Alternative PreySteller sea lion estimate X X XCoastal migrationPredators/Alternative prey quantile based aggregate estimate of 8Alternative Prey species/locations.X X XGrowth in NorthPacificMarine conditions North Pacific Index, Nov-Mar average X X XGrowth in North Predators/Alternative prey quantile based aggregate estimate of 8PacificAlternative Prey species/locations.X X XReturn to <strong>Fraser</strong>Habitat conditions inLFR & SoGSea surface salinity. SoG, May-Sept average. X X XReturn to <strong>Fraser</strong>Habitat conditions inLFR & SoGSea surface temperature. SoG, Sept average. X X XReturn to <strong>Fraser</strong> Marine conditions Sea surface salinity. QCS, May-Sept average. X X XReturn to <strong>Fraser</strong>Predators/Alternative PreyCalifornia sea lion estimate X X XReturn to <strong>Fraser</strong>Predators/Alternative PreyHarbour seal estimate X X XReturn to <strong>Fraser</strong>Predators/Alternative PreySteller sea lion estimate X X XReturn to <strong>Fraser</strong>Predators/Alternative PreyAlternative prey quantile based aggregate estimate of 8species/locations.X X XUpstream migration Climate change Lower <strong>Fraser</strong> water temperature for returning adults. X XUpstream migration Contaminants Qualitative water quality index. Stock specific. X XUpstream migration Freshwater Summer air temperature. CU specific. X XUpstream migrationPredators/Alternative PreyBald Eagle abundance. X X94
However, an important limitation is that the results only apply to the variables actually includedin the analysis. When comparing the relative performance of competing models it is important toconsider what factors have been included or excluded from a particular model. For example,within this model set, all of the freshwater life-stages had lower levels of support than all of themarine life-stages, <strong>and</strong> the aggregrate freshwater model (M9) had the least support of all. But theaggregate freshwater model is comprised only of the following variables: total <strong>Fraser</strong> <strong>River</strong>discharge for both April <strong>and</strong> May (separately), two freshwater bird predators, <strong>Fraser</strong> <strong>River</strong>dredging volume, spring air temperature at nursery lakes, <strong>and</strong> a water quality index foroutmigration. The strength of any conclusion that freshwater life stages are not as important asmarine life stages can only be as strong as our belief that the assemblage of variables describedabove is a reasonably accurate representation of the freshwater component of the life history of<strong>Fraser</strong> <strong>River</strong> <strong>sockeye</strong> <strong>salmon</strong>. The makeup of each model must be considered when interpretingthe results. The limitations on <strong>data</strong> availability were such that, within the Cohen Commissiontechnical reports, this is the best representation possible of the freshwater component over thistimeframe. Improvements to the <strong>data</strong> used for the freshwater component might yield differentresults from the regression analysis.The Relative Importance of Different Stressor CategoriesWe used the same <strong>data</strong> set as above (i.e. all available <strong>data</strong> across all projects <strong>and</strong> life stages forbrood years 1969-2001) to test a different set of models, each of which contained all theavailable variables associated with a particular stressor category (as organized by the CohenCommission Technical Reports): contaminants, freshwater habitat factors, marine conditions,predators/alternate prey, climate change, <strong>and</strong> habitat conditions in the lower <strong>Fraser</strong> <strong>River</strong> <strong>and</strong> theStrait of Georgia. We also tested an additional “global” model with all available variables for thistimeframe.95
Table 4.7-3. Variables included in each model used to test the relative importance of different stressor categories over the period of 1969-2001 (brood years). Asdescribed in the text, the first set of analyses performed did not include pink <strong>salmon</strong> (removed from M1, <strong>and</strong> no M8 tested). LFR = lower <strong>Fraser</strong> <strong>River</strong>.SoG = Strait of Georgia.VariablesModelsM1 M2 M3 M4 M5 M6 M7 M8Life stage Life stage Variable DescriptionGlobalContaminantsFreshwaterhabitatMarineconditionsPredators/alternate preyClimate changeLFR & SoGhabitatPink <strong>salmon</strong>Contaminants Smolt outmigration Qualitative water quality index. Stock specific. X XContaminants Upstream migration Qualitative water quality index. Stock specific. X XFreshwater habitatconditionsSmolt outmigration Spring air temperature CU specific X XFreshwater habitatX XUpstream migration Summer air temperature. CU specific.conditionsMarine conditions Coastal migration QCS discharge, June-Sept average (Wannock <strong>River</strong>) X XMarine conditions Coastal migration Sea surface salinity. QCS, April-Aug average. X XMarine conditions Coastal migration Summer wind regime. QCS. X XMarine conditionsGrowth in NorthPacificNorth Pacific Index, Nov-Mar average X XMarine conditions Return to <strong>Fraser</strong> Sea surface salinity. QCS, May-Sept average. X XPredators/Double Crested Cormorant <strong>and</strong> Common Merganser: Quantile basedSmolt outmigrationAlternative Preyaggregate estimateX XPredators/Alternative PreyCoastal migration 5 marine bird species: Quantile based aggregate estimate X XPredators/Alternative PreyCoastal migration Arrowtooth flounder biomass X XPredators/Alternative PreyCoastal migration California sea lion estimate X XPredators/Alternative PreyCoastal migration Harbour seal estimate X XPredators/Alternative PreyCoastal migration Stellar sea lion estimate X XPredators/Alternative prey quantile based aggregate estimate of 8Coastal migrationAlternative Preyspecies/locations.X XPredators/ Growth in North Alternative prey quantile based aggregate estimate of 8Alternative Prey Pacificspecies/locations.X XPredators/X XReturn to <strong>Fraser</strong> California sea lion estimateAlternative PreyPredators/ Return to <strong>Fraser</strong> Harbour seal estimate X X96
Alternative PreyVariablesModelsM1 M2 M3 M4 M5 M6 M7 M8Predators/X XReturn to <strong>Fraser</strong> Stellar sea lion estimateAlternative PreyPredators/Alternative prey quantile based aggregate estimate of 8X XReturn to <strong>Fraser</strong>Alternative Preyspecies/locations.Predators/X XUpstream migration Bald Eagle abundance.Alternative PreyClimate change Upstream migration Lower <strong>Fraser</strong> water temperature for returning adults. X XHabitat conditionsin LFR & SoGSmolt outmigration Discharge, SoG, April total X XHabitat conditionsin LFR & SoGSmolt outmigration Discharge SoG, May total X XHabitat conditionsin LFR & SoGSmolt outmigration Lower <strong>Fraser</strong> total dredge volume X XHabitat conditionsin LFR & SoGCoastal migration SoG discharge , June-July average (<strong>Fraser</strong> <strong>River</strong>) X XHabitat conditionsin LFR & SoGCoastal migration SoG discharge, May average (<strong>Fraser</strong> <strong>River</strong> X XHabitat conditionsin LFR & SoGCoastal migration Sea surface salinity. SoG, April-Aug average. X XHabitat conditionsin LFR & SoGCoastal migration Sea surface temperature. SoG, April-Aug average. X XHabitat conditionsX XReturn to <strong>Fraser</strong> Sea surface salinity. SoG, May-Sept average.in LFR & SoGHabitat conditionsX XReturn to <strong>Fraser</strong> Sea surface temperature. SoG, Sept average.in LFR & SoGCompetition with Growth in NorthX 14 X 14Pink <strong>salmon</strong> abundance (NE Pacific)pinksPacificCompetition with Growth in NorthX 14 X 14Pink <strong>salmon</strong> abundance (Russia)pinksPacific14 Two sets of analyses were done with these models. Only the second set included pink <strong>salmon</strong>, as this potential stressor was not one of the factors coveredwithin the Cohen Commission Technical Reports.97
The results show that the global model (M1) had the greatest level of support. The fact that thismodel was ranked highest even with 18 more variables than the next model indicates that thevariables associated with only a single project are not sufficient to explain the pattern inproductivity. When comparing the relative performance of models representing individualstressor categories the predators/alternate prey model (M5) has the greatest level of supportfollowed closely by the Lower <strong>Fraser</strong>/Strait of Georgia project (M7). The predator/alternate preymodel reflects two possible mechanisms for affecting <strong>Fraser</strong> <strong>sockeye</strong>: changes in the abundanceof predators <strong>and</strong>/or changes in the availability of alternate prey.As discussed above, each stressor category is only represented by the available <strong>data</strong>. Many ofthose categories are not adequately represented. For example, “climate change” (M6) is onlyrepresented by a single variable – the delayed effect of lower <strong>Fraser</strong> <strong>River</strong> water temperature forreturning adults – that does not fully capture the potential <strong>impacts</strong> of climate change on <strong>sockeye</strong><strong>salmon</strong> over their entire life. A second example is the impact of pathogens <strong>and</strong> disease, whichcould potentially be an important factor but are simply not represented within any of thesemodels due to the lack of <strong>data</strong>. Therefore it is not possible to make any conclusions at all aboutthe relative importance of pathogens <strong>and</strong> disease compared to other stressors, which is a majorweakness.Overall, we do not believe that organizing the <strong>data</strong> by stressor category is as useful as organizingthe <strong>data</strong> by life history stage. The boundaries between categories are arbitrary <strong>and</strong> many of themlack sufficient <strong>data</strong>. In the analysis organized around stressor category, none of the models haddefinitively higher support than the global model, which included all available variables. Bycontrast, when the exact same <strong>data</strong> were organized by life history stage, several of the modelsachieved a higher level of support than the global model.The results of this analysis raise the important issue (mentioned in Section 3.2) about correlationversus causation. An example of this issue is found within the predators model. Christensen <strong>and</strong>Trites (2011) show that the abundance of both Steller sea lions <strong>and</strong> Harbour seals have increasedsubstantially over the past few decades. Because the timeframe of that increase corresponds withthe period over which <strong>Fraser</strong> <strong>River</strong> <strong>sockeye</strong> <strong>salmon</strong> have been declining in productivity, thesemeasures are likely to exhibit a high degree of correlation. While it is possible, this does notnecessarily mean that the increase in pinnipeds is driving down the <strong>sockeye</strong> <strong>salmon</strong> population.Alternative explanations are: some other factor is affecting both populations; or, pinnipedpopulations have been recovering from low abundance since the banning of hunting <strong>and</strong> culling,<strong>and</strong> <strong>sockeye</strong> productivity is being driven by something else. Further study is required todetermine which of these possibilities are most likely. Any factor with a strong temporal trendover the same period of time as the strong temporal downtrend in <strong>sockeye</strong> <strong>salmon</strong> productivity98
will likely have a high correlation (e.g., internet usage in the City of Vancouver has likelyincreased substantially <strong>and</strong> consistently since the early 1990s, corresponding directly to theperiod over which there have been substantial declines observed in the productivity of <strong>Fraser</strong><strong>River</strong> <strong>sockeye</strong> <strong>salmon</strong>).We performed a second analysis with one additional stressor category – the abundance of pink<strong>salmon</strong> both in the Northeast Pacific <strong>and</strong> from Russia. The analysis was extended to include pink<strong>salmon</strong> for two reasons: 1) the PSC Report found evidence for competitive effects of pink<strong>salmon</strong> on <strong>Fraser</strong> <strong>sockeye</strong> (section 4.9 in Peterman et al., 2010); <strong>and</strong> 2) the <strong>data</strong> were madeavailable to us. The PSC report examined three potential mechanisms by which pink <strong>salmon</strong>might affect <strong>Fraser</strong> <strong>sockeye</strong>, <strong>and</strong> rejected two of these due to contradictory evidence. Theremaining hypothesis is that abundant odd-year pink <strong>salmon</strong> from Alaska <strong>and</strong> Russia competewith adult <strong>Fraser</strong> <strong>sockeye</strong> on the high seas, which is consistent with the observation that <strong>Fraser</strong><strong>sockeye</strong> spawning in odd years show poorer growth & survival than even-year <strong>Fraser</strong> <strong>sockeye</strong>.The results from this set of analyses show that the pink <strong>salmon</strong> model (M8) <strong>and</strong> the global model(M1) appear as the strongest two models. The level of support for both of these models is similarbut because they are substantially different models, the interpretation is that they providelegitimately competing models to explain the patterns observed in <strong>Fraser</strong> <strong>River</strong> <strong>sockeye</strong> <strong>salmon</strong>.The predators/alternate prey model (M5) is third, but with a lower level of support. The fact thatthe pink <strong>salmon</strong> model does well is in some ways not surprising: there is a scientificallysupported hypothesis, with good <strong>data</strong> for the attribute that the hypothesis relates to, <strong>and</strong> theconnection is specific to a life history stage.4.8 Other Potential Factors Not Included in Cohen CommissionThe projects comprising the Cohen Commission’s Scientific <strong>and</strong> Technical Research Programrepresent an extensive but not exhaustive coverage of potential factors that may have contributedto the decline of <strong>Fraser</strong> <strong>River</strong> <strong>sockeye</strong> <strong>salmon</strong>. Table 4.8-1 lists some additional theories <strong>and</strong>potential factors that have not been explicitly included within the scope of the CohenCommission technical reports, or this report. These additional, potentially contributing factorsare presented here simply to acknowledge that other theories do exist, beyond the scope of theCohen Commission <strong>and</strong> beyond the scope of the present report. The analyses conducted withinthis project do not (<strong>and</strong> could not) exhaustively represent all possible factors.99
Table 4.8-1. Other factors potentially contributing to the decline of <strong>Fraser</strong> <strong>River</strong> <strong>sockeye</strong> <strong>salmon</strong> that were notconsidered within the spectrum of Cohen Commission technical reports. Some of these items are relatively focusedquestions whereas others are very broad. The list order does not represent any prioritization.FactorVolcanic AshCompetition withPink Salmon*Hatchery FishHatchery FishCompetitors <strong>and</strong>Food ResourcesQuestion of InterestDid the 2008 eruption of the Kasatochi volcano in Alaska contribute to the record <strong>sockeye</strong> returns in 2010 byproviding a natural fertilization of the ocean that resulted in greater growth <strong>and</strong> ultimately higher survival rates?Do odd-year pink <strong>salmon</strong> (the dominant cycle) compete with <strong>sockeye</strong> <strong>salmon</strong> for food resources during theirmigration overlap, resulting in diminished resources for <strong>sockeye</strong> <strong>salmon</strong> <strong>and</strong> therefore lower survival rates?Do large releases of hatchery fish result in increased predation of wild fish by creating high, localizedconcentrations of prey that attract increased numbers of predators to a place where wild <strong>and</strong> hatchery fish aremixed?Do large releases of hatchery fish affect ocean survival of wild fish through competition or predation?Have <strong>sockeye</strong> survival rates been reduced by increased competition for resources resulting from increasedabundance of competitors <strong>and</strong>/or reduced food resources?Early Outmigration Have <strong>sockeye</strong> smolts been leaving lakes earlier, driven by changing climate <strong>and</strong> climate associated factors(e.g., lake thaw), then arriving “too early” to an ocean environment with insufficient resources because thephenology of key ocean characteristics has not advanced by nearly as much ?Nursery LakeFood SupplyUnreportedFishing*Has the quantity <strong>and</strong> quality of planktonic food required to maintain historical <strong>sockeye</strong> productivity declined asa result of climate change?Could unreported catches of <strong>sockeye</strong> on the high seas <strong>and</strong> in fisheries outside of the Pacific Salmon Treatyfisheries have contributed to <strong>Fraser</strong> <strong>sockeye</strong> productivity declines?* Competition with pink <strong>salmon</strong> <strong>and</strong> unreported fishing were addressed in the PSC report (Peterman et al. 2010). Evidence in Peterman et al.(2010; Section 4.9) is consistent with the hypothesis that odd-year pink <strong>salmon</strong> from Alaska <strong>and</strong> Russia compete with returning adult <strong>Fraser</strong><strong>sockeye</strong> (Stage 4 in this report). Unreported catch is unlikely to have contributed to <strong>Fraser</strong> <strong>sockeye</strong> productivity declines (Peterman et al. 2010;Section 4.1).100
5.0 Conclusion5.1 Important Contributors to the Decline of <strong>Fraser</strong> <strong>River</strong> SockeyeWe present our conclusions for each life history stage, recognizing that there are interactionsboth within <strong>and</strong> between life history stages. These results do not consider aquaculture (report inprogress) or other factors not considered by the Cohen Commission.Stage 1: Incubation, Emergence <strong>and</strong> Freshwater RearingWith the exception of climate change, which we consider to be a possible factor, <strong>and</strong> pathogens(for which no conclusion is possible due to <strong>data</strong> gaps), it is unlikely that the other factorsconsidered for this stage, taken <strong>cumulative</strong>ly, were the primary drivers behind long term declinesin <strong>sockeye</strong> productivity across the <strong>Fraser</strong> Basin. These factors included forestry, mining, largehydro, small hydro, urbanization, agriculture, water use, contaminants, density dependentmortality, predators, <strong>and</strong> effects of Lower <strong>Fraser</strong> l<strong>and</strong> use on spawning <strong>and</strong> rearing habitats.We feel reasonably confident in this conclusion because juvenile productivity (which integratesall stressors in this life history stage except over-wintering in nursery lakes) has not declinedover time in the eight of the nine <strong>Fraser</strong> <strong>sockeye</strong> stocks where it has been measured. We wouldbe even more confident if more stocks had smolt enumeration rather than fry estimates (onlyChilko <strong>and</strong> Cultus stocks have smolt estimates). Though not primary drivers of the <strong>Fraser</strong><strong>sockeye</strong> situation, each of these factors may still have had some effects on some <strong>Fraser</strong> stocks insome years (the <strong>data</strong> are insufficient to reject that possibility). We suspect, based on qualitativearguments alone, habitat <strong>and</strong> contaminant influences on Life Stage 1 were also not the primarydrivers responsible for productivity declines occurring to most non-<strong>Fraser</strong> stocks assessed byPeterman <strong>and</strong> Dorner (2011). However, given the absence of any exposure <strong>data</strong> <strong>and</strong> correlationanalyses for non-<strong>Fraser</strong> stocks, it is not possible to make conclusions on the relative likelihoodsof factors causing their declining productivities. None of the factors considered for Stage 1 arelikely to have been much worse in 2005 <strong>and</strong> 2006 for <strong>Fraser</strong> <strong>sockeye</strong> stocks, sufficient to havesignificantly decreased egg-to-smolt survival in the <strong>salmon</strong> that returned in 2009. Similarly, noneof these factors are likely to have been much better in 2006 <strong>and</strong> 2007, sufficient to havesubstantially improved egg-to-smolt survival in the <strong>salmon</strong> that returned in 2010.Stage 2: Smolt OutmigrationWe analyzed the same factors for Stage 2 as for Stage 1 <strong>and</strong> came to the same conclusions. Thereare however three key differences in our analyses for these two stages. First, regardless ofdifferences in their spawning <strong>and</strong> rearing habitats, all <strong>sockeye</strong> stocks pass through the highly101
developed Lower <strong>Fraser</strong> region. Second, migrating smolts are exposed to the above-describedstressors for a much shorter time than are eggs <strong>and</strong> fry, which reduces the likelihood of effects.Third, since smolt migration occurs subsequent to enumeration of fry <strong>and</strong> smolts in rearing lakes,we have no analyses relating survival rates during this life history stage to potential stressors.Thus our conclusions have a lower level of confidence than for Stage 1. While there are somesurvival estimates for acoustically tagged smolts, these <strong>data</strong> (which only cover a few stocks)were not analyzed by any of the Cohen Commission technical studies. None of the factorsconsidered for Stage 2 are likely to have been much worse in 2007 (affecting the 2009 returns),or much better in 2008 (affecting the 2010 returns).Stage 3: Coastal Migration <strong>and</strong> Migration to Rearing AreasThere are almost no <strong>data</strong> on exposure for pathogens making no conclusion possible; this is amajor <strong>data</strong> gap. The evidence presented suggests that <strong>sockeye</strong> <strong>salmon</strong> in the Strait of Georgiahave little direct exposure to human activities <strong>and</strong> development, leading to a conclusion that itis unlikely that these factors have contributed to the decline of <strong>Fraser</strong> <strong>River</strong> <strong>sockeye</strong> <strong>salmon</strong>.Sockeye <strong>salmon</strong> have been exposed to predators, marine conditions, <strong>and</strong> climate change duringthis early marine phase. However, there has been no evidence presented on any correlationsbetween key predators <strong>and</strong> <strong>sockeye</strong> <strong>salmon</strong> survival. Some important predators appear to beincreasing in abundance, <strong>and</strong> some potentially important alternate prey appear to be decreasing,but many other known predators are decreasing or remaining stable. It therefore remains possiblethat predators have contributed to the observed declines in <strong>sockeye</strong> <strong>salmon</strong>. Based on plausiblemechanisms, exposure, consistency with observed <strong>sockeye</strong> productivity changes, <strong>and</strong> otherevidence, marine conditions <strong>and</strong> climate change are considered likely contributors to the longtermdecline of <strong>Fraser</strong> <strong>River</strong> <strong>sockeye</strong> <strong>salmon</strong>. It is also very likely that marine conditions duringthe coastal migration life stage contributed to the poor returns observed in 2009. Aquaculturewas not considered in our report as the Commission Technical reports on this potential stressorwere not available, but will be considered in an addendum to this report.Stage 4: Growth in North Pacific <strong>and</strong> Return to <strong>Fraser</strong>Our conclusions on this life history stage are similar to those for Stage 3, though we concludethat marine conditions <strong>and</strong> climate change remain possible contributors to the long-termdecline of <strong>Fraser</strong> <strong>River</strong> <strong>sockeye</strong> <strong>salmon</strong> (whereas in Stage 3, we considered them to be likelycontributors).102
Stage 5: Migration back to SpawnWhile the timing of en-route mortality coincides generally with the <strong>Fraser</strong> <strong>sockeye</strong> situation,the <strong>Fraser</strong> <strong>sockeye</strong> productivity indices already account for en-route mortality (i.e., recruits =spawners + harvest + en-route mortality). Therefore, there is no point in examining correlationsbetween en-route mortality <strong>and</strong> life cycle or post-juvenile productivity indices within the samegeneration. The only possible effects on productivity indices are inter-generational effects, forwhich the evidence is limited <strong>and</strong> equivocal. We therefore conclude that it is unlikely that enroutemortality (or pre-spawn mortality, which has only increased for Late Run <strong>sockeye</strong>) are aprimary factor in declining indices of <strong>Fraser</strong> <strong>sockeye</strong> productivity. However, en-route mortalityhas definitely had a significant impact on the <strong>sockeye</strong> fishery <strong>and</strong> the numbers of adult fishreaching the spawning ground, particularly for the Early <strong>and</strong> Late runs. Pre-spawn mortality,habitat changes, <strong>and</strong> contaminants are unlikely to be responsible for the overall pattern ofdeclining <strong>sockeye</strong> productivity. No conclusion is possible regarding pathogens due toinsufficient <strong>data</strong>. None of the factors assessed for this life history stage are likely to have shownsignificant changes between 2009 <strong>and</strong> 2010.The above conclusions are based on qualitative <strong>and</strong> quantitative analyses of existing information.There are two important caveats on these conclusions. First, there are major gaps in both ourfundamental underst<strong>and</strong>ing of how various factors interact to affect <strong>Fraser</strong> <strong>River</strong> <strong>sockeye</strong><strong>salmon</strong>, <strong>and</strong> in the <strong>data</strong> available to quantify those factors. Second, all Cohen Commissionresearchers have had a limited amount of time to analyze existing information; future <strong>data</strong>syntheses <strong>and</strong> analyses will likely provide deeper <strong>and</strong> different insights. Below, we summarizeour recommendations for improving the <strong>data</strong> <strong>and</strong> underst<strong>and</strong>ing of <strong>Fraser</strong> <strong>River</strong> <strong>sockeye</strong> <strong>salmon</strong>.5.2 Research <strong>and</strong> Monitoring PrioritiesOur summary of research <strong>and</strong> monitoring priorities includes findings from both the workshopinvolving all Cohen Commission researchers (held Nov. 30 – Dec. 1, 2010), <strong>and</strong> our <strong>synthesis</strong> ofthe more detailed recommendations contained in the Cohen Commission’s technical reports.5.2.1 Results from the workshopWorkshop participants were asked to examine section 5.3 of the Expert Panel’s Report to thePacific Salmon Commission (PSC report), Priorities for Monitoring <strong>and</strong> Research (Peterman etal. 2010), as a starting point for a plenary discussion. Since each of the twelve projects containsrecommendations specific to their topic areas, the purpose of this exercise was to broadly addresspriorities for monitoring <strong>and</strong> research beyond project boundaries.103
The participants agreed with the PSC Panel that a co-ordinated, multi-disciplinary programshould be implemented. There was consensus among the group that a focused oceanographic <strong>and</strong>fisheries research program targeting the Georgia Strait, Queen Charlotte Sound <strong>and</strong> extendingalong the continental shelf to the Alaska border would considerably advance our knowledge ofcurrent <strong>and</strong> future <strong>Fraser</strong> <strong>River</strong> <strong>sockeye</strong> populations. The program should focus on four coreareas: 1) <strong>data</strong> collection, 2) assimilation of these <strong>data</strong> into a single, central <strong>data</strong>base, 3) integratedanalyses, <strong>and</strong> 4) dissemination of information.There was widespread agreement with the PSC report that the 2009 <strong>and</strong> long-term declines in<strong>sockeye</strong> productivity were likely due to the effects of multiple stressors <strong>and</strong> factors. Futureefforts should focus not only on increasing our basic biological knowledge of <strong>sockeye</strong> <strong>salmon</strong>,but should also use information gained from the <strong>cumulative</strong> effects assessment to determinepriority research areas. Certain monitoring needs (research questions) can be answered with asingle (one-time, annual) study; however, others require long-term effort <strong>and</strong> monitoring. Astrong emphasis should be placed on studying the entire life cycle of <strong>sockeye</strong> <strong>salmon</strong> along withtheir potential stressors. It was noted that in some cases, additional sample collection would bestraightforward to implement by simply augmenting current <strong>data</strong> collection efforts. Datacollection <strong>and</strong> monitoring efforts could be extended to other <strong>salmon</strong> species as well, increasingthe potential for comparative research. Unlike the PSC report, participants felt that researchefforts should be exp<strong>and</strong>ed outside the Strait of Georgia as a priority area, as well as increasingefforts inside the Strait.One of the resounding issues throughout the workshop was researchers’ difficulty in obtaining<strong>and</strong> underst<strong>and</strong>ing <strong>data</strong> from existing <strong>data</strong>bases. Considerable effort should be spent building <strong>and</strong>maintaining an integrated <strong>data</strong>base, for both <strong>Fraser</strong> <strong>and</strong> non-<strong>Fraser</strong> <strong>sockeye</strong> stocks, with focusedresearch <strong>and</strong> monitoring goals in mind. The <strong>data</strong>base should include the historical <strong>sockeye</strong> <strong>data</strong>with clear meta<strong>data</strong> as well as <strong>data</strong> from current <strong>and</strong> future monitoring. For the <strong>data</strong>base to beuseful to scientists, it would need to be regularly updated <strong>and</strong> maintained. As mentioned in thePSC report, it would be critical to create a framework that would allow simultaneouscoordination of research across disciplines, recognize the potential for cost-effective jointsampling programs, <strong>and</strong> promote identification of synergistic effects <strong>and</strong> interactions.The decline of <strong>sockeye</strong> <strong>salmon</strong> in the <strong>Fraser</strong> <strong>River</strong> is an issue that has captivated the province ofBritish Columbia. Participants felt that the proposed increase in <strong>data</strong> collection <strong>and</strong> monitoringshould be followed by transparent dissemination of information to scientists <strong>and</strong> non-scientistson a regular basis. Given the potential funding of new initiatives <strong>and</strong> future findings, an annualreport on the State of the Salmon should be compiled <strong>and</strong> made publicly available.104
More specifically, the extended research program should be co-ordinated with a U.S. programcovering those areas of the Alaskan continental shelf containing high <strong>sockeye</strong> densities. Sincemuch of the research will augment existing research programs, funding of current programsshould be maintained. Further, recommendations for research should be directly compared tocurrent monitoring <strong>and</strong> research to determine expenditures <strong>and</strong> assess their relative merits. Asemphasized in the PSC Report, new <strong>data</strong> collection <strong>and</strong> analysis techniques exist that wouldfacilitate research efforts <strong>and</strong> increase efficiency in effort <strong>and</strong> cost.5.2.2 Synthesis of recommendations from Cohen Commission TechnicalReportsTable 5.2-1 is a <strong>synthesis</strong> of research <strong>and</strong> monitoring recommendations, based on the PSC report,discussions at the Cohen Commission workshop, the Commission’s Technical reports, <strong>and</strong> this<strong>cumulative</strong> effects assessment. We have organized these recommendations by life history stage,building on the structure used in the PSC report. However, each recommendation should be seenas a component of a fully integrated, multi-disciplinary research program, essential tounderst<strong>and</strong>ing the <strong>cumulative</strong> effects of multiple factors on the abundance of returning <strong>salmon</strong>.Specific research <strong>and</strong> monitoring recommendations for uncertainties related to aquaculture arenot included in detail in Table 5.2-1, as the Commission Technical reports on this potentialstressor were not available. Aquaculture will be considered in an addendum to this report.In addition to improving the information available for each life history stage, we stress theimportance of improving our ability to rapidly organize these <strong>data</strong> into a geographically <strong>and</strong>thematically linked form, <strong>and</strong> to conduct <strong>cumulative</strong> assessments which integrate effects over theentire <strong>sockeye</strong> life cycle through an appropriate mix of models <strong>and</strong> <strong>data</strong> analyses. We note thatthe <strong>data</strong>base developed for this project (described in Appendix 3), as well as the <strong>data</strong>basesdeveloped by individual researchers working on Commission Technical Reports, are preliminarybut important steps towards the goal of an integrated <strong>data</strong>base. However there are some seriouslimitations to the types of indicators available for various stressors, in terms of their specificityfor various stressors, as well as spatial <strong>and</strong> temporal coverage.One practical strategy towards the goal of an integrated <strong>data</strong>base would be to continue existingtopic-specific <strong>data</strong>bases (e.g., climate <strong>data</strong>, ocean conditions, stock information, contaminants,habitat <strong>data</strong>, pathogens), each maintained by the entities that have collected these <strong>data</strong>, but linkkey fields of each one to an integrated, interdisciplinary, geo-referenced <strong>data</strong>base. The integrated<strong>data</strong>base would periodically grab key variables from the topic-specific <strong>data</strong>bases, <strong>and</strong> store these<strong>data</strong> within a structure that catalyzed <strong>cumulative</strong>, rapid assessments across stressors <strong>and</strong> lifehistory stages. The advantage of this approach is that any updates made to topic-specific105
<strong>data</strong>bases (e.g., corrections to past estimates of smolt emigration) are automatically corrected inthe integrated <strong>data</strong>base. This avoids the problem of having a centralized <strong>data</strong>base with duplicatebut out-of-date or incorrect versions of historical <strong>data</strong>. This approach is gradually beingimplemented in the Trinity <strong>River</strong> Restoration Program, <strong>and</strong> has also been recommended for otherrivers in the Western U.S., including the Klamath, Sacramento <strong>and</strong> San Joaquin. 15 There areconsiderable technical <strong>and</strong> institutional challenges in setting up such an approach, but thebenefits include fewer errors in <strong>data</strong> assembly, ease of inter-disciplinary integration, <strong>and</strong> muchmore timely application of quantitative analyses.In addition to improving the <strong>data</strong> available for underst<strong>and</strong>ing both the stressors affecting <strong>sockeye</strong><strong>and</strong> their life-stage specific survival rates, there needs to be improved application of quantitativemethods to these <strong>data</strong>. The goals of these analyses should be to reduce uncertainties critical tofisheries management decisions, <strong>and</strong> to improve our retrospective underst<strong>and</strong>ing of the factorsthat have affected <strong>sockeye</strong> survival rates <strong>and</strong> productivity. The quantitative methods that weapplied in this report were the simplest approaches that could be feasibly completed within thetime available. A small working group could consider other methods that should be applied tothe <strong>data</strong>base that we’ve assembled (as well as future improvements to it), including: simulation<strong>and</strong> statistical approaches incorporating non-linear <strong>and</strong> non-additive interactions; functionalregression analyses for continuously measured variables like temperature, salinity <strong>and</strong> discharge;control chart approaches to examine changes in the variability of both response measures <strong>and</strong>environmental variables; <strong>and</strong> Bayesian approaches which assign probability distributions to eachfactor <strong>and</strong> their interactions. Potential methods are more fully described in Appendix 3. Weemphasize the importance of extending these kinds of analyses to all 64 stocks assessed byPeterman <strong>and</strong> Dorner (2011), <strong>and</strong> others not included in their <strong>data</strong> set (e.g., Okanagan <strong>sockeye</strong>).The greater contrasts in both stock productivity <strong>and</strong> stressors provided by larger <strong>data</strong> sets willyield stronger insights on driving factors.Due to ecosystem complexity <strong>and</strong> year to year variability in environment-recruitmentcorrelations (see section 3.1 <strong>and</strong> English et al. 2011), we think that it will be very difficult todevelop reliable pre-season models to accurately predict <strong>sockeye</strong> returns. A more reasonableexpectation is that quantitative analyses will be primarily retrospective, <strong>and</strong> can yield only verygeneral forecasts (e.g., whether marine survival rates over the next two years are likely to bebelow average, about average, or above average). As discussed in English et al. 2011, in-season<strong>data</strong> <strong>and</strong> models will likely continue to be the primary tools used to manage harvest.15 See http://trrp.net/science/IIMS.htm for more information.106
The twelve highest priority recommendations are shown in bold, but the entire set of 23recommendations form a cohesive whole. Since the early marine environment appears to be amajor potential source of declining productivity, it is particularly important improve informationon potential stressors affecting <strong>sockeye</strong> along their migratory path from the mouth of the <strong>Fraser</strong><strong>River</strong> through Queen Charlotte Sound, including food, predators, pathogens, <strong>and</strong> physical,chemical, <strong>and</strong> biological ocean conditions. Information on pathogens, including potentialrelationships to aquaculture, is a particularly important <strong>data</strong> gap.Further work is required to prioritize, sequence, define <strong>and</strong> integrated these recommendedactivities. Management decisions must still be made despite considerable uncertainty, <strong>and</strong> theinformation requirements for those management decisions should guide the elaboration,prioritization <strong>and</strong> integration of our recommendations. In other similar efforts we have found ithelpful to apply the Data Quality Objectives (DQO) process developed by the U.S.Environmental Protection Agency (EPA 2006). Adapting some of the guiding principles of theDQO process to the <strong>sockeye</strong> situation leads to the following questions, which we believe shouldbe applied to each of the recommendations in Table 5.2-1:1. How exactly will the information be used? Example uses include: increasing ourfundamental underst<strong>and</strong>ing of what is going on; directing strategic decisions onmanaging fisheries, hatcheries <strong>and</strong> other human activities (e.g., l<strong>and</strong> use, pollution,aquaculture); managing expectations on <strong>sockeye</strong> returns 1 to 2 years later; helping to helpmake short term in-season harvest management decisions.2. Given the intended uses of this information, what are the appropriate time <strong>and</strong> spacescales of interest, <strong>and</strong> the required/achievable levels of accuracy <strong>and</strong> precision? Forexample, given the myriad <strong>and</strong> highly variable factors affecting <strong>sockeye</strong>, what level ofaccuracy <strong>and</strong> precision is required/achievable with pre-season forecasts of run returns?How much effort should be allocated to pre-season forecasts versus in-season forecasts<strong>and</strong> management?3. What activities need to be done first? Are there some activities which are contingent uponoutcomes of the primary activities (i.e., if we learn X, then we need to do Y), butotherwise can be deferred? Are rigorous adaptive management approaches feasible forkey management uncertainties?4. Given the answers to questions 1-3, what are the most cost-effective research <strong>and</strong>monitoring designs of a fully integrated, multi-disciplinary program? What pilot studiesneed to be done to develop such designs?107
Table 5.2-1. Recommended research <strong>and</strong> monitoring priorities listed by <strong>sockeye</strong> life stage. This table builds onPeterman et al. (2010; Table E-3), as well as the Cohen Commission workshop <strong>and</strong> technical reports(including this one). The importance of recommended research <strong>and</strong> monitoring activities is rated by: (1)“Explanatory Importance", i.e., the relative likelihood that the set of hypothesized factors listed in thesecond column for a given life stage contributed to the <strong>sockeye</strong> declines (i.e., a <strong>synthesis</strong> across thestressors affecting that life stage), <strong>and</strong> (2) “Relevance to Management Actions”, i.e., the value that suchknowledge has for informing potential management actions. For example, a rating of High for“Explanatory Importance” <strong>and</strong> Low for “Relevance to Management Actions” indicates that research <strong>and</strong>monitoring of this life stage <strong>and</strong> the associated stressors is valuable in explaining the causes of decreasingproductivity, but has little relevance to informing choices about potential management actions. Boldfaceitems indicate the highest priority research <strong>and</strong> monitoring topics.Life stagefor <strong>Fraser</strong><strong>River</strong><strong>sockeye</strong><strong>salmon</strong>Parentalspawningsuccess <strong>and</strong>incubationJuvenilerearing,productioncapacity,<strong>and</strong> smoltproductionRelevantreportsectionExplanatoryImportanceRelevancetoManagementActionsComments <strong>and</strong> recommended research <strong>and</strong> monitoringactivities4.2 Low Low Although an unlikely explanation of past declines, spawningsuccess <strong>and</strong> incubation could relate to disease concerns<strong>and</strong>/or become higher priority in the future with climatechange. Recommended activities include:1. better estimates of both watershed conditions overtime using consistent methods, for a strategicallyselected cross-section of stocks with varyingconditions (e.g., migration distance, levels <strong>and</strong> typesof watershed disturbance), to better underst<strong>and</strong>current status, causative mechanisms <strong>and</strong> riskthresholds;2. better underst<strong>and</strong>ing of the status of smallerconservation units, consistent withimplementation of the Wild Salmon Policy; <strong>and</strong>3. better integration of existing <strong>and</strong> future <strong>data</strong> setsaffecting freshwater spawning <strong>and</strong> rearing habitats4.2 Medium High Quantitative assessment of smolt production is essential toestimate survival rates in pre- <strong>and</strong> post-juvenile life stages,<strong>and</strong> focus management responses. Only 2 of 19 <strong>Fraser</strong>stocks currently have smolt estimates (Cultus, Chilko).Recommended activities include:4. assessments of freshwater smolt production<strong>and</strong> health for a strategically selected crosssectionof stocks (as described above);5. studies of conditions <strong>and</strong> ecosystem dynamicswithin the rearing lakes for these stocks; <strong>and</strong>6. more intensive examinations if problems aredetected.Downstreammigration toestuary4.3 Medium High We do not know the survival rate of smolts during theirdownstream migration, or when they arrive in the <strong>Fraser</strong>estuary (vital to underst<strong>and</strong>ing potential mismatches betweenarrival times <strong>and</strong> marine plankton blooms). Smolt survivalcurrently cannot be estimated separately from the overalljuvenile-to-adult survival rate. Recommended activities108
Life stagefor <strong>Fraser</strong><strong>River</strong><strong>sockeye</strong><strong>salmon</strong>RelevantreportsectionExplanatoryImportanceRelevancetoManagementActionsComments <strong>and</strong> recommended research <strong>and</strong> monitoringactivitiesinclude:7. research to assess <strong>sockeye</strong> smolt survival rates<strong>and</strong> travel time between lakes <strong>and</strong> the <strong>Fraser</strong><strong>River</strong> estuary, for the strategically selectedsubset of stocks described above;8. estimates of the size <strong>and</strong> health of smolts arriving inthe <strong>Fraser</strong> estuary (e.g., pathogens, contaminantbody burdens, lipid reserves);Coastalmigration4.4 High High Both the Strait of Georgia (highlighted in the PSC report) <strong>and</strong>Queen Charlotte Sound (highlighted in section 4.4 of thisreport) are of critical importance to <strong>sockeye</strong>. Recommendedactivities (which should be fully integrated with current workby DFO <strong>and</strong> NOAA) include:9. A fully integrated oceanographic <strong>and</strong> ecologicalinvestigation of the Strait of Georgia (SoG), theStrait of Juan de Fuca (SJF), Johnstone Strait(JS) <strong>and</strong> Queen Charlotte Sound (QCS)(including oceanographic conditions,zooplankton, algae, marine mammal predators,alternate prey) to quantify/evaluate factorsaffecting <strong>Fraser</strong> <strong>sockeye</strong> survival, <strong>and</strong> improvelinked physical - ecosystem models;10. Studies of residency <strong>and</strong> migration paths of<strong>Fraser</strong> <strong>sockeye</strong> post-smolts through the SoG,SJF, JS <strong>and</strong> QCS;11. Sockeye pathogen <strong>and</strong> contaminant levels inSoG, SJF, JS <strong>and</strong> QCS under different marineconditions <strong>and</strong> exposures to aquacultureactivities;12. Estimates of the annual relative survival of<strong>Fraser</strong> <strong>sockeye</strong> over the period of residency inthe SoG, SJF, JS <strong>and</strong> QCS; <strong>and</strong>13. Studies of the migratory paths of Harrison Lake<strong>sockeye</strong>.Growth inthe NorthPacific <strong>and</strong>return to<strong>Fraser</strong>4.5 Medium Low Open-ocean research may improve underst<strong>and</strong>ing ofcompetition (e.g., pink-<strong>sockeye</strong>), growth, maturity, <strong>and</strong> overwinteringsurvival. Recommended activities include:14. Continued assessments of return abundances,age at return <strong>and</strong> harvest rates, all veryimportant to future management decisions <strong>and</strong>sustainability of <strong>Fraser</strong> <strong>sockeye</strong>.15. estimates of the abundance of <strong>sockeye</strong> <strong>salmon</strong>reaching the Gulf of Alaska (<strong>and</strong> their distribution,109
Life stagefor <strong>Fraser</strong><strong>River</strong><strong>sockeye</strong><strong>salmon</strong>RelevantreportsectionExplanatoryImportanceRelevancetoManagementActionsComments <strong>and</strong> recommended research <strong>and</strong> monitoringactivitieshealth, condition), as well as oceanographicconditions, would help distinguish mortality occurringduring the open ocean phase from mortality prior toleaving the continental shelf.16. Information on non-<strong>Fraser</strong> populations, useful innarrowing down the processes affecting <strong>Fraser</strong><strong>sockeye</strong>, managing those stocks, <strong>and</strong> detectingshifting <strong>sockeye</strong> distributions with climate change.Migrationback tospawn4.6 Low High Recommended activities include:17. continued evaluation of the accuracy of inseason<strong>and</strong> post-season <strong>sockeye</strong> assessments,<strong>and</strong> improvements in those assessments;18. accurate estimates of <strong>sockeye</strong> in-river mortality(en-route mortality, in-river harvest, pre-spawnmortality);19. management strategies to maximize thepotential for persistence of <strong>sockeye</strong> underincreasing stress from climate change;20. climate change modelling to quantify the impact offuture climate warming on <strong>Fraser</strong> <strong>River</strong> <strong>sockeye</strong><strong>salmon</strong> productivity <strong>and</strong> abundance;21. improved estimates of the spawning escapement for<strong>Fraser</strong> pink <strong>salmon</strong>;22. improved escapement goals for each stock <strong>and</strong> runtiminggroup; <strong>and</strong>23. research on gender differences in upstream survival,<strong>impacts</strong> of fisheries capture on en route <strong>and</strong> prespawnmortality, intergenerational effects.110
6.0 ReferencesAinsworth, L.M., Routledge, R., <strong>and</strong> Cao, J. 2011. Functional Data Analysis in EcosystemResearch: the Decline of Oweekeno Lake Sockeye Salmon <strong>and</strong> Wannock <strong>River</strong> Flow.Journal of Agricultural, Biological, <strong>and</strong> Ecological Statistics. Available online (DOI:10.1007/s13253-010-0049-z).Arnold, T.W. 2010. Uninformative Parameters <strong>and</strong> Model Selection Using Akaike’s InformationCriterion. Journal of Wildlife Management 74(6): 1175-1178.Bates, Douglas M. 2010. lme4: Mixed-effects modeling with R (Draft Book Chapters) Springer.http://lme4.r-forge.r-project.org/book/. Accessed on April 13, 2011.Berube, M. 2007. Cumulative effects assessments at Hydro-Québec: what have we learned?Impact Assessment <strong>and</strong> Project Appraisal. 25(2): 101-109.Burgner, R.L. 1991. The life history of <strong>sockeye</strong> <strong>salmon</strong> (Oncorhynchus nerka). Pages 3-117 inC. Groot <strong>and</strong> L. Margolis (eds), Pacific Salmon Life Histories. Univ. British ColumbiaPress.Cain, J. 2001. Planning Improvements in Natural Resources Management: Guidelines for UsingBayesian Networks to Support the Planning <strong>and</strong> Management of DevelopmentProgrammes in the Water Sector <strong>and</strong> Beyond. Centre for Ecology <strong>and</strong> Hydrology (CEH),Wallingford, UK, 124 pp.Burkhardt-Holm, P. <strong>and</strong> K. Scheurer. 2007. Application of the weight-of-evidence approach toassess the decline of brown trout (Salmo trutta) in Swiss <strong>River</strong>s. Aquatic Sciences. 69:51-70.Burnham, K.P. <strong>and</strong> D.R. Anderson. 1998. Model Selection <strong>and</strong> Inference: A PracticalInformation-Theoretic Approach. Spring-Verlag, New York.Christensen, V. <strong>and</strong> A.W. Trites. 2011. Predation on <strong>Fraser</strong> <strong>River</strong> <strong>sockeye</strong> <strong>salmon</strong>. CohenCommission Tech. Rep. 8. Vancouver, B.C. www.cohencommission.caCouncil on Environmental Quality, Executive Office of the President. 1997. ConsideringCumulative Effects Under the National Environmental Policy Act.Counterpoint Consulting Inc. 2011. Status of DFO management <strong>and</strong> science. Cohen CommissionTech. Rep. 11. In prep. Vancouver, B.C. www.cohencommission.caDevore, J.L. 1995. Probability <strong>and</strong> Statistics for Engineering <strong>and</strong> the Sciences. Fourth Edition.Duxbury Press, Brooks/Cole Publishing Company, Pacific Grove, CA, USA.Dixon, P. M., <strong>and</strong> J. H. K. Pechmann. 2005. A statistical test to show negligible trend. Ecology86:1751-1756.111
Draper, N.R. <strong>and</strong> H. Smith. 1998. Applied Regression Analysis. Third Edition. John Wiley &Sons, Inc., New York, USA.Duinker, P.N. <strong>and</strong> L. Greig. 2006. The impotence of <strong>cumulative</strong> effects assessment in Canada:ailments, <strong>and</strong> ideas for redeployment. Environmental Management 37:153–161.Duinker, P.N. <strong>and</strong> L.A. Greig. 2007. Scenario analysis in environmental impact assessment:improving explorations of the future. Environmental Impact Assessment Review 27:206-219.English, K.K., T.C. Edgell, R.C. Bocking, M. Link <strong>and</strong> S. Raborn. 2011. <strong>Fraser</strong> <strong>River</strong> <strong>sockeye</strong>fisheries <strong>and</strong> fisheries management <strong>and</strong> comparison with Bristol Bay <strong>sockeye</strong> fisheries.LGL Ltd. Cohen Commission Tech. Rep. 7. Vancouver, B.C. www.cohencommission.caForbes, V.E. <strong>and</strong> P. Calow. 2002. Applying Weight-of-Evidence in Retrospective EcologicalRisk Assessment When Quantitative Data are Limited. Human <strong>and</strong> Ecological RiskAssessment 8(7): 1625-1639.Gelman, Andrew, John B. Carlin, Hal S. Stern, <strong>and</strong> Donald B. Rubin. Bayesian <strong>data</strong> analysis,2nd edition. 2004. Chapman <strong>and</strong> Hall/CRC. Boca Raton, Florida.Golder Associates Ltd. 2008. Bruce Nuclear Power Plant Project Environmental Assessment,Methods, Project <strong>and</strong> Existing Environment Volume 1 September 2008. Submission toBruce Power by Golder Associates Ltd., 2390 Argentia Rd. Mississauga, ON. 832 pp.Available at:Greig, L. 2010. Geospatial Risk Characterization Workshop I: Tools for Ecosystem-basedApproaches to Support Integrated Decision Making – Workshop Summary. Prepared byESSA Technologies Ltd., Richmond Hill, ON for Fisheries <strong>and</strong> Oceans Canada, GulfFisheries Centre, Oceans <strong>and</strong> Science Branch, [Moncton, NB], 85 pp + Appendices.Grieg, L. <strong>and</strong> P. Duinker. 2008. Strengthening Science in Environmental Impact Assessment.Greig, L.A., P.N. Duinker, R.R. Everitt, <strong>and</strong> K. Pawley. 2003. Scoping for <strong>cumulative</strong> effectsassessment. Prepared for Indian <strong>and</strong> Northern Affairs Canada Environment Directorate,Whitehorse, Yukon Territory. ESSA Technologies Ltd., Richmond Hill, Ontario. 51 pp.Hilborn, Ray <strong>and</strong> Carl J. Walters. Quantitative Fisheries Stock Assessment. Choice, Dynamics,<strong>and</strong> Uncertainty. 1992. Kluwer Academic Publishers, Norwell, Massachusetts.Hinch, S.G. <strong>and</strong> E.G. Martins. 2011. A review of potential climate change effects on survival of<strong>Fraser</strong> <strong>River</strong> <strong>sockeye</strong> <strong>salmon</strong> <strong>and</strong> an analysis of interannual trends in en route loss <strong>and</strong>pre-spawn mortality. Cohen Commission Tech. Rep. 9. Vancouver, B.C.www.cohencommission.ca112
Johannes, M.R.S., R. Hoogendoorn, R.E. Scott, <strong>and</strong> L. Nikl. 2011. <strong>Fraser</strong> <strong>River</strong> <strong>sockeye</strong> <strong>salmon</strong>habitat analysis: Lower <strong>Fraser</strong> <strong>and</strong> Strait of Georgia. Golder Associates Ltd. CohenCommission Tech. Rep. 12. Vancouver, B.C. www.cohencommission.caJohnson, R.A. <strong>and</strong> D.W. Wichern. 2002. Applied Multivariate Statistical Analysis. Fifth Edition.Prentice Hall, Upper Saddle <strong>River</strong> New Jersey.Kent, M. 2011. Infectious diseases <strong>and</strong> potential <strong>impacts</strong> on survival of <strong>Fraser</strong> <strong>River</strong> <strong>sockeye</strong><strong>salmon</strong>. Cohen Commission Tech. Rep. 1. Vancouver, B.C. www.cohencommission.caKuikka, S., N. Holden, H. Gislasen, S. Hansson, H. Sparholt <strong>and</strong> O. Varis. 1999. Modelingenvironmentally driven uncertainties in Baltic cod (Gadus morhua) management byBayesian influence diagrams. Canadian Journal of Fisheries Management 56: 629-641.http://article.pubs.nrc.gc.ca/RPAS/RPViewDoc?_h<strong>and</strong>ler_=H<strong>and</strong>leInitialGet&calyLang=eng&journal=cjfas&volume=56&articleFile=f98-206.pdfLevy, D. 2006. BC Sockeye Salmon Population Declines: Probable Causes <strong>and</strong> RecommendedResponse Strategies. Prepared for Sierra Club of Canada – B.C. Chapter. NorthVancouver, B.C.MacDonald, D.D., J. Sinclair, M. Crawford, H. Prencipe <strong>and</strong> M. Meneghetti. 2011. Potentialeffects of contaminants on <strong>Fraser</strong> <strong>River</strong> <strong>sockeye</strong> <strong>salmon</strong>. MacDonald EnvironmentalSciences Ltd. Cohen Commission Tech. Rep. 2. Vancouver, B.C.www.cohencommission.caMantel, N. 1967. The detection of disease clustering <strong>and</strong> a generalized regression approach.Cancer Research.27:209-220.Marmorek, D.R., M. Porter , I.J. Parnell <strong>and</strong> C. Peters, eds. 2004. Comparative Survival StudyWorkshop, February 11–13, 2004; Bonneville Hot Springs Resort. Report compiled <strong>and</strong>edited by ESSA Technologies Ltd., Vancouver, B.C. for Fish Passage Center, Portl<strong>and</strong>,OR <strong>and</strong> the US Fish <strong>and</strong> Wildlife Service, Vancouver, WA. 137 pp. Available from:http://www.fpc.org/documents/CSS/CSSworkshop_reportfinal.pdfMcKinnell, S.M., E. Curchitser, C. Groot, M. Kaeriyama <strong>and</strong> K.W. Myers. 2011. The decline of<strong>Fraser</strong> <strong>River</strong> <strong>sockeye</strong> <strong>salmon</strong> Oncorhynchus nerka (Steller, 1743) in relation to marineecology. PICES Advisory Report. Cohen Commission Tech. Rep. 4. Vancouver, B.C.www.cohencommission.caMelnychuk, M.C., D.W. Welch, C.J. Walters. 2010. Spatio-Temporal Migration Patterns ofPacific Salmon Smolts in <strong>River</strong>s <strong>and</strong> Coastal Marine Waters. PloS ONE 5(9): e12916.doi:10.1371/journal.pone.0012916.Miller, K.M.. 2011. Genomic Signatures Predict Migration <strong>and</strong> Spawning Failure in WildCanadian Salmon. Science 331, 214. DOI: 10.1126/science.1196901Myers, R.A. 1998. When do environment-recruitment correlations work? Reviews in FishBiology <strong>and</strong> Fisheries 8: 285-305.113
Naughton, G.P., C.C. Caudill, M.L. Keefer,T.C. Bjornn, L.C. Stuehrenberg, <strong>and</strong> C.A. Peery.2005. Late-season mortality during migration of radio-tagged adult <strong>sockeye</strong> <strong>salmon</strong>(Oncorhynchus nerka) in the Columbia <strong>River</strong>. Canadian Journal of Fisheries <strong>and</strong> AquaticSciences 62: 30–47. doi: 10.1139/F04-147Nelitz, M., C. Murray, M. Porter, <strong>and</strong> D. Marmorek. 2006. Managing Pacific Salmon forEcosystem Values: Ecosystem Indicators <strong>and</strong> the Wild Salmon Policy. ESSATechnologies Ltd. Pacific Fisheries Resource Conservation Council. 101 pp.Nelitz,M., M. Porter, E. Parkinson,K. Wieckowski,D. Marmorek,K. Bryan,A. Hall<strong>and</strong> D.Abraham. 2011. Evaluating the status of <strong>Fraser</strong> <strong>River</strong> <strong>sockeye</strong> <strong>salmon</strong> <strong>and</strong> role offreshwater ecology in their decline. ESSA Technologies Ltd. Cohen Commission Tech.Rep. 3. Vancouver, B.C. www.cohencommission.caParsons, T.R., M. Takahashi, <strong>and</strong> B. Hargrave. 1977. Biological Oceanographic Processes, 2 ndEdition. Pergamon Press, Toronto.Pestal, G. <strong>and</strong> A. Cass. 2009. Using Qualitative Risk Evaluations to Prioritize ResourceAssessment Activities for <strong>Fraser</strong> <strong>River</strong> Sockeye. Canadian Science Advisory SecretariatResearch Document 2009/071. Available from: http://www.dfompo.gc.ca/CSAS/Csas/Publications/ResDocs-DocRech/2009/2009_071_e.pdfPeterman R.M., D. Marmorek, B. Beckman, M. Bradford, N. Mantua, B. Riddell, M. Scheuerell,M. Staley, K. Wieckowski, J. Winton, C. Wood. 2010. Synthesis of evidence from aworkshop on the decline of <strong>Fraser</strong> <strong>River</strong> Sockeye. June 15-17, 2010. A Report to thePacific Salmon Commission, Vancouver, B.C., 123 pp. + 35 pp. of appendices. Availablefrom www.psc.orgPeterman, R.M. <strong>and</strong> B. Dorner. 2011. <strong>Fraser</strong> <strong>River</strong> <strong>sockeye</strong> production dynamics. CohenCommission Tech. Rep. 10. Vancouver, B.C. www.cohencommission.caPetrosky, C. <strong>and</strong> H. Schaller. 2010. Influence of river conditions during seaward migration <strong>and</strong>ocean conditions on survival rates of Snake <strong>River</strong> Chinook <strong>salmon</strong> <strong>and</strong> steelhead.Ecology of Freshwater Fish 19 (4): 520-536.R Development Core Team (2010). R: A language <strong>and</strong> environment for statistical computing. RFoundation for Statistical Computing, Vienna, Austria. ISBN 3-900051-07-0, URLhttp://www.R-project.org/Ruggerone, G.T., R.M. Peterman, B. Dorner, <strong>and</strong> K.W. Myers. 2010. Magnitude <strong>and</strong> Trends inAbundance of Hatchery <strong>and</strong> Wild Pink Salmon, Chum Salmon, <strong>and</strong> Sockeye Salmon inthe North Pacific Ocean. Marine <strong>and</strong> Coastal Fisheries: Dynamics, Management, <strong>and</strong>Ecosystem Science 2:306–328, 2010114
Schaller et al. 2007. Comparative Survival Study (CSS) of PIT-Tagged Spring/Summer Chinook<strong>and</strong> Steelhead In the Columbia <strong>River</strong> Basin: Ten-year Retrospective Analyses Report.BPA Contract # 25247.http://www.fpc.org/documents/CSS/FINAL%20COMPLETE%2010%20YEAR%20CSS%20REPORT-8-31-07withfrontpage.pdfSchindler, D.E., R. Hilborn, B. Chasco, C.P. Boatright, T.P. Quinn, L.A. Rogers, <strong>and</strong> M.S.Webster. 2010. Population diversity <strong>and</strong> the portfolio effect in an exploited species.Nature 465: 609-612.Selbie, D.T., M.J. Bradford, M.J. Hague, J.M.B. Hume, E.A. MacIsaac, <strong>and</strong> D.A. Patterson.2010. Are freshwater habitat conditions in the <strong>Fraser</strong> <strong>River</strong> watershed an importantcontributor to the <strong>Fraser</strong> <strong>sockeye</strong> <strong>salmon</strong> situation? In: Appendix C of Peterman et al.(2010) Synthesis of evidence from a workshop on the decline of <strong>Fraser</strong> <strong>River</strong> Sockeye.June 15-17, 2010Sonntag, N.C., R.R. Everitt, L. Rattie, D.L. Colnett, C.P. Wolf, J. Truett, A. Dorcey, <strong>and</strong> C.S.Holling. 1987. Cumulative effects assessment: A context for further research <strong>and</strong>development. Prepared for Canadian Environmental Assessment Research Council(CEARC), Hull, Quebec, 91 pp.Thompson, B. 2003. Score Reliability: Contemporary Thinking on reliability Issues. SagePublications, Thous<strong>and</strong> Oaks, California.Toms, J.D. <strong>and</strong> M.L. Lesperance. 2003. Piecewise Regression: A tool for identifying ecologicalthresholds. Ecology 84:2034-2041.Walters, C.J. <strong>and</strong> J.S. Collie. 1988. Is Research on Environmental Factors Useful to FisheriesManagement? Canadian Journal of Fisheries <strong>and</strong> Aquatic Sciences 45: 1848-1854.Walters, C.J. 1989. Value of short-term forecasts of recruitment variation for harvestmanagement. Canadian Journal of Fisheries <strong>and</strong> Aquatic Sciences 46: 1969-1976.Weed, D.L. 2005. Weight of Evidence: A Review of Concepts <strong>and</strong> Methods. Risk Analysis25(6): 1545-1557.U.S. Environmental Protection Agency (EPA). 2006. Guidance on Systematic Planning Usingthe Data Quality Objectives Process. EPA QA/G-4. http://www.epa.gov/quality/qsdocs/g4-final.pdf115
Appendix 1. Statement of WorkCohen Commission of Inquiry into the Decline of Sockeye Salmonin the <strong>Fraser</strong> <strong>River</strong>“<strong>Fraser</strong> <strong>River</strong> Sockeye Salmon: Data Synthesis <strong>and</strong> Cumulative Impacts”SW1 Background1.1 The Commission of Inquiry into the Decline of Sockeye Salmon in the <strong>Fraser</strong><strong>River</strong> (www.cohencommission.ca) was established to investigate <strong>and</strong> report onthe reasons for the decline <strong>and</strong> the long term prospects for <strong>Fraser</strong> <strong>River</strong> <strong>sockeye</strong><strong>salmon</strong> stocks <strong>and</strong> to determine whether changes need to be made to fisheriesmanagement policies, practices <strong>and</strong> procedures.1.2 The Commission has engaged other Contractors to prepare technical reportscovering scientific topics related to the Commission’s m<strong>and</strong>ate. A <strong>synthesis</strong> ofthis information is required to address <strong>cumulative</strong> <strong>impacts</strong> <strong>and</strong> to evaluatepossible causes for the decline of <strong>Fraser</strong> <strong>sockeye</strong> <strong>salmon</strong>.SW2 Objective2.1 To provide <strong>data</strong> <strong>synthesis</strong> <strong>and</strong> integration services to the Cohen Commission <strong>and</strong>to lead the preparation of <strong>cumulative</strong> impact analysis involving all of the ScienceContractors.SW3 Scope of Work3.1 Following the submission by Contractors of Progress Reports on November 1,2010, the Contractor will analyze <strong>and</strong> organize information on explanatoryfactors, to assess their correlative strength with patterns of change in <strong>sockeye</strong>stock productivity during different life history stages. This will involve thepreparation of a computer model to track the relative influence of differentvariables, <strong>and</strong> their interactions, that can affect <strong>Fraser</strong> <strong>sockeye</strong> <strong>salmon</strong>. Thismaterial will be developed <strong>and</strong> returned to the Contractors by December 15,2010. The Contractors’ Final Reports, which are due January 31, 2010, will be117
utilized to clarify the full range of factors, <strong>and</strong> their interactions, that impact <strong>Fraser</strong><strong>sockeye</strong> 16 .SW4 Deliverables4.1 The Contractor will organize a Project Inception meeting to be held within 2weeks of the contract date in the Commission office.4.2 The main deliverables of the contract include the facilitation of 2 workshops <strong>and</strong>the preparation of 2 workshop reports. The first workshop (Nov. 30 – Dec. 1,2010) will involve Contractors <strong>and</strong> the Scientific Advisory Panel to address<strong>cumulative</strong> effects <strong>and</strong> their relationship with <strong>sockeye</strong> declines. The secondworkshop (Feb. 23-24, 2011) will involve the public, Participants, as well as theother Cohen Commission Contractors.4.3 The Workshop Facilitators will make themselves available to CommissionCounsel <strong>and</strong> legal staff as required.Additional Methodological Details:Cumulative Impact Analysis. The Contractor will take a life history approach to <strong>cumulative</strong> impactanalysis, examining the suite of stressors potentially affecting each life history stage, <strong>and</strong> how thosestressors have changed over the period of interest (i.e., early 1990’s until the present). The Contractor willuse the results of each investigator’s work to illustrate the magnitude of each stressor over space <strong>and</strong>time, <strong>and</strong> its potential for delayed effects on subsequent life history stages (e.g., acquisition of a diseaseat one life history stage may not cause mortality until other stressors such as high temperatures affect alater life history stage). The intent is to illustrate these potential <strong>cumulative</strong> <strong>impacts</strong> through a series ofintegrative frameworks, such as:a) a life history diagram showing the <strong>impacts</strong> of different stressors, with arrows of different thicknessindicating the strengths of different pathways (including both direct <strong>and</strong> delayed effects);b) time series graphs showing changes in a series of indicators for different stressors, placed on amap of the <strong>sockeye</strong>’s life history, showing all indicators on a consistent relative scale (e.g., scaledto 1 based on the maximum value over the time series);c) similar time series graphs of the changes in productivity indicators for different <strong>sockeye</strong> <strong>salmon</strong>stocks; <strong>and</strong>d) analyses of the evidence for <strong>and</strong> against different hypotheses, building on the June 15-17 PSCworkshop.Computer Model. Each of the investigators gathering information on different stressors will assembleindicators of those stressors, organized into a spreadsheet with a consistent format (i.e., stressor by yearby stock), specifically the 19 <strong>Fraser</strong> <strong>River</strong> <strong>sockeye</strong> stocks for which productivity indicators have beenassembled by the Pacific Salmon Commission. For some stressors (e.g., <strong>impacts</strong> on freshwater spawning<strong>and</strong> rearing habitat), these indicators may be stock-specific. For other stressors (e.g., fish farms,oceanographic conditions, mammalian predators) many stocks will need to be grouped, as theindependent effects on different stressors are unknown. The ability to explain the patterns of change inboth <strong>Fraser</strong> <strong>sockeye</strong> stocks <strong>and</strong> other stocks of interest outside the <strong>Fraser</strong> (valuable to create contrast)16 Several of the Commission Participants requested that additional details concerning methodology for<strong>cumulative</strong> impact analysis be provided. This information is shown after the section SW4 Deliverables.118
will be explored using a multiple regression approach or perhaps other multivariate techniques. It isexpected that there will be some serious challenges in completing this analysis due to both <strong>data</strong> gaps,<strong>and</strong> insufficient degrees of freedom for strong statistical inference. However, this effort will serve toillustrate the challenges in deducing the relative <strong>impacts</strong> of different stressors.119
Appendix 2. Reviewer Evaluations <strong>and</strong> ResponsesReviewers:1. R<strong>and</strong>all M. Peterman2. Sean Cox3. Rick Routledge4. John ReynoldsThe authors’ responses to each reviewer’s comments are provided in bold below.Report Title: <strong>Fraser</strong> <strong>River</strong> Sockeye Salmon: Data Synthesis <strong>and</strong> Cumulative Impacts(draft final report)Reviewer Name: R<strong>and</strong>all M. PetermanDate: 12 March 20111. Identify the strengths <strong>and</strong> weaknesses of this report.Strengths:a. Most of this report is extremely well written. The hierarchical organization of thematerial is a very effective way for readers with different levels of underst<strong>and</strong>ing of the<strong>Fraser</strong> <strong>sockeye</strong> situation to easily access the report to the desired depth. For the mostpart, tables <strong>and</strong> figures are clear <strong>and</strong> useful.b. In recognition of the variety of backgrounds among readers, sections 2 <strong>and</strong> 3 do anexcellent job of setting out the context <strong>and</strong> limitations for this type of work, as well asexplaining the process for drawing conclusions. I particularly like Fig. 3.3-3 on page 19as a way of succinctly showing how the categories of relative likelihood were assignedto hypothesized mechanisms. The report also nicely differentiates between explanationsof past observations <strong>and</strong> making forecasts of the future.Weaknesses:c. There are two short sections in them main text that are poorly written (pages 58-59<strong>and</strong> 77-79). Those are sections that deal with the authors' own analyses of <strong>data</strong> (asopposed to the summaries of other researchers' analyses that are covered in the rest ofthe report).Response: These two sections have been re-organized <strong>and</strong> rewritten to address both thisissue <strong>and</strong> the more specific criticisms raised below. In particular, a new section (Section3.3.6) has been added to ensure that an appropriate overview of the quantitative methods isprovided prior to any discussion of the results of those analyses. This section is intended toprovide a concise, non-technical description of the quantitative methods such that bothnon-technical <strong>and</strong> technical readers will be able to clearly underst<strong>and</strong> the basicterminology <strong>and</strong> overall methods used without needing to refer to the technical details121
presented in Appendix 3.d. Unfortunately, when I finally read Appendix 3 (which I expected to clarify theshortcomings in the main text regarding the description of the authors' statisticalmethods), I was still unclear what they actually did. There are still no statistical modelsgiven. Appendix 3 should therefore be rewritten in the format of a methods section of ajournal paper so that readers with statistical backgrounds can underst<strong>and</strong> what theauthors did <strong>and</strong> evaluate the appropriateness of the methods of analysis. Again note,however, that this criticism only applies to the methods used by the authors of thisreport on their analyses of raw <strong>data</strong>; it does not to their <strong>synthesis</strong> of evidence <strong>and</strong> otheranalyses provided to them by other contractors.Response: The sections of Appendix 3 that pertain to our quantitative analyses have beensubstantially rewritten to address these issues, as well as the more specific criticismsregarding this section raised below.e. Appendix 4 described more about the methods, but still not enough. Moreproblematic, though, was the poor presentation of results of the authors' own <strong>data</strong>analyses. My comments <strong>and</strong> suggestions for improvement are detailed at the end ofsection 6 of this review.Response: Appendix 4 has been substantially rewritten to address these issues, as well asthe more specific criticisms regarding this section raised below. We acknowledge that thedraft version of this appendix made available to the reviewers was quite rough. The timeavailable for conducting the quantitative analyses <strong>and</strong> describing their results was highlyconstrained due to long delays in receiving the appropriate <strong>data</strong>.2. Evaluate the interpretation of the available <strong>data</strong>, <strong>and</strong> the validity of any derivedconclusions. Overall, does the report represent the best scientific interpretationof the available <strong>data</strong>?a. The authors used (<strong>and</strong> clearly explained to readers) a rigorous "weight-of-evidence"approach that helped them deal with the complex set of hypothesized causes of thedecline of <strong>Fraser</strong> <strong>River</strong> <strong>sockeye</strong>, as well as the wide range of available <strong>data</strong> for differenthypotheses. This "weight-of-evidence" approach was based on two key publications inthe field of "Retrospective Ecological Risk Assessment" (Forbes <strong>and</strong> Callow 2002;Burkhardt-Holm <strong>and</strong> Scheurer 2007), but the authors omitted full references to thesepapers at the back of the report.Response: The correct, full citations have been added to references section.b. The authors did a very commendable job at presenting the best scientificinterpretation of available <strong>data</strong> that they obtained from the other contractors. The reportalso carefully points out cases where no information was available <strong>and</strong> where noconclusions could be drawn. As well, the report draws legitimate conclusions that putmore weight on hypotheses about marine processes outside the Strait of Georgia than122
the conclusions of the Expert Panel at the workshop in June 2010 sponsored by thePSC (Pacific Salmon Commission) (Peterman et al. 2010). The current report had more<strong>data</strong> <strong>and</strong> analyses available to it than the PSC workshop.Response: Thank you for the positive feedback.c. The report falls short on interpretation of its own <strong>data</strong> analyses, though, as I describeat the end of section 6 of this review. I respect the fact that they were extremelycomplex analyses done in a relatively short time, but even this draft report could havebeen better at describing those analyses. Given that those analyses drew essentiallythe same conclusions as found by <strong>data</strong> from the other contractors, this problem is notas serious as it would have been if the original <strong>data</strong> analyses described here were theonly ones to go on.Response: The reviewer provides much more specific comments on this issue in Section 6 ofthis review. We have provided our responses to each of those points in Section 6.3. Are there additional quantitative or qualitative ways to evaluate the subjectarea not considered in this report? How could the analysis be improved?There are only a few places where I noted that the evaluations of hypotheses herecould be improved. These are noted in section 6 below as specific comments.Response: We have responded to the comments referred to here in Section 6.4. Are the recommendations provided in this report supportable? Do you haveany further recommendations to add?a. In general, the recommendations are well supported. The authors have done anexcellent job of relatively concisely compiling a complicated set of evidence. The onlyrecommendation that I might add is that management decisions still need to be made,despite the lack of appropriate <strong>data</strong> on some purported mechanisms affecting thedecline of <strong>Fraser</strong> <strong>sockeye</strong> <strong>salmon</strong>. There will always be uncertainties, <strong>and</strong> althoughsome of the judgments summarized here are qualitative, they at least describe the stateof the art <strong>and</strong> provide everyone with more information than they had before.Response: The challenge of making decisions under uncertainty is a good point, <strong>and</strong> wehave exp<strong>and</strong>ed our discussion of prioritization in Section 5.2.2.5. What information, if any, should be collected in the future to improve ourunderst<strong>and</strong>ing of this subject area?a. I have nothing to add beyond what has already been included in the variousrecommendations in the report.6. Please provide any specific comments for the authors.1. I realize that this document was produced under considerable time pressure, but it123
now needs a thorough copy editing to clean up poor grammar, incomplete sentences,extra or missing words, errors in figure numbers, missing references, repeated pagenumbers in the Executive Summary <strong>and</strong> the main text starting with the Introduction, etc.Response: The final report has now received much more thorough copy editing than waspossible for the draft report (given our tight time constraints), addressing the itemsmentioned by the reviewer above <strong>and</strong> more.2. Page 2 of Executive Summary, last paragraph - The sentence starting with "For eachlife stage, we considered..." should be changed to a numbered or bulleted list; it is toohard to read.Response: We have changed this sentence to be more readable.3. Further on in that paragraph, emphasize that your categories "unlikely, possible,likely, or very likely" are listed in order of increasing confidence. Although that is obvioushere, much later you have many hypotheses where you state "possible" <strong>and</strong> it may notbe clear to readers at that point where that category sits along the spectrum.Response: Rewritten to emphasize relationship between classifications <strong>and</strong> confidence.4. Page 3 bullet item 1 - You must define what you mean by productivity. Given that oneof your objectives is clear communication with non-technical readers, this type ofambiguity should be removed from all jargon terms in the report.Response: We have provided an explicit definition of what we mean by “productivity” bothin the Executive Summary <strong>and</strong> where the term first occurs in the main report (Section 1.1).5. The term "inshore migration" should be replaced throughout this document by"coastal migration"; the latter is clearer as well as more common.Response: We have replaced the term “inshore migration” with “coastal migration”throughout the report.6. Page 5 of Executive Summary, last paragraph - define "PSC report" <strong>and</strong> brieflyexplain the workshop process that it summarizes.Response: Done.7. Page 22, 4th line - insert "substantially" between "were" <strong>and</strong> "affected".Response: Done.8. Figures numbered 4.1-3 through 4.1-5 have incorrect figure numbers according toreferences to them in the main text.124
Response: Figure numbers have been corrected.9. The figure currently numbered 4.1-5 (colored stacked bar plots) has something wrongwith the year labels <strong>and</strong> legends, which makes them appear splotchy <strong>and</strong> hard to read.Response: This figure has been reproduced both with higher resolution <strong>and</strong> larger fonts forthe labels to improve its readability.10. Page 31 - The main heading should be reworded by inserting "of observed patternsin productivity" between "Implications" <strong>and</strong> "for analysis".Response: Done.11. Page 32 - Regarding the italicized note to reviewers: those generalizations seemfine.Response: Comment removed from final report. Original comment:“Note to reviewers: The above generalizations inevitably have some oversimplifications,so tweaks are undoubtedly required. We desire a concise summary ofattributes.”12. The summary tables in the conclusions sections on each life stage are very useful(page 40 for example).Response: Thank you for confirming that these tables have met their intended objective.13. The Selbie (2010) reference is missing at the back.Response: Reference added.14. Your reference to that Selbie paper implies that you also have access to the otherpapers from the PSC workshop in June of 2010. Therefore, I recommend that you drawupon the evidence presented by John Ford at that workshop concerning the increasing<strong>and</strong> large population of Steller sea lions (~ 60,000 animals in B.C. <strong>and</strong> SoutheastAlaska in 2009). Ford also pointed out that a substantial part of their diet (~12 to 31%)comes from <strong>salmon</strong>ids (not yet identified down to species). This information on Stellersea lion predation should be inserted into the last paragraph on page 50 <strong>and</strong> carriedthrough to other similar sections later.Response: This information has been included. The diet <strong>data</strong> to which the reviewer refers(presented both by John Ford at the PSC Workshop <strong>and</strong> Andrew Trites at the CohenCommission Science Workshop, originally from P.F. Olesiuk, unpublished), measures theproportion of scat samples containing <strong>salmon</strong>ids. That is, approximately 12-31% (varyingby season) of the samples contained <strong>salmon</strong> but that does not mean that <strong>salmon</strong> make up125
12-31% of the diet. The evidence presented by Andrew Trites at the Cohen Commissionworkshop suggests that <strong>salmon</strong> comprise approximately 10% of the overall diet of Stellersea lions.15. Page 52 - insert "Strait of Juan de Fuca" after "Queen Charlotte Strait". Also, youneed a map labelling these salt-water locations, as well as the "Queen Charlotte Sound"mentioned on page 57.Response: Corrected as suggested. We have added labels to Figure 3.3-2 for the major saltwaterlocations commonly referred to throughout the report.16. Top of page 53 - The following example of potential predation effects is veryimportant: "...if 0.1% of the diet of spiny dogfish was <strong>sockeye</strong> smolts, they wouldconsume 14.5 million smolts within the Strait of Georgia (very significant predation)...".Analogous examples for marine mammal predators, particularly Steller sea lions, areconspicuous by their absence. This omission must be corrected here, as well as onpage 50 <strong>and</strong> the bottom of page 54.Response: Agreed, <strong>and</strong> implemented. We have added greater discussion regarding Stellersea lions in Sections 4.4 <strong>and</strong> 4.5.17. Page 57 - The paragraph under the heading "Conditions in Queen ..." correctlycharacterizes the different conclusions about the role of marine conditions "outside" ofVancouver Isl<strong>and</strong> compared to "inside" that were drawn by the current report <strong>and</strong> thereport from the PSC workshop in June of 2010.Response: Thank you.18. Page 58 - Everything from the first line "Three model sets were tested ..." to the endof this section at "... drivers examined" needs to be thoroughly re-written because it isvery confusing, uses undefined terms such as "global model" <strong>and</strong> "model sets", <strong>and</strong>does not even mention which dependent variable the models are trying to explain! I hadto re-read this page <strong>and</strong> a half several times to deduce, for example, what "model sets"meant. Here it appears that one could simply substitute the word "period" for "modelsets", because the term seems to imply models that were analyzed across three timeperiods. However, if you make that substitution here, it will be at odds with how "modelsets" are used on pages 78-79. I purposely did not yet read Appendices 3 <strong>and</strong> 4, so thatI could comment on how underst<strong>and</strong>able this section was without reading the detailedmethods in those appendices. Unfortunately, this section does not work as it st<strong>and</strong>s.Fortunately, the text on pages 58-59 can be helped considerably by inserting a tablethat indicates in words (not in equations) which independent or predictor variables areused in each model <strong>and</strong> for which time periods <strong>data</strong> on those variables were available.The text above the table should at least state whether you are using a multiple linearregression or some other form of statistical model.126
Response: This section has been completely rewritten, <strong>and</strong> we have introduced ourquantitative methods in plain language in section 3.3.6.19. Page 60 - The exceptional case of the Harrison <strong>River</strong> <strong>sockeye</strong> should be movedfrom its current hidden location at the end of point 4 <strong>and</strong> put into its own point. This willenable you to emphasize the importance of the evidence that could be gleaned fromstudying that stock more thoroughly, given that its life history is quite different from other<strong>Fraser</strong> <strong>sockeye</strong> stocks.Response: We have moved comments on the Harrison stock into their own bullet point toemphasize that stock-specific knowledge of its migration route <strong>and</strong> timing would beespecially useful given its unique life history <strong>and</strong> productivity trends (i.e., the only stockwith increasing productivity).20. Page 61 - I would add a new point under "Key things we need to know better" thatwould specifically state the need to take the current knowledge about consumption ratesof <strong>sockeye</strong> <strong>salmon</strong> <strong>and</strong> other species by marine mammals, the bioenergetics of thosemammals along with their population sizes, <strong>and</strong> combine these into estimates of totalconsumption of <strong>sockeye</strong> <strong>salmon</strong> by populations of a given species of marine mammal.For too long now, this last step has been missing, yet it should be easy to calculate arange of estimates given a st<strong>and</strong>ard set of assumptions like those that Christensen <strong>and</strong>Trites apparently used for their spiny dogfish example described on page 53.Response: We agree with the reviewer’s comment <strong>and</strong> have added this recommendationunder “Key things we need to know better”. This recommendation has the advantage ofbeing fairly specific <strong>and</strong> preliminary efforts could be initiated immediately with theinformation currently available.21. In the context of the previous comment, lines 8-10 on page 62 make a statementthat is inconsistent with the point made on page 53 about the total potential impact ofspiny dogfish predation on <strong>salmon</strong>, despite <strong>salmon</strong> being a tiny portion of the diet of thedogfish. The offending sentence is: "On the return journey back to the <strong>Fraser</strong>, there aremany marine mammals that will prey on adult <strong>salmon</strong>, but <strong>sockeye</strong> <strong>salmon</strong> do notappear to be a substantial portion of any of their diets". Surely, the authors have to beconsistent in their logic <strong>and</strong> say the same thing about the marine mammals as they didfor the spiny dogfish.Response: We have revised this section.22. The line in Figure 4.5-2 does not seem to be the best-fit line; visually at least, itseems like it should have a lower slope. What was the assumption about the error termin the fitting method?Response: This graph was extracted as an image from the publication cited <strong>and</strong> thereforethe “trend” line could not be removed. We were not able to acquire the underlying <strong>data</strong>127
efore submitting the draft report. We have since acquired the raw <strong>data</strong>, updated to 2010.The original did not contain any information on the nature of this trend line. We have nowgraphed the same <strong>data</strong> without a trend line but including labels for the axes.23. Page 65, 7th line - This statement "no obvious connection to <strong>sockeye</strong> abundance" isnot supportable. See point #21 above.Response: This quote from the workshop has been removed as it is inconsistent with theinformation available on Steller sea lions. The available evidence does not definitively showthat there is a connection between marine mammals <strong>and</strong> <strong>sockeye</strong> abundance but the <strong>data</strong>does provide some support for this idea <strong>and</strong> therefore the potential connection cannot berejected, as in the above statement.24. Page 77, section 4.7.1 - As noted above, I did not read Appendix 3 or 4 prior toreading this section in order to view it from the perspective of a non-technical reader.Unfortunately, this section is poorly written <strong>and</strong> suffers from similar problems to thosedescribed above for pages 58-59. For instance, there is no clear statement thatidentifies the dependent, let alone the independent variables, <strong>and</strong> the definition of"model set" here is different than what is implied on pp. 58-59. Again, a table like Isuggested for pp. 58-59 might solve several problems here.Response: This section has been rewritten <strong>and</strong> restructured. It now contains both a<strong>synthesis</strong> of our qualitative analyses of <strong>cumulative</strong> effects across all life stages, as well as aclearer summary of our quantitative analyses. Our quantitative methodology is nowintroduced in Section 3.3.6. to provide readers with sufficient information on the approachso they will be able to underst<strong>and</strong> the results presented in this section without needing todelve into the technical details of the appendices. We have also added two tables to Section4.7.2 that illustrate the differences between the models tested <strong>and</strong> describe which specificvariables are included in each of the models discussed. We have tried to ensure (in both ofthe sections mentioned) that any technical terms (e.g. model set, parameters, covariates,“project-based models”, “all-marine” model, etc.) are either more clearly defined or simplyreworded using clearer, non-technical language.25. Page 77, 2nd-to-last line - "If <strong>data</strong> are missing ..." Is this sentence true even if onlyone <strong>data</strong> point is missing in a time series for a particular variable? If so, this proceduredoes not seem right.Response: This is not what we intended to imply in this section or later in the methods. Thesentence:“If <strong>data</strong> are missing for one variable in one stock, then all of the records for thatstock will be excluded from the analyses.”referred to cases where one variable of interest (e.g., contaminants) was unavailable inANY year for a particular stock. When a single <strong>data</strong> point is missing, it is only necessary todrop that particular year x stock from the analysis. For cases where only a small numberof records were missing for a particular variable, we considered using interpolation (either128
ased on time or other stocks) to ‘fill in’ the <strong>data</strong>set <strong>and</strong> therefore reduce the number of<strong>data</strong> points that had to be dropped from the analysis. In the end this strategy was rejectedbecause <strong>data</strong> sets with only small gaps only resulted in a small loss of <strong>data</strong> <strong>and</strong> <strong>data</strong> setswith larger gaps (often at the beginning or end of the <strong>data</strong> set) were not able to be ‘filled in’with confidence. We have re-written the description of how we h<strong>and</strong>led ‘missing <strong>data</strong>’ in4.7 as well as in Appendix 3.26. Page 78 - The table suggested above should define what is meant by "Threeadditional models were tested with the model set...", the "all marine model", <strong>and</strong> otherequally vague terms.Response: This section has been completely rewritten. Please refer to the response for #24.27. Section 4.7.3 on pp. 79-80 - A summary table is also necessary here.Response: This section has been completely rewritten. Please refer to the response for #24.28. Page 81 - In the last two paragraphs prior to section 4.8, you bring in pink <strong>salmon</strong><strong>data</strong> without describing what types of mechanisms the PSC workshop concluded wereplausible. Here the reader will have no idea whether you are talking about competitionor predation by pinks. The last sentence prior to section 4.8 talks only in vague termsabout the mechanism; it must be more explicit.Response: We have revised this paragraph, providing more details on the hypothesesevaluated in the PSC report.29. Page 86 - what do you mean by "<strong>data</strong>base assimilation"?Response: We have rewritten this line to clarify the intended meaning, that collected <strong>data</strong>would be assimilated into a central, integrated <strong>data</strong>base.30. Page 87 - An intriguing, but to me, impractical suggestion is made here: "... continueexisting topic-specific <strong>data</strong>bases (e.g., climate <strong>data</strong>, ocean conditions, stockinformation, contaminants, habitat <strong>data</strong>, disease), each maintained by the entities thathave collected these <strong>data</strong>, but link key fields of each one to an integrated,interdisciplinary, geo-referenced <strong>data</strong>base." The footnote to this idea notes that theTrinity <strong>River</strong> Restoration Project is moving in this direction. It would be worth exp<strong>and</strong>ingupon that example here to demonstrate that the suggestion made by the authors in thequote above is achievable.Response: We have exp<strong>and</strong>ed our description <strong>and</strong> included some discussion of thechallenges involved with integrated but regionally distributed <strong>data</strong>bases.31. Page 90 - Insert "Strait of Juan de Fuca" next to the other bodies of the oceanmentioned in section 4.4 of the table because this is the strait apparently used by129
juvenile Harrison <strong>River</strong> <strong>sockeye</strong>.Response: Done.32. Need to do the usual cross-checking of all references.Response: We have cross-checked all references between the body of the report <strong>and</strong> thereferences section.33. This report frequently uses contractions (e.g., "doesn’t", "won't", etc.). These do notbelong in scientific writing; spell out the full words.Response: We have replaced all contractions (i.e. aren’t, can’t, couldn’t, doesn’t, don’t,hasn’t, wasn’t, we’d, it’s, that’s, there’s, what’s, they’re).Specific comments on Appendix 334. Page 103 - Table A3.3-1 is missing some entries in the "units" column. Also, thereappear to be very few cases in which the qualitative time series of <strong>data</strong> were provided.Is that correct? If so, say so in section A.3.2.2. For instance, "... only X% of the <strong>data</strong>that we analyzed were from these qualitative time series".Response: The missing entries have been entered in this table. A sentence has been addedto describe that qualitative time series were only received from two projects. We think thatSection A3.3 (“… Data Received”) is the more appropriate location for this sentence, whichfollows directly after the section described by the reviewer.35. The material in section A3.5.1 (Qualitative Analyses) under the heading "Weight ofevidence..." repeats what was already said earlier in section 3.3.5 of the main report. Noneed for both.Response: We have added a footnote to explain that this section is an exp<strong>and</strong>ed version ofSection 3.3.5 of the main report. The version in the appendix contains substantially moredetail on this approach <strong>and</strong> how it has been adapted from the foundational literature. Wefelt that this greater depth was relevant given the multiple audiences for this report. Wenow explicitly note that Section 3.3.5 is therefore repeated in this section.36. Page 137 - Delete "or not" from the last line of this page.Response: Done.37. Page 138 - You state that rather than using residuals from the underlying best-fitspawner-recruit relationship that "We used ln(R/S) for this analysis." Not only shouldyou justify why you did that, but you should also state the potential biases that youintroduce by doing so. That is, when your results are presented, you should interpret130
them in terms of how changes in spawner abundance (S) alone (even with constantrecruitment, R) might have affected the time trends in log e (R/S).Response: We used ln(R/S) so that the potential effects of density dependence (i.e. effects ofchanges in S on R/S) would be considered concurrently with the potential effects of otherstressors. The form of multiple regression equation that we used is a Ricker spawnerrecruitmodel with additional covariates. Since Peterman <strong>and</strong> Dorner (2011) only foundevidence for delayed density dependence for the Quesnel stock, this simplification seemsreasonable. The analysis could be repeated using the residuals from the best fit spawnerrecruitmodel as the dependent variable, rather than ln(R/S).38. Bottom of page 140 to top of 141 - I believe that you meant to say that you areplotting the "concentration profile", or <strong>cumulative</strong> probability of stock composition here.Careful with wording here; "distribution" at the top of p. 141 might mean spatialdistribution to some readers.Response: We have changed the wording to say ‘concentration profile’ <strong>and</strong> then definedwhat we mean by that term.39. Page 142 - Insert "variable" between "dependent" <strong>and</strong> "<strong>data</strong>set" <strong>and</strong> make <strong>data</strong>settwo words. Same with "smallest independent <strong>data</strong>sets". Also, "See Appendix 3-4 refersto the wrong appendix number (this error appears elsewhere too). Page 142 is wherethe "no missing <strong>data</strong>" statement comes up again, just as in the main text, yet you do notfully explain how that was interpreted. If there was even one year with missing <strong>data</strong>, didyou throw out the entire time series of that particular independent variable? This doesnot seem reasonable, nor is it necessary. Ecological <strong>data</strong> often have missing <strong>data</strong>points, yet the remaining parts of the time series can still be very informative <strong>and</strong> can beused to fit statistical models.Response: We have added ‘variable’ to independent <strong>and</strong> dependent where necessary. Wehave changed ‘<strong>data</strong>set’ to ‘<strong>data</strong> set’ throughout the document. We have fixed the Appendixreference. As described above (in response to comment 25) we have clarified the textregarding how missing <strong>data</strong> were h<strong>and</strong>led.40. Page 143 - What are the D-L series? You were not even clear earlier in thisparagraph whether the "A-series, B-series, <strong>and</strong> C-series of model sets" refer to thebulleted list of A, B, <strong>and</strong> C just above this paragraph. Despite the attempt by the authorsto describe "model sets", I still am not sure what exactly those refer to, even by themiddle of page 143. You need some concrete examples of statistical models embeddedin the text to define these terms more clearly. It was not until I saw some tables inAppendix 3 that I began to underst<strong>and</strong> what "model sets" meant.Response: We now introduce what we mean by ‘model sets’ in the general introduction to‘multiple regression’. We have exp<strong>and</strong>ed the detailed ‘model set’ section to describe the D-L series as well as the A-C series. In addition, we have changed the bulleted list to read A-131
series, B-series, etc. to clarify that these bullets are what the text is referring to. We havenow embedded statistical models explicitly in the ‘model structure’ section.41. Even Table A3.5-1 adds to the confusion given the (perhaps mis-formatted) headingof "Model [spaces] set" with "group" below it. That table requires a more extensivecaption to explain the symbols. For instance, what is "w/in Inc-Lak" on row D? What do"yes" <strong>and</strong> "no" mean <strong>and</strong> how does the latter differ from "N/A"? The entries in this tableare also formatted poorly.Response: We have reformatted the table to avoid the awkward gaps. In addition we havereplaced the short h<strong>and</strong> in the tables with exp<strong>and</strong>ed text. We have also updated the tablecaption to clarify what yes/no indicate in the table.42. "Timeseries", "lifehistory" (<strong>and</strong> "lifestages" <strong>and</strong> "broodyears" elsewhere) shouldeach be split into two words, <strong>and</strong> "principle components" should read "principalcomponents". I will not mention any more of these basic spelling errors; they should allbe fixed with a thorough editing.Response: These terms have been split into two words throughout the document. Theexception is cases where “BroodYear” is used to name the field in the <strong>data</strong>base thatcontains <strong>data</strong> on the brood year. The misspelling of “principal components” has beencorrected.43. Page 146 - Was the following step applied to <strong>data</strong> sets for all predators <strong>and</strong> allalternative prey? "...we took each <strong>data</strong>set individually <strong>and</strong> generated a new quantilebased <strong>data</strong>set..."Response: No, it was not applied to the marine mammal <strong>data</strong>. We have added a table toAppendix 3 that describes each of the predator/alternative prey <strong>data</strong> sets we received alongwith: the hypothesized effect on <strong>sockeye</strong> (mechanism <strong>and</strong> life stage), <strong>and</strong> a description ofthe <strong>data</strong> reduction if it occurred.44. In the "Model structure" section, you have to provide some example equations(including the assumed error structure) for technically-trained readers to clarify whatexactly you are doing. This lack of information is really frustrating. The equations are notclear, contrary to what you say here: "Table A3.5-2 illustrates the process we used todocument the model structure for each model set".Response: We have added an equation to the model structure section to explicitly illustratewhat models we fit. We have also exp<strong>and</strong>ed the heading for Table A3.5-2 to clarify how toread the c<strong>and</strong>idate models from this table.45. The second column heading in Table A3.5-2 should read "Independent variable".The caption for this table is quite inadequate. What do the 0s <strong>and</strong> 1s in the columns M1through M10 indicate? I use mixed-effects models myself, so I would assume that they132
efer to some variable being included in the particular equation for a particular row, butwhich variables those refer to are not shown or stated in the text -- a major oversight!Response: We have substantially updated the Table A3.5-2 heading to clarify theinformation contained in the table. It may have been confusing because models are usuallyspecified in rows, but we have used columns M1-M10 to represent the different models.46. Pages 149-150 - I am not sure how useful the description of these potential futureanalyses will be to readers. Furthermore, the wording of some of them is confusingbecause it implies that the authors of this report did in fact use that method. Forinstance, the second sentence under the heading "Structural equation modeling (SEM)"says "In this analysis, we first specify a set of structural equations based on..." yet at theend of the paragraph it states that the authors did not use SEM. In the section onMantel's test, why not cite the Mueter et al. paper in the normal manner?Response: Yes, we agree. We have added a short summary table at the front of Appendix 3to list the different approaches we considered <strong>and</strong> those that were ultimately recommended/ completed based on expert feedback <strong>and</strong> the Nov. 30 / Dec. 1 workshop. We have kept asection on potential analyses, but limited this to approaches that were highly recommendedbut not completed as part of this project, as well as ideas that were raised by the peerreviewers of this project.47. Overall, this Appendix 3 was written very poorly. It should be revised in the format ofa methods section of a journal paper so that readers with statistical background canunderst<strong>and</strong> what the authors did <strong>and</strong> evaluate its appropriateness.Response: We had very little time to complete quantitative analyses prior to submission ofthe draft report, <strong>and</strong> focused all of that time on the analyses themselves rather than thedescription of methods. Appendix 3 has now been substantially re-written to improve theoverall presentation <strong>and</strong> provide sufficient detail for readers with statistical background,while still ensuring that important concepts can be understood by all readers.Specific comments on Appendix 448. The sequential numbering for Figure A3-2 is out of order with the surroundingfigures. The spelling of "E.Stewart" in the figure caption should be Early Stuart. Also,give the P value to justify "... significant decline..."Response: We have corrected the figure numbering in this section <strong>and</strong> written out stocknames in full where appropriate.49. Why are these four plots the only ones shown for the slope <strong>and</strong> change-pointanalyses? There is no explanation.133
Response: This is a fair question. We selected several example figures to illustrate caseswhen either the hockey stick model or straight line model fit better, but rather thanshowing the full diagnostic figures for both models <strong>and</strong> all stocks we summarized the restof the results in a table to save space. We have decided to remove all of the diagnosticfigures from Appendix 4 <strong>and</strong> simply present the table of results. We still include anexample of the diagnostic figures that were generated for each stock in the methods section(Appendix 3)50. The Tables A4-2 (there are mistakenly two of them) show the statistics <strong>and</strong> "recenttrend", although the latter refers to the trend over the entire time series.Response: We have corrected the table numbering in this section.51. The two darkest colored lines in Figures A4-5 <strong>and</strong> A4-6 are not distinguishable. Thisshould be fixed, especially in Figure A4-5 where it matters most.Response: We have redrawn the figures using dashed lines for two of the time-periods toclarify the difference between lines.52. Captions of Figures A4-7 through A4-10 should define the R/S series as black soliddots <strong>and</strong> lines.Response: Corrected as suggested.53. Page 163 - You now have yet a third Table A4-2!Response: All tables have been re-numbered.54. Page 163 - Finally, we get to see what "model set" means. However, it is stillincomplete. Where does the reader find which 6 stressors were used for model M3, forexample, let alone all the other models? There should be a table similar to Table A4-5on page 168 for each model set. Also, there is no statement about why the particularmodel sets were chosen to be provided on pages 163 onward. Are these only examplesor were they your only analyses?Response: Yes, we agree. We have added tables to explicitly list the variables included ineach model. The analyses presented represent all of the analyses that were completed. Wehave added a paragraph to the methods in Appendix 3 to describe why we selected themodel sets we did.55. Pages 163-170 are written very poorly. Results should be presented in a mannersimilar to that of a journal article. At present, some paragraphs describe results withoutreferring to the supporting information in tables that I finally ran across later (parameterestimates, AIC values, etc.). At the end of the first sentence where results are reported,you should include a concise reference to the appropriate table (e.g., "Results show that134
... (Table xx)". Structures of these sections also differ unnecessarily among model sets,as do headings of tables <strong>and</strong> model names.Response: References to results have been added in the main text as recommended. Wehave improved the consistency of the different sections describing results.56. Table A4-3 does not specify which variables were included in several cases, butinstead uses general labels such as water quality variables, bird predators, fishpredators, etc.Response: We have generated consistent tables that explicitly describe all variables for allmodel sets.57. Reduce the number of decimal places in tables. Provide st<strong>and</strong>ard journal-type tablecaptions to clearly define each column heading <strong>and</strong> other symbols.Response: We have reduced the number of decimal places used in the results tables. Wehave revised the table captions to clearly explain each column heading <strong>and</strong> any symbolsused.58. In Table A4-14, what does "Correction" refer to? You should be using the AIC cformula (i.e., the one corrected for small sample size) instead of the one for AIC. Theformer equals the latter if sample size is large enough.Response: We used the AICc in our model selection however, we have also reported boththe raw AIC <strong>and</strong> the correction in the table (AICc=AIC+correction), this was simply toillustrate the impact of the relatively large number of parameters to observations. We haveclarified this in the table captions.59. The sentence near the top of page 167 does not appear justified: "This appears toprovide some additional confirmation that organizing the qualitative <strong>synthesis</strong> <strong>and</strong>evaluation of evidence by lifestage was indeed justified." Just because results aredifferent for the analysis organized by life stage from the one set up by CohenCommission project does not necessarily mean that the first rank ordering of models ismore valid; it only says that they are different.Response: We have removed this sentence, both from this location <strong>and</strong> where a similarstatement was made in the main body.60. Page 167 - Here is good example of why one of my earlier comments is important.Model 8 turns out to be best (lowest AIC in Table A4-22), yet Table A4-4 does notspecify which temperature measure is used in the Strait of Georgia (when <strong>and</strong> where).Several options were described previously, so the variable that was used is not obvious.Response: Yes, we agree. We have added tables to explicitly list the variables included in135
each model.61. Add "C4a" to the sentence just after the end of Table A4-5 to read "in the previousmodel set (C4a), ..."Response: Done.62. An important new result, which should be highlighted more here <strong>and</strong> in the maintext, is the one on page 168: "... they indicate that the QCS models have greaterexplanatory value than SoG models for <strong>Fraser</strong> <strong>River</strong> <strong>sockeye</strong> <strong>salmon</strong> productivity during1980-2004." This result alters the conclusion from the Peterman et al. (2010) reportfrom the June 2010 PSC workshop <strong>and</strong> is legitimate because of new <strong>data</strong> <strong>and</strong> analysesnot seen at that workshop.Response: This result has now been emphasized in both Appendix 4 <strong>and</strong> the main report(section 4.4).63. The wordings of these sections on results of model sets really need a lot ofpolishing. You don't even put the tables describing models in the same order as thetables of parameter estimates <strong>and</strong> fitting statistics (e.g., C1a QCS <strong>and</strong> C1a SoG).Response: We have ordered the results tables more carefully <strong>and</strong> embedded the tables withestimates <strong>and</strong> AIC weights in each section to make it easier to read.64. Page 170 - Replace SST with SSS in the line: " This suggests that SST is anuninformative parameter..."Response: This section has been rewritten.65. Page 170 - The paragraph of results starting with "Within the SoG model set,chlorophyll does not appear to be..." does not correspond at all with results shown inTable A4-16 (Model fit information for model set C1a, Georgia Strait). Either the table iscompletely wrong or the text refers to another table that is not shown.Response: This paragraph has been reorganized so that the writing <strong>and</strong> results are clearer.136
Report Title: <strong>Fraser</strong> <strong>River</strong> <strong>sockeye</strong> <strong>salmon</strong>: <strong>data</strong> <strong>synthesis</strong> <strong>and</strong> <strong>cumulative</strong> <strong>impacts</strong>Reviewer Name: Sean CoxDate: 18 March 20111. Identify the strengths <strong>and</strong> weaknesses of this report.StrengthsThe <strong>data</strong>base is the primary strength of this report. The project seems to have createdan efficient way to organize <strong>and</strong> store a wide range of <strong>data</strong>, meta-<strong>data</strong>, <strong>and</strong>documentation. Development of such <strong>data</strong>bases will undoubtedly be critical to future<strong>salmon</strong> research.Response: Once <strong>data</strong> are made available from the Cohen Commission, we hope that manyresearchers working on <strong>salmon</strong> populations can exp<strong>and</strong> <strong>and</strong> apply this <strong>data</strong>base using anumber of diverse analytical approaches, <strong>and</strong> have exp<strong>and</strong>ed section 5.2.2 to include thisrecommendation. We note however that there are some serious limitations to the types ofindicators available for various stressors, in terms of their specificity for various stressors,as well as spatial <strong>and</strong> temporal coverage. We have also included discussion on future typesof analyses that may be valuable to conduct with these <strong>data</strong>.The report examines a wide range of potential factors that might explain changes in<strong>sockeye</strong> <strong>salmon</strong> productivity. The assemblage of <strong>data</strong> <strong>and</strong> analyses for <strong>sockeye</strong>populations spread throughout the Pacific northwest represents a meta-analyticapproach that is more powerful than analyses on single stocks.This Project 6 report is heavily based on other reports, so it is difficult to identify uniquestrengths.WeaknessesThis report attempted to <strong>synthesis</strong>e a vast amount of information in a short period oftime. Like any report/paper that attempts a broad review <strong>and</strong> <strong>synthesis</strong>, it sometimesstruggles to draw conclusions <strong>and</strong> recommendations that are unique compared to thesource reports. Many of the critical comments below are probably a reflection of anoutsider’s view of this struggle.The conceptual model developed in this report does not live up to its intendedpurpose; that is, to "organize complex relationships among factors". What is describedas a conceptual model is really just a life-history sequence connected to a list ofpotential explanatory "factors" in a linear way. There are no feedbacks or even basicdirectional effects indicated (i.e., "+", "-", or "+/-") for any of the factors, possiblybecause all of the factors are assumed to have negative <strong>impacts</strong> only. It is commonscientific knowledge that <strong>salmon</strong> recruitment is based on survival through a series ofdensity-dependent life stages – so a negative effect in one stage can be compensatedby a positive effect in a subsequent stage. Where is this basic feature represented in137
the conceptual model?Response: Our conceptual model (Figure 3.3.-1) is meant to provide an overview of thepotential interactions amongst purported stressors to a broad set of audiences for thisreport, that include (in order of priority): Judge Cohen, Commission staff, Commissionparticipants, the public, <strong>and</strong> scientists. At the Nov. 30 to Dec. 1 workshop, a similar draftconceptual model was presented – all of the participants who provided feedback suggestedthat this model was already too complex for the target audiences (as noted in Appendix 6).We nevertheless decided to maintain that level of complexity in this report to illustrate thefactors potentially affecting each life history stage, as discussed within the CohenCommission technical reports. We believe that adding more complexity to Figure 3.3-1 assuggested (i.e., feedback loops, +, -, +/- along each arrow), while very helpful for building aquantitative model, would be inappropriate for the intended purposes <strong>and</strong> audience. Wehave however updated the caption on Figure 3.3-1, <strong>and</strong> redrafted Figure 2.3-1 to reflect theimportant processes you describe.The linear, correlative approach taken in the report has failed to explain much in theway of <strong>salmon</strong> population dynamics despite decades of work. In fact, prominentscientists have doubted our ability to link recruitment to environmental factors for morethan two decades. Myers (1998), for example, raised such concern based on dismalperformance of correlations in his re-analysis of over 50 recruitment-environmentcorrelations: "The utility of spending large amounts of public research funding toestablish predictions of recruitment based upon environmental indices should thereforebe questioned (Walters <strong>and</strong> Collie 1998; Walters 1989)". It appears that theseinfluential works in fisheries science were not consulted at all for this report even thoughthe core topics are the same.Response: It isn’t clear from these comments whether you are referring to our qualitativesyntheses of evidence, our quantitative <strong>data</strong> analyses, or both. We’ll address each in turn.Qualitative syntheses of evidence. Thank you for reminding us of these papers (Walters <strong>and</strong>Collie 1988, Walters 1989, Myers 1998), <strong>and</strong> the very real constraints on predictingrecruitment of fish populations. These will be useful to work into the introductoryparagraph to section 3.1. All three of these papers are focused on the difficulties ofpredicting recruitment of fish populations for the purposes of fisheries management,including the lack of persistence of environment-recruitment correlations. We agree withthese authors’ conclusions <strong>and</strong> indeed emphasized these very challenges in section 3.1,where we noted the inaccuracy of pre-season predictions of <strong>sockeye</strong> returns (as evaluatedby English et al. 2011). However, our qualitative <strong>synthesis</strong> is not focused on predictingfuture recruitment; it is a retrospective ecological risk assessment or RERA. As we note insection 3.3.5 when describing our RERA approach: “Because this method is an inherentlyretrospective form of analysis, the results cannot be used to make future predictions.” OurRERA approach seeks to reduce the likelihood of factors which show weak evidence ofexposure, <strong>and</strong> weak / no correlations with observed patterns of changing <strong>sockeye</strong>productivity; we are not attempting to predict recruitment with those covariates which138
show stronger correlations. Hence, while the caveats you raise are important reminders(<strong>and</strong> have now been added to section 5.2.2 as well as section 3.3.5), they are not a legitimatecriticism of our explicitly retrospective approach.Quantitative analyses. We acknowledge that there are many non-linear <strong>and</strong> otherapproaches which could also be applied to our <strong>data</strong>base, but did not have enough time toapply them. As indicated above, both Appendix 4 <strong>and</strong> section 5.2.2 now mention alternativeapproaches. Our broad, multi-population analyses actually followed several of therecommendations of Myers (1998, pg. 297 “How can research be improved”), including hisfirst recommendation:“Test general hypotheses. By examining many populations at once, it should bepossible to detect general patterns. For example, the sign of the correlation betweenenvironmental factors corresponds to that predicted at the limit of the range, i.e., atthe colder limit of a species range one would expect a positive relationship withtemperature, <strong>and</strong> a negative one at the warmer limit of the range”.The analysis of 64 stocks by Peterman <strong>and</strong> Dorner is consistent with this principle; we didnot however have sufficient <strong>data</strong> on environmental covariates to include non-<strong>Fraser</strong><strong>sockeye</strong> stocks in our retrospective quantitative analyses.2. Evaluate the interpretation of the available <strong>data</strong>, <strong>and</strong> the validity of any derivedconclusions. Overall, does the report represent the best scientific interpretationof the available <strong>data</strong>?It is difficult to determine the validity of the quantitative analyses because there is limitedinformation presented on the alternative model fits. In particular, I did not find anyindication of how much variation in <strong>salmon</strong> productivity is explained by the alternativemodels (i.e., R 2 values).Response: As we were implementing the analyses we focused on reporting AIC’s for thepurpose of model comparison as we were only thinking about relative performance ofdifferent models rather than absolute performance of individual models. In hindsight weshould have written the code to extract all of the relevant information so that we could alsohave reported R 2 values. Given that our analysis was retrospective <strong>and</strong> we were not tryingto generate a predictive model (so the omission is less serious), as well as the limited timewe had to respond to reviewers feedback we have not generated R 2 values.As stated in the report, the multiple regression analyses are "constrained by thesmallest independent <strong>data</strong>sets" because of the AIC-based hypothesis-testing approachthat was taken. I'm a bit surprised that a Bayesian estimation approach was notconsidered – such an approach would provide the necessary "weight of evidence" in theform of a probability distribution on parameters associated with each factor rather thanthe AIC "in/out" result. Bayesian methods are also well-suited to dealing with multiple<strong>data</strong>sets of varying quality, as well as possible spatial <strong>and</strong> temporal autocorrelation intime-series.139
Response: As discussed above, we did not have time to implement such approaches, thoughwe have now exp<strong>and</strong>ed our description of alternative modelling approaches in Appendix 3.We agree with the reviewer that simple in/out selection criteria to identify the so called‘best’ model is not a good approach. We used a weight of evidence or support approach tointerpret the alternative c<strong>and</strong>idate models rather than simply presenting the ‘best’ model<strong>and</strong> assuming this was correct.Most interpretations in this report are re-statements of conclusions/observations drawnin other reports. However, here are two examples from this report of incorrectinterpretations of stock dynamics that make me doubt their "best" scientificinterpretations:a. On page 39, that authors incorrectly state that cyclic variation in abundance is acondition for delayed-density-dependence. In fact, cyclic variation is one potential resultof a delayed-density-dependent process, <strong>and</strong> not all delayed-density-dependentprocesses show cyclic variation in abundance.Response: This is a helpful clarification. Peterman <strong>and</strong> Dorner (pers. comm.) confirm thatdelayed density-dependence doesn't necessarily have to lead to a cyclic dominance pattern.It all depends on whether the mechanisms involved combine with life history traits in a waythat generates <strong>and</strong> maintains a persistent cycle. The absence of regular wide-rangingfluctuations makes it less likely that delayed density dependence plays a strong role, butdoesn't completely preclude the possibility that it is having an impact. We have rephrasedthis part of our report to say:Peterman et al. (2010; Section 4.7) noted that stocks outside of the <strong>Fraser</strong> Basinusually do not have such strong <strong>and</strong> regular fluctuations in abundance; theytherefore concluded that delayed density dependence was not a likely mechanismfor observed declines in non-<strong>Fraser</strong> <strong>sockeye</strong> stocks.b. Trends in stock productivity are incorrectly described in Appendix 4 figure captions.Declining ln(R/S) over time does not indicate that a "stock has been in decline" (FigureA4-3) or that there is "a non-zero trend in the L. Shuswap stock" (Figure A4-4), <strong>and</strong> soon. This is pretty basic knowledge that will confuse readers who are looking fordeclining trends in stock abundance – these are actually trends in indices of stockproductivity. In some cases, the actual stock abundance has been increasing.Response: The errors in the figure captions for Figures A4-3 <strong>and</strong> A4-4 were oversights, <strong>and</strong>have been corrected. However, we have decided to summarize these results in tabularformat rather than figures, so the original figures have been removed.3. Are there additional quantitative or qualitative ways to evaluate the subjectarea not considered in this report? How could the analysis be improved?As noted above, a Bayesian approach would allow most, if not all, the <strong>data</strong> to be utilizedmore in characterizing, <strong>and</strong> possibly explaining, the shared productivity patterns among140
<strong>Fraser</strong> <strong>and</strong> non-<strong>Fraser</strong> <strong>sockeye</strong> populations. Hierarchical Bayesian methods areincreasingly common in applied fisheries science, <strong>and</strong> this particular case would seemto benefit from information-sharing among multiple stocks.Response: As discussed above, we did not have time to implement such approaches, thoughwe have now exp<strong>and</strong>ed our description of alternative modelling approaches.I expected this report on <strong>cumulative</strong> effects to provide a "systems" view of <strong>sockeye</strong><strong>salmon</strong> dynamics. That is, factors affecting <strong>sockeye</strong> dynamics do not necessarilyoperate independently, unidirectionally (i.e., all arrows point to only <strong>sockeye</strong>), <strong>and</strong>linearly. Sockeye <strong>salmon</strong> populations influence, <strong>and</strong> are influenced by, many potentialfeedbacks within freshwater, river, <strong>and</strong> oceanic ecosystems.Response: We agree, <strong>and</strong> our conceptual model (while not representing all interactions forreasons stated above) do show various interactions amongst factors. However, our terms ofreference (Appendix 1) as well as those of the Cohen Commission(http://www.cohencommission.ca/en/TermsOfReference.php) are explicitly <strong>sockeye</strong>-centric,rather than ecosystem-centric. Therefore, we have been more focused on how variousecosystem stressors affect <strong>sockeye</strong>, rather than the reverse effects (how <strong>sockeye</strong> affectecosystems). To provide a more “systems” view, we’ve added some text under thediscussions of Plausible Mechanisms (e.g., in Section 4.2.1, we note that decliningabundances of <strong>sockeye</strong> result in less nutrients being transferred from marine to freshwaterecosystems, with potential negative effects on both subsequent generations of <strong>sockeye</strong> <strong>and</strong>other ecosystem components). In section 4.4.1, we discuss various ecosystem processesaffecting the degree of predation on <strong>sockeye</strong> in inshore areas. As discussed above, we havementioned feedbacks in Figures 3.3.1 <strong>and</strong> 2.3.1.This may reflect my ignorance, but has any research been done to determine whetherthe observed pattern in productivity is an expected result of Ricker-type stock-recruitdynamics? Are <strong>sockeye</strong> populations over-shooting some capacity limits <strong>and</strong> thereforeshowing natural signs of suppressed productivity? The abundances of <strong>sockeye</strong> duringthe 1990s <strong>and</strong> early 2000s were very high all over the northeast Pacific (includingAlaska), which may have lead to covariation in ocean growth <strong>and</strong> survival over broadspatial scales. I am not aware of recent research examining among-stock densitydependencein ocean survival of <strong>sockeye</strong>, even though it might be possible. Scientistshave argued for decades that massive enhancement of Japanese chum <strong>salmon</strong>suppresses growth of North American chum <strong>salmon</strong>, so I wonder why similar argumentshave not been explored for <strong>sockeye</strong>.Response: The regression models we applied included Ricker-model representations ofdensity dependence for each stock. Ruggerone et al. (2010) have an excellent summary oftrends in wild <strong>and</strong> hatchery <strong>salmon</strong> populations, <strong>and</strong> note that hatchery-raised chum form62% of the combined total wild <strong>and</strong> hatchery <strong>salmon</strong> abundance. They also discuss thepotential for a “tragedy of the commons” effect in the North Pacific. Our analyses of theeffects of pink <strong>salmon</strong> abundance reflect potential competitive <strong>impacts</strong> of wild plus141
hatchery pinks on <strong>sockeye</strong>. Consistent with the need to have more of a systems view, wehave included a discussion of these effects in section 4.4.1.There is practically no consideration of the uncertainty in any of the quantitativeanalyses. Yet, the paper makes some rather sweeping recommendations about thetypes of research that are needed to better underst<strong>and</strong> (<strong>and</strong> manage) <strong>Fraser</strong> <strong>River</strong><strong>sockeye</strong>. I don't see how these recommendations can be made in the absence ofknowledge about the potential information/value gains from research.Response: Model selection uncertainty has been considered. We are only looking atinterpretive value retrospectively, not attempting to make predictions prospectively, so wedid not focus on predictive uncertainty.Our recommendations for research <strong>and</strong> monitoring are largely drawn from the qualitativeanalyses <strong>and</strong> work in Commission technical reports, rather than from our own quantitativeanalyses. We have listed several questions in section 5.2.2 which specifically address thepotential information value gains from research, <strong>and</strong> highlight the need for furtherprioritization to select the most cost-effective activities.4. Are the recommendations provided in this report supportable? Do you haveany further recommendations to add?The recommendations are mainly a summary of possible areas for future research thatcould be done, prioritized according to explanatory importance <strong>and</strong> relevance tomanagement. It is hard to disagree with most of the recommendations because the listcovers just about every aspect of <strong>sockeye</strong> life history <strong>and</strong> fisheries. Clearly, somethought needs to be put into how to further prioritize <strong>and</strong> reduce such a list.I recommend a comprehensive assessment of what research should be done givenlimited resources.Response: We agree. That is why we discussed 4 prioritization questions in section 5.2.2.5. What information, if any, should be collected in the future to improve ourunderst<strong>and</strong>ing of this subject area?Proposing new information to be collected does not seem to be a reasonable request atthis point. I've spent two days (+) reviewing this report, whereas the authors of this <strong>and</strong>supporting reports have spent weeks assembling information on the topic. What I dosuggest is a small, informal working group tasked with thinking about <strong>sockeye</strong> <strong>salmon</strong>dynamics from alternative perspectives than the default correlative viewpoint. Thisgroup might generate new insights about key processes <strong>and</strong> information needs.Response: We agree. The reviewer’s suggestion would be an excellent “next step”. The <strong>data</strong>that has been collected from the Cohen Commission technical projects are now available in142
a single <strong>data</strong>base for other researchers <strong>and</strong> scientists to use. These <strong>data</strong> could be examinedusing many other analytical techniques. In Appendix 3 (summary in section 5.2.2), we havesuggested some further methods that might yield interesting results. Such a working groupwould be able to exp<strong>and</strong> that list further <strong>and</strong> decide to prioritize those expected to providethe most benefit. Furthermore, we have relied on the contractors of other projects toforward the most appropriate <strong>data</strong> sets but have not actively searched for additional <strong>data</strong>.However, this working group may also be able to improve upon the <strong>data</strong>base by identifyinggaps for particular stressors or life stages where some <strong>data</strong> is known to exist but was notavailable within the Cohen Commission technical reports.6. Please provide any specific comments for the authors.Overall, there needs to be a major clean up of the text to make it more readable.Please fix ambiguous references, especially beginning sentences (i.e., search for "this","these", "It", "It's"), over-use <strong>and</strong> misuse of "it's", apparently r<strong>and</strong>om use of italic <strong>and</strong>bold fonts, incorrect use of "which" vs "that", useless jargon (e.g., what is a "focal"VEC?), etc.Response: The text has been corrected as suggested.We recognize that the draft report contained an over usage of contractions <strong>and</strong> that suchlanguage is not appropriate for scientific writing – all such words have been replaced. Tothe extent possible, we have examined the usage of “which” vs. “that” throughout thedocument <strong>and</strong> corrected it where necessary.The second paragraph of the Executive Summary leaves the reader hanging with "Thisis the pattern that we seek to explain", <strong>and</strong> then no pattern is actually described.Presumably, the authors mean the patterns described in the two referenced papers <strong>and</strong>the text that follows on the next page. Please move that text to the second paragraphwhere it belongs.Response: The text has been corrected as suggested.Another sentence "Major <strong>data</strong> gaps led us to the outcome that no conclusion waspossible". Hopefully, the authors meant to include the phrase "In some cases", justbefore "Major".Response: The text has been corrected as suggested.P2, par3: the last sentence does not seem accurate. The statement of work did notdescribe any intent to guide "management strategies".Response: The text has been corrected as suggested.Statements like: "None of the factors considered for Stage 2 are likely to have shown a143
sudden worsening in 2007…" should be re-worded to, e.g., "None of the factorsconsidered for Stage 2 are likely to have been much worse in 2007…or much better in2008…"Response: The text has been corrected as suggested.P6, par1: The text "…CEA should be focused on VECs rather than projects…" needs tobe reworded because the meaning is not clear until the whole paragraph is finished. Ithink the authors mean that the VECs should be the fundamental unit of assessmentrather than projects.Response: The text has been reworded to improve clarity.Section 3.1, par1: This paragraph is nonsense <strong>and</strong> should be deleted. It is a convenient,yet distracting story cooked up by ecologists who have never actually done rocketscience…usually because that field was too hard for them to get into in the first place.Please communicate some of the very real issues of complexity (e.g., the Peterman <strong>and</strong>Dorner quote) in fisheries ecology if that is the intent.Response: We believe that the comparison of fisheries science <strong>and</strong> rocket science is a veryhelpful metaphor, given the various audiences for this report. Nevertheless we have madeseveral modifications, incorporating some of the concerns you’ve raised <strong>and</strong> the referencesthat you’ve discussed above. The Cohen Commission defined the target audiences for theTechnical Reports in this order of priority: Judge Cohen, the Cohen Commission scientific<strong>and</strong> legal staff, the Cohen Commission participants, concerned members of the public, <strong>and</strong>then fellow scientists. This paragraph is not intended to be a rigorous comparison offisheries ecology versus rocket science, but merely an illustration of the “very real issues ofcomplexity” the reviewer describes in a manner that is hopefully accessible to all audiences.The reviewer raises a valid point, that none of the authors (<strong>and</strong> to our knowledge none ofthe reviewers <strong>and</strong> likely very few other readers) have actually done rocket science – it is afair implication that we may not fully grasp exactly how complicated real rocket science is,but we also believe that many members of our target audiences may also not fully grasphow complicated real fisheries science is. We have therefore kept the analogy but removedany claim that fisheries science is more difficult than rocket science.Section 3.1, par3: the final sentence in this paragraph appears over-stated. Flowerystatements like "forces that have never before been observed" <strong>and</strong> "…with cascadinginfluences…" are more appropriate in a TV documentary rather than a serious scientificinvestigation. Statements like these are not consistent with the uninformative <strong>and</strong>/orweak effects generally found in this report.Response: The text has been modified so as not to appear overstated.P57: highlighting "very likely" implies that Peterman's notion of "very likely" is the sameas qualitatively defined in this report, <strong>and</strong> I doubt that is true.144
Response: We have removed the italics from the evaluations provided by both Peterman etal. (2010) <strong>and</strong> the participants of the Cohen Commission workshop so that such formattingdoes not imply that the ratings from those two assessments are identical to the similarlynamed ratings reported by us in our qualitative evaluation. We have also added a footnoteto explicitly address the differences between these approaches.P58: Why are comparisons made among models here when the actual approach is notdescribed until p77?Response: We have added a new section (3.3.6) that provides a high-level overview of ourmethodology such that readers will be introduced to the approach prior to being shownany results (i.e. in Section 4.4.5 that the reviewer identifies <strong>and</strong> in Section 4.7.2) <strong>and</strong> will notneed to consult the appendices in order to underst<strong>and</strong> the results presented.The change-point analyses don’t' seem particularly valuable, especially when there isno substantial <strong>synthesis</strong> of the results.Response: We have kept these analyses <strong>and</strong> exp<strong>and</strong>ed upon our justification for includingthem <strong>and</strong> improved the discussion of their results, in both section 4.1 <strong>and</strong> Appendix 4. Wewanted to explore the commonly quoted statements regarding the productivity of <strong>Fraser</strong><strong>River</strong> <strong>sockeye</strong> stock being in decline since approximately 1990. We wanted to have anobjective assessment of when <strong>and</strong> how strong trends in each of the <strong>sockeye</strong> stocks were,hypothesizing that there may be substantial differences among stocks in the timing <strong>and</strong>strength of declines in productivity. If there were groups of stocks with similar changepoints,the similarities among those particular stocks might indicate important factors.These <strong>data</strong> were also available long before any of the covariate <strong>data</strong> from the othertechnical reports. Other methods of determining the timing of productivity changes areincluded in Peterman <strong>and</strong> Dorner (2011) <strong>and</strong> McKinnell et al. (2011); different analyticalapproaches generate somewhat different results, but the overall conclusions are similar.P63: This report seems to overuse terms like "striking" <strong>and</strong> "dramatic".Response: Those terms have been removed.Figure 4.5-2 (this figure has no labels): if this is a time-series, then the points should beconnected by a line. That way, inter-annual variability is easier to see.Response: This graph was extracted as an image from the publication cited. We were notable to acquire the underlying <strong>data</strong> before submitting the draft report <strong>and</strong> therefore it waspresented in its original form. We have since acquired the raw <strong>data</strong>, updated to 2010. Wehave now graphed the same <strong>data</strong> without a trend line but including labels for the axes. Thisfigure is a time-series, but these <strong>data</strong> should not be connected by a line because the variablerepresents a discrete annual event (i.e. return migration). Representing these <strong>data</strong> with aline graph would incorrectly imply this is a continuous measure for which values between145
annual <strong>data</strong> points can be interpolated.Hasn't the total <strong>sockeye</strong> return been increasing along a similar trend to the diversionrate? Is it possible that the average diversion rate (~0.4-0.5) was actually typical backwhen there were a lot more <strong>sockeye</strong> around (i.e., prior to Hell's Gate slide), <strong>and</strong> so thispattern is a return to normal migration patterns?Response: We have not attempted to provide any explanation for theses apparent changes.We simply identify diversion rate <strong>and</strong> age-type proportions as other potential responsevariables that appear to have also experienced changes over recent decades <strong>and</strong> suggestthat work to increase our underst<strong>and</strong>ing of these patterns would likely be beneficial. Theycould be responding to the same factors that have been driving changes in productivity, orsimilar factors, or completely different factors. The reviewer asks an excellent question tobe explored in further research – are these patterns shifting away from “normal” patternsor returning toward “normal” patterns in a long recovery following the catastrophic Hell’sGate slide in 1913? This question is worth further investigation but the time series availableto us cannot offer any insights for that question.We have not conducted any quantitative analyses for this question, but offer the followingqualitative observations based only on a visual examination of the <strong>data</strong>. First, the diversionrate <strong>data</strong> appears to indicate a possible shift in the late 1970s to a state of higher diversionrates on average but with greater variability rather than a gradual increase. The “trend”line in Figure 4.5-2 was present in the original figure extracted from Levy (2006); since weonly had access to this figure <strong>and</strong> did not have access to the original <strong>data</strong>, we were unableto remove this trend line (but have removed it in this final report). Second, the patterns in<strong>sockeye</strong> <strong>salmon</strong> returns (e.g. Figure 4.1-5 shows total returns by brood year cycle) do notappear (based on visual inspection) to correspond with the diversion rate pattern. Sockeyereturns were increasing over the 1960s, 1970s, <strong>and</strong> 1980s (i.e. the pattern starts well beforeany notable changes in diversion rate) <strong>and</strong> have been decreasing since approximately 1990(i.e. the pattern reverses with no notable change in diversion rates). However, these areonly preliminary qualitative observations <strong>and</strong> this deserves further quantitativeexamination.P65: it is not clear what the "definitive correlation" compares.Response: This sentence has been rewritten to be a clearer reflection of the idea itreferences.There is considerable repetition of information/review under Stages 3 <strong>and</strong> 4: can thesebe combined into one section?Response: We recognize that there is some repetition between these stages. In some casesthe information, analyses <strong>and</strong> knowledge presented in other technical reports did not, orwas not able to, clearly distinguish between these two marine-based life stages <strong>and</strong>therefore similar evidence was available for both stages. We have tried to highlight the146
evidence unique to each life stage. However, we do not feel it would be appropriate tocombine these two stages into one section because there are also cases where not only is theevidence different between the two stages, but this evidence leads to different conclusionsbetween stages regarding the likelihood of particular factors. It therefore seems prudent tomaintain this distinction despite the consequence of there being some repetition.P69: "pre-spawn mortality" is only measured for females, correct?Response: Yes. From Hinch <strong>and</strong> Martins (section 2.7): “Pre-spawn mortality is defined asfemales that have arrived on spawning grounds but die with most of their eggs retained intheir body.” We have defined this term in our report.P69: I don't see the point of comparing upriver migrating adults with downriver migratingsmolts here.Response: We have removed this paragraph.P70: the report should not bring up the topic of <strong>sockeye</strong> genetic adaptation totemperature regimes over thous<strong>and</strong>s of years, <strong>and</strong> then only talk about the last 60years.Response: We have removed the phrase “over thous<strong>and</strong>s of years”.Does "total summer flows" mean "peak summer flows"?Response: No. The source of this text was section 1.5.1 from Hinch <strong>and</strong> Martins (2011),which reads as follows:“In the <strong>Fraser</strong> <strong>River</strong>, the date for ⅓ <strong>and</strong> ½ of the year <strong>cumulative</strong> flow has beenoccurring progressively earlier at the rate of 1.1 <strong>and</strong> 0.9 days per decade,respectively, since the 1950s (Foreman et al. 2001). Despite the shift towards anearlier onset of the spring freshet, there have been no significant changes in totalsummer flows of the <strong>Fraser</strong> <strong>River</strong> (Patterson et al. 2007a).” [italics added]We have clarified the wording in our report, so that it now reads as follows:“While there have been no significant changes in the total <strong>cumulative</strong> flow over thesummer season, more of the <strong>cumulative</strong> summer flow is arriving earlier in the year.One measure is the date at which the first half of the <strong>cumulative</strong> summer flowsoccurs, which is happening a day earlier per decade.”P72: the reference to Figure 4.5-2 should point to Figure 4.6-2Response: That has been corrected.P80: remove the last two paragraphs about correlation vs causation. This seems ratherpedantic.147
Response: We have kept these two paragraphs. We feel that it may be valuable to someaudience members. As discussed in Section 1 of this review, this report is intended formany audiences who will vary in their levels of technical proficiency. The prioritization ofthese audiences has also been clearly defined for us (see Section 1).P158: why are differences in stock composition so "striking"? Isn't that just a result ofthe dominant four-year life history? I also don't see an actual comparison of the 2009<strong>and</strong> 2010 returns referred to at the bottom of p158.Response: The reviewer is correct – the differences in stock composition are a result of thedominant four-year life history. The purpose of these graphs is simply to illustrate thatthere are in fact substantial differences in stock composition among the cohorts. This maybe a fairly obvious observation to those with a scientific background in <strong>sockeye</strong> <strong>salmon</strong>;however, based on our observations of media coverage <strong>and</strong> other public fora it appearsthat this difference in stock composition among cohorts is often not recognized. In thepublic discourse, the poor 2009 returns are often compared/contrasted with the high 2010returns (these are the “comparisons” to which we refer), without acknowledging that thesituation is actually more complicated since not only do the two years come from differentgenerations/cycles, but the composition of each is distinctly different. These graphs showquite clearly that 2009 vs 2010 is not a simple “apples-to-apples” comparison.The "Key things we need to know better" seem to include just about everything, <strong>and</strong> Isomehow doubt that we need to know all of it.Response: Within each life stage, we limited ourselves to 4-6 key recommendations, selectedfrom a much longer list. We strongly agree that further prioritization is required, <strong>and</strong> asnoted in section 5.2.2, have suggested some questions <strong>and</strong> procedures to help in thatprocess.148
Report Title: Data Synthesis <strong>and</strong> Cumulative ImpactsReviewer Name: Rick RoutledgeDate: March 20, 20111. Identify the strengths <strong>and</strong> weaknesses of this report.• I am generally in agreement with the conclusions of this report. Subject to thelimitations associated with both (i) the scope of the “Statement of Work” <strong>and</strong> (ii)weaknesses in the underlying base of knowledge <strong>and</strong> <strong>data</strong>, the team has done asolid job of the task put to them.• I also concur with the need for substantive caveats on the conclusions that canbe drawn from such a study, though I do recommend that key weaknesses in thequantitative assessments need to be highlighted more effectively. I alsorecommend that there be more qualitative discussion, perhaps with examplesfrom other situations, of the inherent weaknesses in such approaches toanalyzing the behaviour of complex interactions that encompass such a diverse,geographically extensive set of ecosystems.Response: We agree with this recommendation. Section 3.2 already provides severalcaveats. We have added some more discussion <strong>and</strong> caveats to the Executive Summary (endof Conclusions), the start of section 3.1, Section 4, Appendix 4, <strong>and</strong> end of Section 5.1. Thelimitations of this method have been explicitly described in Appendix 3.• Nonetheless, I have some concerns regarding weaknesses in technical details ofthe analyses to which I feel that the team ought to pay more attention – at leastinsofar as to give these weaknesses greater prominence in the report. Some ofthem are clearly far too complex <strong>and</strong> time consuming to implement in the limitedtime frame of this study.Response: This feedback is further elaborated upon, <strong>and</strong> responded to, in Part 6 below.2. Evaluate the interpretation of the available <strong>data</strong>, <strong>and</strong> the validity of any derivedconclusions. Overall, does the report represent the best scientific interpretationof the available <strong>data</strong>?Please see detailed comments in the specific comments to the authors below.3. Are there additional quantitative or qualitative ways to evaluate the subjectarea not considered in this report? How could the analysis be improved?Please see detailed comments in the specific comments to the authors below.4. Are the recommendations provided in this report supportable? Do you haveany further recommendations to add?Please see detailed comments in the specific comments to the authors below.149
5. What information, if any, should be collected in the future to improve ourunderst<strong>and</strong>ing of this subject area?In addition to my comments below, I would like to emphasize my concerns over theweakness of a multiple regression-style statistical assessment of such a potentiallycomplex phenomenon as the <strong>cumulative</strong> impact of multiple stressors. Although it canprovide useful hints regarding major potential stressors, it is not an effective tool fordetecting nonlinear relationships <strong>and</strong> non-additive interactions. The latter weaknessseems particularly critical in an assessment of <strong>cumulative</strong> <strong>impacts</strong>.Response: We agree, <strong>and</strong> have added text regarding this issue to Appendix 3.Also, the report correctly highlighted the critical lack of information on pathogens. Thisstrikes me as a highly important knowledge gap that warrants much immediateattention.Response: This feedback is further elaborated upon, <strong>and</strong> responded to, in Part 6 below.6. Please provide any specific comments for the authors.I am generally in agreement with the conclusions of this report. Subject to the limitationsassociated with both (i) the scope of the “Statement of Work” <strong>and</strong> (ii) weaknesses in theunderlying base of knowledge <strong>and</strong> <strong>data</strong>, the team has done a solid job of the task put tothem.I also concur with the need for substantive caveats on the conclusions that can bedrawn from such a study, though I do recommend that key weaknesses in thequantitative assessments be highlighted more effectively. I also recommend that therebe more qualitative discussion, perhaps with examples from other situations, of theinherent weaknesses in such approaches to analyzing the behaviour of complexinteractions that encompass such a diverse, geographically extensive set ofecosystems.I also have some concerns regarding weaknesses in technical details of the analyses towhich I feel that the team ought to pay more attention – at least insofar as to give theseweaknesses greater prominence in the report. Some of them are clearly far too complex<strong>and</strong> time consuming to be addressed in the limited time frame of this study.Following are more specific comments.1. The main conclusions to my mind are as follows:a. That the early marine environment emerges as a major potential source ofthe decline in productivity.b. That the majority of potential factors associated with the freshwaterenvironment can be rated as unlikely to be major contributors.c. That pathogens emerge as the most critical knowledge gap.I view these conclusions as significant, valuable corroboration of widespreadimpressions <strong>and</strong> subjective assessments <strong>and</strong> opinions. Limitations of the multipleregression approach notwithst<strong>and</strong>ing, the quantitative analysis lends valuablecredence to these conclusions.150
Response: We have further emphasized the early marine environment in ourrecommendations for future work, in both the Executive Summary <strong>and</strong> Section 5.2.2. Wehave further emphasized the importance of the knowledge gap on pathogens, especially inour recommendations. We believe that we have already placed sufficient emphasis onPoint ‘b’, regarding the freshwater environment.2. The following key, inherent weaknesses in the multiple regression approachneed to be more solidly described <strong>and</strong> highlighted.a. Linearity: By necessity, most of the analyses appear to have assumed thateach factor, on its own, contributes a linear effect. There was an attemptto consider the so-called hockey stick model with a linear effect kicking inafter a threshold was passed, but this approach is a relatively simplisticway to address this issue. There is typically inadequate justification forassuming the presence of a sharp threshold, <strong>and</strong> <strong>data</strong> such as in FigureA3.5-3 are inadequate even for distinguishing between a hockey-stickmodel vs. a parabolic relationship let alone identifying the location of athreshold or the start of a downward trend 17 . Additivity: It seems to methat, when assessing <strong>cumulative</strong> <strong>impacts</strong>, the potential for nonlinear <strong>and</strong>non-additive interactions is key. The authors address a related issue intheir Figure 2.3-1, but this figure seems to be focused primarily on theextent to which multiple, minor stressors might accumulate, potentiallyover several life stages, but in a sort of additive fashion, to produce a largeimpact over the entire fish life cycle. It does not address the potential forsome factor, perhaps a pollutant encountered in the Salish Sea, topossibly combine with a shortage of food in Queen Charlotte Sound toproduce a devastating impact on marine survival when either of thesefactors on its own might not present the fish with a significant challenge.b. Several c<strong>and</strong>idate explanatory variables are in fact functions over time(e.g., sea surface salinity or river discharge). The authors sensiblyattempted to use basic background information, such as the timing of themigration run, to reduce these functions to simple averages over areasonable time window. However, in my work on <strong>River</strong>s Inlet <strong>sockeye</strong><strong>salmon</strong>, I have found that there can be surprising timing anomalies whosecauses are not immediately clear – sometimes even after they have cometo our attention. I would recommend that this potential be highlighted aswell. In addition, though there is insufficient time for the authors to developa functional regression analysis, this technique can address these sorts ofissues more definitively. 1817 Chiu, G. Lockhart, R. <strong>and</strong> Routledge, R. 2006. Journal of the American Statistical Association, 101::542–553.18 Ainsworth, L.M., Routledge, R., <strong>and</strong> Cao, J. 2011. Functional Data Analysis in Ecosystem Research:the Decline of Oweekeno Lake Sockeye Salmon <strong>and</strong> Wannock <strong>River</strong> Flow. Journal of Agricultural,Biological, <strong>and</strong> Ecological Statistics. Available online (DOI: 10.1007/s13253-010-0049-z).151
c. I anticipate that a collection of factors whose <strong>impacts</strong> were felt through acombination of time lags on non-additive <strong>and</strong> nonlinear stress <strong>impacts</strong>would be very hard, if not impossible, to detect with this sort of multipleregression analysis – especially when so little is known about some keyfactors like pathogens.Response: These are all excellent points. We had only limited time to conduct statisticalanalyses, <strong>and</strong> so we chose the simplest approaches. In Appendix 3 <strong>and</strong> a new section in themain report (3.3.6), we acknowledge the weaknesses <strong>and</strong> limitations of our approaches. Webelieve that the <strong>data</strong> limitations (i.e., appropriate covariates reflecting the impact pathwaysof concern; sufficient levels of contrast) are at least as serious a problem as the analyticalproblems.To address specific components of the reviewer’s comments:a) In Section 4.7, we discuss potential <strong>cumulative</strong> effects over the entire life cycle,though we also note the difficulty of determining the form (e.g. additive or nonadditive),magnitude, location <strong>and</strong> timing of such effects. We have also addedfurther discussion on the potential for other functional forms for the c<strong>and</strong>idatemodels (i.e. non-linear covariates, interactions) in our descriptions of the methods.The description <strong>and</strong> rationale for the approach we used with the change-pointanalyses has also been exp<strong>and</strong>ed.b) We have discussed functional regression analysis in Appendix 3 as a potentialtechnique to be used in the future.c) We agree.3. These inherent weaknesses notwithst<strong>and</strong>ing, I believe that the authors usedgood judgment in applying these techniques. In particular, I support their use ofscientific knowledge <strong>and</strong> common sense in limiting the c<strong>and</strong>idate factors for themultiple regression models.4. I would encourage the authors to provide examples of instances in which the sortof approach taken here would not have brought fundamental, underlying causesto light. For example, it seems unlikely that a multiple regression analysis withoutappropriate time lags could have drawn anyone’s attention to the keyphenomenon of bioaccumulation in the early days of research on ecological<strong>impacts</strong> of DDT.Response: This is a good example, which we will incorporate into our discussion of thelimitations of our analyses (in Appendix 3). Other mechanisms which could cause linearregressions to miss important ecosystem linkages include non-linear relationships betweenecosystem productivity, <strong>sockeye</strong> abundance <strong>and</strong> predation (Christensen <strong>and</strong> Trites 2011,pgs. 13, 76), as well as non-linear threshold effects from contaminants (MacDonald et al.2011).152
5. I would also encourage the authors to address some of the concerns regardingpathogens that have emerged in recent Commission hearings. Although they didindeed identify that the information base on pathogens was too weak for theiranalyses, I believe that it is important that the potential for pathogens to explainmuch of the recent decline in productivity be highlighted. There are manyexamples of pathogens playing a major role in population declines – the bubonicplague being perhaps the most famous. This is an important weakness in ourcurrent knowledge base that, in my assessment, deserves a very high profile.Response: We agree. We have emphasized this critical knowledge gap in numerous places.In our recommendations (as well as in other parts of the report), we have emphasized theneed to address the lack of knowledge regarding pathogens. We have reviewed therelevant sections of the transcripts from Scott Hinch’s testimony on the topic of climatechange at the Cohen Commission, where he discusses the potential association betweendiseases <strong>and</strong> en route mortality; however, the actual topic of disease will not be heard untilAugust.6. It might also be useful for the report to highlight, where feasible, missingcontrasts that might shed light on the causes of the productivity decline. I note, inparticular, that the report pays limited attention to Harrison <strong>sockeye</strong> <strong>salmon</strong>, <strong>and</strong>does not give the determination of the early-marine migration route for thispopulation an elevated priority in the list of recommendations. I anticipate thatthis population could provide an unusually valuable contrast given the divergenttrend in the Harrison population vs. others. Also, basic knowledge of themigration routes <strong>and</strong> timing of other populations such as <strong>sockeye</strong> <strong>salmon</strong> thatspawn on the Central Coast <strong>and</strong> on the west coast of Vancouver Isl<strong>and</strong>, alongwith selected populations of other <strong>salmon</strong> species, could play a key role in siftingthrough potential causes of the decline in <strong>Fraser</strong> <strong>River</strong> <strong>sockeye</strong> <strong>salmon</strong>. I wouldencourage the authors to give such matters a higher profile in theirrecommendations.Response: This is a good point. We do discuss the Harrison stock in sections 4.3.2, 4.3.3 <strong>and</strong>4.4.7. We agree that it makes sense to elevate the priority of underst<strong>and</strong>ing the migrationroutes of Harrison <strong>sockeye</strong> (#13 in Table 5.2-1), as contrasts in their exposure to variousstressors may be most informative, given their relatively strong productivity during the lasttwo decades.7. Personally, I would not place as high a priority on some of the highlightedrecommendations, <strong>and</strong> would add some others. Here are some detailedsuggestions.a. Parental spawning…: I agree with the low rating for recommendations 1<strong>and</strong>3, but would recommend more thorough monitoring of smallerconservation units.b. Juvenile rearing…: Although the highlighted recommendations are not153
without merit, I would not give these as high a priority as otherrecommendations associated with what have been identified as morelikely sources of problems.c. Downstream migration to estuary: Given recent concerns aboutdisease <strong>and</strong> emerging evidence of high mortality rates during themigration down the estuary <strong>and</strong> through the passage inside VancouverIsl<strong>and</strong>, I would be inclined to elevate the priority for theserecommendations.d. Inshore migration: I would recommend a high priority for all of theserecommendations, including #13 on Harrison <strong>sockeye</strong> given the keycontrast that they seem capable of providing.e. Growth in North Pacific …: I agree that estimates of returns, etc.,continue to be important. Also, estimating abundance of arrivals at theGulf of Alaska seems likely to me to be very challenging <strong>and</strong> expensive,<strong>and</strong> hence I agree that this should not be awarded a high priority.Assessment of ocean conditions seems to be very important though,especially in light of the circumstantial nature of the evidence associatedwith the potential role of the volcanic eruption in contributing to the strong2010 returns. The uncertainty over the ecosystem consequences of theanomalously large phytoplankton production that it produced underscoresin my mind the importance of improving our collective underst<strong>and</strong>ing ofthis ecosystem.f. Migration back to spawning: I agree with the priority assignments tothese recommendations.Responses: All of our prioritization suggestions are preliminary, <strong>and</strong> will need to bereviewed by a well-informed panel of scientists <strong>and</strong> managers. Our responses to yourrecommendations are as follows (same lettering):a. We agree, <strong>and</strong> have increased the priority of recommendation 2, though asfor recommendation 1 we would only do this for a strategically selectedsubset of smaller CUs.b. We partly agree, <strong>and</strong> have reduced the priority of recommendation 5(conditions in rearing lakes). However, we have maintained the high priorityof recommendation 4 (smolt estimates) as we believe that it’s essential to firstdetermine the life history stages with higher levels of mortality, <strong>and</strong> then toseek the causes of such mortality. We recognize that for stocks with a historyof fry estimates only, it will be essential to continue these time series.c. For reasons mentioned under b, we have increased the priority ofrecommendation 7 (smolt survival rates), but left recommendation 8 (size<strong>and</strong> health of smolts) to be contingent upon the observation of poor lake toestuary smolt survival.d. We agree, as mentioned above.e. We believe that with the other measurements of <strong>sockeye</strong> abundance atvarious life stages, it should be possible to determine if there are unexpectedchanges in survival during the growth of adults in the Pacific. Then if such154
events occur, it should be possible through strategic alliances with otheragencies (e.g., NOAA, ADFG) to collect information on potential explanatoryvariables. We therefore have maintained oceanographic information for theGulf of Alaska at its current level of priority.155
Report Title: 6. Data Synthesis <strong>and</strong> Cumulative ImpactsReviewer Name: John D. Reynolds, Simon <strong>Fraser</strong> UniversityDate: 1 April 20111. Identify the strengths <strong>and</strong> weaknesses of this report.Strengths: well-organized, clear framework, integration of information from a largenumber of other technical reports as well as the workshop, compilation of large<strong>data</strong>base from those reports, new quantitative analyses from that <strong>data</strong>base.Thank you.Weaknesses: apparent lack of consistency about what is meant by “productivity”, needfor <strong>impacts</strong> of potential stressors to be combined more clearly into a more “<strong>cumulative</strong>”<strong>synthesis</strong>.Response: We have defined productivity in both the Executive Summary <strong>and</strong> Introduction,<strong>and</strong> have added further discussion of <strong>cumulative</strong> <strong>impacts</strong> over the life cycle in Section 4.7.2. Evaluate the interpretation of the available <strong>data</strong>, <strong>and</strong> the validity of any derivedconclusions. Overall, does the report represent the best scientific interpretationof the available <strong>data</strong>?The <strong>data</strong> interpretations seem fine, including the conclusions for <strong>impacts</strong> on each stageof the life cycle, summarized in a separate table in each section. I agree with theinterpretations, <strong>and</strong> with the reasons given.3. Are there additional quantitative or qualitative ways to evaluate the subjectarea not considered in this report? How could the analysis be improved?The basic analytical framework, based on multiple regressions <strong>and</strong> information theoreticmethods, seems fine.4. Are the recommendations provided in this report supportable? Do you haveany further recommendations to add?Yes, the recommendations seem fine. We could also add more, but the benefits offurther research <strong>and</strong> analyses beyond those suggested would need to be weighedcarefully against the costs.Response: We have added further discussion of the criteria <strong>and</strong> process that should be usedto refine <strong>and</strong> prioritize our recommendations (in Section 5.2.2).5. What information, if any, should be collected in the future to improve ourunderst<strong>and</strong>ing of this subject area?156
I don’t have anything to add beyond what has been recommended.6. Please provide any specific comments for the authors.I like the approach of considering the potential <strong>cumulative</strong> <strong>impacts</strong> from a life historyperspective of the fish, i.e. following the fish through their life cycle <strong>and</strong> consideringexposure to each potential impact along the way. It is unfortunate that the Aquaculturetechnical report was not available to the authors at the time of writing, <strong>and</strong> theCommission should bear that in mind when evaluating these interim conclusions.Response: We have reiterated this point (i.e. conclusions do not include information onaquaculture) in each of the relevant sections (i.e. Executive Summary, Coastal migrationlife stage (4.4.4, 4.4.5 <strong>and</strong> 4.4.7), <strong>and</strong> Conclusions (5.1, 5.2)).The authors have done a good job of summarizing the information from the othertechnical reports, <strong>and</strong> also compiling <strong>data</strong> from those reports so that they could do theirown integrative analyses. I agree with their view that the <strong>data</strong>base that they havecompiled could be the first step toward an important long-term resource, <strong>and</strong> I hope theCommission will consider recommendations that could lead to further development. Ihave always felt that information such as this should be much more accessible, <strong>and</strong>perhaps long-term funding could be made available to the Pacific Salmon Commissionor some other organization to take this on.Response: In response to a comment by Dr. Peterman on the form of such a <strong>data</strong>base, wehave exp<strong>and</strong>ed the discussion in Section 5.2.2.The general analytical approach, involving multiple regressions analyzed within aninformation-theoretic framework, seems like the right way to go. I agree with theauthors’ logic in using multiple partial analyses rather than attempting one gr<strong>and</strong>analysis, given missing values in <strong>data</strong> sets, <strong>and</strong> the need to account for too manyvariables at once. The authors reduced the number of variables through commonsense about which might be informative, as well as through Principal ComponentsAnalysis. They could also have considered using Variance Inflation Factors to test formulticollinearity as a basis for dropping variables, as an alternative or adjunct to the useof PCA. But as long as the PCA axes are interpretable, this approach seems fine.Response: We have substantially improved the clarity of our description of the methods weused (in a new Section 3.3.6, as well as in Appendix 3).The conclusion follows the structure of the rest of the report, in breaking up theanalyses by life stage. But I felt that what’s missing is a final section putting the lifestages back together, <strong>and</strong> integrating across all of the possible or likely stressors. Inother words, I would have liked to have seen a final section that fully tackles the“<strong>cumulative</strong>” in <strong>cumulative</strong> <strong>impacts</strong>. This would match the detailed section that wasprovided describing what <strong>cumulative</strong> <strong>impacts</strong> mean.157
Response: We have added such a discussion to Section 4.7.A comment on pagination – it’s confusing to have each section start at page 1. Below Iwill refer to the page numbers within each section, followed by the pdf electronic pagenumber.Response: We have corrected this pagination issue. The Executive Summary appears first<strong>and</strong> is not paginated. The main report (including all appendices except Appendix 6) isnumbered continuously. We have maintained the original page numbering for Appendix 6(Workshop Report) for consistency since it is a st<strong>and</strong>-alone report that has also beenreleased on its own.P. 4 / pdf 12 of the Executive Summary brings up a question concerning the terms ofreference. “While there are some survival estimates for acoustically tagged smolts,these <strong>data</strong> (which in any case only cover a few stocks) were not analyzed by any of theCohen Commission technical studies.” The published studies of acoustically taggedsmolts, e.g. smolts from Cultus Lake, are very relevant, even if not analyzed by any ofthe technical studies. The Statement of Work in Appendix 1 of this report does clearlyfocus on the other reports as the basis for material, <strong>and</strong> the authors are clear about thislater on (pdf p. 21). However, I think it’s a shame to ignore information that has beenpublished in peer-reviewed journals, just because it slipped through the cracks of theother technical reports (more on this later). There’s an additional limitation with thisapproach, which the authors are too polite to say: some of the technical reports thatthey rely on are much weaker than others, <strong>and</strong> it’s a shame to be unable to fill in thegaps left by some of them.I’m not sure what to recommend here. The authors have followed their Statement ofWork <strong>and</strong> cannot be faulted for taking a clear approach that was doable within theirtimeframe. But if there’s room for them to fill gaps left by other reports based onpublished literature here <strong>and</strong> there, I hope they <strong>and</strong> the Commission will consider thispossibility.Response: We have indeed focused our efforts on synthesizing results from the CohenCommission Technical Reports, according to the Statement of Work, <strong>and</strong> on results fromthe recent PSC workshop on <strong>Fraser</strong> <strong>River</strong> <strong>sockeye</strong> <strong>salmon</strong>. There was neither sufficienttime nor resources to complete a comprehensive literature review of information beyondthose sources discussed in the Technical Reports. Where reviewers have suggested otherinformation sources that were not included in the Technical Reports, but may be veryrelevant (e.g. the studies of acoustically tagged smolts from Cultus Lake), we have addedreferences to our report.p. 5 / pdf 13. “The evidence presented suggests that <strong>sockeye</strong> <strong>salmon</strong> in the Strait ofGeorgia have little direct exposure to human activities <strong>and</strong> development, leading to aconclusion that it is unlikely that these factors have contributed to the decline of <strong>Fraser</strong><strong>River</strong> <strong>sockeye</strong> <strong>salmon</strong>.” I would argue that exposure to <strong>salmon</strong> farms in the upper Strait158
constitutes an exposure to human activities. These farms have been shown to besignificant sources of sea lice (Price et al. PloS One, 2011) <strong>and</strong> they are a potentialsource of viral pathogens (note my emphasis on the word “potential” due to lack of clearevidence that I’m aware of). The <strong>impacts</strong> of exposure to fish farms on population trendsof <strong>Fraser</strong> <strong>sockeye</strong> are not clear, but the exposure of wild out-migrating juveniles tofarms is clear. Salmon farms may have been ignored here because the aquaculturereport is still in progress. If the authors agree with my point, that juvenile <strong>sockeye</strong> areexposed to a significant human activity in the form of <strong>salmon</strong> farms, the wording on p.59 should be changed too, as should the Conclusion.Response: The reviewer is correct - <strong>salmon</strong> farms are not currently included in the presentreport because the aquaculture report is still in progress. When it is completed we willwrite an addendum to our report that qualitatively considers the evidence provided in theaquaculture report. The reviewer raises a reasonable point regarding exposure to <strong>salmon</strong>farms in the upper Strait constituting an exposure to human activities. To avoid implyingthat <strong>sockeye</strong> are not exposed to <strong>salmon</strong> farms, we have modified the text in both theExecutive Summary <strong>and</strong> Section 4.5.2 to explicitly clarify that we are only referring tohuman activities covered by Technical Report #12 <strong>and</strong> not to <strong>salmon</strong> farms.p. 5 / pdf 13. “It’s also very likely that marine conditions during the inshore migration lifestage contributed to the poor returns observed in 2009.” I would add that it is also verylikely that improved marine conditions (cooler temperatures <strong>and</strong> associated food webs?)contributed to the improved return in 2010.Response: We’ve added a brief discussion of 2007 vs 2008 (<strong>and</strong> their implications forreturns in 2009 <strong>and</strong> 2010) to section 4.4.3, based on McKinnel et al (2011).p. 5 / pdf 13. I am confused by the paragraph called “Stage 5: Migration back toSpawn”. The authors say: “…the <strong>Fraser</strong> <strong>sockeye</strong> productivity indices already accountfor en-route mortality (i.e., recruits = spawners + harvest + en-route mortality).” Isuggest starting with a clear definition of what, exactly, is meant by “productivity”, <strong>and</strong>“recruits”. Productivity can defined as the number of returns per spawner, where a“return” is a fish that comes back to the coast. Further sources of mortality are notincluded, such as fishing <strong>and</strong> en-route mortality in the river. From parts of the rest ofthe report, including the use of the SFU Think Tank’s figure on p. 21 (pdf 35), I THINKthe authors <strong>and</strong> I agree that productivity means what I am calling “returns to the coast”per spawner. But in other places I’m not so sure. The definition the authors have usedsuggested to me, the first few times I read it, that they were INCLUDING survivalthrough the fishery <strong>and</strong> en route mortality as part of the definition of “productivity”. Thatis also implied by their analyses of Recruits/Spawner later in the report. My question is,are different metrics being used to represent “productivity”?Response: We have now clearly <strong>and</strong> consistently defined productivity in the ExecutiveSummary, Introduction, <strong>and</strong> Section 4.1. We have applied the term consistently throughoutthe report. Three metrics are explained in Section 4.1, based on Peterman <strong>and</strong> Dorner159
(2011).This confusion continues with the logic that since “…the <strong>Fraser</strong> <strong>sockeye</strong> productivityindices already account for en-route mortality (i.e., recruits = spawners + harvest + enroutemortality)”, “there is no point in examining correlations between en-route mortality<strong>and</strong> life cycle or post-juvenile productivity indices within the same generation.” Well, if“productivity” means “returns to the coast” per spawner, then fishing <strong>and</strong> en-routemortality are NOT already accounted for, unless the authors mean that they havecalculated these losses back in. This probably just needs to be re-worded to make itmore clear.Response: We believe that the definitions mentioned above clarify this issue.p. 5/19. “If the effects of an individual project are insignificant, it is assumed that theproject’s contribution to potential <strong>cumulative</strong> effects will also be insignificant <strong>and</strong> a CEAwill not be required for project approval (Greig 2010b).” Well, maybe, but isn’t the pointof a <strong>cumulative</strong> effects consideration that insignificant effects can be added or multipliedtogether? Admittedly, such effects would be very difficult to detect.Response: Yes, this is completely true – the <strong>cumulative</strong> effect of multiple forces/factors thatare themselves insignificant could still be significant due to additive or multiplicativeinteractions. The sentence quoted above describes how the concept of “<strong>cumulative</strong> effects”is commonly implemented within current practice in the field of environmental impactassessment in Canada. The wording of this paragraph has also been modified, based onother feedback, to clarify that this perspective reflects current practice not currentst<strong>and</strong>ards. The whole paragraph describes not what “<strong>cumulative</strong> effects” is or should be,but simply how it is frequently applied. But the subsequent paragraph describes why thisdefinition is inadequate <strong>and</strong> falls short of what “<strong>cumulative</strong> effects” analyses should beconsidering. We felt that contrasting very different definitions of <strong>cumulative</strong> effects wouldbe a useful way of exploring some of the important ideas underlying this complex concept.We have exp<strong>and</strong>ed on the point raised by the reviewer in the revised section 4.7.p. 12 / pdf 26. The approach that’s outlined for the <strong>cumulative</strong> <strong>impacts</strong> analysis (3.3.1.Overview) does not, in my opinion, fully capture the “<strong>cumulative</strong>” nature of the <strong>impacts</strong>that are being assessed. That is, the 3 components of the approach could be examinedwithout any of the considerations that were presented earlier on how <strong>cumulative</strong><strong>impacts</strong> analyses work – each could be assessed totally independently of the other, atleast the way this is written, <strong>and</strong> the way that much of the rest of the text is presented.The summary tables of exposure <strong>and</strong> likelihood of <strong>impacts</strong> of each potential stressorconsider each stressor one at a time. I don’t see anything “accumulating” here.Response: We have added discussions of potential interactions among factors to variousparts of Sections 4.2-4.6, <strong>and</strong> possible interactions across life history stages to Section 4.7.We have added some discussion in Section 2.3 to explicitly describe how the <strong>cumulative</strong>effects concepts described in Section 2 are integrated into the report. Point 3 in Section160
3.3.1 has been revised to say “Assess the relative likelihood of feasible explanatory factors<strong>and</strong> their potential interactions”. We have added some discussion regarding theconsideration of <strong>cumulative</strong> effects <strong>and</strong> interactions in our methodological summary(Section 3.3.6) <strong>and</strong> Appendix 3 now provides greater discussion on some of the issues withincluding interactions in our quantitative analyses (e.g. we cannot assess the interactionswith disease because there are no <strong>data</strong> available).p. 19 / pdf 33. I like the conceptual flow diagram.Response: Thank you for the positive feedback.p. 43 / pdf 57. 4.3.2 Exposure of <strong>Fraser</strong> <strong>River</strong> <strong>sockeye</strong> to stressors. It would be good toadd a couple sentences reminding readers how the Nelitz et al. index of <strong>cumulative</strong>stress works.Response: Added to Section 4.3.2.p. 46 / pdf 60. “As discussed above, MacDonald et al. (2011) compared watercontaminant concentrations during the smolt migration period with thresholdsestablished from laboratory <strong>and</strong> field studies, <strong>and</strong> no evidence against the hypothesisthat contaminants encountered by smolts contributed to declining <strong>sockeye</strong> productivity.”I’m not sure what this means: did they find evidence against the hypothesis because oflack of information, or perhaps evidence for the hypothesisResponse: Thank you for catching this error. The phrase “against the hypothesis” shouldbe removed.p. 49-49 / pdf 62-63. It seems odd that sea lice are not mentioned in the section onpotential pathogens. They were mentioned in several places in the Disease report,though not in much detail.Response: We limited our discussion of potential pathogens to those that Kent (2011;Pathogens <strong>and</strong> Disease) evaluated as being “high risk”. Kent (2011) ranked the sea lice L.<strong>salmon</strong>is <strong>and</strong> C. clemensi as “moderate risk”. He reports that there are many researchpublications (both finding <strong>and</strong> failing to find support) on the purported link between<strong>salmon</strong> farms, sea lice <strong>and</strong> increases in mortality of wild pink <strong>and</strong> chum populations. Kent(2011) further reports that “there are reports of L. <strong>salmon</strong>is infections on <strong>sockeye</strong> <strong>salmon</strong>,but there is not [any] direct indication that the parasite causes significant mortality in thisspecies”. However, it is not clear whether this conclusion reflects findings based on actual<strong>data</strong> or simply reflects an overall lack of appropriate <strong>data</strong> to test for such a relationship.When the technical reports on aquaculture are available, an addendum to this report willbe completed to assess the <strong>cumulative</strong> effects on <strong>sockeye</strong> including <strong>salmon</strong> farms.p. 53 / pdf 67. “For example, if 0.1% of the diet of spiny dogfish was <strong>sockeye</strong> smolts,they would consume 14.5 million smolts within the Strait of Georgia (very significant161
predation)…” Well, to say that level is significant requires a back-of-the-envelopecomparison with how many smolts leave the <strong>Fraser</strong> each year. Otherwise, we can’t tellif this is a lot or a few in terms of potential <strong>impacts</strong> on the populations.Response: We have modified this sentence. We have added a sentence on the averagenumber of Chilko smolts to provide some frame of reference.p. 60 / pdf 74. What’s missing from this section on marine conditions is any mention ofthe high returns in 2010. It would be nice to have a discussion of whether the negativeoceanic conditions that are mentioned for Queen Charlotte Sound <strong>and</strong> the Strait ofGeorgia were reversed for the smolts that contributed to the strong 2010 return.Response: This is addressed above, with respect to your comment on pg. 5 / pdf 13.p. 63 / pdf 77. Fig. 4.5-1. This figure on the proportion of Early Stuart fish returning as5 year-olds doesn’t seem to be introduced in the text, though the <strong>Fraser</strong> temperaturefigure is referred to in the text as having this figure number.Response: There were three paragraphs at the beginning of Section 4.5.2 that wereaccidentally removed from the draft submitted, including a paragraph discussing Figure4.5-1. This oversight has been corrected <strong>and</strong> the figure is now introduced properly. Thereferences to the <strong>Fraser</strong> temperature figure (i.e. Figure 4.6-1) have been corrected.p. 82 / pdf 96. “Food resources” are listed as a topic that was not covered by theCommission’s reports. I wonder how that could have happened, <strong>and</strong> I also raised thisas a concern in my review of the technical report on Lower <strong>Fraser</strong> <strong>and</strong> Strait of Georgia.The final version of that report omitted 2.5 pages of my review, which included thiscomment, <strong>and</strong> the authors did not answer it.Response: We cannot offer a response to this comment. The issues raised are moreappropriately directed toward the Cohen Commission <strong>and</strong> the authors of Technical Report#12, respectively. However, we have discussed some aspects of food resources in variousparts of Section 4.More generally, the Commission should consider how the items in this table (4.8-1, p.82) will be dealt with. Perhaps examination of witnesses will suffice, but theCommission could also consider whether a short report that picks up the items thathave slipped through the cracks would also be helpful, if this could be done within thetight timeline.Response: We agree with the reviewer. We thought it was important to at least identify thatthere are still further hypotheses <strong>and</strong> potential factors outside of the set of topics that thetechnical reports were commissioned to investigate. We believe it is important for both theCommission <strong>and</strong> other audiences to recognize that the set of factors explored by thetechnical reports is not an exhaustive list of ALL potential factors but a set of some of the162
most likely contributors to the recent patterns of change observed in <strong>Fraser</strong> <strong>River</strong> <strong>sockeye</strong><strong>salmon</strong>. However, we also acknowledge that Table 4.8-1 is also not an exhaustive list ofother factors.163
Appendix 3. Data <strong>and</strong> MethodsA3.1 Appendix OutlineThis appendix provides a detailed description of the <strong>data</strong> used <strong>and</strong> methods applied in the presentreport. The subsequent subsections explain:1) the process of collecting <strong>data</strong> from the other technical reports, including the <strong>data</strong>template <strong>and</strong> <strong>data</strong> requirements provided to contractors submitting <strong>data</strong>;2) the <strong>data</strong> that was ultimately received from the other technical reports;3) the process of compiling <strong>and</strong> integrating the collected <strong>data</strong> into a central <strong>data</strong>base <strong>and</strong>preparing it for analysis; <strong>and</strong>,4) the qualitative <strong>and</strong> quantitative analysis methods applied in this report.A3.2 Data CollectionTo facilitate the acquisition of the necessary <strong>data</strong> sets <strong>and</strong> associated meta<strong>data</strong> from eachscientific research project, we designed an Excel template <strong>and</strong> an accompanying set ofguidelines. The Cohen Commission distributed these <strong>data</strong> templates to all appropriate scientificcontractors in late September, with a deadline of November 1, 2010 for submitting the requested<strong>data</strong>, corresponding with the deadline for the submission of project progress reports. Theobjective of this template was to collect the necessary <strong>data</strong> in a consistent format, facilitating arange of quantitative <strong>and</strong> qualitative analyses exploring the relative <strong>and</strong> <strong>cumulative</strong> <strong>impacts</strong> ofdifferent stressors on <strong>Fraser</strong> <strong>sockeye</strong> productivity. Several project submitted <strong>data</strong> on November1, 2010, but by the end of 2011, <strong>data</strong> had only been received four out of the seven project thatwould be submitting <strong>data</strong> for the <strong>cumulative</strong> <strong>impacts</strong> analysis. The outst<strong>and</strong>ing <strong>data</strong> were acritical component of the <strong>cumulative</strong> <strong>impacts</strong>, representing over 70% of the final set of variablesincluded. These <strong>data</strong> were received in mid to late January, forcing a compressed timeline for theremaining tasks associated with the organization <strong>and</strong> preparation of <strong>data</strong> (Section A3.4), thesubsequent analyses of these <strong>data</strong> (Section A3.5), <strong>and</strong> the interpretation of the results (Appendix4).We recognized from the outset that <strong>data</strong> limitations would vary in severity by stressor <strong>and</strong>particular metric, including limited time spans of <strong>data</strong>, gaps in the time series, <strong>and</strong> onlyqualitative estimates for some years/metrics/stocks rather than quantitative measurements. The<strong>data</strong> template was designed with flexibility to accommodate these potential issues. The <strong>data</strong>template user guidelines are included in Appendix 5.165
A3.2.1 Integrative quantitative metricsEach contractor (excepting projects #6, 7, 10, <strong>and</strong> 11) was instructed to provide <strong>data</strong> for a fewintegrative metrics (or indices) of the stressors that his or her research group examined. Project10 (Peterman <strong>and</strong> Dorner, 2011) was required to provide <strong>data</strong>; however, as they were providingthe productivity <strong>data</strong> of each stock to be used as the response variable (i.e. not a covariate orpotential stressor), the following criteria did not apply to their <strong>data</strong> submission.It was specified that the metrics provided should adhere to the following guidelines:• Few: Limit submission to 1-5 metrics per contractor. Additional metrics can be addedif justified – i.e., metric represents an important but independent source of variation.• Integrative: Each study will likely have a lot of <strong>data</strong>. The few integrative metricsprovided to ESSA should synthesize these <strong>data</strong>. Each contractor is a discipline expertthat will know which variables are most important or how best to integrate <strong>data</strong> intointegrative metrics.• Independent: Integrative metrics should be chosen to reflect independent sources ofvariation (i.e. not be highly correlated with each other).• Annual: The metrics provided by each contractor need to be provided annually, forthose years where <strong>data</strong> exist. Each contractor will know the most relevant approach tosummarize intra-annual <strong>data</strong> into an annual metric (e.g., maximum weekly averagetemperature experienced during upstream migration of each stock of <strong>Fraser</strong> <strong>sockeye</strong>).• Stock specific: Provide only one <strong>data</strong> point per stock per year. The same <strong>data</strong> pointmay apply to multiple stocks; contractors can specify which ones.Furthermore, each reported metric should be clearly connected with a biologically-supportedhypothesis that emphasizes why this metric is potentially important in explaining patterns in<strong>sockeye</strong> productivity over time <strong>and</strong>/or space. We also asked contractors to consider where theirhypotheses fit within an initial conceptual model that we provided.Finally, the original <strong>data</strong> sources <strong>and</strong> analytical methods would need to be explicitly described tocommunicate how each integrative metric was generated. The leaders of each project areexpected to be the experts on how to best integrate stressor-specific <strong>data</strong> over space <strong>and</strong> time, butall users (intermediate <strong>and</strong> final) must be able trace the steps by which an integrative metric wasgenerated from its primary sources. The <strong>data</strong> template therefore asked each contractor to providemeta<strong>data</strong>, describing all primary sources <strong>and</strong> assumptions used to derive the integrative metric.166
A3.2.2 Qualitative assessment <strong>data</strong> setsIt was anticipated that many important metrics would have a limited <strong>data</strong> record, with gaps inboth time <strong>and</strong> space. To overcome these limitations, contractors were asked to supply qualitativeestimates or educated guesses for the entire time period. This would complement the quantitative<strong>data</strong> set.Contractors were required to fill in a second <strong>data</strong> form with qualitative assessments (5 pointscale) of the same integrative metrics for which they had provided quantitative <strong>data</strong>, but coveringthe entire time period from 1950 to now. This would be based on the expert experience of eachcontractor in their respective field, reflecting the contractor’s best guess at the level of aparticular stressor, not the actual impact of that stressor on <strong>sockeye</strong> productivity. Contractorswere to provide their qualitative ratings independent of the productivity <strong>data</strong> (i.e. not assigningratings based on looking at the productivity <strong>data</strong>, as that would make the ratings biased <strong>and</strong>unusable in the present analyses).If not possible to distinguish among multiple quantitative metrics in making qualitativejudgments for the entire period of record, contractors were given the discretion to qualitativelyevaluate only a single overarching measure for their particular stressor. For example, theresearch group on contaminants could provide an overall estimate of the extent to which watercontamination in general has changed over the past 60 years across <strong>Fraser</strong> <strong>River</strong> <strong>sockeye</strong><strong>salmon</strong>’s habitat range.A3.3 Summary of Data ReceivedTable A3.3-1 shows a summary of the <strong>data</strong> variables ultimately received from each CohenCommission scientific project <strong>and</strong> included in the <strong>cumulative</strong> <strong>impacts</strong> <strong>data</strong>base, as describedbelow. Of the six projects that submitted <strong>data</strong> sets for potential covariates, only two providedqualitative <strong>data</strong> assessments as described above in Section A3.2.2.167
Table A3.3-1. A summary of <strong>data</strong> sets received from contractors <strong>and</strong> included in the <strong>cumulative</strong> <strong>impacts</strong> <strong>data</strong>base The table shows the variables from eachproject, the location to which the <strong>data</strong> apply, the period of record (although this does not imply that the <strong>data</strong> series is complete over this time period), thenumber of stocks to which the <strong>data</strong> apply (less than 19 implies there are multiple stock-specific <strong>data</strong> series for the variable, whereas generally a stockcount of 19 implies that there is only a single <strong>data</strong> series, which applies to all stocks), <strong>and</strong> the units of measurement.ProjectNumber Project Name Variable Subset Location2 Contaminants CCME Water Quality Index Outmigration2 Contaminants CCME Water Quality Index Rearing2 Contaminants CCME Water Quality Index Spawning2 Contaminants CCME Water Quality Index Upstream migration2 Contaminants CCME Water Quality Index - Qualitative Outmigration2 Contaminants CCME Water Quality Index - Qualitative Rearing2 Contaminants CCME Water Quality Index - Qualitative Spawning2 Contaminants CCME Water Quality Index - Qualitative Upstream migration3 Freshwater ecology Area forest harvested Mainstem spawning areas3 Freshwater ecology Area forest harvested Migration corridor3 Freshwater ecology Area forest harvested Nursery lakes3 Freshwater ecology Area forest harvested Tributary spawning areas3 Freshwater ecology Human population density Mainstem spawning areas3 Freshwater ecology Human population density Migration corridor3 Freshwater ecology Human population density Nursery lakes3 Freshwater ecology Human population density Tributary spawning areas3 Freshwater ecology Lake influence3 Freshwater ecology Road density Mainstem spawning areas3 Freshwater ecology Road density Migration corridor3 Freshwater ecology Road density Nursery lakes<strong>Fraser</strong> Watershed - MigrationAreas<strong>Fraser</strong> Watershed - RearingAreas<strong>Fraser</strong> Watershed -Spawning Areas<strong>Fraser</strong> Watershed - MigrationAreas<strong>Fraser</strong> Watershed - MigrationAreas<strong>Fraser</strong> Watershed - RearingAreas<strong>Fraser</strong> Watershed -Spawning Areas<strong>Fraser</strong> Watershed - MigrationAreas<strong>Fraser</strong> Watershed -Spawning Areas<strong>Fraser</strong> Watershed - MigrationAreas<strong>Fraser</strong> Watershed - RearingAreas<strong>Fraser</strong> Watershed -Spawning Areas<strong>Fraser</strong> Watershed -Spawning Areas<strong>Fraser</strong> Watershed - MigrationAreas<strong>Fraser</strong> Watershed - RearingAreas<strong>Fraser</strong> Watershed -Spawning Areas<strong>Fraser</strong> Watershed -Spawning Areas<strong>Fraser</strong> Watershed -Spawning Areas<strong>Fraser</strong> Watershed - MigrationAreas<strong>Fraser</strong> Watershed - RearingAreasMin ofObservationYearMax ofObservationyearStockCount1967 2010 17 index1971 2010 10 index1970 2010 9 index1967 2010 19 index1948 2010 171948 2010 101948 2010 91948 2010 19UnitsQualitativemagnitudesQualitativemagnitudesQualitativemagnitudesQualitativemagnitudes1980 2010 12 percent1980 2010 18 percent1980 2010 16 percent1980 2010 2 percent1986 2009 12 #/km21986 2009 18 #/km21986 2009 18 #/km21986 2009 14 #/km22009 2009 17 percent2009 2009 13 km/km22009 2009 18 km/km22009 2009 18 km/km2168
ProjectNumber Project Name Variable Subset Location3 Freshwater ecology Road density Tributary spawning areas3 Freshwater ecology Spring air temperature3 Freshwater ecology Summer air temperature CU set 13 Freshwater ecology Summer air temperature CU set 2<strong>Fraser</strong> Watershed -Spawning Areas<strong>Fraser</strong> Watershed - RearingAreas<strong>Fraser</strong> Watershed - MigrationAreas<strong>Fraser</strong> Watershed - MigrationAreasMin ofObservationYearMax ofObservationyearStockCount2009 2009 14 km/km2Units1948 2009 18 Degrees Celsius1948 2009 18 Degrees Celsius1948 2009 5 Degrees Celsius4 Marine ecology Chlorophyll concentration July mean Queen Charlotte Sound 1998 2009 19 ug.l -14 Marine ecology Chlorophyll concentration June mean Queen Charlotte Sound 1998 2009 19 ug.l -14 Marine ecology Chlorophyll concentration May mean Queen Charlotte Sound 1998 2008 19 ug.l -14 Marine ecology Chlorophyll concentration September mean Queen Charlotte Sound 1997 2009 19 ug.l -14 Marine ecology Chlorophyll concentration 30 March - 22 April Queen Charlotte Sound 1998 2009 19 ug.l -14 Marine ecology Chlorophyll concentration April mean Queen Charlotte Sound 1998 2009 19 ug.l -14 Marine ecology Chlorophyll concentration August mean Queen Charlotte Sound 1998 2009 19 ug.l -14 Marine ecology <strong>River</strong> discharge Klinaklini (Knight Inlet) Queen Charlotte Sound 1977 2008 19 m3/s4 Marine ecology <strong>River</strong> discharge Wannock (<strong>River</strong>s Inlet) Queen Charlotte Sound 1929 2009 19 m3/s4 Marine ecology Sea surface salinity July mean Queen Charlotte Sound 1970 2010 19 PSU4 Marine ecology Sea surface salinity June mean Queen Charlotte Sound 1970 2010 19 PSU4 Marine ecology Sea surface salinity May mean Queen Charlotte Sound 1970 2010 19 PSU4 Marine ecology Sea surface salinity September mean Queen Charlotte Sound 1970 2009 19 PSU4 Marine ecology Sea surface salinity April mean Queen Charlotte Sound 1970 2010 19 PSU4 Marine ecology Sea surface salinity August mean Queen Charlotte Sound 1970 2009 19 PSU4 Marine ecology Sea surface salinity April-Aug average Queen Charlotte Sound 1970 2010 19 PSU4 Marine ecology Sea surface salinity May-Sept average Queen Charlotte Sound 1970 2010 19 PSU4 Marine ecology Sea surface temperature July mean Queen Charlotte Sound 1982 2009 19 Degrees Celsius4 Marine ecology Sea surface temperature July-June difference Queen Charlotte Sound 1982 2009 19 Degrees Celsius169
ProjectNumber Project Name Variable Subset LocationMin ofObservationYearMax ofObservationyearStockCountUnits4 Marine ecology Sea surface temperature August mean Queen Charlotte Sound 1982 2009 19 Degrees Celsius4 Marine ecology Sea surface temperature August-June difference Queen Charlotte Sound 1982 2009 19 Degrees Celsius4 Marine ecology Sea surface temperature July-Aug average Queen Charlotte Sound 1982 2009 19 Degrees Celsius4 Marine ecology Summer wind regime FACTOR Queen Charlotte Sound 1948 2009 19 m/s4 Marine ecology Summer wind regime U-direction Queen Charlotte Sound 1948 2009 19 m/s4 Marine ecology Summer wind regime V-direction Queen Charlotte Sound 1948 2009 19 m/s4 Marine ecology North Pacific Index Nov-Mar Average Other North Pacific Ocean 1900 2010 19 Mb4 Marine ecology North Pacific Index Anomalies Other North Pacific Ocean 1900 2010 19 Mb888888888888888Predation (marine <strong>and</strong>freshwater)Predation (marine <strong>and</strong>freshwater)Predation (marine <strong>and</strong>freshwater)Predation (marine <strong>and</strong>freshwater)Predation (marine <strong>and</strong>freshwater)Predation (marine <strong>and</strong>freshwater)Predation (marine <strong>and</strong>freshwater)Predation (marine <strong>and</strong>freshwater)Predation (marine <strong>and</strong>freshwater)Predation (marine <strong>and</strong>freshwater)Predation (marine <strong>and</strong>freshwater)Predation (marine <strong>and</strong>freshwater)Predation (marine <strong>and</strong>freshwater)Predation (marine <strong>and</strong>freshwater)Predation (marine <strong>and</strong>freshwater)Pinniped count California sea lions 1971 2009 19 CountPinniped count Steller sea lion 1913 2010 19 CountPinniped estimate California sea lions 1971 2009 19 CountPinniped estimate Harbour seals 1913 2008 19 CountPinniped estimate Steller sea lion 1913 2010 19 CountChristmas Bird Count BC Common murre 1957 2009 19 #/hourChristmas Bird Count BC Cormorants, B+P 1957 2009 19 #/hourChristmas Bird Count BC D-C cormorant 1957 2009 19 #/hourChristmas Bird Count BC Gulls 1957 2009 19 #/hourChristmas Bird Count BC Pelagic cormorant 1957 2009 19 #/hourChristmas Bird Count BC Bald eagle 1957 2009 19 #/hourChristmas Bird Count BC Br<strong>and</strong>ts cormorant 1958 2009 19 #/hourChristmas Bird Count BC Common merganser 1958 2009 19 #/hourFish predators Blue shark abundance 1980 2002 19tons of biomass(millions)Fish predators Arrowtooth flounder biomass 1961 2007 19 kg of biomass170
8888888888ProjectNumber Project Name Variable Subset LocationPredation (marine <strong>and</strong>freshwater)Predation (marine <strong>and</strong>freshwater)Predation (marine <strong>and</strong>freshwater)Predation (marine <strong>and</strong>freshwater)Predation (marine <strong>and</strong>freshwater)Predation (marine <strong>and</strong>freshwater)Predation (marine <strong>and</strong>freshwater)Predation (marine <strong>and</strong>freshwater)Predation (marine <strong>and</strong>freshwater)Predation (marine <strong>and</strong>freshwater)9 Climate change LFR water temp for returning adults9 Climate change1212121212121212121212Lwr <strong>Fraser</strong> <strong>River</strong> <strong>and</strong> Straitof Georgia habitat inventoryLwr <strong>Fraser</strong> <strong>River</strong> <strong>and</strong> Straitof Georgia habitat inventoryLwr <strong>Fraser</strong> <strong>River</strong> <strong>and</strong> Straitof Georgia habitat inventoryLwr <strong>Fraser</strong> <strong>River</strong> <strong>and</strong> Straitof Georgia habitat inventoryLwr <strong>Fraser</strong> <strong>River</strong> <strong>and</strong> Straitof Georgia habitat inventoryLwr <strong>Fraser</strong> <strong>River</strong> <strong>and</strong> Straitof Georgia habitat inventoryLwr <strong>Fraser</strong> <strong>River</strong> <strong>and</strong> Straitof Georgia habitat inventoryLwr <strong>Fraser</strong> <strong>River</strong> <strong>and</strong> Straitof Georgia habitat inventoryLwr <strong>Fraser</strong> <strong>River</strong> <strong>and</strong> Straitof Georgia habitat inventoryLwr <strong>Fraser</strong> <strong>River</strong> <strong>and</strong> Straitof Georgia habitat inventoryLwr <strong>Fraser</strong> <strong>River</strong> <strong>and</strong> Straitof Georgia habitat inventoryMin ofObservationYearMax ofObservationyearAlternate prey BC herring-CC BC Central Coast 1950 2008 19 tons of biomassAlternate prey BC herring-PRD Prince Rupert District 1950 2008 19 tons of biomassAlternate prey BC herring-QCI Queen Charlotte Isl<strong>and</strong>s 1950 2008 19 tons of biomassAlternate prey BC herring-SoG Strait of Georgia 1950 2008 19 tons of biomassAlternate prey BC herring-WCVI West Coast Vancouver Isl<strong>and</strong> 1950 2008 19 tons of biomassAlternate prey California Current Pacific hake 1966 2009 19 tons of biomassAlternate prey Gulf of Alaska Pacific cod 1984 2005 19 tons of biomassAlternate prey Pacific Jack mackerel 1950 2006 19 tons of biomassAlternate prey Pacific mackerel 1929 2009 19 tons of biomassAlternate prey Walleye pollock 1977 2007 19 tons of biomassLFR water temp for returning adults -Qualitiative<strong>Fraser</strong> Watershed - MigrationAreas<strong>Fraser</strong> Watershed - MigrationAreasStockCountUnits1951 2010 19 Degrees Celsius1948 2010 20Chlorophyll concentration July mean Northern Georgia Strait 1998 2010 19 mg/m 3Chlorophyll concentration July mean Strait of Juan de Fuca 1998 2010 19 mg/m 3Chlorophyll concentration July mean Central Georgia Strait 1998 2010 19 mg/m 3Chlorophyll concentration June mean Northern Georgia Strait 1998 2010 19 mg/m 3Chlorophyll concentration June mean Strait of Juan de Fuca 1998 2010 19 mg/m 3Chlorophyll concentration June mean Central Georgia Strait 1998 2010 19 mg/m 3Chlorophyll concentration May mean Northern Georgia Strait 1998 2010 19 mg/m 3Chlorophyll concentration May mean Strait of Juan de Fuca 1998 2010 19 mg/m 3Chlorophyll concentration May mean Central Georgia Strait 1998 2010 19 mg/m 3Chlorophyll concentration September mean Northern Georgia Strait 1998 2010 19 mg/m 3Chlorophyll concentration September mean Strait of Juan de Fuca 1998 2010 19 mg/m 3Qualitativemagnitudes171
ProjectNumber Project Name Variable Subset Location1212121212121212121212121212121212121212121212Lwr <strong>Fraser</strong> <strong>River</strong> <strong>and</strong> Straitof Georgia habitat inventoryLwr <strong>Fraser</strong> <strong>River</strong> <strong>and</strong> Straitof Georgia habitat inventoryLwr <strong>Fraser</strong> <strong>River</strong> <strong>and</strong> Straitof Georgia habitat inventoryLwr <strong>Fraser</strong> <strong>River</strong> <strong>and</strong> Straitof Georgia habitat inventoryLwr <strong>Fraser</strong> <strong>River</strong> <strong>and</strong> Straitof Georgia habitat inventoryLwr <strong>Fraser</strong> <strong>River</strong> <strong>and</strong> Straitof Georgia habitat inventoryLwr <strong>Fraser</strong> <strong>River</strong> <strong>and</strong> Straitof Georgia habitat inventoryLwr <strong>Fraser</strong> <strong>River</strong> <strong>and</strong> Straitof Georgia habitat inventoryLwr <strong>Fraser</strong> <strong>River</strong> <strong>and</strong> Straitof Georgia habitat inventoryLwr <strong>Fraser</strong> <strong>River</strong> <strong>and</strong> Straitof Georgia habitat inventoryLwr <strong>Fraser</strong> <strong>River</strong> <strong>and</strong> Straitof Georgia habitat inventoryLwr <strong>Fraser</strong> <strong>River</strong> <strong>and</strong> Straitof Georgia habitat inventoryLwr <strong>Fraser</strong> <strong>River</strong> <strong>and</strong> Straitof Georgia habitat inventoryLwr <strong>Fraser</strong> <strong>River</strong> <strong>and</strong> Straitof Georgia habitat inventoryLwr <strong>Fraser</strong> <strong>River</strong> <strong>and</strong> Straitof Georgia habitat inventoryLwr <strong>Fraser</strong> <strong>River</strong> <strong>and</strong> Straitof Georgia habitat inventoryLwr <strong>Fraser</strong> <strong>River</strong> <strong>and</strong> Straitof Georgia habitat inventoryLwr <strong>Fraser</strong> <strong>River</strong> <strong>and</strong> Straitof Georgia habitat inventoryLwr <strong>Fraser</strong> <strong>River</strong> <strong>and</strong> Straitof Georgia habitat inventoryLwr <strong>Fraser</strong> <strong>River</strong> <strong>and</strong> Straitof Georgia habitat inventoryLwr <strong>Fraser</strong> <strong>River</strong> <strong>and</strong> Straitof Georgia habitat inventoryLwr <strong>Fraser</strong> <strong>River</strong> <strong>and</strong> Straitof Georgia habitat inventoryLwr <strong>Fraser</strong> <strong>River</strong> <strong>and</strong> Straitof Georgia habitat inventoryMin ofObservationYearMax ofObservationyearChlorophyll concentration September mean Central Georgia Strait 1998 2010 19 mg/m 3Chlorophyll concentration April mean Northern Georgia Strait 1998 2010 19 mg/m 3Chlorophyll concentration April mean Strait of Juan de Fuca 1998 2010 19 mg/m 3Chlorophyll concentration April mean Central Georgia Strait 1998 2010 19 mg/m 3Chlorophyll concentration August mean Northern Georgia Strait 1998 2010 19 mg/m 3Chlorophyll concentration August mean Strait of Juan de Fuca 1998 2010 19 mg/m 3Chlorophyll concentration August mean Central Georgia Strait 1998 2010 19 mg/m 3<strong>River</strong> discharge <strong>Fraser</strong> discharge April total Strait of Georgia 1970 2009 19 m 3 /s<strong>River</strong> discharge <strong>Fraser</strong> discharge August total Strait of Georgia 1970 2009 19 m 3 /s<strong>River</strong> discharge <strong>Fraser</strong> discharge July total Strait of Georgia 1970 2009 19 m 3 /s<strong>River</strong> discharge <strong>Fraser</strong> discharge June total Strait of Georgia 1970 2009 19 m 3 /s<strong>River</strong> discharge <strong>Fraser</strong> discharge May total Strait of Georgia 1970 2009 19 m 3 /s<strong>River</strong> discharge <strong>Fraser</strong> discharge October total Strait of Georgia 1970 2009 19 m 3 /s<strong>River</strong> discharge <strong>Fraser</strong> discharge September total Strait of Georgia 1970 2009 19 m 3 /s<strong>River</strong> discharge June-July average Strait of Georgia 1970 2009 19 m 3 /sSea surface salinity July mean Strait of Georgia 1936 2008 19 PSUSea surface salinity June mean Strait of Georgia 1936 2009 19 PSUSea surface salinity May mean Strait of Georgia 1936 2009 19 PSUSea surface salinity September mean Strait of Georgia 1936 2009 19 PSUSea surface salinity April mean Strait of Georgia 1937 2009 19 PSUSea surface salinity August mean Strait of Georgia 1936 2009 19 PSUSea surface salinity April-Aug average Strait of Georgia 1936 2009 19 PSUSea surface salinity May-Sept average Strait of Georgia 1936 2009 19 PSUStockCountUnits172
ProjectNumber Project Name Variable Subset Location1212121212121212121212121212121212121212Lwr <strong>Fraser</strong> <strong>River</strong> <strong>and</strong> Straitof Georgia habitat inventoryLwr <strong>Fraser</strong> <strong>River</strong> <strong>and</strong> Straitof Georgia habitat inventoryLwr <strong>Fraser</strong> <strong>River</strong> <strong>and</strong> Straitof Georgia habitat inventoryLwr <strong>Fraser</strong> <strong>River</strong> <strong>and</strong> Straitof Georgia habitat inventoryLwr <strong>Fraser</strong> <strong>River</strong> <strong>and</strong> Straitof Georgia habitat inventoryLwr <strong>Fraser</strong> <strong>River</strong> <strong>and</strong> Straitof Georgia habitat inventoryLwr <strong>Fraser</strong> <strong>River</strong> <strong>and</strong> Straitof Georgia habitat inventoryLwr <strong>Fraser</strong> <strong>River</strong> <strong>and</strong> Straitof Georgia habitat inventoryLwr <strong>Fraser</strong> <strong>River</strong> <strong>and</strong> Straitof Georgia habitat inventoryLwr <strong>Fraser</strong> <strong>River</strong> <strong>and</strong> Straitof Georgia habitat inventoryLwr <strong>Fraser</strong> <strong>River</strong> <strong>and</strong> Straitof Georgia habitat inventoryLwr <strong>Fraser</strong> <strong>River</strong> <strong>and</strong> Straitof Georgia habitat inventoryLwr <strong>Fraser</strong> <strong>River</strong> <strong>and</strong> Straitof Georgia habitat inventoryLwr <strong>Fraser</strong> <strong>River</strong> <strong>and</strong> Straitof Georgia habitat inventoryLwr <strong>Fraser</strong> <strong>River</strong> <strong>and</strong> Straitof Georgia habitat inventoryLwr <strong>Fraser</strong> <strong>River</strong> <strong>and</strong> Straitof Georgia habitat inventoryLwr <strong>Fraser</strong> <strong>River</strong> <strong>and</strong> Straitof Georgia habitat inventoryLwr <strong>Fraser</strong> <strong>River</strong> <strong>and</strong> Straitof Georgia habitat inventoryLwr <strong>Fraser</strong> <strong>River</strong> <strong>and</strong> Straitof Georgia habitat inventoryLwr <strong>Fraser</strong> <strong>River</strong> <strong>and</strong> Straitof Georgia habitat inventoryMin ofObservationYearMax ofObservationyearSea surface temperature July mean Strait of Georgia 1936 2009 19 Degrees CelsiusSea surface temperature June mean Strait of Georgia 1936 2009 19 Degrees CelsiusSea surface temperature May mean Strait of Georgia 1936 2009 19 Degrees CelsiusSea surface temperature September mean Strait of Georgia 1936 2009 19 Degrees CelsiusSea surface temperature April mean Strait of Georgia 1937 2009 19 Degrees CelsiusSea surface temperature August mean Strait of Georgia 1936 2009 19 Degrees CelsiusSea surface temperature April-Aug average Strait of Georgia 1936 2009 19 Degrees CelsiusPopulation census Lower <strong>Fraser</strong> Lower <strong>Fraser</strong> <strong>River</strong> 1986 2006 19 countPopulation census Strait of Georgia Strait of Georgia 1986 2006 19 countPopulation census Strait of Juan de Fuca Strait of Juan de Fuca 1986 2006 19 countSolid waste disposed Lower <strong>Fraser</strong> Lower <strong>Fraser</strong> <strong>River</strong> 1990 2006 19 tons/yrSolid waste disposed Strait of Georgia Strait of Georgia 1990 2006 19 tons/yrSolid waste disposed Strait of Juan de Fuca Strait of Juan de Fuca 1990 2006 19 tons/yrLiquid waste Flow Strait of Georgia 1997 2009 19 MLDTotal dredge volume Lower <strong>Fraser</strong> Lower <strong>Fraser</strong> <strong>River</strong> 1970 2006 19 m3Total farm area Lower <strong>Fraser</strong> Lower <strong>Fraser</strong> <strong>River</strong> 1991 2006 19 haTotal farm area Strait of Georgia Strait of Georgia 1991 2006 19 haTotal farm area Strait of Juan de Fuca Strait of Juan de Fuca 1991 2006 19 haContaminants Mill effluent loading Strait of Georgia 1989 1999 19 mg/d x100Marine vessels Gross register tonnage (domestic) Strait of Georgia 1998 2008 19 tons99 Pink Salmon Pink <strong>salmon</strong> abundance NE Pacific Other North Pacific Ocean 1952 2005 19 millions of fishStockCountUnits99 Pink Salmon Pink <strong>salmon</strong> abundance Russia Other North Pacific Ocean 1952 2005 19 millions of fish99 Pink Salmon Pink <strong>salmon</strong> abundance ALL North Pacific Other North Pacific Ocean 1952 2005 19 millions of fish173
A3.4 Data PreparationContractor <strong>data</strong> was received in Excel files of various formats - very few of the <strong>data</strong> setsreceived used the <strong>data</strong> template that had been developed. These <strong>data</strong> were imported to anAccess <strong>data</strong>base to accomplish the brood year adjustments. The non-template <strong>data</strong> setsarrived in many different, non-st<strong>and</strong>ardized forms, adding a layer of complexity to theirintegration into a single <strong>data</strong>base. Figure A3.4-1 shows the <strong>data</strong>base diagram for that<strong>cumulative</strong> <strong>impacts</strong> <strong>data</strong>base.Figure A3.4-1. The Cohen Commission <strong>cumulative</strong> effects <strong>data</strong>base diagram.174
Each <strong>data</strong> product received from the contractors was assigned a unique identifier in theMeta<strong>data</strong> table. Each <strong>data</strong> product was assigned to a variable name <strong>and</strong> where appropriatea variable subset was specified (for example, if August mean sea surface temperature wasreceived, the meta<strong>data</strong> record would specify “sea surface temperature” as the variable <strong>and</strong>“August mean” as the variable subset). The meta<strong>data</strong> table also specifies the location <strong>and</strong>units of the <strong>data</strong> product among other supplementary information. Table A3.4-2 shows anexample entry in the Meta<strong>data</strong> table.175
Table A3.4-2. An example entry in the Meta<strong>data</strong> table for Queen Charlotte Sound August mean sea surfacetemperature <strong>data</strong>.TOCOnlyMeta<strong>data</strong>ID 27ProjectID 4VariableIDSubsetIDStressorCatIDUnitIDLocationIDSpecificLocationSpatTempAggDetailsEstimationDetailsObservationTypeIDConfidenceIDInterestQuestionQualitativeCommentsSourceFileNameFALSESea surface temperatureAugust meanMarine conditions - physicalDegrees CelsiusQueen Charlotte SoundQCS SST <strong>data</strong>, average values on the 3 grid points. Correlations among grid points from 1982are ~0.995August average. Data from: ftp://ftp.emc.ncep.noaa.gov/cmb/sst/oimonth_v2/YEARLY_FILES/MeasuredWere there extremes in sea surface temperature that could have been responsible for extrememortality of <strong>Fraser</strong> <strong>River</strong> <strong>sockeye</strong> but not others (Columbia <strong>River</strong> or Barkley Sound)?QCS_SST.xlsThe actual observation <strong>data</strong> was imported to the QuantitativeData table (or theQualitativeData table where qualitative <strong>data</strong> was provided). Each entry in theQuantitativeData table is linked to a meta<strong>data</strong> record. The table Meta<strong>data</strong>Life stagesassociates the meta<strong>data</strong> records with the applicable life stage(s).For example, Table A3.4-3 shows the life stage associations for the August mean seasurface temperature <strong>data</strong> (Meta<strong>data</strong>ID 27).Table A3.4-3. The Meta<strong>data</strong>Life stages table associates the Queen Charlotte Sound August mean seasurface temperature <strong>data</strong> (Meta<strong>data</strong>ID 27) with two life stages.Meta<strong>data</strong>IDLife stage Name27 Migration to rearing areas-Marine27 Migration to spawning area-MarineObservation year to brood year adjustments are based on the BroodYearAdjustmentstable. This table contains the adjustment factor for each stock, life stage <strong>and</strong> age type.Table A3.4-4 shows the summary of the life history of <strong>Fraser</strong> <strong>River</strong> <strong>sockeye</strong> <strong>salmon</strong> thatwas used to determine the appropriate adjustments to make for each life stage. TableA3.4-5 shows the brood year adjustments used for the dominant age type of all stocksexcept Harrison, as expressed in the <strong>data</strong>base.176
Table A3.4-4. Summary of the life history of the <strong>Fraser</strong> <strong>River</strong> <strong>sockeye</strong> <strong>salmon</strong>. This table shows the timingof major stages <strong>and</strong> processes for the dominant age-types, including the year (relative to broodyear) during which each occurs. This information was used to guide the process of aligning theobservation values within each received <strong>data</strong> series with the brood year to which it would apply.BY = brood year. SoG = Strait of Georgia. LFR = Lower <strong>Fraser</strong> <strong>River</strong>. Sources: Burgner (1991);McKinnell et al. (2011)Life historyDevelopmentalStageProcessTiming of Dominant Age-TypeAll non-Harrison <strong>Fraser</strong> <strong>River</strong> stocks(age-type 4 2 )Harrison stock(age-type 4 1 )Season Year Comment Season Year CommentEGG Spawning Aug-Nov BY BYIncubation Winter BY+1 Winter BY+1ALEVINEmergenceApril -early JuneSummer - BY+1FRY toPARRFreshwaterrearingWinterWinter - BY+2SpringSMOLT Outmigration April/May BY+2BY+2POST-SMOLTADULTEstuaryrearingSoG passageCoastalmigrationGrowth <strong>and</strong>maturation inNorth PacificMigratetowards<strong>Fraser</strong> <strong>River</strong>Lower <strong>Fraser</strong><strong>River</strong> passageUpstreammigrationSpawningBY+1 Spring BY+1minimal orn/aby late May BY+2 dispersedN&W from<strong>Fraser</strong>byJune/JulybyAug/Septby lateAutumn/earlyWinterBY+2BY+2BY+2BY+3most leftSoGspreadalong coastmoveoffshoreSpring/SummerBY+1 up to 5months inestuaryby late July BY+1 enter <strong>Fraser</strong>plumebyBY+1 dispersed intoAug/SeptSoGby Autumn BY+1 migration tocontinentalshelfBY+1BY+2BY+3Spring BY+4 Spring BY+4July - earlySeptmid-June -mid-OctBY+4BY+4BY+4PassingthroughStrait ofGeorgiaFiner scaleby runtiminggroupmid-Aug -early OctBY+4late run groupAug-Nov BY+4 Sept-Oct BY+4 (based onLFR passage)177
Table A3.4-5. Brood year adjustment factors for the 4 2 age type (used for all stocks except Harrison).AgeType Adjustment Life stage Name4sub2 0 Spawning-Freshwater4sub2 -1 Incubation-Freshwater4sub2 -1 Emergence-Freshwater4sub2 -1 Freshwater rearing4sub2 -2 Freshwater rearing4sub2 -2 Smolt outmigration-Freshwater4sub2 -2 Estuary rearing4sub2 -2 Migration to rearing areas-Marine4sub2 -2 Growth <strong>and</strong> maturation-Marine4sub2 -3 Growth <strong>and</strong> maturation-Marine4sub2 -4 Migration to spawning area-Marine4sub2 -4 Spawning-FreshwaterThe unique lifecycle of the Harrison stock is captured in the BroodYearAdjustments tableunder the 4 1 age type (Table A3.4-6). Although not shown here, the subdominant agetype brood year adjustments are also captured in the BroodYearAdjustments table (agetype 5 2 for all stocks except Harrison, age type 3 1 for Harrison). Brood year adjustmentswere made for the subdominant age classes however, at present, no analyses have beenperformed on these <strong>data</strong>.Table A3.4-6. Brood year adjustment factors for the 4 1 age type Harrison stock.StockName AgeType Adjustment Life stage NameHarrison 4sub1 0 Spawning-FreshwaterHarrison 4sub1 -1 Incubation-FreshwaterHarrison 4sub1 -1 Emergence-FreshwaterHarrison 4sub1 -1 Smolt outmigration-FreshwaterHarrison 4sub1 -1 Estuary rearingHarrison 4sub1 -1 Migration to rearing areas-MarineHarrison 4sub1 -1 Growth <strong>and</strong> maturation-MarineHarrison 4sub1 -2 Growth <strong>and</strong> maturation-MarineHarrison 4sub1 -3 Growth <strong>and</strong> maturation-MarineHarrison 4sub1 -4 Migration to spawning area-MarineHarrison 4sub1 -4 Spawning-FreshwaterA series of queries were run to format <strong>data</strong> for output <strong>and</strong> adjust the observation year <strong>data</strong>to brood year. First, <strong>data</strong> was pulled from 4 tables to format it succinctly for the broodyear adjustments (Figure A3.4-2). Each observation <strong>data</strong> value was aligned with itsvariable, variable subset, observation year, stock, location, <strong>and</strong> life stage.178
Figure A3.4-3. Querying <strong>data</strong> to prepare for brood year adjustment.These <strong>data</strong> were stored in a temporary table called OutputQuant. The stock <strong>and</strong> life stagevalues were used to join the OutputQuant table to the BroodYearAdjustment table(Figure A3.4-3).Figure A3.4-4 The query used to make the brood year adjustments.Observation years were adjusted to brood years based on stock, life stage <strong>and</strong> age-type.An example output from the brood year adjustment process is shown in Table A.3-4. Forthe 4 2 age type, the <strong>sockeye</strong> <strong>salmon</strong> from brood year 1985 would have experienced the1987 August mean sea surface temperature of 12.859 °C in Queen Charlotte Sound asthey migrated along the coast to their marine rearing areas. Two years later, the same<strong>sockeye</strong> <strong>salmon</strong> (brood year 1985) would have experienced the 1989 August mean seasurface temperature in Queen Charlotte sound of 14.83 °C if they migrated back to theirspawning areas via the northern diversion.179
Table A3.4-7. Example output from the brood year adjustment process.Meta<strong>data</strong>ID 27 27Variables.Name Sea surface temperature Sea surface temperatureSubsetName August mean August meanLocations.Name Queen Charlotte Sound Queen Charlotte SoundAgeType 4sub2 4sub2StockName E.Stuart E.StuartLife stages.Name Migration to rearing areas-Marine Migration to spawning area-MarineObservationYear 1987 1989BY Adjustment -2 -4BroodYear 1985 1985DataValue 12.85 14.83For analysis purposes, the brood year adjusted <strong>data</strong> was exported from the <strong>data</strong>base to csvfiles. Data was reported by stock <strong>and</strong> brood year for each variable, variable subset,location, life stage <strong>and</strong> age-type combination. These unique combinations were termed“variable sets”. Each variable set was assigned a unique identifier based on abbreviationsfor each component. Figure A3.4-5 shows the definition of an example variable set.Figure A3.4-5.Variable set definition.180
An example of final output <strong>data</strong> from the <strong>data</strong>base is shown in Table A3.4-8.Table A3.4-8 Example output from <strong>data</strong>base, ready for analysis. This example <strong>data</strong> set contains only themean August sea surface temperature for Queen Charlotte Sound as experienced by post-smoltspassing through during their migration to their ocean rearing areas, <strong>and</strong> only for one single broodyear. The <strong>data</strong> sets used in the analyses performed in the present project use many variables overmany years (refer to Appendix 3.5 <strong>and</strong> Appendix 4).Spawners lnRS BroodYear StockName RunTimingGroup SST_M08_QCSx_MGRR_DOM0.005758 3.754099 1985 Birkenhead Late 12.850.00303 1.845149 1985 Bowron Early Summer 12.850.034995 2.795625 1985 Chilko Summer 12.850.000195 2.523058 1985 Cultus Late 12.850.11661 2.338612 1985 E.Stuart Early Stuart 12.850.000696 3.893783 1985 Fennell Early Summer 12.850.002031 4.173986 1985 Gates Early Summer 12.850.001825 2.070912 1985 Harrison Late 12.60.000806 2.919312 1985 L.Shuswap Late 12.850.159101 3.093156 1985 L.Stuart Summer 12.850.007722 1.802942 1985 Nadina Early Summer 12.850.002088 2.40829 1985 Pitt Early Summer 12.850.00096 3.292746 1985 Portage Late 12.850.694708 2.893605 1985 Quesnel Summer 12.850.001922 0.858018 1985 Raft Early Summer 12.850.001422 3.432398 1985 Scotch Early Summer 12.850.002684 2.787198 1985 Seymour Early Summer 12.850.021968 1.768224 1985 Stellako Summer 12.850.022773 1.112869 1985 Weaver Late 12.85Table A3.4-9 shows the final set of variables available in the <strong>data</strong>base as aligned with theappropriate life stages to which each <strong>data</strong> series is associated.181
Table A3.4-9. The table of contents for all <strong>data</strong> sets within the <strong>cumulative</strong> <strong>impacts</strong> <strong>data</strong>base, as aligned with the life history affected, by brood year. Each lifehistory stage that a particular variable affects is treated as a separate variable in the <strong>data</strong>base because it often requires the raw observation <strong>data</strong> to beadjusted by different amount in order to correctly align with the brood year that would be affected by that particular stressor in that particular life stage.This table only shows the <strong>data</strong> sets received as they line up with life stages for the 4sub2 age-types (the dominant age-type of all <strong>Fraser</strong> <strong>River</strong> <strong>sockeye</strong><strong>salmon</strong> stocks except Harrison). In the full <strong>data</strong>base, these <strong>data</strong> are also lined up with the dominant age-type for Harrison (4sub1) <strong>and</strong> the subdominantage-type for all non-Harrison stocks (5sub2) <strong>and</strong> the Harrison stock (3sub1). A “stock count” of less than 19 implies that there are multiple, stockspecific<strong>data</strong> series for that particular variables, whereas generally a stock count of 19 implies that there is only a single <strong>data</strong> series, which has beenapplied to all stocks.ProjectNumberProject Variable Subset Location Life stage Age Type2 Contaminants2 Contaminants2 Contaminants2 Contaminants2 Contaminants2 Contaminants2 Contaminants2 Contaminants2 Contaminants2 Contaminants2 Contaminants2 ContaminantsCCME Water QualityIndexCCME Water QualityIndexCCME Water QualityIndexCCME Water QualityIndexCCME Water QualityIndexCCME Water QualityIndexCCME Water QualityIndex - QualitativeCCME Water QualityIndex - QualitativeCCME Water QualityIndex - QualitativeCCME Water QualityIndex - QualitativeCCME Water QualityIndex - QualitativeCCME Water QualityIndex - QualitativeOutmigrationRearingSpawningSpawningSpawningUpstream migrationOutmigrationRearingSpawningSpawningSpawningUpstream migration3 Freshwater ecology Area forest harvested Mainstem spawning areas3 Freshwater ecology Area forest harvested Mainstem spawning areas3 Freshwater ecology Area forest harvested Mainstem spawning areas<strong>Fraser</strong> Watershed -Migration Areas<strong>Fraser</strong> Watershed -Rearing Areas<strong>Fraser</strong> Watershed -Spawning Areas<strong>Fraser</strong> Watershed -Spawning Areas<strong>Fraser</strong> Watershed -Spawning Areas<strong>Fraser</strong> Watershed -Migration Areas<strong>Fraser</strong> Watershed -Migration Areas<strong>Fraser</strong> Watershed -Rearing Areas<strong>Fraser</strong> Watershed -Spawning Areas<strong>Fraser</strong> Watershed -Spawning Areas<strong>Fraser</strong> Watershed -Spawning Areas<strong>Fraser</strong> Watershed -Migration Areas<strong>Fraser</strong> Watershed -Spawning Areas<strong>Fraser</strong> Watershed -Spawning Areas<strong>Fraser</strong> Watershed -Spawning AreasStockCountMin of BroodYear4sub2 17 1965 2008Freshwater rearing 4sub2 10 1969 2009Smolt outmigration-FreshwaterEmergence-Freshwater4sub2 9 1969 2009Incubation-Freshwater 4sub2 9 1969 2009Spawning-Freshwater 4sub2 9 1966 2006Migration to spawningarea-Marine4sub2 18 1963 20064sub2 17 1946 2008Freshwater rearing 4sub2 10 1946 2009Smolt outmigration-FreshwaterEmergence-Freshwater4sub2 9 1947 2009Incubation-Freshwater 4sub2 9 1947 2009Spawning-Freshwater 4sub2 9 1944 2006Migration to spawningarea-MarineEmergence-Freshwater4sub2 18 1944 20064sub2 11 1979 2009Incubation-Freshwater 4sub2 11 1979 2009Spawning-Freshwater 4sub2 11 1976 20063 Freshwater ecology Area forest harvested Migration corridor <strong>Fraser</strong> Watershed - Migration to spawning 4sub2 17 1976 2006Max ofBrood Year182
ProjectNumberProject Variable Subset Location Life stage Age TypeMigration Areasarea-MarineStockCountMin of BroodYearMax ofBrood Year3 Freshwater ecology Area forest harvested Migration corridor3 Freshwater ecology Area forest harvested Nursery lakes3 Freshwater ecology Area forest harvested Tributary spawning areas3 Freshwater ecology Area forest harvested Tributary spawning areas3 Freshwater ecology Area forest harvested Tributary spawning areas3 Freshwater ecology Human population density Mainstem spawning areas3 Freshwater ecology Human population density Mainstem spawning areas3 Freshwater ecology Human population density Mainstem spawning areas3 Freshwater ecology Human population density Migration corridor3 Freshwater ecology Human population density Migration corridor3 Freshwater ecology Human population density Nursery lakes3 Freshwater ecology Human population density Tributary spawning areas3 Freshwater ecology Human population density Tributary spawning areas3 Freshwater ecology Human population density Tributary spawning areas3 Freshwater ecology Lake influence NULL3 Freshwater ecology Lake influence NULL3 Freshwater ecology Lake influence NULL3 Freshwater ecology Road density Mainstem spawning areas3 Freshwater ecology Road density Mainstem spawning areas3 Freshwater ecology Road density Mainstem spawning areas<strong>Fraser</strong> Watershed -Migration Areas<strong>Fraser</strong> Watershed -Rearing Areas<strong>Fraser</strong> Watershed -Spawning Areas<strong>Fraser</strong> Watershed -Spawning Areas<strong>Fraser</strong> Watershed -Spawning Areas<strong>Fraser</strong> Watershed -Spawning Areas<strong>Fraser</strong> Watershed -Spawning Areas<strong>Fraser</strong> Watershed -Spawning Areas<strong>Fraser</strong> Watershed -Migration Areas<strong>Fraser</strong> Watershed -Migration Areas<strong>Fraser</strong> Watershed -Rearing Areas<strong>Fraser</strong> Watershed -Spawning Areas<strong>Fraser</strong> Watershed -Spawning Areas<strong>Fraser</strong> Watershed -Spawning Areas<strong>Fraser</strong> Watershed -Spawning Areas<strong>Fraser</strong> Watershed -Spawning Areas<strong>Fraser</strong> Watershed -Spawning Areas<strong>Fraser</strong> Watershed -Spawning Areas<strong>Fraser</strong> Watershed -Spawning Areas<strong>Fraser</strong> Watershed -Spawning Areas4sub2 17 1978 2008Freshwater rearing 4sub2 16 1978 2009Smolt outmigration-FreshwaterEmergence-Freshwater4sub2 2 1979 2009Incubation-Freshwater 4sub2 2 1979 2009Spawning-Freshwater 4sub2 2 1976 2006Emergence-Freshwater4sub2 11 1985 2008Incubation-Freshwater 4sub2 11 1985 2008Spawning-Freshwater 4sub2 11 1982 2005Migration to spawningarea-Marine4sub2 17 1982 20054sub2 17 1984 2007Freshwater rearing 4sub2 17 1984 2008Smolt outmigration-FreshwaterEmergence-Freshwater4sub2 13 1985 2008Incubation-Freshwater 4sub2 13 1985 2008Spawning-Freshwater 4sub2 13 1982 2005Emergence-Freshwater4sub2 16 2008 2008Incubation-Freshwater 4sub2 16 2008 2008Spawning-Freshwater 4sub2 16 2005 2005Emergence-Freshwater4sub2 12 2008 2008Incubation-Freshwater 4sub2 12 2008 2008Spawning-Freshwater 4sub2 12 2005 20053 Freshwater ecology Road density Migration corridor <strong>Fraser</strong> Watershed - Migration to spawning 4sub2 17 2005 2005183
ProjectNumberProject Variable Subset Location Life stage Age TypeMigration Areasarea-MarineStockCountMin of BroodYearMax ofBrood Year3 Freshwater ecology Road density Migration corridor3 Freshwater ecology Road density Nursery lakes3 Freshwater ecology Road density Tributary spawning areas3 Freshwater ecology Road density Tributary spawning areas3 Freshwater ecology Road density Tributary spawning areas3 Freshwater ecology Spring air temperature NULL3 Freshwater ecology Summer air temperature CU set 13 Freshwater ecology Summer air temperature CU set 24 Marine ecology Chlorophyll concentration 30 March - 22 April4 Marine ecology Chlorophyll concentration April mean4 Marine ecology Chlorophyll concentration August mean4 Marine ecology Chlorophyll concentration August mean4 Marine ecology Chlorophyll concentration July mean4 Marine ecology Chlorophyll concentration July mean4 Marine ecology Chlorophyll concentration June mean4 Marine ecology Chlorophyll concentration June mean4 Marine ecology Chlorophyll concentration May mean4 Marine ecology Chlorophyll concentration May mean4 Marine ecology Chlorophyll concentration September mean4 Marine ecology North Pacific Index Anomalies<strong>Fraser</strong> Watershed -Migration Areas<strong>Fraser</strong> Watershed -Rearing Areas<strong>Fraser</strong> Watershed -Spawning Areas<strong>Fraser</strong> Watershed -Spawning Areas<strong>Fraser</strong> Watershed -Spawning Areas<strong>Fraser</strong> Watershed -Rearing Areas<strong>Fraser</strong> Watershed -Migration Areas<strong>Fraser</strong> Watershed -Migration AreasQueenSoundQueenSoundQueenSoundQueenSoundQueenSoundQueenSoundQueenSoundQueenSoundQueenSoundQueenSoundQueenSoundCharlotteCharlotteCharlotteCharlotteCharlotteCharlotteCharlotteCharlotteCharlotteCharlotteCharlotteOther North PacificOcean4sub2 17 2007 2007Freshwater rearing 4sub2 17 2007 2008Smolt outmigration-FreshwaterEmergence-Freshwater4sub2 13 2008 2008Incubation-Freshwater 4sub2 13 2008 2008Spawning-Freshwater 4sub2 13 2005 2005Smolt outmigration-FreshwaterMigration to spawningarea-MarineMigration to spawningarea-MarineMigration to rearingareas-MarineMigration to rearingareas-MarineMigration to rearingareas-MarineMigration to spawningarea-MarineMigration to rearingareas-MarineMigration to spawningarea-MarineMigration to rearingareas-MarineMigration to spawningarea-MarineMigration to rearingareas-MarineMigration to spawningarea-MarineMigration to spawningarea-MarineGrowth <strong>and</strong>maturation-Marine4sub2 17 1946 20074sub2 17 1944 20054sub2 5 1944 20054sub2 ALL 1996 20074sub2 ALL 1996 20074sub2 ALL 1996 20074sub2 ALL 1994 20054sub2 ALL 1996 20074sub2 ALL 1994 20054sub2 ALL 1996 20074sub2 ALL 1994 20054sub2 ALL 1996 20064sub2 ALL 1994 20044sub2 ALL 1993 20054sub2 ALL 1897 20074 Marine ecology North Pacific Index Nov-Mar Average Other North Pacific Growth <strong>and</strong> 4sub2 ALL 1897 2007184
ProjectNumberProject Variable Subset Location Life stage Age TypeOceanmaturation-MarineStockCountMin of BroodYearMax ofBrood Year4 Marine ecology <strong>River</strong> discharge Wannock (<strong>River</strong>s Inlet)QueenSoundCharlotteMigration to rearingareas-Marine4sub2 ALL 1927 20074 Marine ecology Sea surface salinity April meanQueenSoundCharlotteMigration to rearingareas-Marine4sub2 ALL 1968 20084 Marine ecology Sea surface salinity April-Aug averageQueenSoundCharlotteMigration to rearingareas-Marine4sub2 ALL 1968 20084 Marine ecology Sea surface salinity August meanQueenSoundCharlotteMigration to rearingareas-Marine4sub2 ALL 1968 20074 Marine ecology Sea surface salinity August meanQueenSoundCharlotteMigration to spawningarea-Marine4sub2 ALL 1966 20054 Marine ecology Sea surface salinity July meanQueenSoundCharlotteMigration to rearingareas-Marine4sub2 ALL 1968 20084 Marine ecology Sea surface salinity July meanQueenSoundCharlotteMigration to spawningarea-Marine4sub2 ALL 1966 20064 Marine ecology Sea surface salinity June meanQueenSoundCharlotteMigration to rearingareas-Marine4sub2 ALL 1968 20084 Marine ecology Sea surface salinity June meanQueenSoundCharlotteMigration to spawningarea-Marine4sub2 ALL 1966 20064 Marine ecology Sea surface salinity May meanQueenSoundCharlotteMigration to rearingareas-Marine4sub2 ALL 1968 20084 Marine ecology Sea surface salinity May meanQueenSoundCharlotteMigration to spawningarea-Marine4sub2 ALL 1966 20064 Marine ecology Sea surface salinity May-Sept averageQueenSoundCharlotteMigration to spawningarea-Marine4sub2 ALL 1966 20064 Marine ecology Sea surface salinity September meanQueenSoundCharlotteMigration to spawningarea-Marine4sub2 ALL 1966 20054 Marine ecology Sea surface temperature August meanQueenSoundCharlotteMigration to rearingareas-Marine4sub2 ALL 1980 20074 Marine ecology Sea surface temperature August meanQueenSoundCharlotteMigration to spawningarea-Marine4sub2 ALL 1978 20054 Marine ecology Sea surface temperature August-June differenceQueenSoundCharlotteMigration to rearingareas-Marine4sub2 ALL 1980 20074 Marine ecology Sea surface temperature August-June differenceQueenSoundCharlotteMigration to spawningarea-Marine4sub2 ALL 1978 20054 Marine ecology Sea surface temperature July meanQueenSoundCharlotteMigration to rearingareas-Marine4sub2 ALL 1980 20074 Marine ecology Sea surface temperature July meanQueenSoundCharlotteMigration to spawningarea-Marine4sub2 ALL 1978 20054 Marine ecology Sea surface temperature July-Aug averageQueenSoundCharlotteMigration to rearingareas-Marine4sub2 ALL 1980 20074 Marine ecology Sea surface temperature July-Aug average Queen Charlotte Migration to spawning 4sub2 ALL 1978 2005185
ProjectNumberProject Variable Subset Location Life stage Age TypeSoundarea-MarineStockCountMin of BroodYearMax ofBrood Year4 Marine ecology Sea surface temperature July-June difference4 Marine ecology Sea surface temperature July-June difference4 Marine ecology Summer wind regime FACTOR4 Marine ecology Summer wind regime U-direction4 Marine ecology Summer wind regime V-direction888888888888888Predation (marine <strong>and</strong>freshwater)Predation (marine <strong>and</strong>freshwater)Predation (marine <strong>and</strong>freshwater)Predation (marine <strong>and</strong>freshwater)Predation (marine <strong>and</strong>freshwater)Predation (marine <strong>and</strong>freshwater)Predation (marine <strong>and</strong>freshwater)Predation (marine <strong>and</strong>freshwater)Predation (marine <strong>and</strong>freshwater)Predation (marine <strong>and</strong>freshwater)Predation (marine <strong>and</strong>freshwater)Predation (marine <strong>and</strong>freshwater)Predation (marine <strong>and</strong>freshwater)Predation (marine <strong>and</strong>freshwater)Predation (marine <strong>and</strong>freshwater)QueenSoundQueenSoundQueenSoundQueenSoundQueenSoundAlternate prey BC herring-CC BC Central CoastAlternate prey BC herring-CC BC Central CoastAlternate prey BC herring-CC BC Central CoastCharlotteCharlotteCharlotteCharlotteCharlotteAlternate prey BC herring-PRD Prince Rupert DistrictAlternate prey BC herring-PRD Prince Rupert DistrictAlternate prey BC herring-PRD Prince Rupert DistrictAlternate preyAlternate preyAlternate preyBC herring-QCIBC herring-QCIBC herring-QCIQueenIsl<strong>and</strong>sQueenIsl<strong>and</strong>sQueenIsl<strong>and</strong>sAlternate prey BC herring-SoG Strait of GeorgiaAlternate prey BC herring-SoG Strait of GeorgiaAlternate prey BC herring-SoG Strait of GeorgiaAlternate preyAlternate preyAlternate preyBC herring-WCVIBC herring-WCVIBC herring-WCVICharlotteCharlotteCharlotteWest CoastVancouver Isl<strong>and</strong>West CoastVancouver Isl<strong>and</strong>West CoastVancouver Isl<strong>and</strong>Migration to rearingareas-MarineMigration to spawningarea-MarineMigration to rearingareas-MarineMigration to rearingareas-MarineMigration to rearingareas-MarineGrowth <strong>and</strong>maturation-MarineMigration to rearingareas-MarineMigration to spawningarea-MarineGrowth <strong>and</strong>maturation-MarineMigration to rearingareas-MarineMigration to spawningarea-MarineGrowth <strong>and</strong>maturation-MarineMigration to rearingareas-MarineMigration to spawningarea-MarineGrowth <strong>and</strong>maturation-MarineMigration to rearingareas-MarineMigration to spawningarea-MarineGrowth <strong>and</strong>maturation-MarineMigration to rearingareas-MarineMigration to spawningarea-Marine4sub2 ALL 1980 20074sub2 ALL 1978 20054sub2 ALL 1946 20074sub2 ALL 1946 20074sub2 ALL 1946 20074sub2 ALL 1947 20064sub2 ALL 1948 20064sub2 ALL 1946 20044sub2 ALL 1947 20064sub2 ALL 1948 20064sub2 ALL 1946 20044sub2 ALL 1947 20064sub2 ALL 1948 20064sub2 ALL 1946 20044sub2 ALL 1947 20064sub2 ALL 1948 20064sub2 ALL 1946 20044sub2 ALL 1947 20064sub2 ALL 1948 20064sub2 ALL 1946 20048 Predation (marine <strong>and</strong> Alternate prey California Current Pacific NULL Growth <strong>and</strong> 4sub2 ALL 1963 2007186
ProjectNumberProject Variable Subset Location Life stage Age Typefreshwater) hake maturation-MarineStockCountMin of BroodYearMax ofBrood Year8Predation (marine <strong>and</strong>freshwater)Alternate preyCalifornia Current PacifichakeNULLMigration to rearingareas-Marine4sub2 ALL 1964 20078Predation (marine <strong>and</strong>freshwater)Alternate preyCalifornia Current PacifichakeNULLMigration to spawningarea-Marine4sub2 ALL 1962 20058Predation (marine <strong>and</strong>freshwater)Alternate prey Gulf of Alaska Pacific cod NULLGrowth <strong>and</strong>maturation-Marine4sub2 ALL 1981 20038Predation (marine <strong>and</strong>freshwater)Alternate prey Gulf of Alaska Pacific cod NULLMigration to rearingareas-Marine4sub2 ALL 1982 20038Predation (marine <strong>and</strong>freshwater)Alternate prey Gulf of Alaska Pacific cod NULLMigration to spawningarea-Marine4sub2 ALL 1980 20018Predation (marine <strong>and</strong>freshwater)Alternate prey Pacific Jack mackerel NULLGrowth <strong>and</strong>maturation-Marine4sub2 ALL 1947 20048Predation (marine <strong>and</strong>freshwater)Alternate prey Pacific Jack mackerel NULLMigration to rearingareas-Marine4sub2 ALL 1948 20048Predation (marine <strong>and</strong>freshwater)Alternate prey Pacific Jack mackerel NULLMigration to spawningarea-Marine4sub2 ALL 1946 20028Predation (marine <strong>and</strong>freshwater)Alternate prey Pacific mackerel NULLGrowth <strong>and</strong>maturation-Marine4sub2 ALL 1926 20078Predation (marine <strong>and</strong>freshwater)Alternate prey Pacific mackerel NULLMigration to rearingareas-Marine4sub2 ALL 1927 20078Predation (marine <strong>and</strong>freshwater)Alternate prey Pacific mackerel NULLMigration to spawningarea-Marine4sub2 ALL 1925 20058Predation (marine <strong>and</strong>freshwater)Alternate prey Walleye pollock NULLGrowth <strong>and</strong>maturation-Marine4sub2 ALL 1974 20058Predation (marine <strong>and</strong>freshwater)Alternate prey Walleye pollock NULLMigration to rearingareas-Marine4sub2 ALL 1975 20058Predation (marine <strong>and</strong>freshwater)Alternate prey Walleye pollock NULLMigration to spawningarea-Marine4sub2 ALL 1973 20038Predation (marine <strong>and</strong>freshwater)Alternate prey - quantile PRY average NULLGrowth <strong>and</strong>maturation-Marine4sub2 ALL 1926 20078Predation (marine <strong>and</strong>freshwater)Alternate prey - quantile PRY average NULLMigration to rearingareas-Marine4sub2 ALL 1927 20078Predation (marine <strong>and</strong>freshwater)Alternate prey - quantile PRY average NULLMigration to spawningarea-Marine4sub2 ALL 1925 20058Predation (marine <strong>and</strong>freshwater)Alternate prey - quantile Walleye pollock NULLGrowth <strong>and</strong>maturation-Marine4sub2 ALL 1974 20058Predation (marine <strong>and</strong>freshwater)Alternate prey - quantile Walleye pollock NULLMigration to rearingareas-Marine4sub2 ALL 1975 20058Predation (marine <strong>and</strong>freshwater)Alternate prey - quantile Walleye pollock NULLMigration to spawningarea-Marine4sub2 ALL 1973 20038 Predation (marine <strong>and</strong> Christmas Bird Count BC Bald eagle NULL Migration to spawning 4sub2 ALL 1953 2005187
ProjectNumberProject Variable Subset Location Life stage Age Typefreshwater)area-MarineStockCountMin of BroodYearMax ofBrood Year8Predation (marine <strong>and</strong>freshwater)Christmas Bird Count BC Br<strong>and</strong>ts cormorant NULLMigration to rearingareas-Marine4sub2 ALL 1956 20078Predation (marine <strong>and</strong>freshwater)Christmas Bird Count BC Common merganser NULLSmolt outmigration-Freshwater4sub2 ALL 1956 20078Predation (marine <strong>and</strong>freshwater)Christmas Bird Count BC Common murre NULLMigration to rearingareas-Marine4sub2 ALL 1955 20078Predation (marine <strong>and</strong>freshwater)Christmas Bird Count BC Cormorants, B+P NULLMigration to rearingareas-Marine4sub2 ALL 1955 20078Predation (marine <strong>and</strong>freshwater)Christmas Bird Count BC D-C cormorant NULLSmolt outmigration-Freshwater4sub2 ALL 1955 20078Predation (marine <strong>and</strong>freshwater)Christmas Bird Count BC Gulls NULLMigration to rearingareas-Marine4sub2 ALL 1955 20078Predation (marine <strong>and</strong>freshwater)Christmas Bird Count BC Pelagic cormorant NULLMigration to rearingareas-Marine4sub2 ALL 1955 20078Predation (marine <strong>and</strong>freshwater)Christmas Bird Count -quantileCBC MGRR averageNULLMigration to rearingareas-Marine4sub2 ALL 1955 20078Predation (marine <strong>and</strong>freshwater)Christmas Bird Count -quantileCBC SMLT averageNULLSmolt outmigration-Freshwater4sub2 ALL 1955 20078Predation (marine <strong>and</strong>freshwater)Fish predatorsArrowtoothbiomassflounderNULLMigration to rearingareas-Marine4sub2 ALL 1959 20058Predation (marine <strong>and</strong>freshwater)Fish predators Blue shark abundance NULLGrowth <strong>and</strong>maturation-Marine4sub2 ALL 1977 20008Predation (marine <strong>and</strong>freshwater)Fish predators Blue shark abundance NULLMigration to spawningarea-Marine4sub2 ALL 1976 19988Predation (marine <strong>and</strong>freshwater)Pinniped count California sea lions NULLMigration to rearingareas-Marine4sub2 ALL 1969 20078Predation (marine <strong>and</strong>freshwater)Pinniped count California sea lions NULLMigration to spawningarea-Marine4sub2 ALL 1967 20058Predation (marine <strong>and</strong>freshwater)Pinniped count Steller sea lion NULLMigration to rearingareas-Marine4sub2 ALL 1911 20088Predation (marine <strong>and</strong>freshwater)Pinniped count Steller sea lion NULLMigration to spawningarea-Marine4sub2 ALL 1909 20068Predation (marine <strong>and</strong>freshwater)Pinniped estimate California sea lions NULLMigration to rearingareas-Marine4sub2 ALL 1969 20078Predation (marine <strong>and</strong>freshwater)Pinniped estimate California sea lions NULLMigration to spawningarea-Marine4sub2 ALL 1967 20058Predation (marine <strong>and</strong>freshwater)Pinniped estimate Harbour seals NULLMigration to rearingareas-Marine4sub2 ALL 1911 20068Predation (marine <strong>and</strong>freshwater)Pinniped estimate Harbour seals NULLMigration to spawningarea-Marine4sub2 ALL 1909 20048 Predation (marine <strong>and</strong> Pinniped estimate Steller sea lion NULL Migration to rearing 4sub2 ALL 1911 2008188
ProjectNumberProject Variable Subset Location Life stage Age Typefreshwater)areas-MarineStockCountMin of BroodYearMax ofBrood Year8Predation (marine <strong>and</strong>freshwater)Pinniped estimate Steller sea lion NULLMigration to spawningarea-Marine4sub2 ALL 1909 20069 Climate changeLFR water temp forreturning adultsNULL<strong>Fraser</strong> Watershed -Migration AreasMigration to spawningarea-Marine4sub2 18 1947 20069 Climate changeLFR water temp forreturning adults -QualitiativeNULL<strong>Fraser</strong> Watershed -Migration AreasMigration to spawningarea-Marine4sub2 18 1944 200612Lwr <strong>Fraser</strong> <strong>River</strong> <strong>and</strong>Strait of Georgiahabitat inventoryChlorophyll concentration April mean Central Georgia StraitMigration to rearingareas-Marine4sub2 ALL 1996 200812Lwr <strong>Fraser</strong> <strong>River</strong> <strong>and</strong>Strait of Georgiahabitat inventoryChlorophyll concentrationApril meanNorthernStraitGeorgiaMigration to rearingareas-Marine4sub2 ALL 1996 200812Lwr <strong>Fraser</strong> <strong>River</strong> <strong>and</strong>Strait of Georgiahabitat inventoryChlorophyll concentration April mean Strait of Juan de FucaMigration to rearingareas-Marine4sub2 ALL 1996 200812Lwr <strong>Fraser</strong> <strong>River</strong> <strong>and</strong>Strait of Georgiahabitat inventoryChlorophyll concentration August mean Central Georgia StraitMigration to rearingareas-Marine4sub2 ALL 1996 200812Lwr <strong>Fraser</strong> <strong>River</strong> <strong>and</strong>Strait of Georgiahabitat inventoryChlorophyll concentration August mean Central Georgia StraitMigration to spawningarea-Marine4sub2 ALL 1994 200612Lwr <strong>Fraser</strong> <strong>River</strong> <strong>and</strong>Strait of Georgiahabitat inventoryChlorophyll concentrationAugust meanNorthernStraitGeorgiaMigration to rearingareas-Marine4sub2 ALL 1996 200812Lwr <strong>Fraser</strong> <strong>River</strong> <strong>and</strong>Strait of Georgiahabitat inventoryChlorophyll concentrationAugust meanNorthernStraitGeorgiaMigration to spawningarea-Marine4sub2 ALL 1994 200612Lwr <strong>Fraser</strong> <strong>River</strong> <strong>and</strong>Strait of Georgiahabitat inventoryChlorophyll concentration August mean Strait of Juan de FucaMigration to rearingareas-Marine4sub2 ALL 1996 200812Lwr <strong>Fraser</strong> <strong>River</strong> <strong>and</strong>Strait of Georgiahabitat inventoryChlorophyll concentration August mean Strait of Juan de FucaMigration to spawningarea-Marine4sub2 ALL 1994 200612Lwr <strong>Fraser</strong> <strong>River</strong> <strong>and</strong>Strait of Georgiahabitat inventoryChlorophyll concentration July mean Central Georgia StraitMigration to rearingareas-Marine4sub2 ALL 1996 200812Lwr <strong>Fraser</strong> <strong>River</strong> <strong>and</strong>Strait of Georgiahabitat inventoryChlorophyll concentration July mean Central Georgia StraitMigration to spawningarea-Marine4sub2 ALL 1994 200612Lwr <strong>Fraser</strong> <strong>River</strong> <strong>and</strong>Strait of Georgiahabitat inventoryChlorophyll concentrationJuly meanNorthernStraitGeorgiaMigration to rearingareas-Marine4sub2 ALL 1996 200812 Lwr <strong>Fraser</strong> <strong>River</strong> <strong>and</strong>Strait of GeorgiaChlorophyll concentrationJuly meanNorthernStraitGeorgiaMigration to spawningarea-Marine4sub2 ALL 1994 2006189
ProjectNumberProject Variable Subset Location Life stage Age Typehabitat inventoryStockCountMin of BroodYearMax ofBrood Year12Lwr <strong>Fraser</strong> <strong>River</strong> <strong>and</strong>Strait of Georgiahabitat inventoryChlorophyll concentration July mean Strait of Juan de FucaMigration to rearingareas-Marine4sub2 ALL 1996 200812Lwr <strong>Fraser</strong> <strong>River</strong> <strong>and</strong>Strait of Georgiahabitat inventoryChlorophyll concentration July mean Strait of Juan de FucaMigration to spawningarea-Marine4sub2 ALL 1994 200612Lwr <strong>Fraser</strong> <strong>River</strong> <strong>and</strong>Strait of Georgiahabitat inventoryChlorophyll concentration June mean Central Georgia StraitMigration to rearingareas-Marine4sub2 ALL 1996 200812Lwr <strong>Fraser</strong> <strong>River</strong> <strong>and</strong>Strait of Georgiahabitat inventoryChlorophyll concentration June mean Central Georgia StraitMigration to spawningarea-Marine4sub2 ALL 1994 200612Lwr <strong>Fraser</strong> <strong>River</strong> <strong>and</strong>Strait of Georgiahabitat inventoryChlorophyll concentrationJune meanNorthernStraitGeorgiaMigration to rearingareas-Marine4sub2 ALL 1996 200812Lwr <strong>Fraser</strong> <strong>River</strong> <strong>and</strong>Strait of Georgiahabitat inventoryChlorophyll concentrationJune meanNorthernStraitGeorgiaMigration to spawningarea-Marine4sub2 ALL 1994 200612Lwr <strong>Fraser</strong> <strong>River</strong> <strong>and</strong>Strait of Georgiahabitat inventoryChlorophyll concentration June mean Strait of Juan de FucaMigration to rearingareas-Marine4sub2 ALL 1996 200812Lwr <strong>Fraser</strong> <strong>River</strong> <strong>and</strong>Strait of Georgiahabitat inventoryChlorophyll concentration June mean Strait of Juan de FucaMigration to spawningarea-Marine4sub2 ALL 1994 200612Lwr <strong>Fraser</strong> <strong>River</strong> <strong>and</strong>Strait of Georgiahabitat inventoryChlorophyll concentration May mean Central Georgia StraitMigration to rearingareas-Marine4sub2 ALL 1996 200812Lwr <strong>Fraser</strong> <strong>River</strong> <strong>and</strong>Strait of Georgiahabitat inventoryChlorophyll concentration May mean Central Georgia StraitMigration to spawningarea-Marine4sub2 ALL 1994 200612Lwr <strong>Fraser</strong> <strong>River</strong> <strong>and</strong>Strait of Georgiahabitat inventoryChlorophyll concentrationMay meanNorthernStraitGeorgiaMigration to rearingareas-Marine4sub2 ALL 1996 200812Lwr <strong>Fraser</strong> <strong>River</strong> <strong>and</strong>Strait of Georgiahabitat inventoryChlorophyll concentrationMay meanNorthernStraitGeorgiaMigration to spawningarea-Marine4sub2 ALL 1994 200612Lwr <strong>Fraser</strong> <strong>River</strong> <strong>and</strong>Strait of Georgiahabitat inventoryChlorophyll concentration May mean Strait of Juan de FucaMigration to rearingareas-Marine4sub2 ALL 1996 200812Lwr <strong>Fraser</strong> <strong>River</strong> <strong>and</strong>Strait of Georgiahabitat inventoryChlorophyll concentration May mean Strait of Juan de FucaMigration to spawningarea-Marine4sub2 ALL 1994 200612Lwr <strong>Fraser</strong> <strong>River</strong> <strong>and</strong>Strait of Georgiahabitat inventoryChlorophyll concentration September mean Central Georgia StraitMigration to spawningarea-Marine4sub2 ALL 1994 2006190
ProjectNumber121212121212121212121212121212Project Variable Subset Location Life stage Age TypeLwr <strong>Fraser</strong> <strong>River</strong> <strong>and</strong>Strait of Georgiahabitat inventoryLwr <strong>Fraser</strong> <strong>River</strong> <strong>and</strong>Strait of Georgiahabitat inventoryLwr <strong>Fraser</strong> <strong>River</strong> <strong>and</strong>Strait of Georgiahabitat inventoryLwr <strong>Fraser</strong> <strong>River</strong> <strong>and</strong>Strait of Georgiahabitat inventoryLwr <strong>Fraser</strong> <strong>River</strong> <strong>and</strong>Strait of Georgiahabitat inventoryLwr <strong>Fraser</strong> <strong>River</strong> <strong>and</strong>Strait of Georgiahabitat inventoryLwr <strong>Fraser</strong> <strong>River</strong> <strong>and</strong>Strait of Georgiahabitat inventoryLwr <strong>Fraser</strong> <strong>River</strong> <strong>and</strong>Strait of Georgiahabitat inventoryLwr <strong>Fraser</strong> <strong>River</strong> <strong>and</strong>Strait of Georgiahabitat inventoryLwr <strong>Fraser</strong> <strong>River</strong> <strong>and</strong>Strait of Georgiahabitat inventoryLwr <strong>Fraser</strong> <strong>River</strong> <strong>and</strong>Strait of Georgiahabitat inventoryLwr <strong>Fraser</strong> <strong>River</strong> <strong>and</strong>Strait of Georgiahabitat inventoryLwr <strong>Fraser</strong> <strong>River</strong> <strong>and</strong>Strait of Georgiahabitat inventoryLwr <strong>Fraser</strong> <strong>River</strong> <strong>and</strong>Strait of Georgiahabitat inventoryLwr <strong>Fraser</strong> <strong>River</strong> <strong>and</strong>Strait of Georgiahabitat inventory12 Lwr <strong>Fraser</strong> <strong>River</strong> <strong>and</strong>Strait of GeorgiaChlorophyll concentrationSeptember meanNorthernStraitGeorgiaChlorophyll concentration September mean Strait of Juan de FucaContaminants Mill effluent loading Strait of GeorgiaContaminants Mill effluent loading Strait of GeorgiaLiquid waste Flow Strait of GeorgiaLiquid waste Flow Strait of GeorgiaMarine vesselsMarine vesselsGross register tonnage(domestic)Gross register tonnage(domestic)Strait of GeorgiaStrait of GeorgiaPopulation census Lower <strong>Fraser</strong> Lower <strong>Fraser</strong> <strong>River</strong>Population census Strait of Georgia Strait of GeorgiaPopulation census Strait of Georgia Strait of GeorgiaPopulation census Strait of Juan de Fuca Strait of Juan de FucaPopulation census Strait of Juan de Fuca Strait of Juan de Fuca<strong>River</strong> discharge<strong>River</strong> discharge<strong>River</strong> discharge<strong>Fraser</strong> discharge Apriltotal<strong>Fraser</strong> discharge Julytotal<strong>Fraser</strong> discharge JunetotalStrait of GeorgiaStrait of GeorgiaStrait of GeorgiaMigration to spawningarea-MarineMigration to spawningarea-MarineMigration to rearingareas-MarineMigration to spawningarea-MarineMigration to rearingareas-MarineMigration to spawningarea-MarineMigration to rearingareas-MarineMigration to spawningarea-MarineMigration to rearingareas-MarineMigration to spawningarea-MarineMigration to rearingareas-MarineMigration to spawningarea-MarineSmolt outmigration-FreshwaterSmolt outmigration-FreshwaterMigration to rearingareas-MarineMigration to rearingareas-MarineStockCountMin of BroodYear4sub2 ALL 1994 20064sub2 ALL 1994 20064sub2 ALL 1987 19974sub2 ALL 1985 19954sub2 ALL 1995 20074sub2 ALL 1993 20054sub2 ALL 1996 20064sub2 ALL 1994 20044sub2 ALL 1984 20044sub2 ALL 1984 20044sub2 ALL 1982 20024sub2 ALL 1984 20044sub2 ALL 1982 20024sub2 ALL 1968 20074sub2 ALL 1968 20074sub2 ALL 1968 2007Max ofBrood Year191
ProjectNumberProject Variable Subset Location Life stage Age Typehabitat inventoryStockCountMin of BroodYearMax ofBrood Year12Lwr <strong>Fraser</strong> <strong>River</strong> <strong>and</strong>Strait of Georgiahabitat inventory<strong>River</strong> discharge<strong>Fraser</strong> discharge MaytotalStrait of GeorgiaMigration to rearingareas-Marine4sub2 ALL 1968 200712Lwr <strong>Fraser</strong> <strong>River</strong> <strong>and</strong>Strait of Georgiahabitat inventory<strong>River</strong> discharge<strong>Fraser</strong> discharge MaytotalStrait of GeorgiaSmolt outmigration-Freshwater4sub2 ALL 1968 200712Lwr <strong>Fraser</strong> <strong>River</strong> <strong>and</strong>Strait of Georgiahabitat inventory<strong>River</strong> discharge June-July average Strait of GeorgiaMigration to rearingareas-Marine4sub2 ALL 1968 200712Lwr <strong>Fraser</strong> <strong>River</strong> <strong>and</strong>Strait of Georgiahabitat inventorySea surface salinity April mean Strait of GeorgiaMigration to rearingareas-Marine4sub2 ALL 1935 200712Lwr <strong>Fraser</strong> <strong>River</strong> <strong>and</strong>Strait of Georgiahabitat inventorySea surface salinity April-Aug average Strait of GeorgiaMigration to rearingareas-Marine4sub2 ALL 1934 200712Lwr <strong>Fraser</strong> <strong>River</strong> <strong>and</strong>Strait of Georgiahabitat inventorySea surface salinity April-Aug average Strait of GeorgiaMigration to spawningarea-Marine4sub2 ALL 1932 200512Lwr <strong>Fraser</strong> <strong>River</strong> <strong>and</strong>Strait of Georgiahabitat inventorySea surface salinity August mean Strait of GeorgiaMigration to rearingareas-Marine4sub2 ALL 1934 200712Lwr <strong>Fraser</strong> <strong>River</strong> <strong>and</strong>Strait of Georgiahabitat inventorySea surface salinity August mean Strait of GeorgiaMigration to spawningarea-Marine4sub2 ALL 1932 200512Lwr <strong>Fraser</strong> <strong>River</strong> <strong>and</strong>Strait of Georgiahabitat inventorySea surface salinity July mean Strait of GeorgiaMigration to rearingareas-Marine4sub2 ALL 1934 200612Lwr <strong>Fraser</strong> <strong>River</strong> <strong>and</strong>Strait of Georgiahabitat inventorySea surface salinity July mean Strait of GeorgiaMigration to spawningarea-Marine4sub2 ALL 1932 200412Lwr <strong>Fraser</strong> <strong>River</strong> <strong>and</strong>Strait of Georgiahabitat inventorySea surface salinity June mean Strait of GeorgiaMigration to rearingareas-Marine4sub2 ALL 1934 200712Lwr <strong>Fraser</strong> <strong>River</strong> <strong>and</strong>Strait of Georgiahabitat inventorySea surface salinity June mean Strait of GeorgiaMigration to spawningarea-Marine4sub2 ALL 1932 200512Lwr <strong>Fraser</strong> <strong>River</strong> <strong>and</strong>Strait of Georgiahabitat inventorySea surface salinity May mean Strait of GeorgiaMigration to rearingareas-Marine4sub2 ALL 1934 200712Lwr <strong>Fraser</strong> <strong>River</strong> <strong>and</strong>Strait of Georgiahabitat inventorySea surface salinity May mean Strait of GeorgiaMigration to spawningarea-Marine4sub2 ALL 1932 200512Lwr <strong>Fraser</strong> <strong>River</strong> <strong>and</strong>Strait of Georgiahabitat inventorySea surface salinity May-Sept average Strait of GeorgiaMigration to spawningarea-Marine4sub2 ALL 1932 2005192
ProjectNumber121212121212121212121212121212Project Variable Subset Location Life stage Age TypeLwr <strong>Fraser</strong> <strong>River</strong> <strong>and</strong>Strait of Georgiahabitat inventoryLwr <strong>Fraser</strong> <strong>River</strong> <strong>and</strong>Strait of Georgiahabitat inventoryLwr <strong>Fraser</strong> <strong>River</strong> <strong>and</strong>Strait of Georgiahabitat inventoryLwr <strong>Fraser</strong> <strong>River</strong> <strong>and</strong>Strait of Georgiahabitat inventoryLwr <strong>Fraser</strong> <strong>River</strong> <strong>and</strong>Strait of Georgiahabitat inventoryLwr <strong>Fraser</strong> <strong>River</strong> <strong>and</strong>Strait of Georgiahabitat inventoryLwr <strong>Fraser</strong> <strong>River</strong> <strong>and</strong>Strait of Georgiahabitat inventoryLwr <strong>Fraser</strong> <strong>River</strong> <strong>and</strong>Strait of Georgiahabitat inventoryLwr <strong>Fraser</strong> <strong>River</strong> <strong>and</strong>Strait of Georgiahabitat inventoryLwr <strong>Fraser</strong> <strong>River</strong> <strong>and</strong>Strait of Georgiahabitat inventoryLwr <strong>Fraser</strong> <strong>River</strong> <strong>and</strong>Strait of Georgiahabitat inventoryLwr <strong>Fraser</strong> <strong>River</strong> <strong>and</strong>Strait of Georgiahabitat inventoryLwr <strong>Fraser</strong> <strong>River</strong> <strong>and</strong>Strait of Georgiahabitat inventoryLwr <strong>Fraser</strong> <strong>River</strong> <strong>and</strong>Strait of Georgiahabitat inventoryLwr <strong>Fraser</strong> <strong>River</strong> <strong>and</strong>Strait of Georgiahabitat inventory12 Lwr <strong>Fraser</strong> <strong>River</strong> <strong>and</strong>Strait of GeorgiaSea surface salinity September mean Strait of GeorgiaSea surface temperature April mean Strait of GeorgiaSea surface temperature April-Aug average Strait of GeorgiaSea surface temperature August mean Strait of GeorgiaSea surface temperature August mean Strait of GeorgiaSea surface temperature July mean Strait of GeorgiaSea surface temperature July mean Strait of GeorgiaSea surface temperature June mean Strait of GeorgiaSea surface temperature June mean Strait of GeorgiaSea surface temperature May mean Strait of GeorgiaSea surface temperature May mean Strait of GeorgiaSea surface temperature September mean Strait of GeorgiaSolid waste disposed Lower <strong>Fraser</strong> Lower <strong>Fraser</strong> <strong>River</strong>Solid waste disposed Strait of Georgia Strait of GeorgiaSolid waste disposed Strait of Georgia Strait of GeorgiaSolid waste disposed Strait of Juan de Fuca Strait of Juan de FucaMigration to spawningarea-MarineMigration to rearingareas-MarineMigration to rearingareas-MarineMigration to rearingareas-MarineMigration to spawningarea-MarineMigration to rearingareas-MarineMigration to spawningarea-MarineMigration to rearingareas-MarineMigration to spawningarea-MarineMigration to rearingareas-MarineMigration to spawningarea-MarineMigration to spawningarea-MarineSmolt outmigration-FreshwaterMigration to rearingareas-MarineMigration to spawningarea-MarineMigration to rearingareas-MarineStockCountMin of BroodYear4sub2 ALL 1932 20054sub2 ALL 1935 20074sub2 ALL 1934 20074sub2 ALL 1934 20074sub2 ALL 1932 20054sub2 ALL 1934 20074sub2 ALL 1932 20054sub2 ALL 1934 20074sub2 ALL 1932 20054sub2 ALL 1934 20074sub2 ALL 1932 20054sub2 ALL 1932 20054sub2 ALL 1988 20044sub2 ALL 1988 20044sub2 ALL 1986 20024sub2 ALL 1988 2004Max ofBrood Year193
ProjectNumberProject Variable Subset Location Life stage Age Typehabitat inventoryStockCountMin of BroodYearMax ofBrood Year12Lwr <strong>Fraser</strong> <strong>River</strong> <strong>and</strong>Strait of Georgiahabitat inventorySolid waste disposed Strait of Juan de Fuca Strait of Juan de FucaMigration to spawningarea-Marine4sub2 ALL 1986 200212Lwr <strong>Fraser</strong> <strong>River</strong> <strong>and</strong>Strait of Georgiahabitat inventoryTotal dredge volume Lower <strong>Fraser</strong> Lower <strong>Fraser</strong> <strong>River</strong>Smolt outmigration-Freshwater4sub2 ALL 1968 200412Lwr <strong>Fraser</strong> <strong>River</strong> <strong>and</strong>Strait of Georgiahabitat inventoryTotal farm area Lower <strong>Fraser</strong> Lower <strong>Fraser</strong> <strong>River</strong>Smolt outmigration-Freshwater4sub2 ALL 1989 200412Lwr <strong>Fraser</strong> <strong>River</strong> <strong>and</strong>Strait of Georgiahabitat inventoryTotal farm area Strait of Georgia Strait of GeorgiaMigration to rearingareas-Marine4sub2 ALL 1989 200412Lwr <strong>Fraser</strong> <strong>River</strong> <strong>and</strong>Strait of Georgiahabitat inventoryTotal farm area Strait of Georgia Strait of GeorgiaMigration to spawningarea-Marine4sub2 ALL 1987 200212Lwr <strong>Fraser</strong> <strong>River</strong> <strong>and</strong>Strait of Georgiahabitat inventoryTotal farm area Strait of Juan de Fuca Strait of Juan de FucaMigration to rearingareas-Marine4sub2 ALL 1989 200412Lwr <strong>Fraser</strong> <strong>River</strong> <strong>and</strong>Strait of Georgiahabitat inventoryTotal farm area Strait of Juan de Fuca Strait of Juan de FucaMigration to spawningarea-Marine4sub2 ALL 1987 200299 Pink Salmon Pink <strong>salmon</strong> abundance ALL North PacificOther North PacificOceanMigration to spawningarea-Marine4sub2 ALL 1948 200199 Pink Salmon Pink <strong>salmon</strong> abundance NE PacificOther North PacificOceanMigration to spawningarea-Marine4sub2 ALL 1948 200199 Pink Salmon Pink <strong>salmon</strong> abundance RussiaOther North PacificOceanMigration to spawningarea-Marine4sub2 ALL 1948 2001194
A3.5 Data AnalysisA3.5.1 Qualitative analysesWe have employed a series of integrative frameworks to illustrate potential <strong>cumulative</strong> <strong>impacts</strong>of multiple stressors on <strong>Fraser</strong> <strong>River</strong> <strong>sockeye</strong> <strong>salmon</strong> over time <strong>and</strong> space. Where appropriate wehave taken a life history approach to <strong>cumulative</strong> impact analysis. The frameworks utilized are:a) a weight of evidence framework for retrospective ecological risk assessmentb) a conceptual model comprising a life history diagram with the pathways of differentstressors (including both direct <strong>and</strong> delayed effects);c) a spatial life history diagram illustrating the spatial scale of the <strong>sockeye</strong>’s life cycle <strong>and</strong>the location of different stressors (as <strong>data</strong> permits); <strong>and</strong>d) an expert-driven evaluation of the relative likelihood of each given hypothesis, buildingon the Expert Panel Report to the Pacific Salmon Commission on the Decline of <strong>Fraser</strong>Sockeye (Peterman et al. 2010)A weight of evidence approach to retrospective ecological risk assessment 19Weight of EvidenceIn the present project we apply a weight of evidence (WOE) approach to synthesize evidencepresented across the scientific <strong>and</strong> technical projects, incorporate new evidence generated by thestatistical analyses for select <strong>data</strong> put forth by the contractors for each project, <strong>and</strong> assess theoverall likelihood. Weed (2005) conducted a review of the concept of WOE <strong>and</strong> its associatedmethods. He concluded that although the term is used throughout the scientific literature, it maybe used to represent many different types of methodologies from established formal methods toinformal metaphorical perspectives <strong>and</strong> that no common definition exists. Weed (2005)emphasizes that given the variation in the use of the term, it is critical to define what “WOE”means in the context of any given research project.The two key objectives defining our WOE approach are:1. Use the full breadth of evidence presented within the Cohen Commission projects.2. Synthesize <strong>and</strong> evaluate the evidence within a logical <strong>and</strong> systematic framework.19 This section represents an exp<strong>and</strong>ed description of the Weight of Evidence Approach to Retrospective EcologicalRisk Assessment already presented in Section 3.3.5 of the main body of the report. The present section exp<strong>and</strong>supon Section 3.3.5, providing a much more thorough explanation of the approach, especially with regards to thefoundational literature upon which our approach is based. Consequently, the material in Section 3.3.5 is repeatedhere.195
The objective of our approach is to use, wherever possible, all the major sources of evidencebrought forth by the investigations <strong>and</strong> analyses presented in the other Cohen Commissiontechnical projects. Whereas it is not realistic to use every single piece of evidence presented inthis body of scientific work, the intent is to incorporate the breadth of evidence presented,recognizing that the weight of evidence <strong>synthesis</strong> cannot possibly capture the depth of evidencepresented within each project. However, this approach still requires the compilation <strong>and</strong><strong>synthesis</strong> of many different types of both qualitative <strong>and</strong> quantitative evidence (as describedabove), available over varying timeframes. All of these lines of evidence are then examined <strong>and</strong>presented within a logical <strong>and</strong> systematic framework. The structure of this framework is basedon the work of Forbes <strong>and</strong> Callow (2002) <strong>and</strong> Burkhardt-Holm <strong>and</strong> Scheurer (2007) onRetrospective Ecological Risk Assessment (RERA) but further modified where necessary tofunction within the constraints of the present project.Retrospective Ecological Risk AssessmentOne of the obvious but crucial attributes of RERA is that it is applied retrospectively to examineadverse ecological <strong>impacts</strong> that have already occurred. RERA is intended for situations wherethe evidence for ecological impairment already exists <strong>and</strong> a number of factors have already beenidentified as possible causal agents. The objective of RERA is thus to evaluate how likely it isthat each of those potential causal factors may have contributed to the adverse ecological <strong>impacts</strong>observed. However, there are usually many constraints <strong>and</strong> limitations on the quantity <strong>and</strong>quality of evidence available to evaluate such ecological impairments. For ecological problemsthe available evidence is often very limited <strong>and</strong> predominantly qualitative (Forbes <strong>and</strong> Callow,2002). Quantitative <strong>data</strong> is usually short, incomplete, sparse, or simply non-existent, <strong>and</strong> wherelimited quantitative <strong>data</strong> does actually exist, it is likely to be complex, variable, ambiguous,<strong>and</strong>/or noisy, often making rigorous statistical analysis almost impossible (Forbes <strong>and</strong> Callow,2002; Burkhardt-Holm <strong>and</strong> Scheurer, 2007). The available evidence is often correlative at best,<strong>and</strong> further complicated by the interaction of multiple co-existing hypotheses <strong>and</strong> confoundingfactors that are uncontrollable, or even unknown (Forbes <strong>and</strong> Callow, 2002; Burkhardt-Holm <strong>and</strong>Scheurer, 2007). Given this context, the objective of incorporating WOE into RERA is thereforeto provide a framework in which to synthesize <strong>and</strong> evaluate the evidence that is available in amanner that is transparent, systematic, logical, <strong>and</strong> less subjective (Forbes <strong>and</strong> Callow, 2002;Burkhardt-Holm <strong>and</strong> Scheurer, 2007). The WOE RERA approach outlined by Forbes <strong>and</strong> Callow(2002), which was subsequently adapted by Burkhardt-Holm <strong>and</strong> Scheurer (2007), thereforeappears to be an extremely suitable basis for the present work due to the following criteria beingwell met:196
1. The adverse ecological impact has already occurred.The focus of the Cohen Commission technical research projects is inherentlyretrospective – <strong>Fraser</strong> <strong>River</strong> <strong>sockeye</strong> <strong>salmon</strong> productivity has been declining overrecent decades <strong>and</strong> the 2009 returns were exceptionally poor.2. The evidence for this impairment already exists.Data on the abundance <strong>Fraser</strong> <strong>River</strong> <strong>sockeye</strong> <strong>salmon</strong> recruits <strong>and</strong> spawnersconfirms the declines in both returns <strong>and</strong> productivity.3. Factors that could potentially be causal agents of this impairment have been identified.The Cohen Commission identified a selection of broad factors that could feasiblyhave contributed to the decline of <strong>Fraser</strong> <strong>River</strong> <strong>sockeye</strong> <strong>salmon</strong>, <strong>and</strong> within eachof the contracted scientific <strong>and</strong> technical projects a range of specific potentialstressors are identified.4. The evidence available to evaluate the likelihood of each possible factor is limited.Collectively, the evidence available with which to evaluate all of the factors thatmay potentially have contributed to the decline of <strong>Fraser</strong> <strong>River</strong> <strong>sockeye</strong> <strong>salmon</strong>reflect virtually all of the constraints <strong>and</strong> limitations described above.A Method for Incorporating WOE Concepts into RERAForbes <strong>and</strong> Callow (2002) state that “the primary challenge in retrospective risk assessment is tomake best use of the available evidence to develop rational management strategies <strong>and</strong>/or guideadditional analyses to gain further evidence about likely agents as causes of observed harm”,which precisely describes the challenge of the present project as well.To address this challenge, Forbes <strong>and</strong> Callow (2002) present a framework to incorporate WOEconcepts into a RERA, based on earlier methodological linkages that had been developedbetween human epidemiology studies <strong>and</strong> ecological studies. Their framework uses sevensequential questions to systematically assess the available evidence on each potential causativeagent. These questions are situated within a flow diagram such that the answers can be used tosystematically assign a categorical likelihood (i.e. unlikely, possible, likely, or very likely) toeach potential factor. The overall approach is thus to: 1) formulate the problem, 2) screenpotential agents, <strong>and</strong> 3) focus future work. Forbes <strong>and</strong> Callow (2002) demonstrate theirapproach using case studies of several distinctively different ecological problems. Burkhardt-Holm <strong>and</strong> Scheurer (2007) use this method to assess the decline of brown trout in Swiss riversover the past several decades, but reconfigure the sequence of questions to better reflect thesituation of fish declines in Switzerl<strong>and</strong>. They describe this approach as “semi-quantitativemethod for identifying causal factors are likely to explain adverse effects occurring in197
investigated ecosystems” (Burkhardt-Holm <strong>and</strong> Scheurer, 2007). This method both integrates theavailable <strong>data</strong> <strong>and</strong> facilitates the summary <strong>and</strong> communication of results.The WOE approach outlined by Burkhardt-Holm <strong>and</strong> Scheurer (2007) challenges the availableevidence for each potential factor with the following sequential questions. The answers to someof these questions are necessarily site-specific, whereas others may be derived from a broaderrange of similar case studies.1. Plausible mechanism:“Does the proposed causal relationship make sense logically <strong>and</strong> scientifically?”2. Exposure:“Is there evidence that fish population is, or has been, exposed to be causal factor?• However, presence of a causal factor alone does not indicate exposure• Exposure might not be proven but only suspected• Exposure may be historical as well as current3. Correlation/Consistency:“Is there evidence for association between adverse effects in the population in thepresence of the causal factor, either in time or space?”• Any type of formal relationship may be taken as evidence but statisticalcorrelation is preferable• Recognize that correlation does not imply causation• Acknowledge potential scale issues between potential stressors <strong>and</strong> ecologicalresponses4. Thresholds:“Do the measured or predicted exposure levels exceed quality criteria or biologicallymeaningful thresholds?”• Both current <strong>and</strong> historical exceedances of thresholds are relevant5. Specificity:“Is there an effect in the population gnome to be specifically caused by exposure to thestressor?”• Absence of a specific response does not prove a lack of exposure or impact• Presence of a specific response is stronger evidence than absence6. Experiments:“Have the results from controlled experiments in the field or laboratory lead to similareffects?”• Results from controlled experiments are stronger evidence than observationalstudies198
7. Removal:“Has the removal of the stressor led to an amelioration of the effects in the population?”• Response to a removal may be delayed rather than immediate• Lack of improvement does not disprove the importance of a causal factor• Affirmative results are stronger evidence than negative resultsAdaptation of the Methodology to the Present ProjectWe have adapted this methodology as necessary in current circumstances. One of the importantlimitations to our ability to apply this methodology in full is that we are applying this approachretrospectively to a series of projects that themselves did not utilize such a framework. Thereforeit is not possible to satisfactorily answer all of the WOE questions within this framework becauseit is not possible to answer questions that were not asked in the projects themselves.Consequently, we have modified the structure by grouping questions 4-7 into a single questioncovering all other evidence beyond question 1-3, as shown in Figure A3.5-1.Within each life stage we examine the major potential causative agents identified within theother Cohen commission technical research projects. For each stressor, we synthesize: 1) theplausibility of each mechanism, 2) the evidence that <strong>Fraser</strong> <strong>River</strong> <strong>sockeye</strong> <strong>salmon</strong> have beenexposed to the stressor, 3) the evidence for any spatial or temporal correlation between thestressor <strong>and</strong> the observed patterns in the <strong>Fraser</strong> <strong>River</strong> <strong>sockeye</strong> <strong>salmon</strong> <strong>and</strong>, where possible, theobserved patterns in non-<strong>Fraser</strong> <strong>River</strong> <strong>sockeye</strong> <strong>salmon</strong>, <strong>and</strong> 4) other evidence regarding thepotential impact of the stressor on <strong>Fraser</strong> <strong>River</strong> <strong>sockeye</strong> <strong>salmon</strong> (especially including anyinformation on question 4-7 above). Within each step of this evaluation, we emphasize both whatis known <strong>and</strong> what is not known, <strong>and</strong> within each life stage we identify the key things that needto be known better. Based on the evidence available, a relative likelihood is assigned to eachbroad category of stressor (e.g., contaminants, predators, etc.) at each life stage, according to theframework shown in Figure A3.5-1. The conclusions from each life stage apply to thecontribution of each broad impact factor to the overall in the observed <strong>Fraser</strong> <strong>River</strong> <strong>sockeye</strong><strong>salmon</strong>. There may be cases in which the relative likelihoods of particular stressors do not allalign perfectly with the relative likelihood assigned to the parent stressor category. For example,the evaluation of the overall impact of predators may not match the evaluation of particularpredators. There may also be cases in which the results from this evaluation framework might bedifferent for individual stocks. However, the focus of the present project is to evaluate thelikelihood that each broad factor has made a significant contribution to the overall observeddecline in the <strong>Fraser</strong> <strong>River</strong> <strong>sockeye</strong> <strong>salmon</strong> stock complex.199
Figure A3.5-1. Flow diagram used to assign the relative likelihood that a particular factor has made a substantialcontribution to the decline of <strong>Fraser</strong> <strong>River</strong> <strong>sockeye</strong> <strong>salmon</strong>, based on the answers to the questions used tochallenge the available evidence. This structure is adapted from Burkhardt-Holm <strong>and</strong> Scheurer (2007,Figure 1).Because this method is an inherently retrospective form of analysis, the results cannot be used topredict the <strong>impacts</strong> that these factors may have in the future. Both Forbes <strong>and</strong> Callow (2002) <strong>and</strong>Burkhardt-Holm <strong>and</strong> Scheurer (2007) emphasize that it is unrealistic to expect these methods tobe definitive in terms of ascribing causation. While such an approach may be able to explainretrospectively which factors most likely contributed to past patterns of change in productivity,the importance of particular factors may be more or less important in the future <strong>and</strong> will varywithin any given year in both magnitude <strong>and</strong> relative importance. Even if we had complete <strong>data</strong>on all of the factors potentially affecting <strong>sockeye</strong> over the entire period of record for the stockproductivity <strong>data</strong>, we would not be able to predict in advance how these factors will combine inthe future to affect productivity.200
Conceptual modelIn the U.S. Council on Environmental Quality’s h<strong>and</strong>book Considering Cumulative EffectsUnder the National Environmental Policy Act (1997), it is suggested that conceptual models suchas network diagrams are “often analysts’ best method for identifying the cause-<strong>and</strong>-effectrelationships that result in <strong>cumulative</strong> effects.” Within such diagrams or models it is possible toillustrate all relevant components <strong>and</strong> the linkages among them, with the further flexibility ofrepresenting feedback loops where these relationships are known. Lorne Greig <strong>and</strong> PeterDuinker, who have written extensively about <strong>cumulative</strong> effects assessment in Canada, stressthat an appropriate model is an absolutely key component of <strong>cumulative</strong> effects analysis <strong>and</strong> anymodels utilized need to be represented explicitly (Greig <strong>and</strong> Duinker 2008).This project uses a detailed conceptual model as a central framework to which subsequentquantitative analyses <strong>and</strong> alternative qualitative methods can be connected. This provides acommon structure that can facilitate explicit linkages among a variety of analysis approaches.The conceptual model is used to organize the complex relationships among factors <strong>and</strong> <strong>sockeye</strong><strong>salmon</strong> such that the quantitative analyses performed in this project <strong>and</strong> the <strong>synthesis</strong> <strong>and</strong>discussion of evidence presented in other projects could be integrated into a singular life historyapproach.The conceptual model presented in the PSC Report was taken as a starting point (Peterman et al.2010). This base model was then further modified based on expert feedback elicited from theparticipants of the science workshop, <strong>data</strong> submissions from contractors <strong>and</strong> the technical reportsfrom each of the other projects. The final conceptual model is shown in Figure 3.3-1. Alternaterepresentations of this conceptual model were explored to improve clarity to a variety ofaudiences.Spatial life history diagramOne such permutation of the core conceptual model is a projection of the life history model ontothe <strong>Fraser</strong> <strong>River</strong> <strong>sockeye</strong> <strong>salmon</strong>’s geographic habitat range where particular stressors can berepresented at the scale at which they potentially affect <strong>Fraser</strong> <strong>River</strong> <strong>sockeye</strong> <strong>salmon</strong> (Figure 3.3-2). This is a communication tool for illustrating the spatial scale of <strong>sockeye</strong> <strong>salmon</strong>’s life cycleas well as critical geographic constraints to non-technical audiences.The two approaches above represent a “bottom-up” perspective for exploring potential<strong>cumulative</strong> <strong>impacts</strong>, detailing where different particular stressors impact <strong>sockeye</strong> in space <strong>and</strong>time. These representations may show where or when <strong>sockeye</strong> may be exposed to single or201
multiple stresses simultaneously. These frameworks are also useful for representing potentialinteractions or feedback loops among stressors.Relative likelihood of given hypothesesAn alternative “top-down” approach is to rely on expert assessment of the overall likelihood thata particular factor has made a significant contribution to the decline in productivity of <strong>Fraser</strong><strong>River</strong> <strong>sockeye</strong>. This approach (building on many sources of evidence) was used by the expertpanel who wrote the PSC report mentioned above (Peterman et al. 2010). At the first workshopfor the Cohen Commission technical research projects, the scientific experts working on eachprojects will examine the judgements made in the PSC report <strong>and</strong> (if warranted by new evidencenot considered by the PSC panel) make appropriate modifications. Further details of thisapproach will be described in the report on the first workshop (Appendix 6).A3.5.2Quantitative methodsSolicitation of expert feedbackIn early September we organized a meeting with Dr. R<strong>and</strong>all Peterman <strong>and</strong> Dr. Carl Schwarz ofSimon <strong>Fraser</strong> University to solicit their expert advice on potential analytical methods. The twoobjectives of this meeting were to: 1) clarify questions regarding the evaluation of <strong>cumulative</strong><strong>and</strong> relative <strong>impacts</strong>; <strong>and</strong> 2) propose alternative methods for both evaluations, given the types of<strong>data</strong> that we could expect to receive from each research project. The second objective wasapproached via three distinct steps. Step 1 was to identify a broad selection of potential analysesfor further evaluation. Step 2 was to anticipate the types, quality <strong>and</strong> extent of <strong>data</strong> sets thatmight be available from each research project in order to prospectively identify potential <strong>data</strong>limitations. Step 3 was to critically evaluate each proposed method with respect to project goals<strong>and</strong> anticipated <strong>data</strong> limitations. This evaluation process considered the <strong>data</strong> input needs, thetypes of output results, the process feasibility, <strong>and</strong> the overall usefulness of each potentialanalytical method. We then presented a draft analytical plan for review by rest of the CohenContractors at the November 30-December 1 Technical <strong>and</strong> Scientific Research ProjectsWorkshop. The outcomes of these meetings shaped our analysis framework (Table A3.5-1) <strong>and</strong>the <strong>data</strong> collection process Appendix 5.202
Table A3.5-1. Complete summary of analytical approaches considered, recommended priorities, <strong>and</strong> current status. For approaches applied in this project,detailed methods are provided in this section.Approach Reasoning Priority/Timing StatusConceptual ModelProvides a central framework to link both the qualitative High/Early Completesummary <strong>and</strong> quantitative analyses.Change-point analysesCorrelation analyses /Principal components analysis(PCA)Multiple RegressionProvides an objective stock specific assessment of changesin trends over time (assuming the model is appropriate).May be able to identify stock groupings with similar patternsof change. This analysis was completed early in the projectas these <strong>data</strong> were available early.These methods inform <strong>data</strong> reduction strategies that shouldbe completed prior to the multiple regression analysis. Inaddition, they may provide insights into relationships amongindependent variables.Multiple regression is the best tool we have for addressingthe primary objective of this analysis (i.e., underst<strong>and</strong>ing the<strong>cumulative</strong> <strong>and</strong> relative impact of all of the stressors).High/EarlyHigh/requiresall contractor<strong>data</strong>High/ requiresall contractor<strong>data</strong>CompleteCompleteInitial analysescomplete, Muchmore could bedoneBayesian Belief NetworksCluster analysisDiscriminant analysis orlogistic regressionMantel’s i testAttenuation analysesR<strong>and</strong>omization testsPath analysesStructural Equation ModelingA BBN could be developed from the conceptual model(Figure 3.3-1) to improve our underst<strong>and</strong>ing of the<strong>cumulative</strong> <strong>impacts</strong>, interactions, <strong>and</strong> relative effects ofstressors across all projects.Each of these approaches was evaluated <strong>and</strong> rejected for atleast one of the evaluation criteria identified above.RecommendedNotrecommendedat this timeBeyond scope ofthis projectNot Applicable203
Change point analysis of productivity <strong>data</strong>During the initial phases of this project, it was frequently stated that there had been declines inproductivity of <strong>Fraser</strong> <strong>River</strong> <strong>sockeye</strong> since the early 1990’s. Peterman <strong>and</strong> Dorner (2011)explored the patterns of productivity in far more detail <strong>and</strong> now suggest there were in fact 3periods of change. In parallel, we decided it was important to have an objective assessment ofwhen <strong>and</strong> how strong trends in each of the <strong>sockeye</strong> stocks were; hypothesizing that there may besubstantial differences among stocks in the timing <strong>and</strong> strength of declines in productivity. Ifthere were groups of stocks with similar behaviour over time, the similarities among thoseparticular stocks might suggest important factors. We completed these analyses very early in theproject as these <strong>data</strong> were available long before any of the covariate <strong>data</strong> from the other technicalreports.Where time-series <strong>data</strong> are available, a regression model between time <strong>and</strong> the <strong>data</strong> set of interestcan be fit to assess whether or not there is a trend over time <strong>and</strong> to describe the nature of thetrend. Straight line models are easy to interpret as a trend can be estimated by the slope of thestraight line fit to the <strong>data</strong> (Equation A3.5-1). We fit a straight line model to the log e transformed<strong>data</strong> for: a) the entire time series or b) segments of the time-series. A log e transformation is oftenused to linearize exponential growth or stabilize variance typical of population <strong>data</strong> (Dixon &Pechmann 2005). In many cases it may not be appropriate to fit a single trend line across theentire time-series. There may be periods of either increasing or decreasing trend that do notextend throughout the <strong>data</strong> set. In particular, it is of interest to underst<strong>and</strong> what the current trendis <strong>and</strong> when that trend began. Where a single trend line is not appropriate we try fitting a piecewiseregression model where two lines are joined at a single sharp change point (Equation A3.5-2) (Toms & Lesperance 2003). All possible change points are evaluated <strong>and</strong> the most likely one(i.e., minimizing the sums of squares (SS) of the residuals) based on the <strong>data</strong> is selected. Morecomplex models are possible (e.g., more than two lines, curved segments rather than straightlines), but are beyond the scope possible for this project given the time <strong>and</strong> budget. Morecomplex time-series methods that incorporate temporal autocorrelation are also beyond the scopeof this project.Straight linemodel:yt=0+ β 1xtεt(Equation A3.5-1)β +This model fits a single straight line of best fit through the entire timeseries of <strong>data</strong>.• β1represents the slope of the line of best fitPiece-wiseyt=0+ β 1xtεtfor xt≤ αβ +204
egression model: β β xt + β ( x t− α ) + εt0+1 2for xt> α (Equation A3.5-2)• β1represents the slope of the line of best fit for the years priorto the break point (α)• ( β1+ β2) represents the slope of the line of best fit for theyears after the break point (α)For each stock we fit both a straight-line model across the entire time series <strong>and</strong> a piece-wiseregression model. In both cases, usual model diagnostics were used to assess the fit of the model(Draper <strong>and</strong> Smith 1998; Devore 1995). Examples of the figures we used to assess the model fitare provided in Figure A3.5-1 (straight-line model) <strong>and</strong> Figure A3.5-2 (corresponding piece-wiseregression model). If the diagnostics confirm the model is of an appropriate form, then we cantest the hypothesis that the slope of the line(s) is zero (no trend) or not.These analyses provide information about trends <strong>and</strong> important ‘change points’ in time that canbe compared across stocks <strong>and</strong> stressors. We used ln(R/S) 20 to provide a simple easy tounderst<strong>and</strong> interpretation. This does not account for density dependence so density dependence isone possible factor in explaining any patterns observed. Alternatively we could use the residualsfrom the best fit model, which incorporates density dependence, <strong>and</strong> have also been provided byPeterman <strong>and</strong> Dorner (2011).20 R = Recruits (returning spawners that reached the spawning ground + harvested adult fish + returning spawnersthat died between the Mission counting station <strong>and</strong> the spawning ground). S = Effective Female Spawners in theparent generation that produced the returning spawners (generally four years previous). ln = natural logarithm (basee).205
Figure A3.5-1. This is an example of residual diagnostic plots used to assess the fit of a single straight line trend intime across the full <strong>data</strong> set for Stellako productivity (i.e., ln(R/S)). Notice the remaining pattern inresiduals when plotted against time (lower left panel); the later brood years are much more negative <strong>and</strong>there appears to be a parabolic shape to the residuals suggesting a single trend line doesn’t adequately fitthe <strong>data</strong>.206
Figure A3.5-2. This is an example of residual diagnostic plots used to assess the fit of a piece-wise regression modelwith two straight lines for Stellako productivity (i.e., ln(R/S)). The most likely model suggests a changepoint in 1985 (brood year).Stock portfolio summariesSchindler et al. (2010) found that stock composition plays an important role in the overallvariability of a regional stock complex (in their case Bristol Bay <strong>sockeye</strong>). In particular theyfound that having a portfolio of many stocks results in less variability across the whole regionalstock complex, than if the portfolio was represented by only a few individual stocks. The <strong>Fraser</strong><strong>River</strong> Sockeye regional stock complex consists of 36 Conservation Units (CUs) (refer to theFreshwater Technical Report (# 3) for CU status assessments). We were interested in finding out,for the 19 stocks where we have <strong>data</strong>, how balanced the portfolio of <strong>Fraser</strong> <strong>River</strong> <strong>sockeye</strong> stocksis. Additionally, we were interested to see whether that balance has changed over time. We used207
ecruits for this analysis as we wanted to remove the harvest effect. First we plotted the mostrecent complete <strong>data</strong> set for recruits (i.e., 2006) to see the current concentration profile (i.e., theproportion of the total number of recruits by stock). Second we grouped the stocks into 5 timeperiods (12 years / 3 brood cycles each) to see if the stock composition had shifted over time.Stocks were averaged across the time period <strong>and</strong> then a <strong>cumulative</strong> sum of recruits by stock wasplotted for each time period. Two figures were generated: one with the y axis scaled to 1 <strong>and</strong> thesecond with the y axis on the raw recruit scale. This approach clearly illustrates the number ofstocks that account for the majority of the recruits, but it does not inform us about which stocksdominate or whether they have changed over time. Based on the knowledge that at least some ofthe stocks (i.e., Lower Shuswap) have cohorts with very different sizes, we split the <strong>data</strong> set bycohort to assess how the stock portfolios differed by cohort. We selected the eight most dominantstocks across all cohorts <strong>and</strong> plotted these annually in a stacked bar graph, while the remainingstocks were aggregated.Multiple regressionRegression analysis was the primary focus of our quantitative analyses <strong>and</strong> the most complexapproach applied. This section begins with a high level summary of regression intended toinform all readers (regardless of background) about the general approach <strong>and</strong> the limitations ofthe analysis. We then provide detailed descriptions of our approach to: <strong>data</strong> reduction, creationof model sets, c<strong>and</strong>idate models, model structure, <strong>and</strong> model selection.General approachMultiple regression can be used to determine the relative importance of each covariate forexplaining the variability in <strong>sockeye</strong> productivity. Non-linear relationships between covariates<strong>and</strong> <strong>sockeye</strong> productivity can be explored. Covariates that are hypothesized to have an additive<strong>cumulative</strong> impact on <strong>sockeye</strong> productivity (i.e., each factor on its own may have an insignificantbiological impact but when encountered together the sum of the effects may be biologicallyimportant) can be analyzed in groups rather than one at a time. Regression can also be used totest hypothesized interactions between covariates (i.e., multiplicative <strong>cumulative</strong> <strong>impacts</strong>).Multiple regression is valuable tool for addressing the primary objective of this analysis (i.e.,underst<strong>and</strong>ing the <strong>cumulative</strong> <strong>and</strong> relative impact of all of the stressors).Regression analysis is used to underst<strong>and</strong> how different variables relate to one another. Typicallythere is one response variable (i.e., dependent variable) of interest <strong>and</strong> one or more predictorvariables (i.e., independent variables or covariates). In this case the dependent variable is anannual stock specific index of productivity. The independent variables are all factors identified208
as likely to be important by each of the other Cohen Commission Technical Reports (e.g., seasurface temperature). Regression analysis entails specifying a mathematical model that describesthe functional form of the relationship between the covariates <strong>and</strong> the response variable <strong>and</strong>using the observed <strong>data</strong> to estimate the parameters in the model.Many different models are possible. For example, models may include different covariates,linear <strong>and</strong> non-linear covariates, <strong>and</strong>/or interactions among different covariates. As long as thereare sufficient <strong>data</strong>, parameters for any model can be estimated but just because parameters can beestimated does not mean the model is sensible. Not surprisingly there is a vast amount ofliterature dedicated to the subject of model selection <strong>and</strong> comparison. We use the Burnham <strong>and</strong>Anderson (1998) hypothesis-driven approach to model selection <strong>and</strong> inference. In hypothesisdrivenanalyses, the only factors that would be allowed to enter the analyses would be those thatare connected to a logical, <strong>and</strong> in this case, biologically justified hypothesis. This reduces thepotential that some variables will emerge as significant simply by chance <strong>and</strong> not as a result ofany underlying mechanism, which is quite likely to happen in a project where there are largenumbers of covariates <strong>and</strong> hence potential models. St<strong>and</strong>ard practice is to select multiplefeasible c<strong>and</strong>idate models, fit each model (i.e., estimate the parameters), <strong>and</strong> then compare theperformance of each model. There are many approaches for comparing among models; we usedthe small sample size corrected Akaike’s information criterion (AIC c ) (Burnham <strong>and</strong> Anderson,1998).This project is unusual in its scope. While the response variable, ln(R/S) is available for 19stocks across B.C. <strong>and</strong> approximately 50 years of <strong>data</strong> are available for each stock, the number ofpotential covariates is very large. A total of 126 quantitative <strong>and</strong> 5 qualitative <strong>data</strong> sets wereprovided to us from the other technical reports (Table A3.4-9). We then calculated an additional32 <strong>data</strong> sets from the originals. It is possible for a single <strong>data</strong> set to be linked to (i.e.,hypothesized to impact) multiple life stages of <strong>Fraser</strong> <strong>River</strong> <strong>sockeye</strong>. In addition, there are up to4 different age types (i.e., 4sub2, 5sub2, 4sub1, <strong>and</strong> 3sub1). These links are described in TableA3.4-5 through Table A3.4-9 <strong>and</strong> result in a total of 1058 possible covariates to include in theanalysis. However, not all covariates are available for all years <strong>and</strong> stocks. Models can only becompared using AICs when the models are fit using the same <strong>data</strong>. The implication of this isthat we cannot compare all models of interest on the full <strong>data</strong> set but instead must identify timeperiods with complete <strong>data</strong> for different subsets of the covariates. For example, there is a smallsubset of the covariates (e.g., sea surface salinity for the Strait of Georgia) that have <strong>data</strong>extending back to 1950, but there are other covariates that only have <strong>data</strong> starting in 1996 (e.g.,chlorophyll a). If we wish to compare models with these two covariates (i.e. salinity <strong>and</strong>chlorophyll), we would have to either reduce the <strong>data</strong> set to those years with <strong>data</strong> for bothcovariates (i.e. limit the model to 1996-present <strong>and</strong> sacrifice the earlier <strong>data</strong> for salinity), or209
exclude covariates with limited years of <strong>data</strong> (i.e. limit the model to only salinity <strong>and</strong> sacrificethe extra covariate, but extend it back to 1950). Choosing any particular set of covariates forcesyou to truncate longer time series to the length of the shortest <strong>data</strong> set. Choosing any particulartime period forces you to limit your analyses to those covariates with period of record that issufficiently long. We chose to evaluate different time-periods independently because each timeperiod presents a different trade-off between the length of the <strong>data</strong> <strong>and</strong> the number of covariatesthat can be included. Within each time-period we generated different model sets. A model setrepresents a set of covariates that have complete <strong>data</strong> over a specified period of time. Withineach model set, different models (i.e. combinations of variables) can be tested to determine theirability to explain the observed variability in the dependent variable, <strong>sockeye</strong> productivity in thiscase. Expressed another way, a ‘model set’ is simply a suite of c<strong>and</strong>idate models within a giventime-period that are organized to address a particular question. For example, one question ofinterest is whether factors affecting a particular life stage are more important than others. Mostprojects or papers only consider a single ‘model set’ by this definition. However, the large butincomplete <strong>data</strong> set combined with the range of questions this project attempts to addressrequired this additional layer.Key points:• Models may differ in the number <strong>and</strong> type of covariates, linear vs. non-linear terms, <strong>and</strong>the presence of interaction terms.• Many models are possible, but we should only test models that have biologically justifiedhypotheses.• In order to compare the relative performance of different models using Akaike’sInformation Criterion (AIC c ), models should be fit using the same <strong>data</strong>.• Comparison of AIC c scores does not tell us the best model possible, but rather helps us tounderst<strong>and</strong> the relative support for models we have estimated.• You need more <strong>data</strong> (n) than parameters (k) in order to be able to estimate theparameters. In addition, if the ratio (n/k) < 40, small sample size corrections should beemployed in the assessment of model fit (Burnham <strong>and</strong> Anderson (p76), 1998).Data reductionWe had hoped there would not be substantial correlation among metrics from a single contractor– one of the criteria specified was that the <strong>data</strong> metrics submitted should be independent.However, we found that in many cases we received several correlated <strong>data</strong> sets (e.g., sea surfacesalinities for 5 months). We first dropped any variable by life stage combinations where therewas not a reasonable hypothesis of a potential impact (e.g., we know that smolts are not in the210
ocean during a particular month). Where our knowledge of the biological relationships could notreduce the number of variables we used a combination of correlation analysis <strong>and</strong> principalcomponents analysis to try to reduce the number of variables. We generated correlation matrices<strong>and</strong> scatterplots for the longest time series of <strong>data</strong> sets where we expected correlation (e.g.,multiple months of <strong>data</strong> for the same metric). Data reduction <strong>and</strong> interpretability are the primarygoals of a PCA. The idea is to try to determine which components explain the majority of thetotal system variability. Although you may need many variables to describe all of the variability,it is often the case that only a few are needed to account for most of the variability in the system(Johnson <strong>and</strong> Wichern 2002). The outcome of PCA is an ordered set of components (usually asmall number explain most of the variability). Each component is a linear combination of all ofthe variables. In most cases the loadings were spread pretty evenly among all months of <strong>data</strong> <strong>and</strong>we simply chose to average across the plausible months. In a few cases, one or two months of<strong>data</strong> were included separately.Chlorophyll aThere were insufficient years of <strong>data</strong> to interpret correlations among chlorophyll monthly <strong>data</strong>sets. Instead we decided to simply use both the April <strong>and</strong> May monthly means <strong>and</strong> ignored theJune-Sept values based on our underst<strong>and</strong>ing of the hypothesized relationship betweenchlorophyll <strong>and</strong> ocean productivity during the period when smolts are leaving the <strong>Fraser</strong> river.For Strait of Georgia we were provided with two different locations of <strong>data</strong> (Central <strong>and</strong> North)but upon closer evaluation found that the Northern <strong>data</strong> set was far more variable (Figure A3.5-3) <strong>and</strong> so selected the Northern <strong>data</strong> set anticipating that it would be a more useful predictor. Werecognize that this was an arbitrary decision but given the severe <strong>data</strong> restrictions <strong>and</strong> lack ofsolid scientific basis for selecting one particular region or averaging the two regions, we decidedto use this approach for now.211
Figure A3.5-3. Average chlorophyll concentration measured at two different locations in the Straight of Georgia.Each line represents a monthly mean for a given location. April – July means are shown for theNorthern location in black, <strong>and</strong> for the Central location in blue.Sea surface salinityWe found several extreme outliers in the Queen Charlotte Sound sea surface salinity <strong>data</strong> set(values exceeding 90) when the rest of the <strong>data</strong> set was around 30. We removed these valuesassuming they were a <strong>data</strong> entry mistake as such values are completely unrealistic (Parsons etal.1977).Predator <strong>and</strong> alternate prey <strong>data</strong>The technical report on predators (Christensen <strong>and</strong> Trites, 2011) provided a total of 21 <strong>data</strong> sets,including: 7 bird <strong>data</strong> sets, 3 pinniped <strong>data</strong> sets, 2 fish predator <strong>data</strong> sets, <strong>and</strong> 9 fish alternativeprey <strong>data</strong> sets. The three species of marine mammal (all pinnipeds) for which <strong>data</strong> wereprovided were used directly. However, it was less clear how to best incorporate the bird <strong>and</strong> fish<strong>data</strong>. These <strong>data</strong> sets were selected by the authors of the predators technical report as being themost relevant available <strong>data</strong>, but recognising they were not collected specifically for thesepurposes <strong>and</strong> that other species may also be important (Christensen <strong>and</strong> Trites, 2011). In order toreduce the number of variables in the model <strong>and</strong> yet still incorporate these variables we tookeach <strong>data</strong> set individually <strong>and</strong> generated a new quantile based <strong>data</strong> set where the lowest 25 % of212
observations were given a value of 1, the highest 25 % of observations were given a value of 3<strong>and</strong> the middle 50% of observations were given a value of 2. We then averaged thesest<strong>and</strong>ardized <strong>data</strong> sets across groups of similar species, hoping that we could identify yearswhere there were more than usual or less than usual abundance of a particular type of predator(i.e. fish or bird) or alternative prey for a given life stage. Aggregate indices were only generatedfor species that were hypothesized to impact the same life history stage (Table A3.5-2).Table A3.5-2. Summary of the predator/alternative prey <strong>data</strong> provided <strong>and</strong> the reduced <strong>data</strong> sets actually used in theregression analysis.Hypothesized Hypothesized life stage(s) Data provided Reduced <strong>data</strong> setmechanismPredation Smolt outmigration Double CrestedCormorantQuantile based aggregateindex (2 species)Predation Smolt outmigration Common MerganserPredation Coastal migration Common MurrePredation Coastal migration Pelagic CormorantPredation Coastal migration Br<strong>and</strong>t’s CormorantPredation Coastal migration GullsMigration to spawning area- MarineMigration to rearing areas- MarineQuantile based aggregateindex (4 <strong>data</strong> sets)Predation Upstream migration Bald Eagle Quantile based indexPredation Migration to rearing areas- Marine California sea lions No change, used rawabundance <strong>data</strong>PredationPredationMigration to spawning area -MarineMigration to rearing areas- MarineStellar sea lionsHarbour sealsNo change, used rawabundance <strong>data</strong>No change, used rawabundance <strong>data</strong>Migration to spawning area- MarinePredation Growth <strong>and</strong> maturation – Marine Blue shark abundance No change, used rawMigration to spawning area- Marineabundance <strong>data</strong>Predation Migration to rearing areas- Marine Arrowtooth flounder No change, used rawbiomassabundance <strong>data</strong>Alternate prey All three marine life stages:Herring (Central Coast) Quantile based aggregate• Migration to rearing areasindex (8 <strong>data</strong> sets)• Growth <strong>and</strong> maturation• Migration to spawning areaAlternate prey Same as above Herring (Prince RupertDistrict)Alternate prey Same as above Herring (Queen CharlotteIsl<strong>and</strong>s)Alternate prey Same as above Herring (Straight ofGeorgia)Alternate prey Same as above Herring (West CoastVancouver Isl<strong>and</strong>)Alternate prey Same as above California Pacific HakeAlternate prey Same as above Gulf of Alaska Pacific codAlternate prey Same as above Pacific Jack mackerelAlternate prey Same as above Walleye pollock Was not available untillater than the otheralternative prey species<strong>and</strong> so not relevant to themodel sets we considered.213
Status only <strong>data</strong> setsIn many cases the <strong>data</strong> for particular stressor only included an estimate of the current status. Wecould not incorporate these <strong>data</strong> into the regression analysis. It is not possible evaluate the effectof a particular stressor on <strong>sockeye</strong> productivity over time if there is no information on how thatstressor has been changing over the time period in which <strong>sockeye</strong> productivity has beenchanging. With status only <strong>data</strong> sets, it is not even known whether the stressor has beenincreasing or decreasing.Model setsC<strong>and</strong>idate model sets were built around the conceptual model (Figure 3.3-1). We consideredmultiple sets of hypotheses, each set designed to answer particular questions. Each of these“series” (arbitrarily ordered <strong>and</strong> named) <strong>and</strong> its relevant question(s) of interested are describedbelow <strong>and</strong> listed in Table A3.5-3A-series) Life history bottlenecks: identify all stressors that are hypothesized to affect aparticular life history stage <strong>and</strong> add <strong>and</strong> remove these togetherQuestion: Which life history stages have the greatest effect on productivity over thewhole <strong>sockeye</strong> life cycle?B-series) Stressor category: add <strong>and</strong> remove suites of similar stressorsQuestion: Which categories of stressors (organized by the same categories as the CohenCommission Technical Reports) have the greatest effect on productivity over the whole<strong>sockeye</strong> life cycle?C-series) Geographical regions: identify all stressors that are hypothesized to occur in aparticular geographic location <strong>and</strong> add <strong>and</strong> remove these together. Only one particular casewas explored.Question: Which is the more important factor in explaining the observed variability in<strong>sockeye</strong> productivity: marine conditions in the Strait of Georgia or marine conditions inQueen Charlotte Sound 21 ?D-series – L-series) Each of these model sets considers factors within a particular life historystage or combination of life stages (e.g. marine life history stages).Question: Within a particular life history stage, which stressors have the greatest effecton productivity over the whole <strong>sockeye</strong> life cycle?21 The rationale for this question is thoroughly described in Section 4.4.5.214
Table A3.5-3. Summary of appropriate timeframes for model sets within each group. The entries of “Yes” <strong>and</strong> “No”represent the evaluation of whether or not that particular series would be worthwhile to evaluate at overparticular time frame (“default time frames”). Moving to a shorter time period represents a trade-offbetween adding more covariates <strong>and</strong> decreasing the overall length of the resultant <strong>data</strong> set that can beanalyzed. If moving to a shorter time period does not add any new variables, it is not worthwhile toanalyze. If only one variable is added it may be dependent on the particular variable <strong>and</strong> how many yearsare removed. In some of the cases presented, it is noted that there may be an appropriate time frame foranalysis that is similar but not identical to the default periods.Model Set Group Very Long Long Medium Medium Short(longer) (shorter)DEFAULT1950-2004 1969-2004 1980-2004 1985-2004 1996-2004TIMEFRAMESA Comparison by life Yes Yes Yes Yes YesstageB Comparison by Yes Yes Yes Yes YesprojectC Comparison betweenQCS <strong>and</strong> SoG factorsNoYes(could start inYes No YesDEFGHIJKLComparison withinincubation-lakerearingComparison withinsmolt outmigrationComparison withincoastal migrationComparison withinocean rearingComparison withinreturn to the <strong>Fraser</strong><strong>River</strong>Comparison withinupstream migrationComparison withinspawningComparison amongall freshwater lifestagesComparison amongall marine life stagesQualitativecontaminantsonlyQualitativecontaminants<strong>and</strong> air temp1968)No variablesaddedYesOnly forestryadded (1979)Only forestryadded (1978)YesYesonlyYes Yes Yes Only adds 1alternatepreyNo 1958-2004 Excludes 1 1981-2004 Noalternate preyYes Yes Yes No NoYes 1953-2004Only baldeagle added(1953)OnlyqualitativecontaminantsOnly addsquantitativecontaminants(1 stockcomplete)Only forestryadded (1976)Only forestryadded (1976)1982-2004Addspopulation1982-2004AddspopulationYes Yes No Yes NoNo variablesaddedOnly solidwaste added(99-04)YesYes Yes No 1981-2004 YesNoNo215
The A-series of model sets based on life history were our primary focus <strong>and</strong> complement thequalitative <strong>and</strong> weight of evidence approach used throughout this project. The B-series of modelsets was completed to address the original scope of work for this project but was not consideredthe most appropriate approach. The C-series of model sets had fewer <strong>data</strong> limitations because ofthe reduced scope, in terms of potential variables to consider, <strong>and</strong> as a result probably providethe best opportunity for meaningful results. D-L series of model sets designed to focus within aparticular category of stressor. For example, a model set might be designed to ask the question,“within the category of contaminants, which measure has the greatest effect on productivity overthe whole <strong>sockeye</strong> life cycle?” Such model sets were not considered since they reflect a similarscale of stressor-centric investigation as had already been tasked to each of the other technicalreports. Within each series of model sets, we evaluated the available <strong>data</strong> for different timeperiods.We began with one of the simpler series of model sets (i.e., the C-series evaluating thedifference between QCS <strong>and</strong> SoG). This question was selected first as the hypotheses were morefocused (i.e., just marine conditions during coastal migration) <strong>and</strong> so required fewer covariates.Then we went to the most complex model sets (A-series <strong>and</strong> B-series) <strong>and</strong> started with thelongest time periods but found there were insufficient covariates available back to 1950 toperform meaningful analyses. The second longest time period (starting in 1969) had quite a fewcovariates available <strong>and</strong> so the A-series <strong>and</strong> B-series model sets over the 1969-2004 time periodwere the next set of models we evaluated. When moving to the period beginning in 1980, quite afew more covariates were available <strong>and</strong> we attempted to run the A-series <strong>and</strong> B-series model setsover the more recent time period. At this point we encountered <strong>data</strong> limitations as the number ofcovariates increased substantially but the number of dependent observations was reduced as aresult of the shortened time series. There should be sufficient <strong>data</strong> to work with this time periodgiven further investigation of the covariates <strong>and</strong> <strong>data</strong> reduction. Many of the smaller models inthis time period could run, but there were a few covariates that were still too strongly correlatedto run the larger models. The <strong>data</strong> reduction <strong>and</strong> c<strong>and</strong>idate model selection (i.e., whichcovariates to include) would benefit from additional input from the authors of the other CohenCommission Technical Reports. Table A5.3-4 lists all model sets for which we present results inthis report.216
Table A3.5-4. Description of the 6 model sets that were examined as part of this project.Model Set name Description Time period (by Brood year)A4c Comparison across life stages 1969-2001A4bComparison across life stages, with pink 1969-2001<strong>salmon</strong> includedB4c Comparison across stressor categories 1969-2001B4bComparison across stressor categories with 1969-2001pink <strong>salmon</strong> includedC4aComparison of all available marine <strong>data</strong> 1969-2004between SoG <strong>and</strong> QCS. No <strong>data</strong> for QCSSST.C3aComparison of all available marine <strong>data</strong> 1980-2004between SoG <strong>and</strong> QCS. Including QCSSST.C1aComparison of all available marine <strong>data</strong>including chlorophyll for SoG <strong>and</strong> QCSseparately.1996-2004C<strong>and</strong>idate modelsC<strong>and</strong>idate models refer to the list of alternative models compared within each model set. Each ofthe c<strong>and</strong>idate models is fit using the same <strong>data</strong> set. Recall that models may differ in terms of thecombination of stressor covariates <strong>and</strong> the functional form of the model. Covariates could enterthe model in some non-linear way or interactions among covariates could be specified.However, all c<strong>and</strong>idate models should be based on biological hypotheses. We did not feel wehad sufficient knowledge regarding the expected functional form of the relationship between thevast number of covariates <strong>and</strong> the response variable to assume anything beyond the simplestlinear relationship. Possible interactions were also considered based on the information providedby the Cohen Commission Technical Reports <strong>and</strong> our own qualitative <strong>synthesis</strong>. The onlyinteractions that were explicitly discussed in our report were:• Disease/Pathogens & temperature• Disease/Pathogens & pollutants• Disease/Pathogens & l<strong>and</strong> use practices• Sea surface salinity & sea surface temperatureThe first three interactions were impossible to explore given the lack of disease/pathogen <strong>data</strong>.Interactions among marine factors during coastal migration could be explored with existing <strong>data</strong>but were not considered at this time. With more time <strong>and</strong> input from subject experts (e.g.,authors of the other Cohen Commission Technical Reports) the hypothesized links betweencovariates <strong>and</strong> productivity (Section A3.2-A3.4) could be refined <strong>and</strong> added to. Our approach217
with this report given the vast scope <strong>and</strong> volume of <strong>data</strong> was to start with the simplest non-trivialcase, providing useful initial results <strong>and</strong> setting the stage for future analyses. Therefore, for thisproject the difference between c<strong>and</strong>idate models within a given model set was simply thecombination of stressor covariates included. We did not test every possible combination ofcovariates. Different combinations of covariates were laid out to specifically address one thequestion of interest for the given model set as described above. For example, for the A-series ofmodel sets we were interested in determining which life stage might be most important inexplaining the variability in productivity. An example of a c<strong>and</strong>idate model from the A-seriesmodel set is a model where all covariates that are hypothesized to impact <strong>sockeye</strong> productivityduring a particular life stage are included.Final <strong>data</strong> processingWe extracted the <strong>data</strong> set for each model set (i.e., series <strong>and</strong> time period) separately. We thendeleted all records associated with the Pitt stock based on the recommendation of R<strong>and</strong>allPeterman (pers. comm.) that this stock is too heavily hatchery influenced to be relevant to theother wild stocks. Finally we evaluated the remaining missing <strong>data</strong> to see if it was sensible to useinterpolation (either across time or across space) to fill in any gaps or whether rows with missing<strong>data</strong> should simply be dropped. In the end we simply dropped rows with missing <strong>data</strong> as the gapswere often too big to justify interpolation or else occurred at the beginning or end of the <strong>data</strong> setmaking interpolation impossible. In the few occasions where the <strong>data</strong> gaps were relatively smallgaps, this approach resulted in minimal <strong>data</strong> loss <strong>and</strong> we concluded that it was not worth theeffort to interpolate the missing values. This does not mean that an entire covariate was removedif there was a single missing value. It means that that particular year by stock combination wasremoved, for example if there was no contaminant <strong>data</strong> for 1999 in the Quesnel stock, then the1999 Quesnel productivity <strong>and</strong> all associated 1999 Quesnel covariates (i.e., one row) wereremoved. If a covariate had extensive missing <strong>data</strong> <strong>and</strong> could not be ‘filled in’ in some way thenwe would not include it in that particular model set. Another strategy we used for sparse <strong>data</strong>sets was to use the qualitative <strong>data</strong> sets we requested from each contractor. Only two contractorsprovided us with qualitative <strong>data</strong> sets, but in the case of contaminants this enabled us to includecontaminants in analyses they would otherwise have been excluded from. Each model set had itsown complete <strong>data</strong> set saved for use in the analyses to ensure comparisons within a model setwere always on the same <strong>data</strong> set.Model structureAll models consist of three components: 1) the assumed stock-recruitment relationship, 2) thesuite of covariates, <strong>and</strong> 3) the error. Peterman <strong>and</strong> Dorner (2011) examined the available <strong>Fraser</strong><strong>sockeye</strong> productivity <strong>data</strong> <strong>and</strong> found that in most cases the Ricker stock-recruitment model218
(Equation A3.5-3) provided a better fit than the Larkin model, which allows for densitydependence among cohorts of the same stock <strong>and</strong> requires 3 extra parameters for each stock(Equation A3.5-4). Based on their findings <strong>and</strong> in order to minimize the number of parametersin the model we assumed a Ricker stock recruitment model structure for all models in ouranalysis. All models used a stock specific b term (representing the within stock densitydependence)based on the wide range of estimates observed for different stocks (Peterman <strong>and</strong>Dorner, 2011). Stock is represented by the subscript i in the following equations <strong>and</strong> year isrepresented by the subscript t.ln( = + (Equation A3.5-3)Ri, t/ Si,t) a biSi,tln( R (Equation A3.5-4)i, t/ Si,t) = a + biSi,t+ b1iSi,t− 1+ b2,iSi,t−2+ b3,iSi,t−3Two types of covariate variables were included: r<strong>and</strong>om effects <strong>and</strong> fixed effects. Year <strong>and</strong> stockwere incorporated as r<strong>and</strong>om effects as we are not interested in predicting the results for a givenyear or stock but rather in underst<strong>and</strong>ing the variability among stocks or years. All modelsinclude year <strong>and</strong> stock as crossed r<strong>and</strong>om effects (i.e., each year has multiple stocks, <strong>and</strong> eachstock has multiple years so they are crossed rather than nested r<strong>and</strong>om effects (Bates, 2010). Asingle parameter is used to represent the variability among years, R 1,t ~N(0,σ years ), <strong>and</strong> stocks, R 2,i~N(0,σ stocks ). Models differ only in the number <strong>and</strong> composition of stressor variables. These arealways incorporated into the model as fixed effects: F 1,t,i …F N-1,t,i . The final component is theerror term ε t,i ~ N(0, σ ε ), which represents the remaining error that is unexplained by the model.⎛ Rt, i ⎞ln⎜iStiFt iNFS⎟ = β0+ β1,,+ β2 1, ,+ ... + β+⎝ t,i ⎠N − 1, t,i+ R1,t+ R2,iεt,i(Equation A3.5-5)All analyses were completed using the statistical software package, R (R Development CoreTeam, 2010). Table A3.5-2 illustrates the process we used to document the model structure foreach model set. We then used a custom-built function in R to read the <strong>data</strong> provided in TableA3.5-5 <strong>and</strong> write the necessary R code to run the analyses <strong>and</strong> summarize all results. The actualregression analysis was completed using the lme4 package in R. While restricted maximumlikelihood (REML) estimates are generally preferred to Maximum likelihood estimates (MLE),we used the MLE approach as it is recommended for the purpose of comparing among models(Bates 2010, p. 8). We then extracted the AICs <strong>and</strong> calculated the AICc (small sample sizecorrected AIC) <strong>and</strong> the AIC weights for all models within a model set, as per Burnham <strong>and</strong>Anderson (1998). These along with the estimates for all fixed effects in each model werecompiled <strong>and</strong> are reported in Appendix 4.219
Table A3.5-5. Example of the model specification document created for each model set. Each row describes a possible independent variable, including theproject it came from, the location, the life stage it is hypothesized to effect (it is possible to effect more than one life stage), the unit of measurement,dates available, <strong>and</strong> unique <strong>data</strong>base name. Effect type indicates if the independent variable is to be included as a fixed effect or a r<strong>and</strong>om effect.Columns M1-M10 each represent a particular c<strong>and</strong>idate model. The models differ in terms of which independent variables are included, as indicated bya 1 (include) or 0 (exclude).ProjectMarine ecologyMarine ecologyMarine ecologyMarine ecologyLwr <strong>Fraser</strong> <strong>River</strong><strong>and</strong> Strait ofGeorgia habitatinventoryLwr <strong>Fraser</strong> <strong>River</strong><strong>and</strong> Strait ofGeorgia habitatinventoryLwr <strong>Fraser</strong> <strong>River</strong><strong>and</strong> Strait ofGeorgia habitatinventoryLwr <strong>Fraser</strong> <strong>River</strong><strong>and</strong> Strait ofGeorgia habitatinventoryIndependentVariable<strong>River</strong>dischargeSea surfacesalinitySea surfacetemperatureSummerwind regime<strong>River</strong>discharge<strong>River</strong>dischargeSea surfacesalinitySea surfacetemperatureSubsetName Location Life stage UnitsStartYearEndYearMigration toWannock Queen rearing(<strong>River</strong>s Charlotte areas-Inlet) Sound Marine m3/s 1980 2004April-AugaverageJuly-AugaverageFACTOR<strong>Fraser</strong>dischargeMay totalJune-JulyaverageApril-AugaverageApril-AugaverageQueenCharlotteSoundQueenCharlotteSoundQueenCharlotteSoundStrait ofGeorgiaStrait ofGeorgiaStrait ofGeorgiaStrait ofGeorgiaMigration torearingareas-Marine PSU 1980 2004Migration torearingareas-MarineDegreesCelsius 1980 2004Migration torearingareas-Marine 1980 2004Migration torearingareas-Marine m3/s 1980 2004Migration torearingareas-Marine m3/s 1980 2004Migration torearingareas-Marine PSU 1980 2004Migration torearingareas- DegreesMarine Celsius 1980 2004VariableSetIDEffectTypeM1DIS_x69_QCSx_MGRR_DOM Fixed 1 1 0 1 0 0 0 0 0 0SSS_A48_QCSx_MGRR_DOM Fixed 1 1 0 1 1 0 1 0 0 0SST_A78_QCSx_MGRR_DOM Fixed 1 1 0 1 1 0 0 0 1 0WND_x28_QCSx_MGRR_DOM Fixed 1 1 0 0 0 0 0 0 0 0DIS_T05_SoGx_MGRR_DOM Fixed 1 0 1 0 0 0 0 0 0 0DIS_A67_SoGx_MGRR_DOM Fixed 1 0 1 0 0 0 0 0 0 0SSS_A48_SoGx_MGRR_DOM Fixed 1 0 1 0 0 1 0 1 0 0SST_A48_SoGx_MGRR_DOM Fixed 1 0 1 0 0 1 0 0 0 1BroodYear R<strong>and</strong>om 1 1 1 1 1 1 1 1 1 1StockName R<strong>and</strong>om 1 1 1 1 1 1 1 1 1 1M2M3M4M5M6M7M8M9M10220
Model selectionWe use the Burnham <strong>and</strong> Anderson (1998) approach to model selection <strong>and</strong> inference. First wecreate a list of c<strong>and</strong>idate models based on biological hypotheses. Then we use Akaike’sInformation Criteria (AIC) statistic to assess the relative importance of the different c<strong>and</strong>idatemodels. Burnham <strong>and</strong> Anderson (1998) promote a hypothesis-driven approach to analysis. Inhypothesis-driven analyses, the only factors that would be allowed to enter the analyses would bethose that are connected to a logical, <strong>and</strong> in this case, biologically justified hypothesis. Theyrecommend substantial effort be expended up front to generate a small number of sensible apriori hypotheses to then test with the observed <strong>data</strong>. On the other h<strong>and</strong>, in exploratory analysesmany different variables that are not necessarily justified by a hypothesis are added <strong>and</strong> removedin order to explore different relationships that might exist <strong>and</strong> develop ideas for hypotheses to beexamined in a more rigorous manner. The concern with this approach is that some variables willbe correlated simply by chance <strong>and</strong> not as a result of any underlying mechanism <strong>and</strong> often theseresults are used without further testing.The analysis methods we have used are intended to apply this criterion <strong>and</strong> exclude any variablesthat are not connected to a hypothesis. Although we have attempted to structure our analyseswithin the hypothesis-driven perspective, our final approach has been somewhere between thesecontrasting approaches for two reasons. First, we aligned observational <strong>data</strong> series with particularlife stages based on hypotheses wherever possible, but in many cases the details of theunderlying hypothesis were not known or not specified. For example, the inclusion of predatorscould likely be improved by making clearer distinctions among fish predators <strong>and</strong> alternate preythat apply to coastal migration along the continental shelf versus those that apply to the Gulf ofAlaska. Second, our original task was to perform analyses across all factors wherever the <strong>data</strong>are actually available.Models should only be compared using AICs if the same <strong>data</strong> set was used to fit both models.This means that we need a complete <strong>data</strong> set to allow comparisons among models. Notsurprisingly <strong>data</strong> availability limited the extent of the analyses we were able to complete. Whilewe have a substantial dependent variable <strong>data</strong> set (recruits per spawner indices from 19 <strong>Fraser</strong>stocks from ~1950-2004, Peterman & Dorner Project #10), we were constrained by the smallestindependent variable <strong>data</strong> sets. Instead of one ‘gr<strong>and</strong>’ analysis we had to complete the regressionanalysis on smaller subsets of stressors for which <strong>data</strong> were available. The expectation that many<strong>data</strong> sets would be incomplete led to the request of an expert opinion based <strong>data</strong> set as well. It isimportant to recognize that each analysis can only be used to make statements about <strong>data</strong> setsthat are included within the analysis. If <strong>data</strong> from only 3 stressor categories (i.e. projects) areused, then the analysis can only tell us about the relative <strong>and</strong> <strong>cumulative</strong> impact of these 3221
categories of stressors. We cannot evaluate or make conclusions about how they relate to othercategories of stressor not included in that particular analysis.Summary of approachThe basic steps we used to complete this analysis were:1. Generate model setso Generate hypotheses linking all <strong>data</strong> we received to the appropriate life stage(Appendix 3.4-3-3.4-9)o Summarize the available <strong>data</strong> by time period <strong>and</strong> type (Table A3.5-1)o Select windows of time where different covariates could be compared. Forexample, we identified which covariates were available for a ‘Very Long’ time(i.e., 54 years).o Identify questions/hypotheses that could be tested within each model set. Forexample, the ‘Very Long’ time period would not enable us to compare modelswith sea surface temperature <strong>and</strong> chlorophyll, but the ‘Short’ time period would.2. Generate c<strong>and</strong>idate modelso Identify logical groupings of covariates that can be included or excluded to testspecific questions/hypotheses (e.g., which life stage is limiting <strong>sockeye</strong>productivity?)o Consider whether or not to include any non-linear termso Consider whether or not to include any interaction terms3. Data Reductiono Reduce the number of variables based on our best underst<strong>and</strong>ing of the biologicalhypotheses, correlation analysis, <strong>and</strong> principal components analysiso Extract the <strong>data</strong> for a given model set <strong>and</strong> time period4. Final processing <strong>and</strong> analysiso Process the <strong>data</strong> to produce a complete <strong>data</strong> set for each model set (i.e., removeany rows with missing <strong>data</strong> for any of the covariates within the model set <strong>and</strong>time period)o Fit each model (i.e., estimate the parameters) in the model set <strong>and</strong> generate a tableof AICc values to compare the relative fit of each model.222
Limitationso We only considered the most basic c<strong>and</strong>idate models. We did not incorporate any nonlinearor interaction terms. Even if we had incorporated these, it is doubtful that wewould be able to correctly identify the functional form of the relationships given thecomplexity of the underlying system. Regression would not be expected to detectrelationships that are not explicitly incorporated into the c<strong>and</strong>idate models <strong>and</strong> thereforeregression is not the correct approach for identifying complex relationships (e.g,involving interactions among more than 2 factors, time lags etc.) that have not previouslybeen hypothesized.o Many of the life stages or stressor categories had very sparse <strong>data</strong> <strong>and</strong> so conclusionsregarding the importance of a given life stage or project are limited to the covariates thatwere available.o There were no <strong>data</strong> available for the disease/pathogen stressor category <strong>and</strong> so nostatements can be made about the relative likelihood of disease/pathogens based on thequantitative analysis, although there is belief among many experts that this may be animportant factor.o There were no <strong>data</strong> available for the incubation-rearing life stage <strong>and</strong> so no statementscan be made about the relative likelihood of the incubation-rearing life stage beinglimiting based on the quantitative analysis.o Due to the large number of covariates we were asked to consider simultaneously we hadto assume the same relationship between covariates <strong>and</strong> all stocks. We couldn’t estimatea separate parameter for every stock, because it would increase the number of parameters18 fold. For example, we use a single parameter to represent the relationship betweenproductivity <strong>and</strong> sea surface temperature for all stocks. If we believed the relationshipwas different for every stock <strong>and</strong> wanted to estimate this relationship separately wewould need to include a unique parameter for all 18 stocks. The only stock specificparameter we estimated was the density dependence relationship (Ricker b term) as it wasshown to vary substantially among stocks (Peterman <strong>and</strong> Dorner, 2011).o Some of the aggregate indices we generated to reduce the number of parameters (e.g.,April-Aug mean sea surface salinity) may actually mask true underlying relationships.Determining appropriate ways to generate annual estimates of the physical covariates torelate to the annual biological response (<strong>sockeye</strong> productivity) was a major difficultyencountered during this project. Functional <strong>data</strong> analysis may be a better approach foraddressing this challenge (Ainsworth <strong>and</strong> Routledge, 2011), but will also be limited bythe sheer volume of <strong>data</strong> sets, potential hypotheses, <strong>and</strong> limited expert knowledge aboutthe underlying system.223
o In some cases it may be the timing rather than the size of a variable that is driving<strong>sockeye</strong> productivity. It would be a good idea to consider generating indices that reflectthis hypothesis or to evaluate timing through functional <strong>data</strong> analysis. For example,perhaps it is the timing of the plankton bloom rather than the magnitude of it that is mostimportant.Additional approaches / next stepsBayesian analytical approachParameter estimation, as described earlier, involves finding the parameter values for a givenmodel that best fit the observed <strong>data</strong>. Bayesian approaches allow the parameters to be describedwith a distribution rather than assuming they have a single true underlying value, which is theclassical or frequentist approach. These methods directly quantify uncertainty <strong>and</strong> are able toh<strong>and</strong>le very complex problems (Gelman et al. 2004) making them a natural next step to thetraditional regression analyses presented here. Hilborne <strong>and</strong> Walters (1992) specificallyrecommend Bayesian methods for fisheries <strong>data</strong> as a strategy for coping with heterogeneous <strong>data</strong>(i.e., <strong>data</strong> from different sources <strong>and</strong> potentially differing quality). While we have explicitlyconsidered model uncertainty (i.e., we have not assumed that one ‘true’ underlying model <strong>and</strong> setof parameter estimates exists) by looking at the relative weights of different c<strong>and</strong>idate models,the Bayesian approach would extend that concept even further.Functional <strong>data</strong> analysisFunctional regression analysis differs from classical regression (used in this report) in that theregression coefficient is actually a function. In classical regression the covariates <strong>and</strong> theresponse variable have the same dimension. That is, if there is one productivity measure per year,then we need a corresponding <strong>data</strong> point for each covariate of interest. In reality many physicalcovariates such as: sea surface temperature or river discharge, are measured on a much finertemporal scale. Functional <strong>data</strong> analysis (FDA) enables the covariate to be incorporated at a finerscale by letting the parameter (i.e., regression coefficient) be a function rather than a fixed value.This approach may enable us to improve the ‘<strong>data</strong> reduction’ step described above as it will helpus to underst<strong>and</strong> the behaviour of the covariate over time <strong>and</strong> hopefully better capture theunderlying behaviour that relates to the response variable. Ainsworth <strong>and</strong> Routledge (2011)describe how FDA may be applied for this specific purpose. However, they point out that expertbiological/system knowledge was still critical to the application.224
Bayesian belief networks (BBN)BBNs are models that graphically <strong>and</strong> probabilistically represent correlative <strong>and</strong> causativerelationships among variables (Cain 2001). A particular BBN defines various events, thedependencies between them, <strong>and</strong> the conditional probabilities involved in those dependencies.This is represented as a probabilistic graphical model that represents a set of variables <strong>and</strong> theirprobabilistic independencies. BBNs lend themselves well to representing the variability ofnatural systems <strong>and</strong> uncertainty of underst<strong>and</strong>ing, <strong>and</strong> the implications of this to managementdecisions (Kuikka et al. 1999). A BBN could be developed from the conceptual model (Figure3.3-1) to improve our underst<strong>and</strong>ing of the <strong>cumulative</strong> <strong>impacts</strong>, interactions, <strong>and</strong> relative effectsof stressors across all projects.Control chartsThis is a concept taken from statistical process control theory usually applied to a manufacturingprocess. Control charts are used on an ongoing basis to monitor whether or not the system is ‘incontrol’. Both the actual value <strong>and</strong> the variability are monitored. Early detection of systematicchanges resulting in either a change to the value or increase in variability (or both) is critical,presumably the same concepts could be useful for informing managers of a natural system. Itmay be useful to assess whether or not the productivity <strong>data</strong> has been stable or increasing interms of variability. During the course of this project, we identified two other <strong>sockeye</strong> related<strong>data</strong> sets where there appeared to be increasing variability over time: 1) age of return (Figure 4.5-1) <strong>and</strong> the 2) returning spawner migration route (Figure 4.5-2). It would be useful to quantifythis observation <strong>and</strong> if valid determine if there is some way to assess the cause.225
Appendix 4. Quantitative ResultsA4.1 Trend <strong>and</strong> Change Point Analysis of Productivity by StockTrend analyses of <strong>sockeye</strong> productivity (i.e., ln(R/S)) over time found that 6 of the 19 <strong>Fraser</strong>stocks were better fit by the piece-wise regression model (allowing for 2 different trends over thetime-series) than a single straight line regression over time (Table A4.1-1). The recent trends for5 of these stocks (excluding Pitt) ranged from: -0.050 to -0.141, which is equivalent to annualdeclines on the R/S scale of: ~5% (Early Stuart) to 13% 22 (Quesnel). The earliest change-pointoccurred in 1965 (Early Stuart) <strong>and</strong> the latest occurred in 1988 (Chilko). Pitt is reportedseparately as we are not sure how reflective this stock is of other wild <strong>Fraser</strong> stocks due to itshigh hatchery influence. The recent trend in Pitt was -0.466, which corresponds to an averageannual decline of ~35% since 1999. Despite having only 5 years of <strong>data</strong> to estimate the post1999 trend, the p-value was
(Fennell), which is equivalent to annual declines on the R/S scale of: ~1.7% to 6.5% since~1950.Table A4.1-2. Summary of stocks where a single trend line was more appropriate. The estimated slope of the line isshown along with the associated test statistic <strong>and</strong> p-value (significant p-values are indicated by a *).Arrows indicate the direction of the trend.Stock Slope (b1) Test statisticfor b1p-value 23Trend overentire timeseriesBirkenhead -0.035 -4.059 < 0.001* ↓Bowron -0.017 -2.520 0.015* ↓Fennell -0.067 -5.374 < 0.001* ↓Gates -0.050 -4.071 < 0.001* ↓Harrison 0.012 0.978 0.332 ↔L.Shuswap -0.007 -0.889 0.378 ↔L.Stuart -0.027 -2.464 0.017* ↓Nadina -0.028 -1.849 0.074↓ (weakevidence)↓(weakevidence)Portage -0.021 -1.935 0.059Raft -0.005 -0.690 0.493 ↔Scotch -0.048 -3.346 0.002* ↓Seymour -0.023 -3.073 0.003* ↓Weaver -0.004 -0.294 0.770 ↔A4.2 Analyses of Stock CompositionThree time periods follow a very similar pattern both in terms of the shape of the concentrationprofile <strong>and</strong> the average number of recruits (between 4 & 6 million), these include the two earliesttime periods: 1948-1959, 1960-1971, <strong>and</strong> the most recent one: 1996-2006 (Figure A4.2-1). Theother two time periods have a similar shape but the average number of recruits was substantiallyhigher: 1972-1983 (~8 million) <strong>and</strong> 1984-1995 (~11 million). When the y-axis was scaled to 1to represent the <strong>cumulative</strong> proportion of total recruits, we see that the shape of the curves arevery similar across all time periods with 80% of the total recruits composed of only 4-6 stocksout of the 19 evaluated (Figure A4.2-2). The primary reason for plotting these figures was todetermine if the portfolio balance had changed over time <strong>and</strong> if that might be a potentialexplanation for the long-term decline in <strong>Fraser</strong> <strong>River</strong> <strong>sockeye</strong> productivity. While the totalnumber of recruits has varied substantially over time, the shape of the concentration profile hasnot. Contrary to our expectation, there has not been a substantial change in the “portfolio23 P-value is associated with the null hypothesis that the slope (b1) = 0. A small p-value (i.e.,
alance” over time <strong>and</strong> so this it is unlikely that the observed portfolio imbalance is responsiblefor the declines in productivity.Figure A4.2-1. Figure illustrating how the composition of the stock portfolio is dominated by only a h<strong>and</strong>ful ofstocks as well as illustrating how the total number of recruits has varied across time.228
Figure A4.2-2. Stock composition, scaled to a common axis for 5 different time periods. All five time periods in thisfigure reach 80% of the total recruits with only about 4 to 6 stocks.Decomposition of the dominant <strong>Fraser</strong> <strong>River</strong> <strong>sockeye</strong> stocks with <strong>data</strong> available illustrates thesizeable contrasts among cohorts resulting from the dominant four-year life history. The purposeof these graphs (Figure A4.2-3, A4.2-4, A4.2-5, A4.2-6) is simply to illustrate that there are infact substantial differences in stock composition among the cohorts. This may be a fairly obviousobservation to those with a scientific background in <strong>sockeye</strong> <strong>salmon</strong>; however, based on ourobservations of media coverage <strong>and</strong> other public fora it appears that this difference in stockcomposition among cohorts is often not recognized. In the public discourse, the poor 2009returns are often compared/contrasted with the high 2010 returns (these are the “comparisons” towhich we refer), without acknowledging that the situation is actually more complicated since notonly do the two years come from different generations/cycles, but the composition of each isdistinctly different. These graphs show quite clearly that 2009 versus 2010 is not a simple“apples-to-apples” comparison.229
Figure A4.2-3. Stock composition for the 1950 brood year cohort. The <strong>sockeye</strong> <strong>salmon</strong> that returned in 2010 belongto this brood year cohort. The top graph shows the total recruits by stock (stacked bar chart) <strong>and</strong>productivity (R/S, black solid dots with connecting lines). The bottom graph shows the total recruits (inmillions) of each stock wihtin this cohort over time. Only the eight most dominant stocks (over all cohorts,over 1950-2004) are shown individually.230
Figure A4.2-4. Stock composition for the 1951 brood year cohort. The top graph shows the total recruits by stock(stacked bar chart) <strong>and</strong> productivity (R/S, black solid dots with connecting lines). The bottom graph showsthe total recruits (in millions) of each stock wihtin this cohort over time. Only the eight most dominantstocks (over all cohorts, over 1950-2004) are shown individually.231
Figure A4.2-5. Stock composition for the 1952 brood year cohort. The top graph shows the total recruits by stock(stacked bar chart) <strong>and</strong> productivity (R/S, black solid dots with connecting lines). The bottom graph showsthe total recruits (in millions) of each stock wihtin this cohort over time. Only the eight most dominantstocks (over all cohorts, over 1950-2004) are shown individually.232
Figure A4.2-6. Stock composition for the 1953 brood year cohort. The <strong>sockeye</strong> <strong>salmon</strong> that returned in 2009belonged to this brood year cohort. The top graph shows the total recruits by stock (stacked bar chart) <strong>and</strong>productivity (R/S, black solid dots with connecting lines). The bottom graph shows the total recruits (inmillions) of each stock wihtin this cohort over time. Only the eight most dominant stocks (over all cohorts,over 1950-2004) are shown individually.233
A4.3 Multiple Regression ResultsA4.3.1Summary of analysesThis section describes the results of the regression analysis for each of the 6 model sets that wereexamined as part of this project (Table A4.3-1). Detailed descriptions of covariates included in atleast one of these 6 model sets are provided in Table A4.3-2.Table A4.3 -1. Description of the 6 model sets that were examined as part of this project.Model Set name Description Time period(by Brood year)A4c Comparison across life stages 1969-2001A4bComparison across life stages, with pink 1969-2001<strong>salmon</strong> includedB4c Comparison across stressor categories 1969-2001B4bComparison across stressor categories with 1969-2001pink <strong>salmon</strong> includedC4aComparison of all available marine <strong>data</strong> 1969-2004between SoG <strong>and</strong> QCS. No <strong>data</strong> for QCSSST.C3aComparison of all available marine <strong>data</strong> 1980-2004between SoG <strong>and</strong> QCS. Including QCSSST.C1aComparison of all available marine <strong>data</strong>including chlorophyll for SoG <strong>and</strong> QCSseparately.1996-2004234
Table A4.3-2. Description of the actual covariates used in various model sets. Each covariate is linked to a particular life stage <strong>and</strong> stressor category 24 . The<strong>data</strong>base variable name is provided to assist with interpreting the model outputs. Other covariates were available for other time-periods but were notexamined during this project.Life stage Stressor category Variable Description Database Variable Name Dates 25Coastal migration Habitat conditions in Lower <strong>Fraser</strong> & SoG Chlorophyll, Northern SoG, April average. CHL_M04_NSoG_MGRR_DOM 1998-Coastal migration Habitat conditions in Lower <strong>Fraser</strong> & SoG Chlorophyll, Northern SoG, May average. CHL_M05_NSoG_MGRR_DOM 1998-Coastal migration Habitat conditions in Lower <strong>Fraser</strong> & SoG SoG discharge , June-July average DIS_A67_SoGx_MGRR_DOM 1970-Coastal migration Habitat conditions in Lower <strong>Fraser</strong> & SoG SoG discharge, May average DIS_T05_SoGx_MGRR_DOM 1970-Coastal migration Habitat conditions in Lower <strong>Fraser</strong> & SoG Sea surface salinity. SoG, April-Aug average. SSS_A48_SoGx_MGRR_DOM 1950-Coastal migration Habitat conditions in Lower <strong>Fraser</strong> & SoG Sea surface temperature. SoG, April-Aug average. SST_A48_SoGx_MGRR_DOM 1950-Coastal migration Marine conditions Chlorophyll, QCS, April average. CHL_M04_QCSx_MGRR_DOM 1998-Coastal migration Marine conditions Chlorophyll, QCS, May average. CHL_M05_QCSx_MGRR_DOM 1998-Coastal migration Marine conditions QCS discharge, June-Sept average (Wannock) DIS_x69_QCSx_MGRR_DOM 1969-Coastal migration Marine conditions Sea surface salinity. QCS, April-Aug average. SSS_A48_QCSx_MGRR_DOM 1970-Coastal migration Marine conditions Sea surface temperature, QCS, July-Aug average SST_A78_QCSx_MGRR_DOM 1982-Coastal migration Marine conditions Summer wind regime. QCS. WND_x28_QCSx_MGRR_DOM 1948-Coastal migration Predator/Alternative Prey 5 marine bird species: Quantile based aggregateestimateCBQ_108_NULL_MGRR_DOM 1958-Coastal migration Predator/Alternative Prey Arrowtooth flounder biomass FPR_x87_NULL_MGRR_DOM 1961-Coastal migration Predator/Alternative Prey California sea lion estimate PNE_x25_NULL_MGRR_DOM 1971-Coastal migration Predator/Alternative Prey Harbour seal estimate PNE_x39_NULL_MGRR_DOM 1913-Coastal migration Predator/Alternative Prey Stellar sea lion PNE_x61_NULL_MGRR_DOM 1913-Coastal migration Predator/Alternative Prey Alternative prey quantile based aggregate estimateof 8 species/locations.PRQ_110_NULL_MGRR_DOM 1950-Growth in North Pacific Marine conditions North Pacific Index, Nov-Mar average NPI_x51_NPOx_GROW_DOM 1900-24 Each stressor category corresponds to a particular Cohen Technical project.25 Dates in this table refer to the earliest date a measurement is available. The date is the actual date the metric was measured not the brood year.235
Life stage Stressor category Variable Description Database Variable Name Dates 25Growth in North Pacific Predator/Alternative Prey Alternative prey quantile based aggregate estimateof 8 species/locations.PRQ_110_NULL_GROW_DOM 1950-Return to <strong>Fraser</strong> Competition with pinks Pink <strong>salmon</strong> abundance (NE Pacific) PNK_x50_NPOx_MGRS_DOM 1952-Return to <strong>Fraser</strong> Competition with pinks Pink <strong>salmon</strong> abundance (Russia) PNK_x58_NPOx_MGRS_DOM 1952-Return to <strong>Fraser</strong> Habitat conditions in Lower <strong>Fraser</strong> & SoG Sea surface salinity. SoG, May-Sept average. SSS_A59_SoGx_MGRS_DOM 1950-Return to <strong>Fraser</strong> Habitat conditions in Lower <strong>Fraser</strong> & SoG Sea surface temperature. SoG, Sept average. SST_M09_SoGx_MGRS_DOM 1950-Return to <strong>Fraser</strong> Marine conditions Sea surface salinity. QCS, May-Sept average. SSS_A59_QCSx_MGRS_DOM 1970-Return to <strong>Fraser</strong> Predator/Alternative Prey California sea lion estimate PNE_x25_NULL_MGRS_DOM 1971-Return to <strong>Fraser</strong> Predator/Alternative Prey Harbour seal estimate PNE_x39_NULL_MGRS_DOM 1913-Return to <strong>Fraser</strong> Predator/Alternative Prey Stellar sea lion PNE_x61_NULL_MGRS_DOM 1913-Return to <strong>Fraser</strong> Predator/Alternative Prey Alternative prey quantile based aggregate estimateof 8 species/locations.PRQ_110_NULL_MGRS_DOM 1950-Smolt outmigration Contaminants Qualitative water quality index. Stock specific. WQQ_x53_FWMx_SMLT_DOM 1948-Smolt outmigration Freshwater Spring air temperature CU specific SPT_x82_FWRx_SMLT_DOM 1948-Smolt outmigration Habitat conditions in Lower <strong>Fraser</strong> & SoG Discharge, SoG, April total DIS_T04_SoGx_SMLT_DOM 1969-Smolt outmigration Habitat conditions in Lower <strong>Fraser</strong> & SoG Discharge SoG, May total DIS_T05_SoGx_SMLT_DOM 1969-Smolt outmigration Habitat conditions in Lower <strong>Fraser</strong> & SoG Lower <strong>Fraser</strong> total dredge volume DRG_x45_LFRx_SMLT_DOM 1970-Smolt outmigration Predator/Alternative Prey Double Crested Cormorant <strong>and</strong> CommonMerganser: Quantile based aggregate estimateCBQ_107_NULL_SMLT_DOM 1958-Upstream migration Climate change Lower <strong>Fraser</strong> water temperature for returningadults.WTT_x82_FWMx_MGRS_DOM 1951-Upstream migration Contaminants Qualitative water quality index. Stock specific. WQQ_x66_FWMx_MGRS_DOM 1948-Upstream migration Freshwater Summer air temperature. CU specific. SUT_x26_FWMx_MGRS_DOM 1948-Upstream migration Predator/Alternative Prey Bald Eagle abundance. CBQ_x91_NULL_MGRS_DOM 1957-236
A4.3.2Model: A4cBrood years: 1969-2001Analyses by life stageA model set was tested with the available <strong>data</strong> for brood years 1969-2001. The list of potentialvariables provided by the Cohen Contractors is not exhaustive (i.e., other important variablesmay exist, or <strong>data</strong> may not have been available). However, for this time period there are at least afew variables for all but two life stages: incubation-rearing <strong>and</strong> spawning. There are a total of 33potential stressor variables. While there are 611 records in this time period, there are only 463observations of ln(R/S) with complete <strong>data</strong>. Two stocks: Harrison <strong>and</strong> Cultus, have no <strong>data</strong> forone stressor variable (Water Quality during outmigration) in this time period <strong>and</strong> are notincluded in this analysis. Each stressor was linked to a particular life stage as described inAppendix A3-4 Data Preparation). In some cases the same <strong>data</strong> may be linked to several lifestages (e.g., predators could potentially impact <strong>sockeye</strong> during their inshore migration or duringtheir return migration to spawn). Table A4.3-3 describes the ten different models in this modelset, Table A4.3-4 shows the relative fit of each model, <strong>and</strong> Table A4.3-5 provides the estimatesfor each parameter <strong>and</strong> model.Table A4.3-3. Model descriptions for model set A4c (comparison among life stages for brood years 1969-2001).ModelNameModel descriptionNumber ofstressorsTotal number ofparametersM1 Global model: contains variables associated 31 50with all life stages.M2 Life stage 1: Incubation-rearing. 0 19M3 Life stage 2: Smolt Outmigration 6 25M4 Life stage 3: Inshore Migration <strong>and</strong> 13 32Migration to Rearing AreasM5 Life stage 4a: Growth in North Pacific 2 21M6 Life stage 4b: Return to <strong>Fraser</strong> 8 26M7 Life stage 5a: Return to spawn (upstream 4 23migration) 26M8 Life stage 5b: Spawning 0 19M9 All freshwater life stages: 1, 2, 5a, <strong>and</strong> 5b 7 26M10 All marine life stages: 3, 4a, <strong>and</strong> 4b 23 4126 Note: the response variable used in the analysis, ln(R/S) already incorporates en-route mortality <strong>and</strong> so thishypothesis refers to any delayed effect on productivity (e.g., spawners may not produce as many offspring if they arestressed) resulting from the upstream migration.237
The results show strong support for M10 (all marine life stages), with weak support for M4(Inshore Migration) <strong>and</strong> M6 (Return to the <strong>Fraser</strong>). Despite the large number of parameters (41)M10 had the lowest AICc providing strong support for this model. The next two models hadsubstantially fewer parameters but their AICc scores were 5-7 units higher than that of M10indicating some information loss as a result of the reduced number of parameters. Overall theseresults indicate that the marine component of the life stage is more important in explaining theoverall productivity than the freshwater component. However, it must be noted that there werelimited stressor <strong>data</strong> available for the freshwater component <strong>and</strong> those <strong>data</strong> available may nothave been the most appropriate <strong>data</strong>. The true interpretation of this result is that the marine <strong>data</strong>available do a better job of explaining the overall productivity of <strong>Fraser</strong> <strong>sockeye</strong>, than thefreshwater <strong>data</strong> available over this time period. Estimates of effect sizes are presented in TableA4.3-5 for all models. Interpretation of the actual estimates, their magnitude <strong>and</strong> sign is difficultparticularly for very complex models with many covariates. As described in the previous section(Interpretation of results) models with only a few stressors are easier to interpret. If interested indigging into the estimates in detail, one should also obtain the estimates of variability for each ofthese parameters. These are available, but not provided in this document in the interest of space.Table A4.3-4. A4c c<strong>and</strong>idate models ordered by AICc from best (lowest) to worst (biggest). M.ID=modelidentification, M.AIC=the estimated AIC for the model, num.obs=the total number of observations (i.e.,complete rows in the <strong>data</strong> set), num.par=the total number of fixed effects + r<strong>and</strong>om effects, Correction= thedifference between the AICc (corrected for small sample size compared to number of parameters) <strong>and</strong> theAIC, M.AICC= the AICc for the model, min.AICC = the smallest AICc observed within the model set,delta= the difference between the min.AICC <strong>and</strong> each M.AICC, <strong>and</strong> AICC_wts= the Akaike weight (i.e.,support) for each model.M.ID M.AIC num.obs num.par Correction M.AICC min.AICC delta AICC_wtsM10 1127.51 463 41 8.18 1135.69 1135.69 0 88.43M4 1135.78 463 32 4.91 1140.69 1135.69 5.00 7.25M6 1139.55 463 26 3.22 1142.77 1135.69 7.08 2.56M1 1131.35 463 50 12.38 1143.73 1135.69 8.04 1.59M5 1146.65 463 21 2.10 1148.75 1135.69 13.06 0.13M8 1151.31 463 19 1.72 1153.02 1135.69 17.33 0.02M2 1151.31 463 19 1.72 1153.02 1135.69 17.33 0.02M7 1152.93 463 23 2.51 1155.44 1135.69 19.75 0.0045M3 1155.74 463 25 2.97 1158.71 1135.69 23.02 0.00089M9 1156.46 463 26 3.22 1159.68 1135.69 23.99 0.00055238
Table A4.3-5. Estimates for all fixed effects parameters included in each model, for model set A4c. Fixed effect parameters (i.e., covariates) are listed in therows. The estimates for each model are provided in the columns. A value of ‘NA’ indicates that that particular model did not include the covariate in thecorresponding row.ModelSet_A4c_VarName M1 M2 M3 M4 M5 M6 M7 M8 M9 M10(Intercept) 47.74 2.55 2.12 -9.77 1.04 1.86 4.63 2.55 2.06 -4.46CBQ_107_NULL_SMLT_DOM 0.19 NA -0.05 NA NA NA NA NA -0.10 NACBQ_108_NULL_MGRR_DOM 0.86 NA NA -0.06 NA NA NA NA NA -0.03CBQ_x91_NULL_MGRS_DOM -0.46 NA NA NA NA NA -0.27 NA NA NADIS_A67_SoGx_MGRR_DOM -1.5E-06 NA NA 2.3E-06 NA NA NA NA NA 6.4E-06DIS_T04_SoGx_SMLT_DOM 1.4E-06 NA -8.5E-06 NA NA NA NA NA -8.5E-06 NADIS_T05_SoGx_MGRR_DOM -2.1E-06 NA NA 3.6E-06 NA NA NA NA NA 3.8E-06DIS_x69_QCSx_MGRR_DOM 0.0012 NA NA 1.8E-05 NA NA NA NA NA -0.0018DRG_x45_LFRx_SMLT_DOM -1.4E-07 NA 4.4E-08 NA NA NA NA NA 5.4E-08 NAFPR_x87_NULL_MGRR_DOM -8.9E-06 NA NA -2.3E-06 NA NA NA NA NA -3.9E-06NPI_x51_NPOx_GROW_DOM -0.07 NA NA NA -0.007 NA NA NA NA -0.05PNE_x25_NULL_MGRR_DOM -0.0006 NA NA 6.4E-05 NA NA NA NA NA 5.7E-05PNE_x25_NULL_MGRS_DOM 0.0016 NA NA NA NA -6.9E-05 NA NA NA 6.6E-05PNE_x39_NULL_MGRR_DOM -0.0003 NA NA 1.2E-05 NA NA NA NA NA -5.2E-05PNE_x39_NULL_MGRS_DOM 0.0004 NA NA NA NA -8.9E-06 NA NA NA 7.5E-05PNE_x61_NULL_MGRR_DOM -0.0006 NA NA 0.0001 NA NA NA NA NA -3.6E-06PNE_x61_NULL_MGRS_DOM 0.0004 NA NA NA NA 4.5E-05 NA NA NA 0.0001PRQ_110_NULL_GROW_DOM -7.36 NA NA NA 0.73 NA NA NA NA -3.01PRQ_110_NULL_MGRR_DOM 3.61 NA NA 1.17 NA NA NA NA NA 3.24PRQ_110_NULL_MGRS_DOM -0.56 NA NA NA NA 0.38 NA NA NA 0.39SPT_x82_FWRx_SMLT_DOM 0.04 NA 0.02 NA NA NA NA NA 0.02 NASSS_A48_QCSx_MGRR_DOM -0.89 NA NA 0.13 NA NA NA NA NA -0.11SSS_A48_SoGx_MGRR_DOM 0.23 NA NA 0.07 NA NA NA NA NA 0.24SSS_A59_QCSx_MGRS_DOM -0.97 NA NA NA NA 0.09 NA NA NA 0.02SSS_A59_SoGx_MGRS_DOM 0.30 NA NA NA NA -0.15 NA NA NA -0.11SST_A48_SoGx_MGRR_DOM 0.37 NA NA 0.28 NA NA NA NA NA 0.51SST_M09_SoGx_MGRS_DOM 0.09 NA NA NA NA 0.08 NA NA NA -0.07StockNameBirkenhead:Spawners -8.63 -9.30 -9.02 -8.71 -9.24 -9.52 -9.25 -9.30 -8.88 -9.64StockNameBowron:Spawners -83.92 -98.08 -96.23 -104.29 -98.88 -95.50 -98.32 -98.08 -96.49 -103.13StockNameChilko:Spawners -1.91 -2.40 -2.33 -2.13 -2.32 -2.28 -2.45 -2.40 -2.30 -2.17239
ModelSet_A4c_VarName M1 M2 M3 M4 M5 M6 M7 M8 M9 M10StockNameE.Stuart:Spawners -1.79 -1.88 -1.98 -1.59 -1.78 -1.67 -1.85 -1.88 -1.88 -1.98StockNameFennell:Spawners -142.96 -159.24 -155.87 -154.13 -159.78 -149.78 -158.11 -159.24 -156.68 -154.76StockNameGates:Spawners -26.47 -31.14 -28.33 -26.20 -31.27 -22.02 -29.26 -31.14 -26.01 -28.31StockNameL.Shuswap:Spawners -0.57 -0.54 -0.51 -0.54 -0.56 -0.61 -0.52 -0.54 -0.49 -0.57StockNameL.Stuart:Spawners -1.20 -1.36 -1.38 -1.08 -1.28 -1.22 -1.30 -1.36 -1.34 -1.35StockNameNadina:Spawners -10.00 -13.02 -14.95 -13.94 -12.19 -11.76 -13.59 -13.02 -14.53 -10.67StockNamePortage:Spawners -99.35 -99.97 -96.11 -90.92 -101.93 -100.43 -97.79 -99.97 -93.30 -105.65StockNameQuesnel:Spawners -0.53 -0.61 -0.59 -0.49 -0.58 -0.56 -0.61 -0.61 -0.59 -0.58StockNameRaft:Spawners -26.08 -21.71 -23.93 -18.53 -18.72 -16.13 -22.58 -21.71 -24.36 -16.83StockNameScotch:Spawners -2.75 -5.22 -1.52 -0.36 -4.08 -5.15 -3.99 -5.22 -3.12 -0.54StockNameSeymour:Spawners -7.41 -8.81 -8.33 -7.47 -8.91 -9.22 -7.99 -8.81 -8.65 -7.85StockNameStellako:Spawners -4.08 -5.03 -5.33 -4.97 -4.90 -4.39 -5.15 -5.03 -5.17 -4.59StockNameWeaver:Spawners -4.14 -6.35 -5.72 -4.90 -7.05 -6.58 -7.45 -6.35 -5.45 -6.11SUT_x26_FWMx_MGRS_DOM 0.23 NA NA NA NA NA -0.06 NA NA NAWND_x28_QCSx_MGRR_DOM -0.15 NA NA -0.22 NA NA NA NA NA -0.22WQQ_x53_FWMx_SMLT_DOM -0.12 NA -0.03 NA NA NA NA NA -0.03 NAWQQ_x66_FWMx_MGRS_DOM -0.01 NA NA NA NA NA 0.03 NA 0.06 NAWTT_x82_FWMx_MGRS_DOM 0.002 NA NA NA NA NA -0.03 NA NA NADIS_T05_SoGx_SMLT_DOM NA NA 5.6E-06 NA NA NA NA NA 5.1E-06 NA240
Model: A4bBrood years: 1969-2001A second set of analyses were performed on a modified version of this model set, in which <strong>data</strong>on the abundance of pink <strong>salmon</strong> in the Northeast Pacific <strong>and</strong> from Russia were added. Theanalysis was extended to include pink <strong>salmon</strong> because: 1) the hypothesis that competition withodd-year pink <strong>salmon</strong> is a factor that has potentially contributing to the decline of <strong>Fraser</strong> <strong>River</strong><strong>sockeye</strong> <strong>salmon</strong> productivity was included in the Expert Panel’s Report to the Pacific SalmonCommission (Peterman et al., 2010), though not included among the Cohen commissionTechnical Reports; <strong>and</strong> 2) the <strong>data</strong> were made readily available to us from an early date. Asidentified in Appendix 4-3 Data preparation pink <strong>salmon</strong> are hypothesized to compete with<strong>sockeye</strong> during their forth year (i.e., second ocean year). For the purpose of this analysis theywere lined up with life stage 4b, Return to the <strong>Fraser</strong> <strong>and</strong> included in Model 6. The results forthis analysis were similar to the previous analysis with M10 achieving the lowest AICc, but nowM4 (Inshore Migration) receives strong support as well.Table A4.3-6. A4b c<strong>and</strong>idate models ordered by AICc from best (lowest) to worst (biggest). M.ID=modelidentification, M.AIC=the estimated AIC for the model, num.obs=the total number of observations (i.e.,complete rows in the <strong>data</strong> set), num.par=the total number of fixed effects + r<strong>and</strong>om effects, Correction= thedifference between the AICc (corrected for small sample size compared to number of parameters) <strong>and</strong> theAIC, M.AICC= the AICc for the model, min.AICC = the smallest AICc observed within the model set,delta= the difference between the min.AICC <strong>and</strong> each M.AICC, <strong>and</strong> AICC_wts= the Akaike weight (i.e.,support) for each model.M.ID M.AIC num.obs num.par Correction M.AICC min.AICC delta AICC_wtsM10 1130.72 463 43 9.03 1139.75 1139.75 0 58.75M4 1135.78 463 32 4.91 1140.69 1139.75 0.94 36.66M6 1142.88 463 28 3.74 1146.62 1139.75 6.87 1.89M1 1133.22 463 52 13.44 1146.66 1139.75 6.91 1.85M5 1146.65 463 21 2.10 1148.75 1139.75 9.00 0.65M8 1151.31 463 19 1.72 1153.02 1139.75 13.27 0.08M2 1151.31 463 19 1.72 1153.02 1139.75 13.27 0.08M7 1152.93 463 23 2.51 1155.44 1139.75 15.69 0.02M3 1155.74 463 25 2.97 1158.71 1139.75 18.96 0.0045M9 1156.46 463 26 3.22 1159.68 1139.75 19.93 0.0028241
Table A4.3-7. Estimates for all fixed effects parameters included in each model, for model set A4b. Fixed effect parameters (i.e., covariates) are listed in therows. The estimates for each model are provided in the columns. A value of ‘NA’ indicates that that particular model did not include the covariate in thecorresponding row.ModelSet_A4b_VarName M1 M2 M3 M4 M5 M6 M7 M8 M9 M10(Intercept) -1.53 2.55 2.12 -9.77 1.04 2.01 4.63 2.55 2.06 -7.86CBQ_107_NULL_SMLT_DOM 0.41 NA -0.05 NA NA NA NA NA -0.10 NACBQ_108_NULL_MGRR_DOM -0.21 NA NA -0.06 NA NA NA NA NA -0.06CBQ_x91_NULL_MGRS_DOM -0.34 NA NA NA NA NA -0.27 NA NA NADIS_A67_SoGx_MGRR_DOM 1.6E-05 NA NA 2.3E-06 NA NA NA NA NA 9.1E-06DIS_T04_SoGx_SMLT_DOM 4.9E-07 NA -8.5E-06 NA NA NA NA NA -8.5E-06 NADIS_T05_SoGx_MGRR_DOM 6.1E-06 NA NA 3.6E-06 NA NA NA NA NA 5.1E-06DIS_x69_QCSx_MGRR_DOM -0.005 NA NA 1.8E-05 NA NA NA NA NA -0.0026DRG_x45_LFRx_SMLT_DOM 3.2E-08 NA 4.4E-08 NA NA NA NA NA 5.4E-08 NAFPR_x87_NULL_MGRR_DOM -6.0E-06 NA NA -2.3E-06 NA NA NA NA NA -4.1E-06NPI_x51_NPOx_GROW_DOM -0.06 NA NA NA -0.01 NA NA NA NA -0.06PNE_x25_NULL_MGRR_DOM 5.6E-05 NA NA 6.4E-05 NA NA NA NA NA 2.8E-05PNE_x25_NULL_MGRS_DOM -0.0002 NA NA NA NA -7.4E-05 NA NA NA -4.2E-06PNE_x39_NULL_MGRR_DOM 1.8E-05 NA NA 1.2E-05 NA NA NA NA NA -3.5E-05PNE_x39_NULL_MGRS_DOM 4.1E-05 NA NA NA NA -9.1E-06 NA NA NA 6.0E-05PNE_x61_NULL_MGRR_DOM -1.0E-05 NA NA 0.0001 NA NA NA NA NA 9.1E-06PNE_x61_NULL_MGRS_DOM 2.4E-05 NA NA NA NA 4.1E-05 NA NA NA 0.0001PNK_x50_NPOx_MGRS_DOM 0.008 NA NA NA NA 0.0007 NA NA NA 0.0023PNK_x58_NPOx_MGRS_DOM 7.2E-05 NA NA NA NA -0.0009 NA NA NA -0.0001PRQ_110_NULL_GROW_DOM -5.27 NA NA NA 0.73 NA NA NA NA -3.17PRQ_110_NULL_MGRR_DOM 6.07 NA NA 1.17 NA NA NA NA NA 3.66PRQ_110_NULL_MGRS_DOM 0.74 NA NA NA NA 0.30 NA NA NA 0.51SPT_x82_FWRx_SMLT_DOM 0.04 NA 0.02 NA NA NA NA NA 0.02 NASSS_A48_QCSx_MGRR_DOM -0.38 NA NA 0.13 NA NA NA NA NA -0.12SSS_A48_SoGx_MGRR_DOM 0.46 NA NA 0.07 NA NA NA NA NA 0.30SSS_A59_QCSx_MGRS_DOM -0.09 NA NA NA NA 0.09 NA NA NA 0.08SSS_A59_SoGx_MGRS_DOM -0.13 NA NA NA NA -0.15 NA NA NA -0.13SST_A48_SoGx_MGRR_DOM 0.59 NA NA 0.28 NA NA NA NA NA 0.52SST_M09_SoGx_MGRS_DOM -0.13 NA NA NA NA 0.08 NA NA NA -0.08StockNameBirkenhead:Spawners -8.33 -9.30 -9.02 -8.71 -9.24 -9.56 -9.25 -9.30 -8.88 -9.56242
ModelSet_A4b_VarName M1 M2 M3 M4 M5 M6 M7 M8 M9 M10StockNameBowron:Spawners -82.33 -98.08 -96.23 -104.29 -98.88 -93.14 -98.32 -98.08 -96.49 -101.91StockNameChilko:Spawners -1.91 -2.40 -2.33 -2.13 -2.32 -2.27 -2.45 -2.40 -2.30 -2.15StockNameE.Stuart:Spawners -1.80 -1.88 -1.98 -1.59 -1.78 -1.60 -1.85 -1.88 -1.88 -1.87StockNameFennell:Spawners -138.47 -159.24 -155.87 -154.13 -159.78 -149.25 -158.11 -159.24 -156.68 -152.96StockNameGates:Spawners -21.96 -31.14 -28.33 -26.20 -31.27 -22.28 -29.26 -31.14 -26.01 -26.03StockNameL.Shuswap:Spawners -0.58 -0.54 -0.51 -0.54 -0.56 -0.62 -0.52 -0.54 -0.49 -0.57StockNameL.Stuart:Spawners -1.14 -1.36 -1.38 -1.08 -1.28 -1.19 -1.30 -1.36 -1.34 -1.29StockNameNadina:Spawners -10.68 -13.02 -14.95 -13.94 -12.19 -11.55 -13.59 -13.02 -14.53 -9.81StockNamePortage:Spawners -93.86 -99.97 -96.11 -90.92 -101.93 -101.18 -97.79 -99.97 -93.30 -104.64StockNameQuesnel:Spawners -0.51 -0.61 -0.59 -0.49 -0.58 -0.56 -0.61 -0.61 -0.59 -0.59StockNameRaft:Spawners -25.00 -21.71 -23.93 -18.53 -18.72 -16.21 -22.58 -21.71 -24.36 -15.23StockNameScotch:Spawners -2.48 -5.22 -1.52 -0.36 -4.08 -4.65 -3.99 -5.22 -3.12 -1.11StockNameSeymour:Spawners -7.51 -8.81 -8.33 -7.47 -8.91 -9.17 -7.99 -8.81 -8.65 -7.74StockNameStellako:Spawners -4.15 -5.03 -5.33 -4.97 -4.90 -4.34 -5.15 -5.03 -5.17 -4.40StockNameWeaver:Spawners -4.23 -6.35 -5.72 -4.90 -7.05 -6.71 -7.45 -6.35 -5.45 -6.12SUT_x26_FWMx_MGRS_DOM 0.18 NA NA NA NA NA -0.06 NA NA NAWND_x28_QCSx_MGRR_DOM 0.04 NA NA -0.22 NA NA NA NA NA -0.17WQQ_x53_FWMx_SMLT_DOM -0.12 NA -0.03 NA NA NA NA NA -0.03 NAWQQ_x66_FWMx_MGRS_DOM -0.0086 NA NA NA NA NA 0.03 NA 0.06 NAWTT_x82_FWMx_MGRS_DOM -0.0012 NA NA NA NA NA -0.03 NA NA NADIS_T05_SoGx_SMLT_DOM NA NA 5.6E-06 NA NA NA NA NA 5.1E-06 NA243
A4.3.3Analyses by stressor categoryModel Set: B4cBrood years: 1969-2001A second model set was developed using the same <strong>data</strong> set as in the previous section (i.e. allavailable <strong>data</strong> across all projects <strong>and</strong> life stages for brood years 1969-2001). Within this modelset, multiple models were tested, each of which contained all the available variables associatedwith a particular broad stressor category, as represented by the Cohen Commission TechnicalReports: contaminants, freshwater habitat factors, marine conditions, predators, climate change,<strong>and</strong> habitat conditions in the lower <strong>Fraser</strong> <strong>River</strong> <strong>and</strong> the Strait of Georgia. An additional globalmodel with all available variables for this timeframe was also tested. These models were thenevaluated using the same <strong>data</strong>set to determine which models have the greatest amount of support.The goal of this approach was to evaluate the relative importance of different categories ofstressors in explaining variability in productivity. However, several categories of stressor (i.e.,Cohen Commission projects) have limited or no <strong>data</strong> available over this time period <strong>and</strong> evenwhere <strong>data</strong> are available it may not adequately represent the category of stressor as a whole. Forexample, “climate change” is only represented by a single variable – delayed effect of lower<strong>Fraser</strong> <strong>River</strong> water temperature for returning adults – which does not fully capture the potential<strong>impacts</strong> of climate change on <strong>sockeye</strong> <strong>salmon</strong> over their entire life. A second example is theimpact of pathogens <strong>and</strong> disease, which are simply not represented at all within any of thesemodels because of the lack of <strong>data</strong>. Therefore it is not possible to make any conclusions, evenweak ones, about the relative importance of pathogens <strong>and</strong> disease compared to other projects.Table A4.3-8 describes the eight different models in this model set, Table A4.3-9 shows therelative fit of each model, <strong>and</strong> Table A4.3-10 provides the estimates for each parameter <strong>and</strong>model.Table A4.3-8. Model descriptions for model set B4c (comparison among stressor categories for brood years 1969-2001).ModelNameM1Model description (i.e., stressor categories included)Number of Total numberstressors of parameters31 50Global model: contains all available <strong>data</strong> from allstressor categoriesM2 Contaminants 2 21M3 Freshwater 2 21M4 Marine conditions 5 24M5 Predator/Alternate prey 13 32M6 Climate change 1 20M7 Habitat conditions in Lower <strong>Fraser</strong> <strong>and</strong> Georgia Strait 8 27244
M8 No stressor variables added. 0 19The results show that the global model (M1) had the greatest level of support. Like in theprevious analysis, the fact that this model has the lowest AICc even with 18 more parametersthan the next model indicates that the variables associated with only a single stressor categoryare not sufficient to explain the pattern in productivity. When comparing the relativeperformance of models representing individual projects the predators/alternate prey model (M5)has the greatest level of support followed closely by the lower <strong>Fraser</strong>/Strait of Georgia project(M7). It is important to remember that the predator/alternate prey model reflects two possiblemechanisms for impacting <strong>Fraser</strong> <strong>sockeye</strong>: direct predation as well as alternate prey availability.It may be more sensible to test these separately in the future.Table A4.3-9. B4c c<strong>and</strong>idate models ordered by AICc from best (lowest) to worst (biggest). M.ID=modelidentification, M.AIC=the estimated AIC for the model, num.obs=the total number of observations (i.e.,complete rows in the <strong>data</strong> set), num.par=the total number of fixed effects + r<strong>and</strong>om effects, Correction= thedifference between the AICc (corrected for small sample size compared to number of parameters) <strong>and</strong> theAIC, M.AICC= the AICc for the model, min.AICC = the smallest AICc observed within the model set,delta= the difference between the min.AICC <strong>and</strong> each M.AICC, <strong>and</strong> AICC_wts= the Akaike weight (i.e.,support) for each model.M.ID M.AIC num.obs num.par Correction M.AICC min.AICC delta AICC_wtsM1 1131.35 463 50 12.38 1143.73 1143.73 0 82.16M5 1142.77 463 32 4.91 1147.68 1143.73 3.95 11.38M7 1146.23 463 27 3.48 1149.70 1143.73 5.97 4.15M8 1151.31 463 19 1.72 1153.02 1143.73 9.29 0.79M6 1151.37 463 20 1.90 1153.27 1143.73 9.54 0.70M4 1151.12 463 24 2.74 1153.86 1143.73 10.13 0.52M2 1154.06 463 21 2.10 1156.15 1143.73 12.42 0.16M3 1154.22 463 21 2.10 1156.32 1143.73 12.59 0.15245
Table A4.3-10. Estimates for all fixed effects parameters included in each model, for model set B4c. Fixed effect parameters (i.e., covariates) are listed in therows. The estimates for each model are provided in the columns. A value of ‘NA’ indicates that that particular model did not include the covariate in thecorresponding row.ModelSet_B4c_VarName M1 M2 M3 M4 M5 M6 M7 M8(Intercept) 47.74 2.48 3.68 1.09 2.39 3.19 8.07 2.55CBQ_107_NULL_SMLT_DOM 0.19 NA NA NA 0.20 NA NA NACBQ_108_NULL_MGRR_DOM 0.86 NA NA NA 0.04 NA NA NACBQ_x91_NULL_MGRS_DOM -0.46 NA NA NA -0.17 NA NA NADIS_A67_SoGx_MGRR_DOM -1.5E-06 NA NA NA NA NA 4.2E-07 NADIS_T04_SoGx_SMLT_DOM 1.4E-06 NA NA NA NA NA -2.4E-06 NADIS_T05_SoGx_MGRR_DOM -2.1E-06 NA NA NA NA NA 1.9E-06 NADIS_x69_QCSx_MGRR_DOM 0.0012 NA NA 0.0016 NA NA NA NADRG_x45_LFRx_SMLT_DOM -1.4E-07 NA NA NA NA NA 4.5E-08 NAFPR_x87_NULL_MGRR_DOM -8.9E-06 NA NA NA-1.7E-06 NA NA NANPI_x51_NPOx_GROW_DOM -0.07 NA NA -0.01 NA NA NA NAPNE_x25_NULL_MGRR_DOM -0.0006 NA NA NA 0.0002 NA NA NAPNE_x25_NULL_MGRS_DOM 0.0016 NA NA NA -0.0001 NA NA NAPNE_x39_NULL_MGRR_DOM -0.0003 NA NA NA-2.7E-05 NA NA NAPNE_x39_NULL_MGRS_DOM 0.0004 NA NA NA 3.9E-05 NA NA NAPNE_x61_NULL_MGRR_DOM -0.0006 NA NA NA-4.9E-05 NA NA NAPNE_x61_NULL_MGRS_DOM 0.0004 NA NA NA 8.0E-05 NA NA NAPRQ_110_NULL_GROW_DOM -7.36 NA NA NA -1.49 NA NA NAPRQ_110_NULL_MGRR_DOM 3.61 NA NA NA 1.79 NA NA NAPRQ_110_NULL_MGRS_DOM -0.56 NA NA NA 0.10 NA NA NASPT_x82_FWRx_SMLT_DOM 0.04 NA 0.0099 NA NA NA NA NASSS_A48_QCSx_MGRR_DOM -0.89 NA NA 0.03 NA NA NA NASSS_A48_SoGx_MGRR_DOM 0.23 NA NA NA NA NA 0.02 NASSS_A59_QCSx_MGRS_DOM -0.97 NA NA -0.01 NA NA NA NASSS_A59_SoGx_MGRS_DOM 0.30 NA NA NA NA NA -0.16 NASST_A48_SoGx_MGRR_DOM 0.37 NA NA NA NA NA -0.23 NASST_M09_SoGx_MGRS_DOM 0.09 NA NA NA NA NA 0.06 NA246
ModelSet_B4c_VarName M1 M2 M3 M4 M5 M6 M7 M8StockNameBirkenhead:Spawners -8.63 -9.21 -9.18 -9.22 -8.91 -9.60 -9.65 -9.30StockNameBowron:Spawners -83.92 -98.51 -99.81 -95.23 -96.07 -95.73 -94.29 -98.08StockNameChilko:Spawners -1.91 -2.39 -2.44 -2.30 -2.18 -2.43 -2.34 -2.40StockNameE.Stuart:Spawners -1.79 -1.86 -1.91 -1.93 -1.75 -2.02 -1.89 -1.88StockNameFennell:Spawners -142.96 -157.00 -158.56 -152.27 -152.56 -158.78 -151.79 -159.24StockNameGates:Spawners -26.47 -29.74 -29.66 -28.39 -25.64 -30.37 -25.41 -31.14StockNameL.Shuswap:Spawners -0.57 -0.53 -0.50 -0.55 -0.53 -0.60 -0.59 -0.54StockNameL.Stuart:Spawners -1.20 -1.33 -1.41 -1.40 -1.13 -1.36 -1.37 -1.36StockNameNadina:Spawners -10.00 -12.61 -13.81 -13.51 -12.46 -12.98 -13.17 -13.02StockNamePortage:Spawners -99.35 -96.63 -98.81 -98.15 -90.88 -105.14 -101.96 -99.97StockNameQuesnel:Spawners -0.53 -0.60 -0.63 -0.62 -0.50 -0.61 -0.59 -0.61StockNameRaft:Spawners -26.08 -22.01 -20.64 -21.92 -17.67 -22.24 -18.43 -21.71StockNameScotch:Spawners -2.75 -6.53 -3.58 -3.90 -0.06 -4.68 -4.43 -5.22StockNameSeymour:Spawners -7.41 -8.73 -8.30 -8.07 -7.73 -8.73 -9.13 -8.81StockNameStellako:Spawners -4.08 -4.88 -5.33 -4.76 -4.57 -5.00 -4.56 -5.03StockNameWeaver:Spawners -4.14 -5.94 -6.56 -5.71 -5.99 -8.23 -6.41 -6.35SUT_x26_FWMx_MGRS_DOM 0.23 NA -0.07 NA NA NA NA NAWND_x28_QCSx_MGRR_DOM -0.15 NA NA -0.19 NA NA NA NAWQQ_x53_FWMx_SMLT_DOM -0.12 -0.03 NA NA NA NA NA NAWQQ_x66_FWMx_MGRS_DOM -0.0111 0.05 NA NA NA NA NA NAWTT_x82_FWMx_MGRS_DOM 0.0019 NA NA NA NA -0.04 NA NA247
Model: B4bBrood years: 1969-2001We repeated the comparison by stressor category with abundance of pinks included as anadditional stressor. The same stressor category models were tested with the addition of pink<strong>salmon</strong> as its own stressor category model. The results from this set of analyses show that thepink <strong>salmon</strong> model (M8) <strong>and</strong> the global model (M1) appear as the strongest two models. Theyhave similar AICc’s (∆AICc of 2.8) <strong>and</strong> because they are substantially different models (21versus 52 parameters), the interpretation is that they provide legitimately competing models toexplain the patterns observed in <strong>Fraser</strong> <strong>River</strong> <strong>sockeye</strong> <strong>salmon</strong>. The predators/alternate preymodel (M5) also receives some support while the lower <strong>Fraser</strong> /Strait of Georgia stressors (M7)rank forth. The fact that the pink <strong>salmon</strong> model does well is in some ways not surprising: there isa scientifically supported hypothesis, with good <strong>data</strong> for the attribute that the hypothesis relatesto, <strong>and</strong> the connection is specific to a life-history stage, whereas many of the project groupingsdo not have the most appropriate <strong>data</strong>. Given the discussion above about whether or notparticular <strong>data</strong> are representative of the factors of interest, <strong>and</strong> the idea that it may be morejustified to organize <strong>data</strong> around life-history stages with biologically based boundaries ratherthan projects with sometimes arbitrary boundaries, it makes sense that the pink <strong>salmon</strong> modelwould do well compared to other project-based models where those considerations are not asclearly met.Overall, we do not believe that organizing the <strong>data</strong> by project is as useful of an approach as isorganizing the <strong>data</strong> by life-history stage. The boundaries are arbitrary <strong>and</strong> many of thecategories are lacking in <strong>data</strong>. In this model set, none of the models had definitively highersupport than the global model which included all available variables. By contrast, when theexact same <strong>data</strong> were organized by life-history stage, several of the models achieved a higherlevel of support than the global model.248
Table A4.3-11. B4b c<strong>and</strong>idate models ordered by AICc from best (lowest) to worst (biggest). M.ID=modelidentification, M.AIC=the estimated AIC for the model, num.obs=the total number of observations (i.e.,complete rows in the <strong>data</strong> set), num.par=the total number of fixed effects + r<strong>and</strong>om effects, Correction= thedifference between the AICc (corrected for small sample size compared to number of parameters) <strong>and</strong> theAIC, M.AICC= the AICc for the model, min.AICC = the smallest AICc observed within the model set,delta= the difference between the min.AICC <strong>and</strong> each M.AICC, <strong>and</strong> AICC_wts= the Akaike weight (i.e.,support) for each model.M.ID M.AIC num.obs num.par Correction M.AICC min.AICC delta AICC_wtsM8 1141.75 463 21 2.10 1143.84 1143.84 0 68.30M1 1133.22 463 52 13.44 1146.66 1143.84 2.82 16.68M5 1142.77 463 32 4.91 1147.68 1143.84 3.84 10.02M7 1146.23 463 27 3.48 1149.70 1143.84 5.86 3.65M6 1151.37 463 20 1.90 1153.27 1143.84 9.43 0.61M4 1151.12 463 24 2.74 1153.86 1143.84 10.02 0.46M2 1154.06 463 21 2.10 1156.15 1143.84 12.31 0.15M3 1154.22 463 21 2.10 1156.32 1143.84 12.47 0.13249
Table A4.3-12. Estimates for all fixed effects parameters included in each model, for model set B4b. Fixed effect parameters (i.e., covariates) are listed in therows. The estimates for each model are provided in the columns. A value of ‘NA’ indicates that that particular model did not include the covariate in thecorresponding row.ModelSet_B4b_VarName M1 M2 M3 M4 M5 M6 M7 M8(Intercept) -1.53 2.48 3.68 1.09 2.39 3.19 8.07 3.31CBQ_107_NULL_SMLT_DOM 0.41 NA NA NA 0.20 NA NA NACBQ_108_NULL_MGRR_DOM -0.21 NA NA NA 0.04 NA NA NACBQ_x91_NULL_MGRS_DOM -0.34 NA NA NA -0.17 NA NA NADIS_A67_SoGx_MGRR_DOM 1.6E-05 NA NA NA NA NA 4.2E-07 NADIS_T04_SoGx_SMLT_DOM 4.9E-07 NA NA NA NA NA -2.4E-06 NADIS_T05_SoGx_MGRR_DOM 6.1E-06 NA NA NA NA NA 1.9E-06 NADIS_x69_QCSx_MGRR_DOM -0.005 NA NA 0.0016 NA NA NA NADRG_x45_LFRx_SMLT_DOM 3.2E-08 NA NA NA NA NA 4.5E-08 NAFPR_x87_NULL_MGRR_DOM -6.0E-06 NA NA NA -1.7E-06 NA NA NANPI_x51_NPOx_GROW_DOM -0.06 NA NA -0.01 NA NA NA NAPNE_x25_NULL_MGRR_DOM 5.6E-05 NA NA NA 0.0002 NA NA NAPNE_x25_NULL_MGRS_DOM -0.0002 NA NA NA -0.0001 NA NA NAPNE_x39_NULL_MGRR_DOM 1.8E-05 NA NA NA -2.7E-05 NA NA NAPNE_x39_NULL_MGRS_DOM 4.1E-05 NA NA NA 3.9E-05 NA NA NAPNE_x61_NULL_MGRR_DOM -1.0E-05 NA NA NA -4.9E-05 NA NA NAPNE_x61_NULL_MGRS_DOM 2.4E-05 NA NA NA 8.0E-05 NA NA NAPNK_x50_NPOx_MGRS_DOM 0.0080 NA NA NA NA NA NA -0.0043PNK_x58_NPOx_MGRS_DOM 7.2E-05 NA NA NA NA NA NA -0.0015PRQ_110_NULL_GROW_DOM -5.27 NA NA NA -1.49 NA NA NAPRQ_110_NULL_MGRR_DOM 6.07 NA NA NA 1.79 NA NA NAPRQ_110_NULL_MGRS_DOM 0.74 NA NA NA 0.10 NA NA NASPT_x82_FWRx_SMLT_DOM 0.04 NA 0.01 NA NA NA NA NASSS_A48_QCSx_MGRR_DOM -0.38 NA NA 0.03 NA NA NA NASSS_A48_SoGx_MGRR_DOM 0.46 NA NA NA NA NA 0.02 NASSS_A59_QCSx_MGRS_DOM -0.09 NA NA -0.01 NA NA NA NASSS_A59_SoGx_MGRS_DOM -0.13 NA NA NA NA NA -0.16 NASST_A48_SoGx_MGRR_DOM 0.59 NA NA NA NA NA -0.23 NASST_M09_SoGx_MGRS_DOM -0.13 NA NA NA NA NA 0.06 NAStockNameBirkenhead:Spawners -8.33 -9.21 -9.18 -9.22 -8.91 -9.60 -9.65 -9.30250
ModelSet_B4b_VarName M1 M2 M3 M4 M5 M6 M7 M8StockNameBowron:Spawners -82.33 -98.51 -99.81 -95.23 -96.07 -95.73 -94.29 -97.60StockNameChilko:Spawners -1.91 -2.39 -2.44 -2.30 -2.18 -2.43 -2.34 -2.39StockNameE.Stuart:Spawners -1.80 -1.86 -1.91 -1.93 -1.75 -2.02 -1.89 -1.70StockNameFennell:Spawners -138.47 -157.00 -158.56 -152.27 -152.56 -158.78 -151.79 -158.17StockNameGates:Spawners -21.96 -29.74 -29.66 -28.39 -25.64 -30.37 -25.41 -32.18StockNameL.Shuswap:Spawners -0.58 -0.53 -0.50 -0.55 -0.53 -0.60 -0.59 -0.57StockNameL.Stuart:Spawners -1.14 -1.33 -1.41 -1.40 -1.13 -1.36 -1.37 -1.25StockNameNadina:Spawners -10.68 -12.61 -13.81 -13.51 -12.46 -12.98 -13.17 -13.12StockNamePortage:Spawners -93.86 -96.63 -98.81 -98.15 -90.88 -105.14 -101.96 -99.35StockNameQuesnel:Spawners -0.51 -0.60 -0.63 -0.62 -0.50 -0.61 -0.59 -0.55StockNameRaft:Spawners -25.00 -22.01 -20.64 -21.92 -17.67 -22.24 -18.43 -22.03StockNameScotch:Spawners -2.48 -6.53 -3.58 -3.90 -0.06 -4.68 -4.43 -3.27StockNameSeymour:Spawners -7.51 -8.73 -8.30 -8.07 -7.73 -8.73 -9.13 -8.40StockNameStellako:Spawners -4.15 -4.88 -5.33 -4.76 -4.57 -5.00 -4.56 -5.07StockNameWeaver:Spawners -4.23 -5.94 -6.56 -5.71 -5.99 -8.23 -6.41 -6.30SUT_x26_FWMx_MGRS_DOM 0.18 NA -0.07 NA NA NA NA NAWND_x28_QCSx_MGRR_DOM 0.04 NA NA -0.19 NA NA NA NAWQQ_x53_FWMx_SMLT_DOM -0.12 -0.03 NA NA NA NA NA NAWQQ_x66_FWMx_MGRS_DOM -0.0086 0.05 NA NA NA NA NA NAWTT_x82_FWMx_MGRS_DOM -0.0012 NA NA NA NA -0.04 NA NA251
A4.3.4Analysis by regionModel: C4a1969-2004A model set was tested with the available <strong>data</strong> for brood years 1969-2004, which includedvariables for sea surface salinity (SSS), discharge <strong>and</strong> wind for QCS, <strong>and</strong> sea surface temperature(SST), SSS <strong>and</strong> discharge for SoG. While temperature is known to be important (e.g. Hinch <strong>and</strong>artins, 2011; McKinnell et al., 2011), however, this model set was performed despite not havingSST for QCS because it represents the longest time period available with a selection of variablesfor both regions. The individual models run within the model set are specified in Table A4.3-13.Table A4.3-13. Model specifications for the 1969-2004 (brood years) model set. This table shows the variablesincluded in each of the 8 models tested (i.e., M1 to M8) within this model set. Table 4.4-1 explains whichspecific <strong>data</strong> sets were used for each of these variables. “Rank of model” reflects the AIC c score showinglevel of support (#1 ranked model had the highest level of support <strong>and</strong> lowest AIC c score).Region Variable M1 M2 M3 M4 M5 M6 M7 M8QCS Salinity X X X XQCS Discharge X X XQCS Wind X XSoG Temperature X X XSoG Salinity X X X XSoG Discharge X X XRank of model 3 4 5 2 7 8 6 1The results show that the models with the most support are M8, M4, M1, then M2, with strongsupport for models M8 (SoG SST) <strong>and</strong> M4 (QCS SSS <strong>and</strong> discharge) in particular (Table A4.3-14 <strong>and</strong> Table A4.3-15). However, the AICc scores indicate that there is little difference in degreeof support among these four models (∆AICc = 2.28). For SoG during this period, temperature(M8) is more valuable for explaining the observed variability in <strong>Fraser</strong> <strong>River</strong> <strong>sockeye</strong> <strong>salmon</strong>productivity than salinity (M7). Overall, the analysis of this time period shows that there issupport for both QCS <strong>and</strong> SoG models – the top ranked model was for SoG, the second for QCS,<strong>and</strong> the third was the global model, including both regions. These results show that for theseparticular variables, over this particular time period, there is no clear evidence of any differencebetween the explanatory value of the two regions; however, the absence of temperature <strong>data</strong> forQCS is a substantial shortcoming of this model set, <strong>and</strong> chlorophyll is not included in any model.252
Table A4.3-14. C4a c<strong>and</strong>idate models ordered by AICc from best (lowest) to worst (biggest). M.ID=modelidentification, M.AIC=the estimated AIC for the model, num.obs=the total number of observations (i.e.,complete rows in the <strong>data</strong> set), num.par=the total number of fixed effects + r<strong>and</strong>om effects, Correction= thedifference between the AICc (corrected for small sample size compared to number of parameters) <strong>and</strong> theAIC, M.AICC= the AICc for the model, min.AICC = the smallest AICc observed within the model set,delta= the difference between the min.AICC <strong>and</strong> each M.AICC, <strong>and</strong> AICC_wts= the Akaike weight (i.e.,support) for each model.M.ID M.AIC num.obs num.par Correction M.AICC min.AICC delta AICC_wtsM8 1613.65 614 22 1.71 1615.36 1615.36 0 40.18M4 1614.87 614 23 1.87 1616.74 1615.36 1.38 20.15M1 1614.25 614 28 2.78 1617.02 1615.36 1.66 17.51M2 1615.61 614 24 2.04 1617.64 1615.36 2.28 12.82M3 1616.73 614 25 2.21 1618.95 1615.36 3.59 6.69M7 1619.46 614 22 1.71 1621.17 1615.36 5.81 2.20M5 1622.68 614 24 2.04 1624.72 1615.36 9.36 0.37M6 1626.11 614 22 1.71 1627.82 1615.36 12.46 0.08253
Table A4.3-15. Estimates for all fixed effects parameters included in each model, for model set C4a. Fixed effect parameters (i.e., covariates) are listed in therows. The estimates for each model are provided in the columns. A value of ‘NA’ indicates that that particular model did not include the covariate in thecorresponding row.ModelSet_C4a_VarName M1 M2 M3 M4 M5 M6 M7 M8(Intercept) 0.98 -6.78 6.66 -5.41 4.76 -1.15 7.48 7.31DIS_A67_SoGx_MGRR_DOM -1.5E-06 NA 1.2E-06 NA 2.2E-06 NA NA NADIS_T05_SoGx_MGRR_DOM 5.7E-08 NA 2.1E-06 NA 1.1E-06 NA NA NADIS_x69_QCSx_MGRR_DOM 0.0017 0.0030 NA 0.0029 NA NA NA NASSS_A48_QCSx_MGRR_DOM 0.26 0.25 NA 0.21 NA 0.12 NA NASSS_A48_SoGx_MGRR_DOM -0.15 NA -0.02 NA -0.11 NA -0.19 NASST_A48_SoGx_MGRR_DOM -0.23 NA -0.29 NA NA NA NA -0.34StockNameBirkenhead:Spawners -9.83 -9.92 -9.84 -9.90 -9.96 -10.10 -10.00 -9.89StockNameBowron:Spawners -103.73 -103.22 -104.61 -102.60 -105.33 -106.07 -105.18 -104.21StockNameChilko:Spawners -2.24 -2.28 -2.20 -2.30 -2.27 -2.34 -2.27 -2.21StockNameCultus:Spawners -51.24 -49.82 -53.54 -49.69 -51.90 -51.82 -51.76 -53.74StockNameE.Stuart:Spawners -2.01 -2.21 -1.83 -2.19 -1.86 -2.10 -1.83 -1.87StockNameFennell:Spawners -145.83 -147.64 -142.98 -148.57 -147.91 -151.17 -147.89 -142.38StockNameGates:Spawners -33.61 -35.98 -30.70 -36.81 -34.82 -35.47 -34.14 -29.31StockNameHarrison:Spawners -65.85 -71.29 -63.09 -69.79 -60.98 -68.46 -58.75 -66.28StockNameL.Shuswap:Spawners -0.32 -0.33 -0.34 -0.33 -0.36 -0.36 -0.36 -0.34StockNameL.Stuart:Spawners -1.38 -1.51 -1.29 -1.51 -1.33 -1.44 -1.30 -1.31StockNameNadina:Spawners -10.55 -11.37 -10.71 -11.31 -10.96 -11.34 -10.60 -10.49StockNamePortage:Spawners -95.71 -98.07 -95.69 -98.20 -98.19 -100.73 -98.46 -96.69StockNameQuesnel:Spawners -0.86 -0.92 -0.86 -0.92 -0.89 -0.93 -0.89 -0.87StockNameRaft:Spawners -21.24 -24.46 -20.73 -25.23 -23.43 -24.31 -22.89 -20.30StockNameScotch:Spawners 5.81 4.57 5.00 4.29 3.44 2.86 3.20 4.76StockNameSeymour:Spawners -6.86 -7.01 -7.24 -7.10 -7.68 -8.04 -7.81 -7.32StockNameStellako:Spawners -5.25 -5.50 -5.20 -5.59 -5.54 -5.70 -5.51 -5.17StockNameWeaver:Spawners -10.54 -10.24 -10.47 -10.36 -10.62 -10.59 -10.76 -10.68WND_x28_QCSx_MGRR_DOM -0.0089 -0.09 NA NA NA NA NA NA254
Model: C3a1980-2004A model set was tested with the available <strong>data</strong> for brood years 1980-2004, which included thesame variables as described above, albeit for a shorter time period, but with the addition of SSTfor QCS. The individual models run within the model set are specified in Table A4.3-16.Table A4.3-16. Model specifications for the 1980-2004 (brood years) model set. This table shows the variablesincluded in each of the 10 models tested (i.e. M1 to M10) within this model set. Table 4.4-1 explains whichspecific <strong>data</strong> sets were used for each of these variables. “Rank of model” reflects the AIC c score showinglevel of support (#1 ranked model had the highest level of support <strong>and</strong> lowest AIC c score).Region Variable M1 M2 M3 M4 M5 M6 M7 M8 M9 M10QCS Temperature X X X X XQCS Salinity X X X X XQCS Discharge X X XQCS Wind X XSoG Temperature X X X XSoG Salinity X X X XSoG Discharge X XRank of model 6 3 10 1 2 8 4 9 5 7The three models with the lowest AICc scores were M4 (QCS SST, SSS <strong>and</strong> discharge), M5(QCS SST <strong>and</strong> SSS), <strong>and</strong> M2 (QCS SST, SSS, discharge, <strong>and</strong> wind) (Table A4.3-17). Togetherthey indicate that the QCS models have greater explanatory value than SoG models for <strong>Fraser</strong><strong>River</strong> <strong>sockeye</strong> <strong>salmon</strong> productivity during 1980-2004. This conclusion is supported further bythe fact that the models with the next two lowest AICc scores are M7 (QCS SSS) <strong>and</strong> M9 (QCSSST). This finding is an important new result because it is alters the conclusion of Peterman etal. (2010) based on new <strong>data</strong> <strong>and</strong> analyses that were not available at the PSC workshop.The results also highlight the importance of not being able to include for QCS SST in theprevious model set, because within this model set all of the models that include QCS SST have amuch higher level of support than any of the models that include SoG SST.Within both of the model sets discussed above (i.e. 1969-2004 <strong>and</strong> 1980-2004), <strong>and</strong> across allmodels for both QCS <strong>and</strong> SoG, SST demonstrated an negative or inverse relationship with theproductivity of <strong>Fraser</strong> <strong>River</strong> <strong>sockeye</strong> <strong>salmon</strong> (Table A4.3-18). This is an unsurprising result inthat it simply agrees with a well-established literature on the subject. SSS also had a consistentrelationship across all models within both of the model sets discussed above; however, thedirection of the relationship is in the opposite direction for the two regions, positive for QCS, <strong>and</strong>negative for SoG. We cannot offer a definitive explanation for why this might be the case or255
suggest any underlying mechanism, but it does provide an excellent opportunity to emphasizesome of the potential limitations of this analysis <strong>and</strong> considerations that need to be kept in mind.First, it is possible due to strong regional differences, that the mechanisms that might connectSSS with <strong>sockeye</strong> <strong>salmon</strong> productivity are in fact different in the two regions. An exploration ofsome of the oceanographic <strong>and</strong> climatic variables over time shows that there are many ways inwhich the two regions appear quite distinct from each other. Second, correlational analyses findrelationships among <strong>data</strong>, but correlation does not imply causation – just because there is anegative correlation over time between SSS in SoG <strong>and</strong> productivity of <strong>sockeye</strong> <strong>salmon</strong> does notmean that there is a direct mechanism relating the two. The fact that the direction of therelationship with SSS is opposite as for QCS could imply that there is another factor that isunique to SoG, for which we do not have <strong>data</strong> in the model, that confounds the expectedrelationship between SSS <strong>and</strong> <strong>sockeye</strong> productivity. Third, it is important to consider the scale ofthe underlying measurements. In this case, the SSS <strong>data</strong> come from point measurements at twoparticular lighthouses. These <strong>data</strong> sources were chosen by Cohen Commission contractors asbeing the most representative of the two regions but it is possible that there is fine scale variationthat is lost when using a point measure as a regional index. For example, SSS measured at onelighthouse in SoG may not always reflect conditions experienced along the migration paths of<strong>sockeye</strong> <strong>salmon</strong> or the depth at which they travel.Table A4.3-17. C3a c<strong>and</strong>idate models ordered by AICc from best (lowest) to worst (biggest). M.ID=modelidentification, M.AIC=the estimated AIC for the model, num.obs=the total number of observations (i.e.,complete rows in the <strong>data</strong> set), num.par=the total number of fixed effects + r<strong>and</strong>om effects, Correction= thedifference between the AICc (corrected for small sample size compared to number of parameters) <strong>and</strong> theAIC, M.AICC= the AICc for the model, min.AICC = the smallest AICc observed within the model set,delta= the difference between the min.AICC <strong>and</strong> each M.AICC, <strong>and</strong> AICC_wts= the Akaike weight (i.e.,support) for each model.M.ID M.AIC num.obs num.par Correction M.AICC min.AICC delta AICC_wtsM4 1136.05 423 24 3.02 1139.06 1139.06 0 45.62M5 1136.89 423 23 2.77 1139.66 1139.06 0.60 33.87M2 1137.88 423 25 3.27 1141.15 1139.06 2.09 16.04M7 1142.86 423 22 2.53 1145.39 1139.06 6.33 1.93M9 1143.81 423 22 2.53 1146.34 1139.06 7.28 1.20M1 1142.84 423 29 4.43 1147.27 1139.06 8.21 0.75M10 1146.07 423 22 2.53 1148.60 1139.06 9.54 0.39M6 1148.06 423 23 2.77 1150.83 1139.06 11.77 0.13M8 1149.92 423 22 2.53 1152.45 1139.06 13.39 0.056M3 1151.84 423 25 3.27 1155.11 1139.06 16.05 0.015256
Table A4.3-18. Estimates for all fixed effects parameters included in each model, for model set C3a. Fixed effect parameters (i.e., covariates) are listed in therows. The estimates for each model are provided in the columns. A value of ‘NA’ indicates that that particular model did not include the covariate in thecorresponding row.ModelSet_C3a_VarName M1 M2 M3 M4 M5 M6 M7 M8 M9 M10(Intercept) -3.47 -4.50 7.65 -4.89 -3.34 6.81 -7.26 3.41 5.76 6.63DIS_A67_SoGx_MGRR_DOM -1.4E-06 NA -1.1E-06 NA NA NA NA NA NA NADIS_T05_SoGx_MGRR_DOM -4.0E-06 NA 1.0E-06 NA NA NA NA NA NA NADIS_x69_QCSx_MGRR_DOM 0.0026 0.0021 NA 0.0022 NA NA NA NA NA NASSS_A48_QCSx_MGRR_DOM 0.37 0.29 NA 0.30 0.31 NA 0.32 NA NA NASSS_A48_SoGx_MGRR_DOM -0.19 NA -0.02 NA NA -0.01 NA -0.04 NA NASST_A48_SoGx_MGRR_DOM 0.25 NA -0.32 NA NA -0.29 NA NA NA -0.29SST_A78_QCSx_MGRR_DOM -0.34 -0.22 NA -0.22 -0.26 NA NA NA -0.25 NAStockNameBirkenhead:Spawners -8.84 -8.78 -8.71 -8.78 -8.89 -8.71 -8.90 -8.71 -8.67 -8.71StockNameBowron:Spawners -144.67 -144.51 -141.58 -144.73 -142.39 -142.17 -148.01 -145.06 -139.23 -141.98StockNameChilko:Spawners -2.32 -2.29 -2.15 -2.29 -2.28 -2.16 -2.29 -2.17 -2.14 -2.16StockNameCultus:Spawners -87.72 -91.09 -96.10 -91.17 -94.71 -95.77 -95.40 -95.50 -95.17 -95.84StockNameE.Stuart:Spawners -2.98 -3.08 -3.06 -3.08 -3.05 -3.04 -3.26 -3.16 -3.00 -3.05StockNameFennell:Spawners -103.02 -101.63 -97.20 -101.10 -101.65 -97.28 -104.85 -99.52 -95.83 -97.21StockNameGates:Spawners -15.72 -14.71 -9.79 -14.38 -12.37 -10.10 -14.32 -11.78 -9.54 -10.03StockNameHarrison:Spawners -10.01 -8.55 6.80 -9.27 -5.98 3.90 -5.16 5.50 2.71 3.77StockNameL.Shuswap:Spawners -0.31 -0.30 -0.33 -0.29 -0.31 -0.34 -0.32 -0.35 -0.35 -0.34StockNameL.Stuart:Spawners -1.70 -1.71 -1.54 -1.71 -1.64 -1.55 -1.69 -1.58 -1.53 -1.55StockNameNadina:Spawners -11.32 -11.81 -10.74 -11.78 -11.67 -10.78 -11.65 -11.19 -11.14 -10.79StockNamePortage:Spawners -42.25 -40.91 -38.14 -40.88 -40.83 -38.58 -41.67 -37.88 -36.86 -38.58StockNameQuesnel:Spawners -0.74 -0.74 -0.74 -0.74 -0.73 -0.74 -0.77 -0.77 -0.75 -0.74StockNameRaft:Spawners -27.64 -26.85 -23.10 -26.47 -24.94 -23.52 -26.05 -25.49 -24.67 -23.53StockNameScotch:Spawners 7.97 8.71 7.56 8.87 8.40 7.48 7.29 6.32 6.98 7.48StockNameSeymour:Spawners -6.37 -6.32 -6.94 -6.27 -6.89 -6.87 -7.07 -7.27 -7.15 -6.88StockNameStellako:Spawners -5.28 -5.18 -4.88 -5.14 -5.08 -4.93 -5.33 -5.15 -4.93 -4.93StockNameWeaver:Spawners -5.35 -4.65 -4.14 -4.65 -4.52 -4.27 -4.26 -3.96 -4.11 -4.25WND_x28_QCSx_MGRR_DOM 0.02 0.04 NA NA NA NA NA NA NA NA257
Model: C1a1996-2004For 1996-2004, it was not possible to test a model set with both QCS <strong>and</strong> SoG because the timeperiod was too short for the number of variables to be included for the two regions. Thealternative approach was to develop two model sets, one for each region, to test the importanceof chlorophyll against the other variables independently within each region (Tables A4.3-19 <strong>and</strong>A4.3-22). Even though this is an extremely short time period, it reflects the earliest <strong>data</strong> availablefor chlorophyll, which is known to be an important factor (McKinnell et al., 2011)<strong>and</strong> thus itseemed important to test this model set.Table A4.3-19. Model specifications for the 1996-2004 (brood years) model set for Queen Charolotte Sound. Thistable shows the variables included in each of the 9 models tested (i.e. M1 to M9) within this model set.Table 4.4-1 explains which specific <strong>data</strong> sets were used for each of these variables. “Rank of model”reflects the AIC c score showing level of support (#1 ranked model had the highest level of support <strong>and</strong>lowest AIC c score).Region Variable M1 M2 M3 M4 M5 M6 M7 M8 M9QCS Chlorophyll X X X X X XQCS Temperature X X X X X XQCS Salinity X X X X X XQCS Discharge X XQCS Wind XRank of model 9 6 4 2 3 8 5 7 1Within the QCS model set, the four models with the lowest AICc scores are M9 (chlorophyll),M4 (chlorophyll <strong>and</strong> SST), M5 (chlorophyll <strong>and</strong> SSS), <strong>and</strong> M3 (chlorophyll, SST <strong>and</strong> SSS),respectively (Table A4.3-20 <strong>and</strong> Table A4.3-21). The values reported suggest there is not asubstantial difference among these four models in terms of their level of support (∆AICc=2.33),<strong>and</strong> because each of these model only vary by one parameter, they would not be considered to belegitimately competing models (Arnold 2010). This result suggests that chlorophyll may be animportant metric in explaining the variation in <strong>sockeye</strong> <strong>salmon</strong> productivity over the period of1996-2004.258
Table A4.3-20. QCS C1a c<strong>and</strong>idate models ordered by AICc from best (lowest) to worst (biggest). M.ID=modelidentification, M.AIC=the estimated AIC for the model, num.obs=the total number of observations (i.e.,complete rows in the <strong>data</strong> set), num.par=the total number of fixed effects + r<strong>and</strong>om effects, Correction= thedifference between the AICc (corrected for small sample size compared to number of parameters) <strong>and</strong> theAIC, M.AICC= the AICc for the model, min.AICC = the smallest AICc observed within the model set,delta= the difference between the min.AICC <strong>and</strong> each M.AICC, <strong>and</strong> AICC_wts= the Akaike weight (i.e.,support) for each model.M.ID M.AIC num.obs num.par Correction M.AICC min.AICC delta AICC_wtsM9 374.45 135 23 9.95 384.40 384.4 0 34.88M4 374.61 135 24 10.91 385.52 384.4 1.13 19.85M5 375.26 135 24 10.91 386.16 384.4 1.77 14.40M3 374.80 135 25 11.93 386.73 384.4 2.33 10.88M7 378.72 135 22 9.04 387.75 384.4 3.36 6.51M2 374.88 135 26 13.00 387.88 384.4 3.49 6.10M8 380.29 135 22 9.04 389.32 384.4 4.93 2.97M6 379.41 135 23 9.95 389.35 384.4 4.96 2.92M1 376.57 135 27 14.13 390.70 384.4 6.31 1.49259
Table A4.3-21. Estimates for all fixed effects parameters included in each model, for model set C1a, QCS. Fixed effect parameters (i.e., covariates) are listed inthe rows. The estimates for each model are provided in the columns. A value of ‘NA’ indicates that that particular model did not include the covariate inthe corresponding row.ModelSet_C1a_QCS_VarName M1 M2 M3 M4 M5 M6 M7 M8 M9(Intercept) 1.93 -25.73 -20.97 -9.64 -7.13 -15.97 -6.57 -6.26 0.02CHL_M04_QCSx_MGRR_DOM 0.42 0.19 0.36 0.43 0.37 NA NA NA 0.43CHL_M05_QCSx_MGRR_DOM 0.75 -0.24 0.28 0.25 0.20 NA NA NA 0.18DIS_x69_QCSx_MGRR_DOM -0.03 0.02 NA NA NA NA NA NA NASSS_A48_QCSx_MGRR_DOM 0.60 -0.11 0.35 NA 0.25 0.35 0.29 NA NASST_A78_QCSx_MGRR_DOM -0.54 1.30 0.72 0.65 NA 0.53 NA 0.57 NAStockNameBirkenhead:Spawners -8.91 -9.46 -9.69 -9.58 -9.77 -10.05 -9.30 -9.93 -9.68StockNameBowron:Spawners -220.31 -161.60 -169.13 -164.84 -169.48 -167.13 -188.50 -165.03 -165.60StockNameChilko:Spawners -3.46 -2.81 -2.88 -2.83 -2.89 -2.92 -3.24 -2.87 -2.85StockNameCultus:Spawners -995.51 -929.65 -957.51 -936.40 -974.92 -970.81 -1005.56 -929.08 -952.29StockNameE.Stuart:Spawners -9.01 -13.55 -14.24 -13.87 -13.73 -14.62 -9.21 -14.52 -13.50StockNameFennell:Spawners -153.76 -98.27 -102.31 -99.54 -102.33 -103.16 -135.99 -100.65 -99.95StockNameGates:Spawners -30.63 -9.06 -12.16 -10.05 -12.15 -11.00 -19.23 -10.16 -10.18StockNameHarrison:Spawners -17.80 106.15 78.10 101.56 77.36 57.45 7.87 74.79 94.75StockNameL.Shuswap:Spawners -0.23 -0.29 -0.31 -0.31 -0.30 -0.29 -0.22 -0.30 -0.31StockNameL.Stuart:Spawners -5.38 -4.61 -4.83 -4.72 -4.73 -4.81 -4.90 -4.83 -4.63StockNameNadina:Spawners -9.00 -8.41 -9.25 -8.71 -9.07 -8.34 -6.60 -8.40 -8.56StockNamePortage:Spawners -123.52 -76.18 -79.88 -78.44 -78.45 -80.33 -114.96 -78.76 -77.66StockNameQuesnel:Spawners -0.76 -1.13 -1.16 -1.16 -1.14 -1.18 -0.82 -1.19 -1.14StockNameRaft:Spawners -43.22 -23.99 -25.88 -24.63 -25.29 -25.12 -34.20 -24.71 -24.24StockNameScotch:Spawners 17.45 14.77 13.85 13.96 14.23 14.84 18.31 14.63 14.12StockNameSeymour:Spawners 3.01 0.22 -0.82 -0.52 -0.83 -0.35 3.96 -0.36 -0.66StockNameStellako:Spawners -6.29 -6.19 -6.43 -6.31 -6.40 -6.28 -5.67 -6.24 -6.30StockNameWeaver:Spawners 3.64 25.55 24.30 24.76 24.17 23.72 9.21 24.09 24.50WND_x28_QCSx_MGRR_DOM 0.50 NA NA NA NA NA NA NA NA260
Table A4.3-22. Model specifications for the 1996-2004 (brood years) model set for the Strait of Georgia. This tableshows the variables included in each of the 8 models tested (i.e. M1 to M8) within this model set. Table4.4-1 explains which specific <strong>data</strong> sets were used for each of these variables. “Rank of model” reflects theAIC c score showing level of support (#1 ranked model had the highest level of support <strong>and</strong> lowest AIC cscore).Region Variable M1 M2 M3 M4 M5 M6 M7 M8 M9SoG Chlorophyll X X X X XSoG Temperature X X X X XSoG Salinity X X X X XSoG Discharge X XRank of model 3 9 8 6 2 1 5 4 7Within the SoG model set, Models M6 (SSS) <strong>and</strong> M5 (SSS <strong>and</strong> SST) have the strongest supportwithin the group (Table A4.3-23 <strong>and</strong> Table A4.3-24). M6 <strong>and</strong> M5 have very similar AICc scores(∆AICc = 1.53) <strong>and</strong> only differ by one parameter, this implies that SST is an uninformativeparameter relative to SSS (Arnold 2010). However, the ∆AICc show that there is also relativelylittle difference in support from the M1 global model (∆AICc = 2.59 <strong>and</strong> M6) despite theaddition of 5 extra parameters <strong>and</strong> therefore M1 is a legitimately competing model for SoG.Chlorophyll in SoG on its own does not appear to be an important explanatory variable for <strong>Fraser</strong><strong>River</strong> <strong>sockeye</strong> <strong>salmon</strong> productivity, at least over the period of 1996-2004.In summary, while the results show that QCS chlorophyll may be an important metric inexplaining the variation in <strong>sockeye</strong> <strong>salmon</strong> productivity over the period of 1996-2004, whereasQCS temperature <strong>and</strong> salinity are relatively uninformative parameters. To the contrary, withinSoG during this timeframe, salinity has strong support <strong>and</strong> the remaining parameters are found tobe uninformative, except when they are all included together in the global model. One should bevery cautious about drawing conclusions from patterns observed over such a very short period oftime, but these results do at least indicate that there may be strong regional differences in theimportance of the potential drivers examined. During the <strong>data</strong> processing steps of this project, itwas noted that the variance in chlorophyll measured in the Northern SoG was substantiallygreater than that measured in the Central SoG across all months where <strong>data</strong> were provided(Figure A3.5-3). It may be worth examining these regional differences more closely.261
Table A4.3-23. SoG C1a c<strong>and</strong>idate models ordered by AICc from best (lowest) to worst (biggest). M.ID=modelidentification, M.AIC=the estimated AIC for the model, num.obs=the total number of observations (i.e.,complete rows in the <strong>data</strong> set), num.par=the total number of fixed effects + r<strong>and</strong>om effects, Correction= thedifference between the AICc (corrected for small sample size compared to number of parameters) <strong>and</strong> theAIC, M.AICC= the AICc for the model, min.AICC = the smallest AICc observed within the model set,delta= the difference between the min.AICC <strong>and</strong> each M.AICC, <strong>and</strong> AICC_wts= the Akaike weight (i.e.,support) for each model.M.ID M.AIC num.obs num.par Correction M.AICC min.AICC delta AICC_wtsM6 377.49 135 22 9.04 386.53 386.53 0 42.80M5 378.11 135 23 9.95 388.06 386.53 1.53 19.92M1 374.99 135 27 14.13 389.12 386.53 2.59 11.70M8 379.94 135 23 9.95 389.89 386.53 3.36 7.97M7 381.42 135 22 9.04 390.46 386.53 3.93 6.00M4 379.97 135 24 10.91 390.88 386.53 4.35 4.86M9 382.05 135 23 9.95 392.00 386.53 5.47 2.78M3 381.70 135 24 10.91 392.61 386.53 6.09 2.04M2 380.79 135 25 11.93 392.72 386.53 6.19 1.93262
Table A4.3-24. Estimates for all fixed effects parameters included in each model, for model set C1a, SoG. Fixed effect parameters (i.e., covariates) are listed inthe rows. The estimates for each model are provided in the columns. A value of ‘NA’ indicates that that particular model did not include the covariate inthe corresponding row.ModelSet_C1a_GS_VarName M1 M2 M3 M4 M5 M6 M7 M8 M9(Intercept) 186.87 35.27 -1.17 36.03 13.47 19.28 -2.89 2.01 0.68CHL_M04_NSoG_MGRR_DOM -0.20 -0.07 0.04 -0.05 NA NA NA 0.04 NACHL_M05_NSoG_MGRR_DOM -0.09 -0.005 -0.02 -0.02 NA NA NA -0.03 NADIS_A67_SoGx_MGRR_DOM 5.4E-06 NA NA NA NA NA NA NA -2.0E-06DIS_T05_SoGx_MGRR_DOM -9.3E-05 NA NA NA NA NA NA NA 1.2E-05SSS_A48_SoGx_MGRR_DOM -6.37 -1.50 NA -1.24 -0.68 -0.65 NA NA NASST_A48_SoGx_MGRR_DOM 0.07 0.50 0.20 NA 0.44 NA 0.32 NA NAStockNameBirkenhead:Spawners -9.48 -9.82 -8.86 -9.89 -9.91 -9.99 -9.96 -8.85 -9.97StockNameBowron:Spawners -160.20 -168.06 -198.56 -168.28 -170.75 -169.29 -167.72 -199.44 -167.69StockNameChilko:Spawners -2.79 -2.87 -3.20 -2.88 -2.89 -2.89 -2.89 -3.22 -2.89StockNameCultus:Spawners -921.45 -919.45 -954.35 -931.09 -917.22 -928.36 -926.55 -958.79 -929.32StockNameE.Stuart:Spawners -13.37 -14.14 -9.32 -13.87 -14.31 -13.89 -14.58 -8.90 -14.01StockNameFennell:Spawners -96.81 -101.79 -137.66 -101.89 -102.20 -101.71 -101.33 -139.05 -101.81StockNameGates:Spawners -7.56 -12.86 -23.53 -12.84 -13.87 -13.13 -11.81 -23.61 -12.75StockNameHarrison:Spawners 105.53 86.42 31.09 80.78 79.90 73.29 71.10 26.94 73.76StockNameL.Shuswap:Spawners -0.30 -0.29 -0.25 -0.29 -0.30 -0.29 -0.29 -0.24 -0.29StockNameL.Stuart:Spawners -4.55 -4.85 -5.23 -4.79 -4.96 -4.86 -4.92 -5.18 -4.82StockNameNadina:Spawners -8.06 -9.36 -8.38 -9.23 -9.81 -9.41 -9.00 -8.17 -9.12StockNamePortage:Spawners -76.78 -76.85 -115.25 -76.22 -78.46 -78.05 -77.94 -116.41 -76.17StockNameQuesnel:Spawners -1.14 -1.15 -0.82 -1.13 -1.16 -1.14 -1.18 -0.80 -1.14StockNameRaft:Spawners -23.36 -25.76 -37.81 -25.42 -26.37 -25.54 -25.40 -37.86 -25.24StockNameScotch:Spawners 14.55 14.76 17.01 15.02 14.31 14.65 14.76 17.30 15.24StockNameSeymour:Spawners 0.18 -0.41 3.09 -0.40 -0.84 -0.65 -0.51 3.29 -0.29StockNameStellako:Spawners -6.13 -6.35 -6.03 -6.33 -6.43 -6.36 -6.31 -5.97 -6.30StockNameWeaver:Spawners 25.79 24.44 8.57 24.33 24.09 24.07 23.94 7.81 24.10263
Appendix 5. Data Template User GuidelinesGeneralUser Guidelines <strong>and</strong> Template InstructionsPlease carefully read through the entire guidelines before beginning to import <strong>data</strong> into thetemplate.This document has three sections:A. Overall ObjectiveProviding <strong>data</strong> <strong>and</strong> meta<strong>data</strong> to support <strong>data</strong> syntheses <strong>and</strong> analyses of <strong>cumulative</strong><strong>impacts</strong> across all of the factors being investigated by Cohen Commission contractorsB. Overview of Input DataHigh-level guidelines for required <strong>data</strong> inputs, including important concepts <strong>and</strong>considerationsC. Template InstructionsMechanical details on how to actually bring these <strong>data</strong> into the templateOverall ObjectiveThe overall objective of this template is to collect the necessary <strong>data</strong> for ESSA to complete arange of quantitative <strong>and</strong> qualitative analyses under the Cohen Commission contract dealing withData Synthesis <strong>and</strong> Cumulative Effects. ESSA will be using the collected <strong>data</strong> to conductquantitative analyses exploring the relative <strong>and</strong> <strong>cumulative</strong> <strong>impacts</strong> of different stressors on<strong>Fraser</strong> <strong>sockeye</strong> productivity.ESSA will also use the <strong>data</strong> collected in qualitative analyses of potential <strong>cumulative</strong> effects <strong>and</strong>interactions over space, over time <strong>and</strong> over life-stages. ESSA will generate methods ofcommunicating the results to the diverse audiences of the Cohen Commission.It is anticipated that there will be various <strong>data</strong> limitations that will vary by stressor <strong>and</strong> particularmetric, including limited time spans of <strong>data</strong>, gaps in the time series, <strong>and</strong> only qualitativeestimates for some years/metrics rather than quantitative measurements. The <strong>data</strong> template hasbeen designed with flexibility to accommodate these potential issues.265
Overview of Required Input DataIntegrative Quantitative MetricsEach contractor (excepting #7 <strong>and</strong> 11) should provide preliminary <strong>data</strong> for a few integrativemetrics (or indices) of the stressors that he or she is examining. Key characteristics include:Few: Limit submission to 1-5 metrics per contractor. Additional metrics can be added ifjustified – i.e., metric represents an important but independent source of variation.Integrative: Each study will likely have a lot of <strong>data</strong>. The few integrative metricsprovided to ESSA should synthesize these <strong>data</strong>. Each contractor is a discipline expert thatwill know which variables are most important or how best to integrate <strong>data</strong> intointegrative metrics.Independent: Integrative metrics should be chosen to reflect independent sources ofvariation (i.e. not be highly correlated with each other).Annual: The metrics provided by each contractor need to be provided annually, for thoseyears where <strong>data</strong> exist. Each contractor will know the most relevant approach tosummarize intra-annual <strong>data</strong> into an annual metric (e.g., maximum weekly averagetemperature experienced during upstream migration of each stock of <strong>Fraser</strong> <strong>sockeye</strong>).Stock specific: Provide only one <strong>data</strong> point per stock per year. The same <strong>data</strong> point mayapply to multiple stocks; contractors can specify which ones. Do not submit many <strong>data</strong> series. For example, there may be <strong>data</strong> on 100s ofindividual contaminants or 100s of temperature buoys. Choose the mostcritical <strong>data</strong> series or decide how to integrate similar series into an index. If temperature <strong>data</strong> are hourly or daily, decide how best to integrate into anannual metric. An average over a particular season may make more sensethan an annual average. Some freshwater variables may contain more than one <strong>data</strong> point for asingle stock in a single year (i.e. multiple nursery lakes for one stock). Decidehow best to integrate these values into a single value for the stock.Ultimately, each metric will provide a SINGLE VALUE PER YEAR PER STOCK, thoughmany metrics may apply to all stocks equally.266
Metric Connected to Biologically-supported HypothesisEach reported metric should be clearly connected with a biologically-supported hypothesis thatemphasizes WHY this metric is potentially important in explaining patterns in <strong>sockeye</strong>productivity over time <strong>and</strong>/or space. Consider where these hypotheses fit within the initialconceptual model provided in the template. As stated in David Levy’s letter of Sept 8,hypotheses should be expressed in the form of questions. A temperature index may be developed that only integrates temperature<strong>data</strong> from one season because that is when <strong>sockeye</strong> would be most affectedby temperature or pass by that region. If a statistical method such as multiple regression or PCA is used todetermine that January temperatures are most significant but this is notbiologically supportable (e.g., <strong>sockeye</strong> are not in the area in January), thenthat would be a poor index.Meta<strong>data</strong> – Sources <strong>and</strong> MethodsThe original <strong>data</strong> sources <strong>and</strong> analytical methods need to be explicitly described to communicateHOW this integrative metric was generated. The leaders of each project are expected to be theexperts on how to best integrate stressor-specific <strong>data</strong> over space <strong>and</strong> time, but all users(intermediate <strong>and</strong> final) must be able trace the analysis pathway of a particular metric from itssources to its final form. Key meta<strong>data</strong> components are included in the template (specific detailsbelow).Qualitative EvaluationIt is anticipated that many important metrics will have a limited <strong>data</strong> record. To overcome thislimitation <strong>and</strong> to facilitate additional analyses over the entire time period of <strong>data</strong> on <strong>Fraser</strong> <strong>River</strong><strong>sockeye</strong> stock productivity, we would like to have Contractors supply a qualitative <strong>data</strong> whichprovides estimates/ educated guesses for the entire time period. This would complement thequantitative <strong>data</strong> set.Contractors will be required to fill in a second, complete <strong>data</strong> set with qualitative assessments (5point scale) of the same integrative metrics over time. This is based on the expert experience ofeach contractor in their respective field. This qualitative assessment will also be collected basedon each contractor’s expert knowledge of their particular stressor outside of the <strong>Fraser</strong> system aswell.267
This assessment should be the contractor’s best guess at the LEVEL of a particular stressor, notthe actual IMPACT of that stressor on <strong>sockeye</strong> productivity. Contractors should provide theirqualitative ratings independent of the productivity <strong>data</strong> (i.e. do not assign ratings based onlooking at the productivity <strong>data</strong>, as that would make the ratings biased <strong>and</strong> unusable in ESSA’sanalyses). Stock X may have been subject to a low level of pollution prior to 1985, butincreased to a high level of pollution when a pulp mill was built. Similarchanges may have occurred at other times for other stocks. The “level” of <strong>salmon</strong> farms might reflect the total number or the totalproduction capacity over time <strong>and</strong> apply to all stocks migrating past each setof farms. Some metrics may have remained at relatively constant levels over thetimeframe indicated.If it is not possible to distinguish among multiple quantitative metrics in making qualitativejudgments for the entire period of record, contractors may choose to qualitatively evaluate only asingle overarching measure for their particular stressor.Template InstructionsGeneral• Examples are included. Overwrite these with your own input.• Many cells contain comments with additional guidance. Look for cells with red triangles<strong>and</strong> hold your cursor over such a cell to read the comment.• Much of the template is protected. You should not need to edit protected cells.Opportunities for including descriptive comments are included throughout the template.• Many of the drop-down menus provide flexibility to add additional items as necessary.Additional items can be added by finding the relevant list on the “Lists” worksheet <strong>and</strong>entering new values.• IMPORTANT: “Year” refers to the year of <strong>data</strong> measurement, NOT the brood yearpotentially affected. Data will be adjusted later as necessary based on its associated lifehistory stage. Do not adjust metrics for brood year.268
Initial Conceptual Model (Worksheet: Initial Conceptual Model)This model originated from the work of the Pacific Salmon Commission workshop in June 2010.It is intended to be a DRAFT STARTING POINT. Please comment on missing components,mechanisms, or processes, while recognizing that this is meant to be a high level model of theentire system (but feel free to also provide more detailed conceptual models of the stressors <strong>and</strong>sub-systems you are investigating). Please refer to this initial model when describing thespatial/temporal questions that each metric is intended to address.Project-level Information (Worksheet: Project Info)This worksheet contains information applicable to entire submission <strong>and</strong> should be selfexplanatory.Integrative Metric (Worksheet: Metric1)Each metric will have its own worksheet. However, the quantitative <strong>data</strong> <strong>and</strong> qualitativeevaluation of a particular metric are entered on the same worksheet.Each worksheet has a detailed metric-specific meta<strong>data</strong> section, a section for enteringquantitative <strong>data</strong> for the metric, then a section for entering the qualitatively determined <strong>data</strong> forthe metric. Each section is explained below <strong>and</strong> there are examples in the actual template.Quantitative MetricMeta<strong>data</strong>Stressor nameThe name of the particular index or variable.Stressor categoryAssociated Cohen Commission project.UnitsThe units that apply to the reported values.General locationIdentify the general region with which this metric isassociated.Specific locations used Provide details on spatial locations of underlying <strong>data</strong>from which the metric is derived.Spatial <strong>and</strong> temporal aggregation detailsIf necessary, how were <strong>data</strong> from different spatiallocations aggregated into a single metric? How wereannual values determined? How were sub-annual <strong>data</strong>aggregated?269
Estimation detailsObservation typeConfidenceSpatial questionTemporal questionLife history stage associationWhat additional methods were used (after spatial <strong>and</strong>temporal aggregation) to derive this metric from theoriginal <strong>data</strong> sources?What type of observation does this metric represent?i.e., measured, expert estimate, etc.What is the overall level of confidence in these <strong>data</strong> interms of its ability to potentially provide answers to thespatial <strong>and</strong> temporal questions posed below? Thiswraps together concepts of both measurement error <strong>and</strong>sampling error.What is the spatial question that these <strong>data</strong> are intendedto address? (e.g., Do <strong>Fraser</strong> <strong>sockeye</strong> stocks with agreater level of exposure to <strong>salmon</strong> farms have thesame productivity trends as those which have lessexposure to <strong>salmon</strong> farms?)What is the temporal question that these <strong>data</strong> areintended to address? (e.g., Are time trends in <strong>Fraser</strong><strong>sockeye</strong> productivity negatively correlated with timetrends in <strong>salmon</strong> farm production?)Indicate the life history stages with which this metric isassociated (e.g., estuary rearing, marine migration torearing areas, marine growth <strong>and</strong> maturation).ValuesEnter index/metric values by year by stock, as available. Represent MISSING VALUESAS BLANKS.YearYears are provided from 1948 to 2010. Enter valuesonly for years where <strong>data</strong> are available. Enter values forthe year of <strong>data</strong> measurement, NOT the brood yearaffected.Stocks AffectedFor each year values can be entered by the stock theywould have affected, if known. If the same value isknown to apply to all stocks or the metric cannot bedistinguished between stocks, enter the value underALL. If a value is entered under ALL, the stockspecificcells will be greyed out for that year only. If thevalue under ALL is deleted, the stock-specific cells will270
Commentsopen again. It is acceptable to enter values for differentgroups of stocks each year.Additional comments on the record for a particularyear.Qualitative MetricComments specific to qualitative assessment belowComments on how the qualitative evaluation valueswere generated. Were they the expert opinion of oneperson or many? What sorts of factors were consideredor excluded?ValuesYearsProvide qualitative estimate of metric (1-5 scale, referto below) for EVERY year in the template.StocksIf a qualitative estimate of the metric can be providedby stock, enter values by stock for each year, otherwiseenter values under the ALL column.To the extent possible, provide a qualitative estimate ofthe metric as it would have applied to other non-<strong>Fraser</strong><strong>sockeye</strong> stocks within BC.Value/Rating The qualitative rating should be a qualitativeassessment based on your expert knowledge. Youshould be rating the LEVEL of the particular metric,not the impact it may have had on productivity (thelatter will emerge from multivariate analyses). Ratingsare on a 1-5 scale as follows:1 = very low, lowest 20% of the observed values2 = low, second quintile (21 st to 40 th percentiles of thedistribution of values)3 = moderate level, third quintile (41 st to 60 thpercentiles)4 = high level, fourth quintile (61 st to 80 th percentiles)5 = very high level, fifth quintile (81 st to maximumvalue)271
Given the above definitions, you should use all ratinglevels from 1 to 5. In practice, the distribution amongthese 5 values may not be completely even, due tooccasional large changes (e.g., a new pulp millconstructed that substantially changes the level ofpollution). The most important thing is to assign 1s tothe best years, 5s to the worst years <strong>and</strong> scale the valuesin between. The distribution among quintiles may onlybe approximate, but ensure that the full range of valuesis used. If you can only evaluate years as 1, 3, or 5, thatis acceptable too.Proceed to Next MetricOnce you have finished adding the <strong>data</strong> for one metric, begin with the next metric in thesubsequent worksheet.End of Guidelines272
Appendix 6. Workshop Report 1 (Nov. 30-Dec. 1, 2010)273
Technical <strong>and</strong> Scientific Research Projects’ WorkshopNovember 30 - December 1, 2010.Workshop SummaryPrepared by:ESSA TechnologiesSuite 300, 1765 West 8 th AvenueVancouver, BC V6J 5C6Prepared for:Cohen Commission of InquirySuite 2800, 650 West Georgia StreetVancouver, BC V6B 4N7December 20, 2010
Table of ContentsTable of Contents ............................................................................................................................ 2Background ..................................................................................................................................... 3Presentations ................................................................................................................................... 4Productivity Dynamics of Sockeye Salmon: Patterns that Need to be Explained .......................4Conservation Unit Status Assessment .........................................................................................5Fisheries & Fisheries Management (<strong>Fraser</strong> & Bristol Bay) ........................................................5Status of DFO Management <strong>and</strong> Science ....................................................................................6Diseases & Parasites ....................................................................................................................6Potential Effects of Contaminants ...............................................................................................7Freshwater Factors .......................................................................................................................8PICES Advisory Report on the Decline of <strong>Fraser</strong> <strong>River</strong> Sockeye Salmon in Relation to MarineEcology ........................................................................................................................................9Marine Mammal, Fish <strong>and</strong> Bird Predation ................................................................................10<strong>Fraser</strong> Sockeye Salmon Habitat Analysis: Lower <strong>Fraser</strong> <strong>River</strong> & Strait of Georgia ................11Climate & Climate Change Effects on <strong>Fraser</strong> Sockeye .............................................................11Data Synthesis <strong>and</strong> Cumulative Effects .....................................................................................12Relative Likelihood of Alternative Hypotheses ............................................................................ 14Research <strong>and</strong> Monitoring Recommendations ............................................................................... 15References ..................................................................................................................................... 18Appendix A: Table of Projects <strong>and</strong> Investigators ......................................................................... 19Appendix B: Workshop Agenda ................................................................................................... 20Appendix C: Workshop Minutes .................................................................................................. 25Appendix D: Table of Likelihood/ hypotheses ............................................................................. 73
BackgroundIn response to the declines of <strong>Fraser</strong> <strong>River</strong> Sockeye Salmon since the late 1980s, as well as thelow abundance <strong>and</strong> productivity of 2009, Prime Minister Stephen Harper appointed acommission, headed by BC Supreme Court Justice Bruce Cohen, to investigate the decline of<strong>sockeye</strong> <strong>salmon</strong> in the <strong>Fraser</strong> <strong>River</strong> (termed the Commission of Inquiry into the Decline ofSockeye Salmon in the <strong>Fraser</strong> <strong>River</strong> or the Cohen Commission). The Commission has identifieda range of fish biology <strong>and</strong> ecosystem issues that may be relevant to the recent <strong>sockeye</strong> <strong>salmon</strong>decline <strong>and</strong> their future sustainability (Cohen Commission 2010). These issues cover the range ofnatural conditions <strong>and</strong> human stressors that influence the productivity, survival, <strong>and</strong> diversity of<strong>Fraser</strong> <strong>sockeye</strong> in freshwater <strong>and</strong> marine environments. The Commission then grouped theseissues into twelve complementary statements of work for evaluation by selected experts.The Cohen Commission held a workshop, November 30 – December 1, 2010, in which each ofthe twelve scientific contractors presented their technical <strong>and</strong> scientific findings. In addition topresentations, the workshop included plenary discussions of findings, subgroup discussions ofalternative hypotheses within particular thematic areas, <strong>and</strong> research <strong>and</strong> monitoringrecommendations. Participants included Scientific Contractors, Peer Reviewers, <strong>and</strong> CohenCommission Science Staff. The main objectives of the workshop were to underst<strong>and</strong> the patternsof changes in <strong>Fraser</strong> <strong>sockeye</strong>, communicate <strong>and</strong> integrate scientific findings among researchers,identify potential linkages <strong>and</strong> interactions among possible causes, identify knowledge gaps <strong>and</strong>recommend future research <strong>and</strong> monitoring. Appendix C contains detailed notes on the meeting.The workshop included presentations on the following topics:1) Productivity dynamics of <strong>sockeye</strong> <strong>salmon</strong>: patterns that need to be explained2) Conservation Unit Status Assessment3) Fisheries & Fisheries Management (<strong>Fraser</strong> & Bristol Bay)4) Status of DFO Management <strong>and</strong> Science5) Diseases <strong>and</strong> Parasites6) Contaminants7) Freshwater Factors8) Marine Ecology9) Marine mammal, fish <strong>and</strong> bird predation10) Lower <strong>Fraser</strong> Habitat Analysis11) Climate Change12) Data <strong>synthesis</strong> <strong>and</strong> <strong>cumulative</strong> effects
PresentationsProductivity Dynamics of Sockeye Salmon: Patterns that Need to beExplainedR<strong>and</strong>all Peterman & Brigitte DornerThe return of 1.5 million <strong>Fraser</strong> <strong>sockeye</strong> <strong>salmon</strong> in 2009, the lowest since 1947, is part of acontinued, long-term trend of decline in abundance <strong>and</strong> productivity across several decades. Themain objective of this study is to evaluate the long-term spatial <strong>and</strong> temporal patterns inproductivity for 19 <strong>Fraser</strong> <strong>sockeye</strong> stocks <strong>and</strong> 45 non-<strong>Fraser</strong> <strong>sockeye</strong> stocks (from other parts ofBC, Washington <strong>and</strong> Alaska). This study estimated a number of <strong>sockeye</strong> productivity indices,including: the number of returning adult <strong>salmon</strong> (recruits) produced per spawner, juveniles /spawner, <strong>and</strong> recruits / juvenile. St<strong>and</strong>ard methods were used for productivity estimation,including the application of two different stock-recruitment models 1 to remove the effects ofspawner density on estimates of productivity. A Kalman filter method was used to extractunderlying trends from year to year variation.Declines in the overall productivity of <strong>Fraser</strong> <strong>sockeye</strong> stocks (recruits / spawner) were morestrongly associated with declines in post-juvenile productivity (juveniles to adults) than with prejuvenileproductivity (spawners to juveniles). There has been no reduction over time infreshwater productivity (spawners to juveniles). These findings are similar to the results from thePacific Salmon Commission (PSC) workshop in June 2010 (Peterman et al. 2010). Peterman <strong>and</strong>Dorner identified three periods of extended declines: the 1970s, the mid-1980s <strong>and</strong> the late 1990sto early 2000s. Importantly, other non-<strong>Fraser</strong> BC stocks showed similarly large <strong>and</strong> rapiddecreases in productivity starting in the late 1990s. This result, not available from the PSCworkshop, reveals that conditions outside the Strait of Georgia, contributed to the shared patternsof decline in productivity. Two individual stocks, Harrison <strong>and</strong> Pitt, do not follow the samedecline.The widespread <strong>and</strong> shared trends of many <strong>sockeye</strong> stocks (including <strong>Fraser</strong> stocks,Barkley Sound, Puget Sound, the BC Central Coast, the BC North Coast, <strong>and</strong> SE Alaska) aremost likely due to large-scale forces in the ocean affecting survival. There may also be somecommon forcing factors in fresh water, after juvenile densities are estimated (e.g., during thedownstream migration to the ocean), though lack of <strong>data</strong> makes it impossible to assess thishypothesis.Some of the key issues raised by workshop participants concerned the methods of estimatingproductivity <strong>and</strong> the resulting trends. Questions concerned the results from smoothed <strong>data</strong> versus1 The Ricker stock-recruitment model estimates recruits per spawner as a function of the stock’s carrying capacity<strong>and</strong> the density of spawners in the brood year. The Larkin model is similar, but in addition to the carrying capacity<strong>and</strong> density of spawners in the brood year, it also considers the densities of spawners in the three years prior to thebrood year, to account for possible positive or negative effects from past escapements on future productivity.
aw <strong>data</strong>, the range of error around the estimates <strong>and</strong> methodological differences in estimates ofrecruits prior to the mid-1990s. Responses to issues raised by participants can be found inAppendix C.Conservation Unit Status AssessmentKatherine Wieckowski, ESSAOne of the tasks of this research is to evaluate the methodology that Fisheries <strong>and</strong> OceansCanada (DFO) has developed to assess the population <strong>and</strong> habitat status of 36 <strong>Fraser</strong> <strong>River</strong><strong>sockeye</strong> Conservation Units (CUs) (Holt et al. 2009). Two alternative methodologies forassessing population status were compared to the DFO method – one that has been developedspecifically for <strong>Fraser</strong> <strong>sockeye</strong> (Pestal <strong>and</strong> Cass 2009) <strong>and</strong> another that is not species-specific(Faber-Langendoen et al. 2009). Four criteria were used to evaluate each approach: 1) ecologicalrelevance, 2) method for setting benchmarks, 3) <strong>data</strong> requirements <strong>and</strong> availability, <strong>and</strong> 4)feasibility of implementation.The inherent vulnerability of CU habitats to various stressors was assessed using l<strong>and</strong>scape-levelindicators of migratory, spawning <strong>and</strong> rearing habitats, including: total spawning extent, ratio oflake influence to total spawning; nursery lake area, <strong>and</strong> nursery lake productivity. Indicatorswere based on mapped habitat features from provincial GIS <strong>data</strong>sets <strong>and</strong> DFO lake productivityestimates. There was little correlation among the three l<strong>and</strong>scape-level indicators, or betweenthese indicators <strong>and</strong> CU population status.Workshop participants explored potential errors in assessing conservation status, especially when<strong>data</strong> are lacking or poor. Pestal <strong>and</strong> Cass (2009) explicitly considered the uncertainty in available<strong>data</strong>, <strong>and</strong> only made status determinations for 25 of the 36 CUs in the <strong>Fraser</strong> Basin.Fisheries & Fisheries Management (<strong>Fraser</strong> & Bristol Bay)Karl English, LGLThe overarching goal of the study is to examine the <strong>Fraser</strong> <strong>sockeye</strong> <strong>salmon</strong> <strong>and</strong> Bristol Bayfisheries according to three key metrics: accuracy, precision <strong>and</strong> reliability. Factors examinedincluded catch monitoring programs, pre-season forecasting methods, in-season abundanceestimates, <strong>and</strong> escapement goals. Preliminary results showed that in both the <strong>Fraser</strong> <strong>and</strong> BristolBay, catch <strong>and</strong> escapement estimates are sufficiently reliable to manage fisheries <strong>and</strong> track trendsfor major stock groups, but that pre-season forecasts are not reliable. In the <strong>Fraser</strong>, harvest rateswere high in the 1980s <strong>and</strong> early 1990s (70-90%), but much lower from 1995-2009 (18-41%);overharvesting is not a concern now.In-season assessments are timely <strong>and</strong> reliable for achieving escapement goals in both fisheries. Inthe <strong>Fraser</strong> Basin (though not in Bristol Bay) there is considerable debate about escapement goals,
<strong>and</strong> scope for improvement, particularly for cyclic stocks. The biggest <strong>data</strong> gap identified was alack of reliable annual estimates of en route loss. The Bristol Bay fishery is different than the<strong>Fraser</strong> fishery in many ways (e.g., fewer fisheries, gear types <strong>and</strong> sectors; more terminalfisheries; fewer mixed stock challenges; unambiguous management control over fisheryopenings <strong>and</strong> closings). It is therefore difficult to compare to the <strong>Fraser</strong> <strong>River</strong> <strong>and</strong> Bristol Bay<strong>sockeye</strong> fisheries.A key issue raised by workshop participants is the importance of distinguishing between theunknown (no one has done the work) <strong>and</strong> the unknowable (<strong>data</strong> are impossible to acquire).Further, it is important to consider how the information will be used: pre-season forecasts areused to modify expectations but in-season information is used to manage stocks.Status of DFO Management <strong>and</strong> ScienceEdwin Blewett, CounterpointThe three core tasks of this project were to: 1) evaluate DFO management against statedobjectives, 2) detail DFO Science <strong>and</strong> Research expenditures on <strong>Fraser</strong> <strong>River</strong> <strong>sockeye</strong> <strong>salmon</strong>,<strong>and</strong> 3) assess DFO’s ability to carry out applied <strong>sockeye</strong> <strong>salmon</strong> research. For the first two tasks,researchers conducted an extensive review of documents <strong>and</strong> interviewed key contacts to identify<strong>and</strong> evaluate relevant objectives. Fourteen objectives were identified for inclusion in the reportbased on their focus on stock management, relevance to <strong>Fraser</strong> <strong>River</strong> <strong>sockeye</strong>, level ofspecificity, ends (as opposed to means), <strong>and</strong> largest effects <strong>and</strong> <strong>impacts</strong>. Last, they defined therequired human <strong>and</strong> financial resources to compare/contrast with the actual programs <strong>and</strong>activities implemented by DFO. Major information gaps included evaluation <strong>data</strong> for post-seasonspawning escapement targets, expenditure <strong>data</strong> prior to 2005, <strong>and</strong> funding for 2009 PSF, FRP<strong>and</strong> SF research projects. Very little information was available in electronic format or updated<strong>data</strong>bases. Preliminary results show a decline in the proportion of total spending allocated toresearch in recent years, across all of DFO’s Pacific Region.Key issues raised by participants included: how to account for university research that resultsfrom DFO funded research, how to account for NSERC-funded <strong>sockeye</strong> research, how well DFOresearch is informing management (i.e. what is needed to make management decisions), <strong>and</strong> howto avoid short-sightedness, considering the need for fundamental science that provides long-terminsights.Diseases & ParasitesMichael Kent, Oregon State UniversityThe focus of the study was to review infectious diseases in <strong>sockeye</strong> <strong>salmon</strong> in BC <strong>and</strong> assesstheir role in mortality. The information for this study was obtained from peer-reviewed literature,
government documents <strong>and</strong> interviews with DFO fish health specialists. Results found fewdocumented outbreaks of disease in BC <strong>sockeye</strong> <strong>salmon</strong>. Limited survey <strong>data</strong> do not suggestrecent increases in infectious disease.Most research has been performed on hatchery fish. For wild fish, some research has beenperformed in freshwater but there is minimal information on marine stages. In agreement withthe PSC findings, it was noted that some pathogens picked up in freshwater may not causemortality until they reach the marine stage (Peterman et al. 2010). Most of the results agree withthe list of high risk (possible) infections reported by the PSC workshop. However, IHN wasfound in freshwater (fry), a finding different from the PSC report (Peterman et al. 2010).Information gaps occur where diseases affect different life history stages, but most studies haveonly focused on one stage. Factors that may cause potential interactions <strong>and</strong> <strong>cumulative</strong> effectsinclude: temperature, intermediate hosts, pollutants <strong>and</strong> l<strong>and</strong> use practices.A key participant question was how to design a rigorous survey program for examiningpathogens. Other questions pertained to sea lice <strong>and</strong> the role of fish farms, temperature <strong>and</strong>pathogen thresholds, <strong>and</strong> availability of pathogen <strong>data</strong> at different life stages of the <strong>salmon</strong>.Potential Effects of ContaminantsDon MacDonald, MacDonald Environmental Sciences, Ltd.The objective of this research is to evaluate the effects of potential contaminants on <strong>Fraser</strong> <strong>River</strong><strong>sockeye</strong> <strong>salmon</strong>. The scope of work includes an inventory of aquatic contaminants in the <strong>Fraser</strong><strong>River</strong> Basin in relation to <strong>sockeye</strong> CUs, a comparison of water quality conditions in the <strong>Fraser</strong><strong>River</strong> Basin to toxicity <strong>data</strong> for <strong>sockeye</strong> <strong>salmon</strong>, an assessment of contaminants encountered byjuvenile <strong>and</strong> adult <strong>sockeye</strong> <strong>salmon</strong> <strong>and</strong> an evaluation of the extent to which reductions in <strong>sockeye</strong>productivity are related to contaminant conditions. The inventory confirmed that a wide varietyof contaminants have been released into the <strong>Fraser</strong> <strong>River</strong> Basin. Elevated levels of conventionalpollutants, nutrients <strong>and</strong> metals were observed during key life history stages. However, pre-1990<strong>and</strong> post-1990 comparisons suggest that water quality may be improving in certain areas of the<strong>Fraser</strong> <strong>River</strong>, particularly the lower <strong>Fraser</strong>.Data gaps included limited or no <strong>data</strong> on water chemistry, endocrine disruptors, sediment, <strong>and</strong>few fish tissues. Based on the spatial <strong>and</strong> temporal patterns of both contaminants <strong>and</strong> <strong>sockeye</strong>productivity, the researchers concluded that existing <strong>data</strong> do not support the hypothesis thatwater quality <strong>and</strong> contaminants have contributed to the decline of <strong>Fraser</strong> <strong>River</strong> <strong>sockeye</strong> <strong>salmon</strong>.However, due to the large <strong>data</strong> gaps, evidence is insufficient to exclude some effects on <strong>sockeye</strong>health <strong>and</strong> survival. The PSC report had similar conclusions (Peterman et al. 2010).
Workshop participants pointed out that Harrison <strong>sockeye</strong> are interesting – given that they lingerin the estuary for much longer; they should be getting the highest levels of contaminantexposure, but yet have done the best. Other issues raised included 2007 (did levels ofcontamination or water quality change?) <strong>and</strong> pulp mill effluents (before-after effects ofreductions in pollutants during the 1990’s).Freshwater FactorsMarc Porter, ESSA TechnologiesThe focus of this study is to evaluate the <strong>impacts</strong> of local human activities on <strong>Fraser</strong> <strong>River</strong><strong>sockeye</strong> spawning habitats, rearing / nursery lakes, <strong>and</strong> migratory corridors for smoltoutmigration / adult migration. The focal human activities (potential stressors) included forestry,hydroelectricity, urbanization, agriculture, mining <strong>and</strong> water use. GIS was used to assessinteractions between stressors <strong>and</strong> <strong>sockeye</strong> habitats across CUs. At the time of the meeting,initial quantitative / qualitative assessments were completed for only a few of the stressors.Run-of-river Independent Power Producers (IPPs) are located in the upper, fishless reaches ofstreams, which makes it very unlikely that they would have any serious direct <strong>impacts</strong> on<strong>sockeye</strong> rearing, spawning or migratory habitats. In addition, there are very few IPPs in the<strong>Fraser</strong> Basin. Thus it seems highly unlikely that IPPs have had any significant role in recent<strong>sockeye</strong> declines. Log storage <strong>and</strong> associated h<strong>and</strong>ling activities can have potentially serious<strong>impacts</strong> to local habitats in the <strong>Fraser</strong> Estuary. However, as the magnitude or timing of logstorage activities in the Estuary appear generally unchanged over the past decade, there is noevidence that increasing log storage has played a significant role in recent <strong>sockeye</strong> declines. Nolarge hydro projects exist in the <strong>Fraser</strong> <strong>River</strong> itself <strong>and</strong> only a limited number of large projectsexist in large <strong>Fraser</strong> tributaries. Potential <strong>impacts</strong> on survival of migrating <strong>sockeye</strong> smolts <strong>and</strong>adults at these facilities are well known <strong>and</strong> have apparently been successfully mitigated to alarge extent. As it appears that mitigation targets have been sufficient to consistently minimize<strong>sockeye</strong> losses at the projects, there is no evidence that large hydro projects have played asignificant role in recent <strong>sockeye</strong> declines. Mining activities are widespread in the <strong>Fraser</strong> Basin<strong>and</strong> have the potential to cause local <strong>impacts</strong> to <strong>sockeye</strong> spawning <strong>and</strong> migratory corridors.However, mines in the <strong>Fraser</strong> are generally not located close to areas that support the majority of<strong>sockeye</strong> spawning. While there may be significant localized effects on fish habitat, the <strong>impacts</strong>of mining on <strong>sockeye</strong> population densities are likely to be small <strong>and</strong> difficult to detect. A major<strong>data</strong> gap is the general lack of time-series <strong>data</strong> for most stressors that could allow researchers torelate changing stressor intensity to changes in fish population or fish habitat status.Key issues raised by workshop participants were: 1) the importance of scaling the indicators to amore directly interpretable measure, relative to the stress on <strong>sockeye</strong>, 2) lack of high quality <strong>data</strong>
for all CUs should not rule out using existing <strong>data</strong>, but with caveats, <strong>and</strong> 3) caution that <strong>impacts</strong>may be local <strong>and</strong> subtle.PICES Advisory Report on the Decline of <strong>Fraser</strong> <strong>River</strong> SockeyeSalmon in Relation to Marine EcologySkip McKinnell, PICESThe main objective is to assemble a comprehensive summary of what is known about <strong>Fraser</strong><strong>River</strong> <strong>sockeye</strong> <strong>salmon</strong> in the ocean. Much of the study involved reviewing <strong>data</strong>/ technical reports<strong>and</strong> peer-reviewed literature, although some original <strong>data</strong> were re-analyzed. To explain the longtermdecline in <strong>sockeye</strong> <strong>salmon</strong>, McKinnel presented evidence that there was an abrupt “shift” tolower productivity in 1992 rather than a “trend” of a gradual decline in productivity. The lowreturns of 2009 are associated with the 2007 (2nd lowest) ocean entry year (OEY) for <strong>sockeye</strong><strong>salmon</strong>. The 2006/7 el Niño created extremes in discharges (runoff) on the central coast of BCthat may have affected the <strong>salmon</strong> by altering surface salinity. Furthermore, there were unusuallystrong southeasterly winds in the summer of 2007 (the most extreme since 1948), which keptfreshwater entrained in Queen Charlotte Sound (QCS). This raised the sea level <strong>and</strong> maintained alow salinity, freshwater “lens” in QCS, all of which delayed the spring bloom of algae (the latestsince records began to be collected in 1998). Additional evidence for ocean forcing were warmsurface sea temperatures (SSTs) in QCS in 2007.Data which extend the PSC report include: 1) the 2006 Harrison <strong>River</strong> brood year returns, 2)2004 Chilko Lake <strong>sockeye</strong> marine survival, <strong>and</strong> 3) 2007 weather, climate, oceanography <strong>and</strong>phenology of Queen Charlotte Sound/Strait. The most important unknowns for <strong>sockeye</strong> <strong>salmon</strong>in the ocean are the numbers of smolts entering the sea, by stock. There have been no studiesdocumenting where <strong>and</strong> when <strong>sockeye</strong> <strong>salmon</strong> die in the ocean.This presentation stimulated many questions from workshop participants including:o What’s the relative likelihood of different mechanisms that are not mutually exclusive?o Chums did poorly in 2010 <strong>and</strong> <strong>sockeye</strong> well, but both entered ocean in 2007 - why?o Why were conditions more extreme in QCS during 2007 than in Georgia Strait?o Could there have been harmful algae blooms in QCS as suggested in the PSC report?o Why didn’t Mackas or Peterson indices predict the low 2009 return?o Did you compare median recruits per spawner against Mackas red <strong>and</strong> blue years?o PSC report suggested that zooplankton production in 2007 was not anomalouso Can one really determine whether it’s a gradual or step change in productivity?o Can you explain other stock patterns (e.g., West Coast Vancouver Isl<strong>and</strong>, <strong>Fraser</strong> pinks)?
o Can you find the same shared trend in productivity for stocks outside the <strong>Fraser</strong>? 2Marine Mammal, Fish <strong>and</strong> Bird PredationAndrew Trites, UBCVilly Christensen, UBCThe overall objective of this study is to evaluate the effects of predators on <strong>Fraser</strong> <strong>River</strong> <strong>sockeye</strong><strong>salmon</strong>, with an extensive review of primary literature. Dr. Trites reported that in general<strong>sockeye</strong> <strong>salmon</strong> is not an important part of marine mammal diets. Among those mammals thateat <strong>salmon</strong>, <strong>sockeye</strong> is not a preferred prey species. There is no evidence of significant predationon smolts, only adult <strong>sockeye</strong>. Data were too sparse to assess the predator <strong>impacts</strong> on different<strong>sockeye</strong> stocks. Evidence agrees with the PSC report on several points including the increase inSteller sea lions since protection 40 years ago, especially in recent years (Peterman et al. 2010).Likewise, sightings of Pacific white-sided dolphins have increased, harbour seal populationshave recovered to historical levels in the Strait of Georgia <strong>and</strong> humpback whale populations aregrowing in BC <strong>and</strong> Alaska. Unlike the PSC report findings, the researchers concluded that totalfood consumption by mammals is not large enough to affect <strong>sockeye</strong>. While the timing of<strong>sockeye</strong> declines coincides with increases in Stellar sea lions, <strong>sockeye</strong> form only a small fractionof their diet (about 2-3%). Information gaps include outdated <strong>and</strong> seasonally limited <strong>data</strong> forharbour seals (only available for summer), DNA analysis of prey remains would determinespecies of <strong>salmon</strong> consumed by predators.Dr. Christensen reported on fish <strong>and</strong> bird predation in the Georgia Strait, Queen Charlotte Sound<strong>and</strong> Northeast Pacific Ocean (not addressed in the PSC report). Based on the available <strong>data</strong>,freshwater predators are not likely to have caused declines in <strong>sockeye</strong> <strong>salmon</strong>. Similarly,predation by marine birds does not seem to be a likely contributor to <strong>Fraser</strong> <strong>sockeye</strong> declines.Recent declines in other fish species could increase <strong>sockeye</strong>’s relative importance as prey forocean predators. Specifically, <strong>salmon</strong> sharks <strong>and</strong> daggertooth should be considered for furtherstudies.The most important unknown is monitoring the changing abundances of key predators infreshwater <strong>and</strong> marine ecosystems. In order to explain what happens in these ecosystems, weneed to underst<strong>and</strong> changes in productivity, fisheries <strong>and</strong> food webs. Information is poor for theopen ocean <strong>and</strong> in freshwater. DFO’s attempts to implement integrated management have beenvery limited.2 This question was addressed by Peterman <strong>and</strong> Dorner’s presentation. In general, stocks outside the <strong>Fraser</strong> do showthe same shared trend in productivity.
Key issues raised by workshop participants included: 1) the availability of other <strong>salmon</strong> speciesas alternate prey to predators; 2) a very small percentage of predator diet consisting of <strong>sockeye</strong> isnot enough to reject a potential predator as influential, without more <strong>data</strong> such as DNA or bioenergeticanalyses; <strong>and</strong> 3) it is important to examine the overlap of predators <strong>and</strong> smolts in bothspace <strong>and</strong> time.<strong>Fraser</strong> Sockeye Salmon Habitat Analysis: Lower <strong>Fraser</strong> <strong>River</strong> & Straitof GeorgiaMark Johannes, Golder AssociatesThe objectives of this study are to identify <strong>and</strong> evaluate key <strong>sockeye</strong> habitats <strong>and</strong> habitat use inthe Lower <strong>Fraser</strong>, <strong>Fraser</strong> Estuary <strong>and</strong> Strait of Georgia. Key indicators include anthropogenicchanges <strong>and</strong> biophysical characteristics in the Strait of Georgia, focusing on the period from1990 to 2010. Researchers used spatial <strong>and</strong> temporal overlays of the indicators with thedegradation of key <strong>sockeye</strong> habitat to determine potential interactions. Comparisons to the PSCreport were preliminary, but so far showed agreement (Peterman et al. 2010). A major <strong>data</strong> gap isthe lack of clear indicators on human development. Consistent indicators of biophysicalconditions in Strait of Georgia <strong>and</strong> biological observations of <strong>sockeye</strong> habitat use are alsolimited. There is a general lack of time series <strong>data</strong>.A key issue raised by workshop participants is the broad scope of the research topic. Onesuggestion was to focus on locations <strong>and</strong> times that <strong>sockeye</strong> are in specific areas. Othersuggestions included consideration of river discharge (temperature effects), light pollution inGeorgia Strait, <strong>and</strong> the relative importance of Lower <strong>Fraser</strong> habitats versus larger scale factors.Climate & Climate Change Effects on <strong>Fraser</strong> SockeyeScott Hinch, UBCEduardo Martins, UBCThe overarching theme of this research is to review the occurrence <strong>and</strong> effects of climate changeon <strong>Fraser</strong> <strong>River</strong> <strong>sockeye</strong> <strong>and</strong> their relative importance to their long-term decline. The first part ofthis study examined en route mortality, pre-spawn mortality <strong>and</strong> intergenerational effects. Thesecond study component assessed the relationships between climate <strong>and</strong> climate-affectedvariables (temperature, precipitation, river flow, salinity) <strong>and</strong> <strong>sockeye</strong> <strong>salmon</strong> survival <strong>and</strong>productivity. Hinch showed that en route loss can be large relative to harvest <strong>and</strong> spawningescapement, <strong>and</strong> has become really important in recent years; nine out of 12 stocks had highmortality in more than 50% of recent years. Contrast among non-<strong>Fraser</strong> stocks showed theopposite effects of temperatures between southern <strong>and</strong> northern stocks (e.g, warmer years are
generally better for Alaska <strong>sockeye</strong> marine survival <strong>and</strong> worse for <strong>Fraser</strong> <strong>sockeye</strong> marinesurvival) <strong>and</strong> inter-stock variability in other river systems.Hinch hypothesized that thermal (<strong>and</strong> related) issues play a large role in among <strong>and</strong> within-stockvariation in en-route <strong>and</strong> pre-spawn mortality. En route loss observations, lab experiments, <strong>and</strong>field telemetry studies showed stock-specific differences in how fish deal with acute <strong>and</strong> chronicthermal stressors. Most stocks experience substantially elevated mortality rates when migrationtemperatures exceed 18 C˚. The preliminary results <strong>and</strong> conclusions of the study agree with thePSC findings that en route mortality does not contribute directly to the decline in productivity,defined as recruits per spawner, since en route mortality is already included in the calculation ofrecruits. However, en route mortality clearly reduces the density of spawners, <strong>and</strong> therefore canhave substantial long term effects on the <strong>sockeye</strong> fishery. Although there was no overall trend inpre-spawn mortality across all <strong>Fraser</strong> stocks, Hinch found a trend of increasing pre-spawnmortality in late runs since early migration began in 1995. Migration mortality is likely a greatercontributor to declining trends in spawning abundance for early <strong>and</strong> late runs, or stocks that donot cope well with high temperatures. Similar to the PSC findings, pre-spawn mortality wasfound to reduce the number of effective female spawners, which could play a role in reducedproductivity for late run stocks. Intergenerational effects are plausible, but the supportingevidence is weak. Overall, climate change is a possible contributor to recent declines in average<strong>Fraser</strong> <strong>River</strong> <strong>sockeye</strong> productivity, given inter-annual <strong>and</strong> inter-stock variability.There are <strong>data</strong> gaps that could be improved through future studies (i.e. unknown information thatis “knowable”). There are no direct measures of migration survival, no <strong>data</strong> on the effects offisheries bycatch on migration mortality, <strong>and</strong> sparse research on the intergenerational effects.Workshop participants were interested in the earlier timing of the freshet in recent years. There isevidence that zooplankton blooms occur 30 days earlier <strong>and</strong> for a shorter period. High <strong>Fraser</strong>discharge <strong>and</strong> wind patterns could be linked to the timing of blooms.Data Synthesis <strong>and</strong> Cumulative EffectsAlex Hall & Darcy Pickard, ESSA TechnologiesThis study seeks to underst<strong>and</strong> the mechanisms by which stressors across all projects interact orcombine. The timeline for this study extends beyond that of the other reports, because it relies on<strong>data</strong> from each of the other studies. Using qualitative <strong>and</strong> quantitative approaches, researcherswill illustrate the potential <strong>cumulative</strong> <strong>impacts</strong> of multiple types of stressors through a series ofintegrative frameworks. Qualitative analysis will use a life-history approach with a conceptualmodel of the pathways of different stressors, a spatial life-history diagram illustrating the spatialscale of the <strong>sockeye</strong>’s life cycle, <strong>and</strong> an expert evaluation of the relative likelihood of evidence.The latter exercise will build upon findings in the PSC report (Peterman et al. 2010).
Quantitative analysis will use integrative metrics to synthesize the <strong>data</strong> from each researchgroup. These <strong>data</strong> should be independent, annual <strong>and</strong> stock-specific. It will be very difficult to doone single integrative analysis that incorporates all variables into a single framework, especiallydue to <strong>data</strong> limitations, including gaps within the <strong>data</strong>, limited length of record, <strong>data</strong> only forcurrent status rather than over time, <strong>and</strong> the complete lack of any <strong>data</strong> on some components.Instead, multiple models will be tested using straightforward statistical approaches.During the workshop, participants were given a draft conceptual model <strong>and</strong> asked to contributetheir ideas. One of the key recommendations was to simplify the model.Key issues raised by workshop participants:o Using longer time series with only fair quality <strong>data</strong> may be more informative thanusing shorter time series with more complete <strong>data</strong>o Using expert opinion ratings to fill <strong>data</strong> gaps is a good ideao This task seems very complex – there is little evidence for <strong>cumulative</strong>interactions, but perhaps more for the relative importance of different factorso Remember that it’s okay to say “we don’t know the answer”
Relative Likelihood of Alternative HypothesesWorkshop participants were asked to examine the PSC Report Probability of, or relativelikelihood of, alternative hypotheses (i.e. Table E-1, Peterman et al. 2010). Working insubgroups, they were asked to compare the PSC conclusions to participants’ own research <strong>and</strong>the findings presented during the workshop. When participants were in disagreement with thePSC report, they were asked to give a new rating to each of the hypotheses. Since the ninealternative hypotheses from the PSC report did not exactly correspond to the twelve areas ofresearch presented here, participants also added new hypotheses <strong>and</strong> ratings when appropriate.Given the available evidence, participants judged the relative likelihood that a given hypothesiscontributed to both the poor returns in 2009 <strong>and</strong> the long-term decline in productivity of <strong>Fraser</strong><strong>River</strong> <strong>sockeye</strong> <strong>salmon</strong>. Participants used qualitative terms (very likely, likely, possible, unlikely,or very unlikely) to rate the hypotheses. The colour of shading reflects the degree of importanceassociated with each factor (dark=major contributing factor, light=contributing, but not majorfactor). After some discussion about how to interpret Table E-1, participants clarified that thistable only considered whether or not the alternative hypotheses were likely to be contributingfactors (i.e., multiple factors are likely to be involved in the observed declines). For summarypurposes <strong>and</strong> simplification of results, the entire range of values given by participants areindicated in the updated table, whether or not there was a consensus. There are three importantcaveats regarding this exercise:o the PSC Panel had several days to carefully review <strong>and</strong> debate evidence which led togreater convergence on ratingso participants at the Cohen Commission workshop had only 1.5 hours for this exercise,with each subgroup doing their ratings independently, leading to a greater variation injudgments; <strong>and</strong>o only a few participants attended both the PSC <strong>and</strong> Cohen Commission workshop, <strong>and</strong>were able to weigh both sets of presented evidence.There was some variation in support of hypotheses, which is reflected in the updated table(Appendix D). Overall, there was a greater range of variation in ratings within each hypothesis:14 of 22 hypothesis/timeframe combinations were given relative likelihoods that spanned 3 ormore rankings. Of all the rankings assigned by workshop participants, 21 hypothesis/likelihoodratings were in agreement with the conclusions of the PSC panel <strong>and</strong> 28 ratings were indisagreement.The main conclusions <strong>and</strong> differences about the relative likelihoods of each hypothesis are asfollows:
o Changes inside Strait of Georgia were rated as less likely than in the PSCfindings, <strong>and</strong> were not seen as major factor for the low returns of <strong>sockeye</strong> in 2009.o Factors outside Strait of Georgia (especially in Queen Charlotte Sound, asopposed to the open ocean) are more likely to have contributed to declines in<strong>sockeye</strong>, <strong>and</strong> were seen as a major factor for the low returns in 2009.o Wider ranges of likelihood were expressed for contaminants, freshwater factors,marine influences, mammal predation, <strong>and</strong> delayed density dependent mortality.o Diseases were considered to be less important by workshop participants,excluding any influence of <strong>salmon</strong> farms / sea lice (which was not evaluated atthis workshop).o Better evidence was provided for contaminants, whose overall importance wasthought to be less than reported by PSC.o Climate change, which was not in the PSC report, was thought to be possible orlikely for the overall declines, <strong>and</strong> unlikely to likely for the low returns in 2009.o Fish/bird predation (not in PSC) was possible overall <strong>and</strong> possible to very unlikelyfor the low returns in 2009.o En route mortality was considered to be important for spawner abundance butcannot be evaluated against the productivity measure of recruits per spawner.Although many of the hypotheses were thought to possibly contribute to the decline, none of theavailable evidence points toward a single hypothesis as the only contributing factor in the declineof <strong>sockeye</strong> <strong>salmon</strong> from the <strong>Fraser</strong> <strong>River</strong>.Research <strong>and</strong> Monitoring RecommendationsParticipants were asked to examine the PSC Report Priorities for Monitoring <strong>and</strong> Research (<strong>and</strong>Table E-3)(Peterman et al. 2010) as a starting point for a plenary discussion. Given that twelveprojects presented their research <strong>and</strong> contain recommendations within each of their respectivereports, the purpose of this exercise was to broadly address priorities for monitoring <strong>and</strong> researchbeyond project boundaries.The participants agreed with the PSC outcome that a co-ordinated, multi-disciplinary programshould be implemented. There was consensus among the group that a focused oceanographic <strong>and</strong>fisheries research program targeting the Georgia Strait, Queen Charlotte Sound <strong>and</strong> extendingalong the continental shelf to the Alaska border would considerably advance our knowledge ofcurrent <strong>and</strong> future <strong>Fraser</strong> <strong>River</strong> <strong>sockeye</strong> populations. The program should focus on three coreareas: 1) <strong>data</strong> collection, 2) <strong>data</strong>base assimilation <strong>and</strong> integrated analysis, <strong>and</strong> 3) dissemination ofinformation.
There was widespread agreement with the PSC report that the 2009 <strong>and</strong> long-term declines in<strong>sockeye</strong> productivity were likely due to the effects of multiple stressors <strong>and</strong> factors. Futureefforts should focus not only on increasing our basic biological knowledge of <strong>sockeye</strong> <strong>salmon</strong>,but should also use information gained from the <strong>cumulative</strong> effects assessment to determinepriority research areas. Certain monitoring needs (research questions) can be answered with asingle (one-time, annual) study; however, others require long-term effort <strong>and</strong> monitoring. Astrong emphasis should be placed on studying the entire life cycle of <strong>sockeye</strong> <strong>salmon</strong> along withtheir potential stressors. It was noted that in some cases, additional sample collection would bestraightforward to implement by simply augmenting current <strong>data</strong> collection efforts. Datacollection <strong>and</strong> monitoring efforts could be extended to other <strong>salmon</strong> species as well, increasingthe potential for comparative research. Unlike the PSC report, participants felt that researchefforts should be exp<strong>and</strong>ed outside the Strait of Georgia as a priority area, as well as increasingefforts inside the Strait.One of the resounding issues throughout the workshop was researchers’ difficulty in obtaining<strong>and</strong> underst<strong>and</strong>ing <strong>data</strong> from the existing <strong>data</strong>bases. Considerable effort should be spent building<strong>and</strong> maintaining an integrated <strong>data</strong>base, with focused research <strong>and</strong> monitoring goals in mind. The<strong>data</strong>base should include the historical <strong>sockeye</strong> <strong>data</strong> with clear meta<strong>data</strong> as well as <strong>data</strong> fromcurrent <strong>and</strong> future monitoring. In order for the <strong>data</strong>base to be useful to scientists, it would need tobe regularly updated <strong>and</strong> maintained. As mentioned in the PSC report, it would be critical tocreate a framework that would allow simultaneous coordination of research across disciplines,allow for recognition of the potential for cost-effective joint sampling programs, <strong>and</strong> promoteidentification of synergistic effects <strong>and</strong> interactions.The decline of <strong>sockeye</strong> <strong>salmon</strong> in the <strong>Fraser</strong> <strong>River</strong> is an issue that has captivated the province ofBritish Columbia. Participants felt that the proposed increase in <strong>data</strong> collection <strong>and</strong> monitoringshould be followed by transparent dissemination of information to scientists <strong>and</strong> non-scientistson a regular basis. Given the potential funding of new initiatives <strong>and</strong> future findings, an annualreport on the State of the Salmon should be compiled <strong>and</strong> made publicly available.More specifically, the extended research program should be co-ordinated with a U.S. programcovering those areas of the Alaskan continental shelf containing high <strong>sockeye</strong> densities. Sincemuch of the research will augment existing research programs, funding of current programsshould be maintained. Further, recommendations for research should be directly compared tocurrent monitoring <strong>and</strong> research to determine expenditures <strong>and</strong> assess their relative merits. Asemphasized in the PSC Report, new <strong>data</strong> collection <strong>and</strong> analysis techniques exist that wouldfacilitate research efforts <strong>and</strong> increase efficiency in effort <strong>and</strong> cost. An extended research effortwould require that Canada acquire a new oceanographic/fisheries research vessel.
ReferencesFaber-Langendoen, D., L. Master, J. Nichols, K. Snow, A. Tomaino, R. Bittman, G. Hammerson,B. Heidel, L. Ramsay, <strong>and</strong> B. Young. 2009. NatureServe Conservation Status Assessments:Methodology for Assigning Ranks. NatureServe, Arlington, VA.Holt, C., Cass, A., Holtby, B., <strong>and</strong> Riddell, B. 2009. Indicators of status <strong>and</strong> benchmarksfor conservation units in Canada’s Wild Salmon Policy. DFO Can. Sci. Advis. Sec.Res. Doc. 2009/058. viii + 74 p.Peterman R.M., D. Marmorek, B. Beckman, M. Bradford, N. Mantua, B.E. Riddell, M.Scheuerell, M. Staley, K. Wieckowski, J.R. Winton, C.C. Wood. 2010. Synthesis ofevidence from a workshop on the decline of <strong>Fraser</strong> <strong>River</strong> <strong>sockeye</strong>. June 15-17, 2010. AReport to the Pacific Salmon Commission, Vancouver, B.C., 123 pp. + 35 pp. ofappendices.Pestal, G. <strong>and</strong> A. Cass. 2009. Using Qualitative Risk Evaluations to Prioritize ResourceAssessment Activities for <strong>Fraser</strong> <strong>River</strong> Sockeye. DFO Can. Sci. Advis. Sec.Res. Doc. 2009/071. 89 p.
Appendix A: List of Projects <strong>and</strong> InvestigatorsCohen Commission Science Contractors <strong>and</strong> ProjectsTopic Investigators AgencyClimate Change Scott Hinch, Eduardo Martins University of BritishColumbia (UBC)Cumulative Effects,Dave Marmorek, Darcy Pickard, ESSA Technologies, Ltd.Workshop Facilitation Alex Hall, Liz MartellDiseases <strong>and</strong> Parasites Michael Kent Oregon State UniversityFisheries Harvesting <strong>and</strong> Mike StaleyIAS LtdManagementFreshwater Ecology,CU StatusHabitat analysis, Lower <strong>Fraser</strong><strong>River</strong> <strong>and</strong> Strait of GeorgiaMarine EcologyKarl English, Bob BockingDave Marmorek, Marc Porter, MarcNelitz, Katherine Wieckowski, AlexHall, Katy Bryan, Eric Parkinson(independent), Carl Schwarz (SFU)Mark JohannesSkip McKinnellHoward Freedl<strong>and</strong>Enrique CurchitserMasahide KaeriyamaMike LaPointeKees GrootUW High Seas ProgramAndrew Trites – MammalsVilly Christensen-Fish & BirdsLGLESSA Technologies, Ltd.Golder AssociatesNorth Pacific MarineScience Organization(PICES)PredatorsUniversity of BritishColumbia (UBC)Production Dynamics R<strong>and</strong>all Peterman, Brigitte Dorner Simon <strong>Fraser</strong> UniversityStatus of DFO Science <strong>and</strong>ManagementEdwin BlewettBert IonsonMike Staley(SFU)CounterpointWater Pollution Don MacDonald MacDonaldEnvironmental Sciences,Ltd.
Appendix B: Workshop AgendaTechnical <strong>and</strong> Scientific Research Projects’ WorkshopMorris J. Wosk Centre for Dialogue, Room 320580 West Hastings Street, Vancouver, BCNovember 30 – December 1, 2010Workshop Objectives1. Underst<strong>and</strong>ing the pattern of changes in <strong>Fraser</strong> <strong>sockeye</strong> (<strong>and</strong> other stocks) that we seek toexplain2. Communicate scientific findings among Cohen Commission researchers3. Identify linkages among Cohen Commission research projects4. Explore <strong>and</strong> evaluate the relative merits of the identified possible causes for the decline in<strong>Fraser</strong> <strong>River</strong> <strong>sockeye</strong> stocks5. Explore potential interactions among possible causes6. Identify critical knowledge gaps <strong>and</strong> recommendations for research <strong>and</strong> monitoring7. Integrate scientific findings to dateParticipant RolesESSA: Organize <strong>and</strong> facilitate workshop; synthesize workshop findings.Scientific Contractors: Present technical <strong>and</strong> scientific findings within each respective researchproject to the collective group of researchers <strong>and</strong> peer reviewers. Apply knowledge of <strong>Fraser</strong><strong>River</strong> <strong>sockeye</strong>, ecosystem processes, <strong>and</strong> other factors affecting survival of <strong>salmon</strong> that mayhave contributed to the observed decline; <strong>synthesis</strong>e information for each possible cause <strong>and</strong>systematically evaluate its relative plausibility <strong>and</strong> reasons therefore; <strong>and</strong> identify informationgaps. Provide constructive feedback on the findings of other research projects. Apply knowledgeto integrative discussions of linkages <strong>and</strong> interactions among all projects.
Peer Reviewers: Provide constructive feedback on the findings of research projects, based onknowledge of <strong>Fraser</strong> <strong>River</strong> <strong>sockeye</strong>, ecosystem processes <strong>and</strong> other factors affecting survival of<strong>salmon</strong> that may have contributed to the observed decline. Suggest linkages <strong>and</strong> interactionsamong research projects.Cohen Commission Science Staff: Listen to presentations <strong>and</strong> ask clarification questions.Provide updates on recent progress of the Commission.Cohen Commission Participants: Not in attendance.Public: Not in attendance.
Workshop AgendaNovember 30 th , 2010 (Day 1)8:00 am Workshop start [coffee <strong>and</strong> pastries provided]Welcome <strong>and</strong> Overview[1.5 hours]8:15 am Introduction of participants; review of workshop objectives, agenda, principles,code of conduct, roles, <strong>and</strong> task processes. [David Marmorek; 30 min]8:45 am Cohen Commission welcome <strong>and</strong> introduction [David Levy; 15 min] Welcome from Cohen Commission Science Staff Update on Cohen Commission progress9:00 am Challenges <strong>and</strong> Opportunities [David Marmorek; 30 min] building on past work (e.g. PSC Panel) key ideas <strong>and</strong> questions <strong>cumulative</strong> effects conceptsCohen Commission Science Research Program Presentations9:30 am Productivity Dynamics [20 min presentation, 20 min discussion]R<strong>and</strong>all Peterman, Brigitte Dorner10:15 am Break [15 minutes]10:30 am Conservation Unit Status [15 min presentation, 15 min discussion]ESSA Technologies11:00 am Fisheries [20 min presentation, 20 min discussion]LGL11:45 pm DFO Science & Management [20 min presentation, 20 min discussion]Counterpoint12:30 pm Lunch [1 hour] – lunch provided1:30 pm Diseases <strong>and</strong> Parasites [20 min presentation, 20 min discussion]Michael Kent2:15 pm Contaminants [20 min presentation, 20 min discussion]22
MacDonald Environmental Sciences Ltd.3:00 pm Break [15 minutes]3:15 pm Freshwater Factors [20 min presentation, 20 min discussion]ESSA Technologies4:00 pm Marine Ecology [20 min presentation, 20 min discussion]PICES4:45 pm Wrap-up [15 minutes]5:00 pm End of Day 1December 1 st , 2010 (Day 2)8:00 am Workshop start [coffee <strong>and</strong> pastries provided]8:15 am Introductory remarks <strong>and</strong> plan for Day 2 [David Marmorek; 15 min]8:30 am Predators [2 x 20 min presentation, 20 min discussion]Mammal predation – Andrew TritesFish predation – Villy Christensen9:30 am Lower <strong>Fraser</strong> Habitat Analysis [20 min presentation, 20 min discussion]Mark Johannes10:15 am Break [15 minutes]10:30 am Climate Change [2 x 20 min presentation, 20 min discussion]En route mortality – Scott HinchClimate Change – Eduardo Martins11:30 am Cumulative Effects [1 hour]• Examples of intended analyses Qualitative Quantitative (including looking at <strong>data</strong> template)• Exploring conceptual models Interactive/collaborative discussion12:30 pm Lunch [1 hour] – lunch provided1:30 pm Integrative Workshop Task [1.5 hours]Relative Likelihood of Alternative HypothesesIndividual review of relevant PSC outputs & subgroup discussion23
3:00 pm Break [15 minutes]• Examine relevant parts of PSC report (Peterman et al. 2010)) as astraw starting point [20 min] Probability of, or relative likelihood of, alternative hypotheses Table E-1• Discuss in 2-3 inter-disciplinary sub-groups [40 min] Compare PSC conclusions to participants’ own research Agreement/disagreement? Missing lines of evidence? Are there any concerns based on what you know so far?• Report back to group in plenary [30 min]3:15 pm Integrative Workshop Task [1.5 hours]Research <strong>and</strong> Monitoring RecommendationsIndividual review of relevant PSC outputs & plenary discussion• Examine relevant parts of PSC Report (Peterman et al. 2010) as astraw starting point [20 min] Priorities for Monitoring <strong>and</strong> Research Table E-3• Discuss in plenary [70 min] Go through recommendations by life-history stage Consider workshop presentationsAgreement/disagreement with PSC recommendations?Additional items needed? If so, what management decisionswould they inform?4:45 pm Wrap-up <strong>and</strong> closing remarks [15 minutes]5:00 pm End of Day 224
Appendix C: Workshop MinutesContentsWelcome <strong>and</strong> overview ..................................................................................................................25Cohen Commission welcome <strong>and</strong> introduction .............................................................................26Challenges <strong>and</strong> Opportunities ........................................................................................................28Research program presentations ....................................................................................................28Introductory remarks, plan for Day 2 ............................................................................................53Research program presentations (continued) .................................................................................54Integrative workshop tasks ............................................................................................................68PSC report on relative likelihood of hypotheses .......................................................................68Recommended monitoring <strong>and</strong> research priorities: ...................................................................68Closing comments ..........................................................................................................................71List of Participants .........................................................................................................................72Summary of action items ...............................................................................................................72Welcome <strong>and</strong> overviewDave Marmorek, ESSAFollowing introductions, Marmorek reviewed the workshop objectives, which includedunderst<strong>and</strong>ing patterns of change in <strong>Fraser</strong> <strong>sockeye</strong> populations, communicating researchfindings <strong>and</strong> identifying linkages among projects. Participants would also be asked to weigh theevidence presented to assess the relative likelihood of different factors causing the declines in<strong>Fraser</strong> <strong>sockeye</strong>. The Day 2 exercises would look at potential interactions between factors,identify critical knowledge gaps (especially those relevant to management) <strong>and</strong> integrate thescientific findings so far.Marmorek reviewed the agenda, noting that after some initial overview presentations, presenterswould take turns reporting on their findings to date, with a discussion of <strong>cumulative</strong> effects tofollow. Participants would be asked to assess the relative likelihood of various hypotheses, toevaluate the conclusions of the PSC panel on the relative likelihood of various factors <strong>and</strong> tocomment on priorities for further research <strong>and</strong> monitoring.The roles of different participants – scientific contractors, peer reviewers <strong>and</strong> CohenCommission staff were outlined. Public participants would be invited to the second scienceworkshop in February, so it would be important for those discussions to be framed in more userfriendlylanguage.25
Cohen Commission welcome <strong>and</strong> introductionDave Levy, Cohen CommissionLevy welcomed researchers, stressing the importance of this workshop, which brings theresearchers together to address the causes of the decline in <strong>Fraser</strong> <strong>sockeye</strong> <strong>and</strong> provide anoverview of scientific research activities to date.Explaining the Commission’s terms of reference, Levy noted it has 21 participants with st<strong>and</strong>ing,each of which is legally recognized as part of the commission <strong>and</strong> eligible for funding. This isthe largest number in Canadian history – many more applied initially for st<strong>and</strong>ing <strong>and</strong> they wereencouraged to form groups. The Commission has been directed to conduct the enquiry withoutfinding fault. This includes investigating policies <strong>and</strong> practices at DFO, which has disclosed over300,000 documents to date. The Commissioner has been directed to make findings of fact, basedon scientific <strong>and</strong> legal evidence, <strong>and</strong> to develop recommendations.The Commission’s interim report, which is now out, reviewed 20 past reviews <strong>and</strong> over 700recommendations that arose from them, although it is clear that very few of the pastrecommendations were ever implemented. Commissioner Cohen’s objective is to make this thelast <strong>Fraser</strong> <strong>sockeye</strong> enquiry. In addition to the formal hearings now underway, the Commissionhas hosted public forums <strong>and</strong> conducted site visits along <strong>Fraser</strong> <strong>sockeye</strong> migratory routes, withvisits to communities such as Kamloops, Campbell <strong>River</strong>, Chilliwack, <strong>and</strong> Victoria to heardirectly from the public. The final report is due in 2011.The Commission’s science agenda has tried to build substantively on previous activities relatingto <strong>Fraser</strong> <strong>sockeye</strong>, such as the Simon <strong>Fraser</strong> University (SFU) / Pacific Fisheries ResourceConservation Council (PFRCC) Think Tank last December, the March 2010 SFU Speaking forthe Salmon forum <strong>and</strong> the Pacific Salmon Commission (PSC) workshop in June. The spectacular2010 return is also very much within the Commission’s area of interest as it relates to the issue ofvariability.Twelve science projects have been commissioned to address risk factors that may be affecting<strong>Fraser</strong> <strong>sockeye</strong> populations. The draft marine ecology report was provided to the Commission onNovember 15 but the report investigating the possible impact of <strong>salmon</strong> fish farms won’t startuntil early in 2011. Draft final reports for all other projects are due on December 15. Thisdeadline is strict as the Commission’s legal hearings depend on the science work being done intime. The peer reviewers, who will do their reviews from December 15 to January 15 3 , areparticipating in this workshop as equal participants. Final reports are due January 31, <strong>and</strong> will bedistributed via the official website.An exp<strong>and</strong>ed executive summary is required for each report to accelerate the federal Frenchtranslation requirements, permitting executive summaries to be posted on the website in advanceof the complete reports. The plan is to create a st<strong>and</strong>ardized technical report series that facilitatescitation, so the Commission will provide all contractors with the basic document template. Apublic science workshop is planned for February 23 – 25. That will cover four projects per day,allowing time for questions for clarification.This scientific work will be integrated with the formal Commission hearings process <strong>and</strong>researchers can expect to be called as witnesses by any of the Commission participants.3 Peer-review comments on the marine ecology paper were due by December 1.26
Levy urged researchers to bear in mind as they write their reports that the primary audience isCommissioner Cohen, followed by the 21 participants <strong>and</strong> then the general scientific audience.Each project will have three reviews, to be completed by January 15. Reviewer comments willbe added as appendices, <strong>and</strong> report authors can add their own further comments if they disagree.Levy provided a table listing the reviewers <strong>and</strong> their assignments. Every effort was made to lineup reviewers’ expertise with the content of assigned projects. In some cases the content is outsidethe primary experience of the reviewer, though this does offer the benefit of a fresh eye.Confidentiality is important. Many of the scientists have already generated important newfindings. The Commission has a carefully-planned process for releasing all the findings publiclyin February, so no findings should be released until then. If there are leaks <strong>and</strong> scientists arecontacted for comment by the media, they should refer all such requests to the Commission’sCommunications Director, Carla ShoreDiscussionShore: Reiterated the importance of confidentiality requirements, noting that she was alsoavailable to provide advice <strong>and</strong> media coaching around the planned February release.Peterman: Several of us will be at the SFU Think Tank on Friday.Shore: Until the reports are published, scientists are not at liberty to discuss their research for theCohen Commission.McKinnell: There was extensive review of my report within my organization, so it has beenviewed by multiple reviewers from many countries.Shore: There may be leaks <strong>and</strong> we will deal with those, but researchers are not in a position tocomment until the work is published. What you underst<strong>and</strong> from your research <strong>and</strong> itsbroader implications will be different from how it will be publicly perceived, so we want tomake sure it’s all put out in the proper context.Levy: We will encourage you to discuss your work publicly, but only after all the reports arewritten <strong>and</strong> properly reviewed.Q/A: Reviewer comments on the draft reports will be included as appendices.Marmorek: What if the reports are changed or the authors disagree?Levy: A response can be added noting changes <strong>and</strong> where the authors reject the reviewers’findings.Discussion: Should you list each comment <strong>and</strong> response individually or as summaries?ACTION: Levy to advise whether reviewer comments <strong>and</strong> responses should be reportedindividually or as summary reviews <strong>and</strong> summary responses.Levy: The intent of this workshop is to get everyone on the same page, to develop the <strong>cumulative</strong>effects analysis <strong>and</strong> to expose reviewers to the other research underway. Proceedings will beprovided by December 15.ACTION: Scientific contractors requested to keep Excel <strong>and</strong> Access files h<strong>and</strong>y to facilitatetranslation of all figures in their reports (tables should be okay).27
Challenges <strong>and</strong> OpportunitiesDave Marmorek, ESSAIt’s useful to think of all the science contractors as one science panel probing the evidence. Thiswork seeks to build on the most recent PSC report, regarding the evidence for <strong>and</strong> againstdifferent factors. Contractors should build on that report, but not be constrained by it. If those ofyou who attended the PSC workshop reached different conclusions (say you found betterindicators), provide evidence for changing your conclusions. Underst<strong>and</strong> the pattern <strong>and</strong> thenseek the causes. Look at patterns over space <strong>and</strong> time <strong>and</strong> between stocks to say which suspectsor combination of suspects are most likely.The <strong>cumulative</strong> effects project, which will be discussed further on Day 2, is looking at therelative importance of different factors <strong>and</strong> which are most relevant, <strong>and</strong> also at combined effectsor causal mechanisms that may be inter-related (e.g. various <strong>impacts</strong> stemming from climatechange).If the workshop produces a long list of priorities, that is not useful. Think about what decisionsare affected by the information (e.g. If I knew X what would I do differently) <strong>and</strong> whether thereis a role for real management experiments <strong>and</strong> if so on what scale.There are different forms of indirect evidence that we can think about. Even if there is imperfectevidence, can we still see contrast across different stocks or across time or space?Research program presentationsProductivity dynamics of <strong>sockeye</strong> <strong>salmon</strong>: patterns that need to beexplainedR<strong>and</strong>all Peterman & Brigitte DornerThis presentation covered <strong>data</strong> <strong>and</strong> methods, spatial <strong>and</strong> temporal patterns in productivity for<strong>Fraser</strong> <strong>and</strong> non-<strong>Fraser</strong> <strong>sockeye</strong> stocks, stocks with similar patterns, <strong>and</strong> conclusions <strong>and</strong> anemergent hypothesis.Background: The disastrous 2009 <strong>Fraser</strong> <strong>sockeye</strong> return (1.5 million adults, the lowest since1947) was just the latest in a decades-long decline in abundance <strong>and</strong> productivity (returningadults per spawner) for <strong>Fraser</strong> <strong>sockeye</strong>. The <strong>Fraser</strong> saw peak runs of up to 40 million <strong>sockeye</strong>every fourth year until the 1913 Hells Gate slide. Following that event, decades of slowrebuilding continued through the 1980s <strong>and</strong> then changed to a decline. The 4-year movingaverage for adult returns per spawner hovered around 5 or 6 adult returns per spawner from thelate 1960s until the early 1990s, then declined steadily to less than 1 in 2009, before returning toabout 6 in 2010. (This was the overall pattern across all <strong>Fraser</strong> <strong>sockeye</strong> stocks – trends differedamong individual stocks.)The study looked at 52 <strong>sockeye</strong> stocks with decent time series of spawners <strong>and</strong> the resultingadult recruits, covering an area extending from Lake Washington in Seattle to Alaska (19 ofthese stocks were from the <strong>Fraser</strong> <strong>River</strong>). It looked at st<strong>and</strong>ard productivity indices (recruits perspawner; plus for the <strong>Fraser</strong> only, there were <strong>data</strong> for effective female spawners, which is a bettermeasure). The stationary Ricker model (it assumes a <strong>and</strong> b are stationary) was used to calculateannual residuals. The Larkin model was included as an alternative to the Ricker model toinvestigate possible delayed-density dependence. Both the Ricker <strong>and</strong> Larkin models remove28
within-population, within-brood-year density-dependent effects to show what other variations(non-density-dependent effects) there are in survival rates. In addition, the Larkin model removeswithin-population density-dependent effects that occur among successive brood lines (across upto three successive brood years).We know the ocean environment is not stable <strong>and</strong> we’re interested in long-term signals, but thosesignals are clouded by observation error <strong>and</strong> natural variability, both of which are high-frequencypatterns compared to the long term trends. Kalman filter estimation, a st<strong>and</strong>ard method used inengineering to extract high-frequency noise from noisy <strong>data</strong>, was applied to the Ricker model toseparate the long-term, low-frequency signal from the noise.To test this method, the study built on previous work that simulated performance of parameterestimation procedures for both the st<strong>and</strong>ard Ricker model <strong>and</strong> the Kalman filter version of it. TheRicker model over-estimated productivity during low productivity periods (<strong>and</strong> under-estimatedproductivity when it was high), whereas the Kalman filter results provided a better fit with theactual <strong>data</strong>. In effect, this work showed that the Kalman filter was good at tracking changes inproductivity over time.The study applied the Kalman filter estimation method to both the Ricker <strong>and</strong> Larkin models,fitting a time-varying assumption for the a parameter (productivity) in both models. Examples of<strong>data</strong> processed with these various methods were then compared <strong>and</strong> the time trends inproductivity were much clearer when the high-frequency annual variability was removed.In addition to looking at trends for specific stocks, they looked for shared trends (or howindividual stock trends deviated from the overall trend). Early Stuart showed a long downwardtrend starting in the 1960s. Most of the individual Early Summer stocks showed downwardtrends. An exception is the Pitt <strong>River</strong> stock, which increased. Most <strong>Fraser</strong> Summers showed anupward trend until the early 1990s, followed by a downward trend. Harrison <strong>sockeye</strong> alsoshowed increasing productivity since the early 1980s. Quesnel showed a different pattern (littledecline since 1990). (The graphs all reflect st<strong>and</strong>ard deviation units so that the stocks could becompared).Lake Washington stocks showed a dramatic decrease in productivity starting in the late 1990s, apattern shared by Barkley <strong>sockeye</strong> stocks. Sampling has shown that juveniles of the LakeWashington stock migrate outside Vancouver Isl<strong>and</strong>, not through Johnstone Strait.Sockeye stocks from the BC Central Coast, the Skeena <strong>and</strong> the Nass all show similar decreasesin productivity from the late 1990s. Some of the declines started earlier (e.g. <strong>River</strong>s <strong>and</strong> SmithInlets), <strong>and</strong> some of them had a temporary increase in productivity prior to decreasing sharply inthe early 2000s.Further analysis of the <strong>Fraser</strong> <strong>sockeye</strong> trends showed that one principal component of the pattern(a long downward trend since the mid-1980s) accounts for 65% of the variation, while a secondcomponent (increasing trend in productivity until around 1990, then decreasing) explains 23%.Together these account for 88% of the changes over time, so they represent strong signals.These trends, as measured in st<strong>and</strong>ard deviation units <strong>and</strong> based on the smoothed Kalman filter,were also presented visually to demonstrate shifts in productivity over time for other BC,Washington <strong>and</strong> <strong>Fraser</strong> stocks. For the <strong>Fraser</strong>, this analysis showed declining productivity for allstocks since around 1990, except for the Harrison <strong>and</strong> Pitt river stocks, which showed increasingproductivity.29
Conclusion #1: Most other BC <strong>and</strong> Lake Washington <strong>sockeye</strong> stocks show a similar pattern ofdeclining productivity to that of most <strong>Fraser</strong> <strong>River</strong> <strong>sockeye</strong> stocks, especially since the late1990s.For 8 <strong>Fraser</strong> stocks that have juvenile <strong>data</strong> available, a similar analysis of spawner-to-juvenile<strong>and</strong> juvenile-to-recruit <strong>data</strong> showed very high correlation between juvenile-to-recruit <strong>and</strong>spawner-to-recruit trends, suggesting that most mortality associated with these productivity shiftsover the whole life span is occurring in the late juvenile to adult life phase (although it couldpossibly represent delayed mortality from a freshwater agent to which they were exposedearlier).An analysis of <strong>data</strong> for Tahltan age 1+ <strong>and</strong> age 2+ smolts compared survival rates for those thathave the same brood year but different ocean-entry year <strong>and</strong> found a correlation of r = 0.24. Butwhen <strong>data</strong> for smolts with the same ocean-entry year were compared instead, the correlationjumped to 0.56. The latter, higher correlation when juveniles have a shared ocean-entry year vs.the same brood year indicates that shared marine or late freshwater conditions dominate changesin productivity of these <strong>sockeye</strong> stocks.Conclusion #2: Most of the temporal changes in recruits/spawner arise in the marine <strong>and</strong> orfreshwater post-juvenile estimation stages. The Tahltan analysis indicates this is unlikely due todelayed mortality from a freshwater agent. Furthermore, the similarity of the productivity declinethroughout Washington <strong>and</strong> BC <strong>sockeye</strong> stocks, especially after around the year 2000, suggestspoor ocean conditions outside of Georgia Strait. This conclusion differs from the PSC workshopin June, because they have these new <strong>data</strong> now.Harrison <strong>sockeye</strong>, which have shown an opposite trend in productivity, enter the sea as fry (notsmolts) <strong>and</strong> are believed to migrate out through Juan de Fuca Strait, not Johnstone Strait.These results of a shared time trend in productivity of B.C. stocks, but the opposite trend forAlaskan stocks, would be consistent with a paper by Mueter et al. (2002, Can. J. Fish. AquaticSci. 59:456), which linked productivity declines in BC to increases in stock-specific locations forsummer sea surface temperature (SST) when juveniles enter the ocean. Specifically, changes inindividual <strong>sockeye</strong> stock productivity (log e (recruits per spawner)) per degree Centigrade increasein summer SST (SST coefficient) were graphed for stocks ranging from Washington <strong>and</strong> BCnorth to Alaska. The resulting graph showed a clear pattern of increasing productivity for Alaskastocks with increasing SST, <strong>and</strong> decreasing productivity for BC <strong>and</strong> Washington stocks withincreasing SST. Potential causes of this BC trend include a zooplankton-poor or predator-richenvironment when waters are relatively warm off the coast of BC.Brigitte DornerFurther analysis of <strong>sockeye</strong> productivity trends in relation to changes in summer sea surfacetemperature looked at the bigger picture coast-wide.Two types of animated graphs were shown. First was an animated map of the time-trend inindividual stock productivities for BC, with one map per year starting in 1950. During certainperiods, geographical clusters of <strong>Fraser</strong> <strong>River</strong> stocks (based on their spawning-ground location)appeared to change in similar ways. The other animated diagram showed stock-specificproductivities since 1950 (as derived from the Kalman filter analyses), illustrating in yet anotherway that when productivity for <strong>Fraser</strong> <strong>River</strong> <strong>and</strong> Washington stocks were generally declining,those in Bristol Bay were increasing over the same period.30
To address potential skepticism over the Kalman filter <strong>and</strong> Ricker Larkin models, other <strong>data</strong>were also analyzed. Raw <strong>data</strong> for log e (recruits per spawner) show the same pattern as Kalmanfilter analyses, with southern <strong>and</strong> <strong>Fraser</strong> <strong>sockeye</strong> stocks (except Pitt <strong>and</strong> Harrison) decreasingover time, <strong>and</strong> Alaska stocks increasing. The pattern for BC non-<strong>Fraser</strong> stocks was similar to thatfor the <strong>Fraser</strong>, but additional patterns at smaller geographical scales indicate there may also besome underlying freshwater patterns too.Conclusion #3: Alaskan productivity patterns are the opposite of those for the <strong>Fraser</strong> <strong>and</strong> othersouthern stocks. This is likely due to a shared large-scale driver within each region, possiblyrelating to climate.Overall Conclusions: There were three periods of extended decreases in productivity: Onestarting in the mid-1960s affected Early Stuart <strong>and</strong> Early Summer stocks like Bowron, Fennell,Nadina, Pitt, Seymour. A second from the late 1980s to around 1990 affected the Summers(Chilko, Late Stuart, Stellako), Birkenhead, <strong>and</strong> the Barkley Sound, Central Coast, Skeena <strong>and</strong>Nass stocks. A third period starting in the late 1990s affected most BC <strong>and</strong> Lake Washingtonstocks except the Harrison <strong>and</strong> Pitt stocks, which have been increasing. This has happened at thesame time as higher SST.The emergent hypothesis is that widespread shared trends since the 1990s <strong>and</strong> 2000s are likelydue to large-scale forcing in the ocean, plus possibly some shared forcing in freshwater but in thepost-juvenile estimation stage.DiscussionRoutledge: Regarding the high proportion of the change explained by the principal components –perhaps this is because it was smoothed <strong>data</strong>. If you used the raw <strong>data</strong>, would that be lower?Peterman: Yes.McKinnell: This relies on two different time series – one based on observations of spawners <strong>and</strong>one on observed returns. It’s not clear how the signal <strong>and</strong> noise relating to the observation ofspawners is captured in the model.Peterman: There is some overlap since recruits consist of spawners plus catch. To get totalreturns you have to use expansion factors. I’m not sure it would have a huge influencebut we are sensitive to the issue. Recruits per spawner show the same pattern but theKalman filter turned out to provide the best method for tracking it. This is not how natureworks – all models are wrong of course – but they are useful nonetheless.Cox: What is the error range around the estimates?Peterman: The trends are still prominent.Routledge: I underst<strong>and</strong> the concern but it’s an over-simplification. This is about smoothingthe rough points, not an issue of trying to capture true biological processes.Peterman: The raw <strong>data</strong> show a very similar pattern – with shared spatial variation – it’s allin the report’s appendices.Cox: Did you try instead letting b be free instead of maintaining a fixed b value?31
Peterman: That was done <strong>and</strong> it does not explain the variation in the <strong>data</strong> as well as the aparameter. You can’t estimate simultaneously both the a <strong>and</strong> b parameters in a Kalmanfilter version of either the Ricker or Larkin models.Staley: Did you consider the shift in estimating recruitment for <strong>Fraser</strong> <strong>sockeye</strong> since the mid-1990s? Prior to that, apparently there was no en-route loss. Since then, recruitment isestimated as catch plus the Mission escapement estimate. How did you deal with that shift inaccounting for the trends?Peterman: It would only be relevant if en-route losses were occurring at a rate that wouldthrow the trend off.Marmorek: If they hadn’t added the en-route losses back into the estimates of recruitment,the trend would have been worse before the mid-1990s.Q/A: The first record of pre-spawning (en-route?) mortality was the 1992 return year.Marmorek: Did you see any pattern consistent with the Pacific Decadal Oscillation?Peterman: We did not look at that.Routledge: It seems the important conclusion was that the problem is in the ocean. I’m inclinedto agree but I’m not sure how strong the evidence is. Tahltan was only one stock, whichmakes me uneasy.Peterman: There were others that were not shown due to limited time.Routledge: That eases my concern.Peterman: There are not a lot of stocks that line up such that it allows you to do that analysis.Reynolds: Was Dorner’s work indicating more of a leaning towards freshwater?Dorner: There are also some patterns in freshwater, just from looking at it spatially, but I’mnot saying there is not also the large-scale ocean pattern. The freshwater pattern variesacross watersheds, in some cases covering stocks that don’t have the same oceanmigration routes.Peterman: These are not inconsistent messages. There are certain years where the interior BC<strong>and</strong> far northwest stocks are all red together (decreasing productivity) for a few years.They share the geographical area but we don’t have all the <strong>data</strong>. Brigitte Dorner also didst<strong>and</strong>ard cluster analyses <strong>and</strong> you get different groupings of stocks, depending on whichclustering methods were used. Nothing produced a different picture than what you saw inthe animations.Cox: Harrison <strong>sockeye</strong> go out as fry. Do Pitt <strong>sockeye</strong> do the same?Johannes: They go out as smolts.Cox: Is there anything similar about their out-migration timing?Peterman: I unfortunately have no information on Pitt <strong>sockeye</strong>. There is some evidence forHarrison migration patterns, though. Beamish’s sampling studies found Harrisonjuveniles in northern Georgia Strait later in the season than other <strong>Fraser</strong> <strong>sockeye</strong>. Theyalso go to sea as fry rather than as smolts, <strong>and</strong> rear more in the <strong>Fraser</strong> <strong>River</strong> estuary32
instead of migrating directly out into the Strait, though we don’t know very much aboutthem.Pickard: When we do the <strong>cumulative</strong> effects project <strong>and</strong> we use your <strong>data</strong>, there is concern thatthe findings will be out of whack if we use Kalman filter <strong>data</strong> for when the <strong>impacts</strong> areactually happening.Peterman: You shouldn’t just use one <strong>data</strong> series; instead, examine different assumptions (i.e.use multiple dependent variables <strong>and</strong> compare results).Dorner: If the series changes slowly, probably the lag doesn’t matter as much.Staley: Re the little evidence for delayed density-dependent effects question, using cyclic vs. notcyclic models will make a significant difference – there will be a debate on this.Peterman: The difference in <strong>data</strong> from using Ricker vs. Larkin can be substantial (Larkindelayed density dependent effect across brood years). The productivity parameter stayedhigh in recent years for Quesnel with Larkin, but with Ricker it went down. We foundthere was quite a difference between the models, but in this analysis it was only importantfor Quesnel. Larkin seems better for Quesnel only. Carl Walters appears to have backedoff on his previous conclusions about the prevalence of the advantage of the Larkin overthe Ricker model <strong>and</strong> he agrees that Quesnel is about the only stock where delayeddensity dependence makes a difference. We have to do sensitivity analysis for everythingwe do because we don’t know what the true underlying dynamics are. So we use raw <strong>and</strong>processed <strong>data</strong> <strong>and</strong> if they are different, we examine why.Conservation Unit Status AssessmentKatherine Wieckowski, ESSAThis analysis reviewed several methods for assessing conservation status, using the 36 <strong>Fraser</strong><strong>sockeye</strong> Conservation Units (CUs) proposed by Holtby et al (DFO is still considering reducingthese.)The approaches reviewed included the DFO paper on indicators of status <strong>and</strong> benchmarks forCUs. This was developed by Carrie Holt et al, <strong>and</strong> elements of it are included in the paper by SueGrant. The second approach was Pestal <strong>and</strong> Cass’s paper on the use of qualitative riskevaluations to prioritize assessment activities for <strong>Fraser</strong> <strong>sockeye</strong>. The third approach was themore generic NatureServe paper by Feber-Langendoen et al, which was eliminated as notviable/ideal.Recognizing that all methods have strengths <strong>and</strong> weaknesses, four evaluation criteria were usedfor the analysis: ecological relevance (to life history, habitat usage, etc.; the method for settingbenchmarks; the <strong>data</strong> needs for that method <strong>and</strong> how available is the <strong>data</strong> required for all CUs;<strong>and</strong> feasibility of implementation (how realistic is it for DFO to implement).Ecological relevance: Holt et al <strong>and</strong> Pestal/Cass both address abundance, trends in spawners,distribution <strong>and</strong> fishing mortality. Holt does not address genetic diversity, only life historydiversity. This raises the question of indirect methods <strong>and</strong> whether it is okay to have proxyindicators, <strong>and</strong> with limited resources, this should be considered. Pestal included habitatcondition but didn’t specify what the habitat condition indicator was. Holt did not addresshabitat, which is covered under Strategy 2 of the WSP.33
Data needs, uncertainty <strong>and</strong> availability: The availability of <strong>data</strong> required for Holt et al <strong>and</strong>Pestal/Cass was summarized in a table, which indicated more gaps for the former approach. Bothapproaches make noteworthy attempts to account for uncertainty.Benchmark setting: Holt takes into account uncertainty in the <strong>data</strong> in setting benchmarks. Theadvantages include that the benchmark is more reflective of that CU <strong>and</strong> takes into accountuncertainty. But you need a lot more <strong>data</strong> to develop these benchmarks vs. Pestal/Cass, whichtakes a more qualitative approach to develop benchmarks. Both have clear consistent rules toavoid comparing apples <strong>and</strong> oranges, so both are defensible. The Holt et al approach didn’t reachconsensus on metrics to use for distribution <strong>and</strong> also presented several possible benchmarks forfishing mortality.Feasibility: Holt is very technical, so it requires a lot of effort to roll out in order to determinestatus, raising the question of whether it is reasonable to expect DFO to implement a method thatis so rigorous <strong>and</strong> <strong>data</strong> intensive across all CUs, given limited resources, <strong>data</strong> <strong>and</strong> funding. Grantet al applied a modified version, using only abundance <strong>and</strong> trends in abundance, <strong>and</strong> weren’t ableto determine status for 15 CUs. Pestal/Cass applied their method to all CUs <strong>and</strong> were unable toassess 11 CUs, as they had a broader array of indicators <strong>and</strong> could thus better deal with the onesthat are <strong>data</strong>-poor.Considerations moving forward include ease of dissemination <strong>and</strong> transparency, as there needs tobe trust that CU status has credence. Other issues include <strong>data</strong> gaps, resources for monitoring <strong>and</strong>analysis <strong>and</strong> indicator roll-up (weighting).Pestal <strong>and</strong> Cass plotted out an assessment that combined status <strong>and</strong> uncertainty for each CU.Status for the 36 CUs was also mapped geographically.Habitat status:Population status is a function of survival, which is a function of habitat condition. Habitatcondition in turn relies on a number of freshwater factors. One thing that has not been fullydeveloped is how to assess habitat <strong>and</strong> incorporate the results in an assessment of stock status.L<strong>and</strong>scape-level indicators were used to assess the quality <strong>and</strong> quantity of migratory, spawning<strong>and</strong> rearing habitats. These indicators are based on mapped habitat features extracted or derivedfrom provincial GIS <strong>data</strong> sets <strong>and</strong> DFO lake productivity estimates.Migratory habitat: Factors examined included CU migration route/distance, thermal profile ofadult migration routes <strong>and</strong> historical spring air temperatures at nursery lakes.Spawning habitat: Factors included the extent of <strong>sockeye</strong> spawning reaches for each CU,whether it was lake outlet (buffered) or tributary/inlet, <strong>and</strong> the ratio of each spawning categoryrelative to total spawning extent in the CU.Rearing habitat: Factors included combined surface area of nursey lakes for each CU <strong>and</strong>average juvenile productivity in smolts per hectare.The results for each type of habitat for each CU were presented in a dashboard summary thatshows how results for the CU line up with all other <strong>Fraser</strong> <strong>sockeye</strong> CUs. Three indicators weretaken from each of the three categories (migration distance, ratio of lake buffered spawning <strong>and</strong>lake area). Instead of trying to roll them up into one composite index, the approach was to try toshow where a CU lay with respect to all three dimensions. Migration distance was stronglycorrelated with air temperature with both upstream <strong>and</strong> downstream migrations, so was34
considered a good surrogate of temperature issues. Nursery lake area strongly correlated withtotal juvenile production.The idea was to see if it was possible to link those CUs that were doing well with a habitat index.However, the results showed no consistent pattern in how the CUs were doing from aconservation perspective <strong>and</strong> how they were doing from a habitat perspective.DiscussionPeterman: Were the terms of reference for this project to assess the status of <strong>Fraser</strong> stocks?Wieckowski: Initially, but it was not possible to do that in the permitted time frame, so wereviewed others’ assessments. The Grant paper was just out, so we looked at whether weagreed with their assessment. From a preliminary walk-through, Grant agrees fairly well withPestal.Routledge: Nothing st<strong>and</strong>s out in terms of mistakes in conservation status?Wieckowski: One of the things in benchmark setting is to decide whether it is conservation- ormanagement-oriented, <strong>and</strong> then to consider how to weight the criteria accordingly. If you’redoing precautionary management, the trend in abundance would be weighted more heavilythan simple abundance because you don’t have full time series (i.e. the <strong>data</strong> peak may not bethe real historical peak). DFO is still deliberating over benchmarks <strong>and</strong> metrics, so it’s hardto say. The method is very scientifically robust, but they haven’t rolled it out completely, soit’s hard to say right now where they’re at.Hinch: The habitat indicators suggest the stocks with shorter migration routes should be doingwell, but that’s not happening – <strong>and</strong> many are in fact doing worse. It’s not so much distancebut migration timing that seems to be important.Wieckowski: Yes, we can look at that, though I’m not sure how available those <strong>data</strong> are.McKinnell: Why is Chilko experiencing such high lake productivity?Peterman: It’s been suggested that this is linked to changes in the lake due to lower outflows ofglacial till into the lake, thereby clearing it up <strong>and</strong> allowing more light in for primaryproductivity.Staley: I have trouble seeing the relevance of these indicators, since you can’t move a lake, forexample. The Grant paper…? set up abundance trends, fishing mortality <strong>and</strong> distribution.?…ruling out where the stocks have no <strong>data</strong>. The distribution one…? still alive, especially forthe bigger CUs.Wieckowski: I agree on the distribution question. The concern with Grant/Holt is what happenswhere there is no <strong>data</strong>. Pestal can come up with a better uncertainty score with less <strong>data</strong>, ifdistribution is important for assessing statusMartin: You could also look at fishing mortality as a surrogate productivity indicator over time.Fisheries & Fisheries Management (<strong>Fraser</strong> & Bristol Bay)Karl English, LGLTo assess whether or not the <strong>Fraser</strong> <strong>sockeye</strong> management framework was solid, a number offactors were examined, including catch monitoring, pre-season forecasting, in-season abundance35
estimates, escapement enumeration, escapement targets, over-harvesting <strong>and</strong> Cultus recoveryefforts. For Bristol Bay, pre-season <strong>and</strong> in-season forecasting, escapement <strong>and</strong> goals werereviewed.Key metrics: For each of the above elements, it was necessary to define what was meant byaccuracy (were estimates biased <strong>and</strong> were they based on modeling or known values), precision(what were the quantitative bounds) <strong>and</strong> reliability (level of confidence in estimates, quality <strong>and</strong>quantity of <strong>data</strong>).Quality of catch estimates: A table summarized the assessed accuracy, precision <strong>and</strong> reliabilityof catch estimates for all Canadian fisheries from 2001 to 2009, along with the relativeproportion of Canadian TAC (Total Allowable Catch) taken by each fishery. Many of the valuesfor precision were unknown. There was good accuracy for both First Nations fisheries. A closerlook at commercial fisheries showed inconsistent quality across gear types (e.g. sales slip in netfisheries not representing total catch).Pre-season forecasts: A summary of forecast error (mean absolute percent error) for the 19<strong>Fraser</strong> <strong>sockeye</strong> stocks from 1990 – 2009 showed similar error rates for most stocks except forthose in the Late Summer group, most of which were much higher. Error rates for each runtiminggroup <strong>and</strong> for total <strong>Fraser</strong> <strong>sockeye</strong> stocks (40%) were also provided.A second table summarizing the proportion of the return variation for each stock that wasexplained by forecasts from 1980 to 2009 (i.e. prediction ability of forecasts) showed significantdifferences between stocks. Forecasts for Late Shuswap (a strong cyclic stock) had the strongestpredictive relationship. The relationship was better for the run-timing groups <strong>and</strong> for the <strong>Fraser</strong>overall, but not so much for individual stocks.In-season run-size forecasts: Median percent error (accuracy - 1997-2009): In-season estimatesfor Early Stuart started high but correct rapidly by mid-July. (Does this allow enough time toplan the fishery?) For Early Summers, estimates have been under-estimating abundance early inthe season. By the time they correct, it is too late for a fishery. Summers start with a large overestimation<strong>and</strong> significant correction in late July to mid-August. There is lots of opportunity toharvest from there on. For lates, there was a lot more variability. Estimates start off close <strong>and</strong>then tend to go down.Measures of precision for the four run-timing groups, (median absolute percent error, 1997-2009) show that in-season forecasts can be off by 20 to 50% for most of the season, including thecritical period when the bulk of fishing must take place in marine areas. Reliability of in-seasonforecasts also improves for all run-timing groups towards the end of the season.Basis for recent escapement goals: Goals for <strong>Fraser</strong> <strong>sockeye</strong> low escapement benchmarks <strong>and</strong>fixed escapement targets are set by the FRSSI (<strong>Fraser</strong> Sockeye Spawning Initiative) model.Summaries were presented showing the four-year moving average escapement for each of thefour run-timing groups from 1960 to 2008, relative to the interim limit <strong>and</strong> target referencepoints for escapement. In recent years, only Early Stuart escapement has fallen below the limitreference point, although the Early Summers are getting close.Run size <strong>and</strong> exploitation rates: Comparison of run size <strong>and</strong> exploitation for each of the fourgroups show that over-harvesting may have been an issue in the 1960s, but not recently.36
Bristol Bay review: There are substantial differences between the <strong>Fraser</strong> <strong>and</strong> Bristol Bayfisheries. The latter has fewer fisheries, gear types <strong>and</strong> sectors, less mixed-stock fishing issues,very small sport <strong>and</strong> First Nations subsistence harvests <strong>and</strong> few in-river fisheries. Area managershave very timely <strong>and</strong> accurate <strong>data</strong> on catch <strong>and</strong> escapement, clearly-defined escapement goalsthat vary little between years <strong>and</strong> unambiguous authority to open <strong>and</strong> close fisheries.Their pre-season forecasts in some cases are not as good but they rely mostly on in-seasonmanagement. Their performance in meeting escapement targets has been pretty good in terms ofstaying above minimum escapement levels <strong>and</strong> usually in the range close to the upper target.Information/evidence gaps: These include uncertainties around en route losses. Given thepotential scale of the latter (greater than total escapement or total catch in some years), this isprobably much more of an issue than the amount that they are off with the estimates of catch <strong>and</strong>escapement, which are not perfectly monitored but pretty reliable estimates. The numbers for enroute losses are best guess based on very limited <strong>and</strong> questionable <strong>data</strong>.DiscussionStaley: Where the quality of <strong>data</strong> is unknown, it may be unknowable or simply unknown becauseno one has done the work. You should distinguish between the two.English: For commercial fisheries, there are aerial surveys <strong>and</strong> reported catch rates. You can getreasonable estimates of effort for some gear types <strong>and</strong> catch rates. There is no estimate ofprecision <strong>and</strong> no verification but a good proportion of the fleet is reporting. We could try toverify the <strong>data</strong> but the challenge is getting the information from FOS (DFO’s FisheriesInformation System) in time for this project.Staley: Re the pre-season forecasts, it’s surprising that the performance of the forecast for total<strong>Fraser</strong> <strong>sockeye</strong> run size is not significantly better than that for individual stocks.English: The median absolute percent error was lowest for the overall <strong>Fraser</strong> run.Peterman: The r-squared values in the bar graph “significance of forecast vs. return relationship”seem high.English: The <strong>data</strong> were from a document that shows pre-season <strong>and</strong> post-season numbers.Peterman: The pre-season <strong>data</strong> may actually be in-season estimates, so check that those areactually the pre-season forecast numbers because I’ve never seen a correlation that high forforecasting on the <strong>Fraser</strong>.That could also be that it’s based on <strong>data</strong> going back to the 1950s, not just the last 30 years.Cox: How are en route losses calculated?English: For some, it’s based on Mission counts against spawning ground counts minus catch.For some recent years, estimates are based on telemetry <strong>data</strong>.Cox: How does that figure in calculating recruits per spawner?English: Total returns are based on catch, escapement <strong>and</strong> en route mortality.McKinnell: Highly cyclic stocks have high r-squared because of the contrast between very high<strong>and</strong> very low years.37
English: That’s certainly the case for Shuswap. There is more detail in the report, whichdefinitely shows that Shuswap has the biggest error <strong>and</strong> the highest r-squared.McKinnell: Few or none of the pre-season forecast methods consider ocean conditions.English: They are based on stock recruit relationships, though there is some additionalconsideration. 2006 was a good example: the models suggested a good return for Quesnel butthere was concern over the small size of outgoing smolts <strong>and</strong> the return was indeed dismal.But basically one of several stock recruit models are used. Managers don’t pay muchattention to the forecasts – they rely on in-season estimates to manage fisheries.Marmorek: It’s important to think about how the information will be used: pre-season forecastsare used to modify expectations but in-season information is used to manage harvest.Status of DFO Management <strong>and</strong> ScienceEdwin Blewett, CounterpointThis presentation covers three projects that focused on the period from 1985 to 2009. The firstevaluated DFO management of <strong>Fraser</strong> <strong>sockeye</strong> against stated objectives; the second detailedscience <strong>and</strong> research expenditures on <strong>Fraser</strong> <strong>sockeye</strong> (not an evaluation); <strong>and</strong> the third assessedDFO’s ability to carry out applied <strong>sockeye</strong> research.1. Evaluate DFO management of <strong>Fraser</strong> <strong>sockeye</strong> against stated objectivesThis study evaluated management against stated objectives, with a focus on objectives relating tostock management. PSC objectives were interpreted as DFO objectives <strong>and</strong> expenditures of otherorganizations like NSERC were included but not evaluated.Method: The approach was to identify stated management objectives, define evaluationindicators <strong>and</strong> the <strong>data</strong> required to inform them, then submit information requests (those startedin July <strong>and</strong> significant <strong>data</strong> gaps remain, but we are proceeding with what we have). Furthersteps included organizing the <strong>data</strong>, evaluating it, interviewing key contacts (time will not likelyallow for this step) <strong>and</strong> writing up the results.DFO’s stated objectives were sourced from key agreements <strong>and</strong> policy documents, plus annual<strong>salmon</strong> IFMPs (Integrated Fisheries Management Plans), <strong>and</strong> grouped under nine headings:conservation, international, First Nations, stock management, fleet management, economic,allocation, process <strong>and</strong> programs. Not all objectives were included in the evaluation: the focuswas on retaining those objectives: most useful to the Commissioner, focused on stockmanagement, specific to <strong>Fraser</strong> <strong>sockeye</strong>, on “ends” vs. “means” objectives, on specific (vs.general) objectives <strong>and</strong> on the biggest <strong>impacts</strong> <strong>and</strong> effects.Information requirements: A contract was issued to an Ottawa consultancy, BMB DataConsulting Services, for the massive job of extracting <strong>Fraser</strong> <strong>sockeye</strong> expenditures from overallmanagement expenditures from 2005/06 – 2009/10 for these projects. The information availabledoesn’t include FTEs, but it does include salaries.2. <strong>Fraser</strong> <strong>sockeye</strong> science/ research expendituresThis study details but does not evaluate expenditures by DFO <strong>and</strong> other agencies on <strong>Fraser</strong><strong>sockeye</strong> science <strong>and</strong> research by program <strong>and</strong> activity, with much of the information derivedfrom the earlier-noted contract. The BMB <strong>data</strong> are for a much shorter period than ours. Noexpenditure <strong>data</strong> other than the BMB was available, however.38
Method: The approach included formulating information requests, categorizing expenditures byprogram <strong>and</strong> activity, assessing changes <strong>and</strong> trends over time <strong>and</strong> writing up the results.3. Assess DFO ability to carry out applied management <strong>and</strong> science/researchThis project sought to determine DFO’s ability to carry out applied <strong>sockeye</strong> science/research,given the financial <strong>and</strong> human resources allocated to the task. It is a forward-looking assessment,whereas the previous two were retrospective.Method: The intended approach included formulating information requests (there was very littleinformation on human resources) then defining the programs <strong>and</strong> activities required to manage<strong>Fraser</strong> <strong>sockeye</strong>, what resources were needed to do this well <strong>and</strong> to compare this to what DFOwas actually doing (gold st<strong>and</strong>ard approach). But it was decided that with the <strong>data</strong> available, itwas more realistic to take a “marginal” approach focused on identifying shortfalls or gaps <strong>and</strong>areas where programs <strong>and</strong> resources could or should be adjusted.Information requirements included human resources, salaries, <strong>Fraser</strong> <strong>sockeye</strong> science/researchactivities <strong>and</strong> budgets.Preliminary graphs were presented summarizing total annual <strong>Fraser</strong> <strong>sockeye</strong> expenditures from2005 to 2009 by organization <strong>and</strong> by activity (managements science, habitat, enhancement <strong>and</strong>administration).Preliminary results were presented for several of the performance indicators, including actualescapement relative to the final in-season target for the four run-timing groups, a comparison ofUS target vs. actual harvest share, total science spending as a percentage of total spending for theRegion (some decline in recent years), <strong>Fraser</strong> <strong>sockeye</strong> science as a percentage of total scienceexpenditures, <strong>and</strong> total expenditures on <strong>Fraser</strong> <strong>sockeye</strong> as a percentage of total Regionexpenditure.Information gaps include gaps in evaluation <strong>data</strong> (e.g. post-season spawning escapementtargets); expenditures prior to 2005 <strong>and</strong> very little information available in electronic format orupdated <strong>data</strong>bases.Key research/ monitoring needs: If evaluation is valuable, a good evaluation framework isrequired that covers criteria, indicators <strong>and</strong> what <strong>data</strong> need to be collected to inform evaluation.A single, regularly-updated evaluation <strong>data</strong>base is needed.DiscussionMcKinnell: Did you consider looking at the number of primary publications by DFO authors?You will likely find that the amount of science done as a proportion of the actual work theydo has been shrinking over time. It would be useful to see a graph on the number ofpublished articles on <strong>Fraser</strong> <strong>sockeye</strong> where DFO scientists were the senior authors.Peterman: One of our recommendations was that all agencies, including DFO, the PSC, Alaska,<strong>and</strong> Washington State, need to get all their <strong>data</strong> together in one <strong>data</strong>base, st<strong>and</strong>ardized (e.g.column headings). There were many errors in the <strong>data</strong> <strong>and</strong> because there are large-scaleprocesses involved, we need to get the information in cross-jurisdictional <strong>data</strong>bases.Blewett: These questions require ongoing evaluation, not one-off studies.39
Christensen: We keep hearing about over-escapement <strong>and</strong> that stocks are doing well when thereis lower escapement. What are the economic consequences of over-escapement is areasonable question to askBlewett: We would need to do that analysis: in years when there is very high escapement <strong>and</strong>foregone harvests, is that as serious as not meeting escapement targets.Hinch: How do you get NSERC information specific to <strong>Fraser</strong> <strong>sockeye</strong>?Blewett: We asked NSERC but have not received an answer.Hinch: Other groups are picking up the ball that DFO is dropping, with significant costs foruniversity research. How do you bring that into the picture?Routledge: Maybe instead of looking at costs or just tracking published DFO papers, you canalso compare that to how many other papers are published.Peterman: What is the purpose of this part of the assessment? Collectively we aren’t spendingenough on <strong>Fraser</strong> <strong>sockeye</strong> – is that the purpose?Blewett: In part. It’s to describe the state of science <strong>and</strong> research – is there enough of it.Peterman: You also need to ask the managers. It’s one thing to do a lot of research <strong>and</strong> another tosee if it’s informing management. The number of studies won’t measure the latter. We needthat input as well or it’s missing the point.Blewett: The evaluation is focused on management, not science. The third project gets atresearch capacity.Peterman: That’s a different question than what is needed to make management decisions. Thebenefits of that research can’t be measured by dollars spent.Blewett: That’s a massive piece of work.Staley: The bulk of expenditures are on management (e.g. spawning ground enumerations). Mostare directly management-related.English: Our report may help a bit. We will document what information there is to supportescapement monitoring, in-season abundance estimates <strong>and</strong> catch monitoring. You will seeclearly that the amount of documentation supporting each of these components is strikinglylittle. Most recent effort has been focused on defining the CUs <strong>and</strong> now the benchmarks. Theother piece done regularly is the pre-season forecast. Outside of that there are not manydocuments that describe other efforts. The PSC is now drafting a document that describes thein-season assessment systems. The fact that was not documented before is a concern.Marmorek: Given the difference in performance for Bristol Bay, it would be interesting to lookat how much they spend on science as a reference point.Wieckowski: Beyond how much is spent in the US, there is a structural difference regarding USmanagers <strong>and</strong> their powers, so just looking at spending doesn’t do it justice.Blewett: We are looking at the East Coast <strong>and</strong> what is comparable.Cox: The Columbia <strong>River</strong> would be comparableMcKinnell: The difference between Canadian <strong>and</strong> US research expenditure is in orders ofmagnitude.40
Staley: Our project needs to compare expenditures in the Canadian context.Routledge: A concern about a focus on science that informs managers in terms of short-termdecisions is that you lose the ability to do fundamental science that provides important longterminsights that filter down to the management level. It should not be too short-sighted.Peterman: You can focus on what is relevant to management but look at what this means overthe long termPeterman: The important issue is how this informs Cohen’s decisions. Bristol Bay stocks have amuch stronger pattern over time, so they are easier to forecast <strong>and</strong> manage from this <strong>and</strong>other respects logistically. So we need to be really careful to not compare apples <strong>and</strong> oranges.English: Our report will highlight how different they are <strong>and</strong> how complex the <strong>Fraser</strong> is in termsof the people involved. Alaska managers have full control <strong>and</strong> simple targets. They spend atiny fraction of the value of the fishery on management <strong>and</strong> the environmental, socialeconomic <strong>and</strong> other issues are all very different.Diseases & parasitesMichael Kent, Oregon State UniversityThe task was to report on infectious diseases in general <strong>and</strong> those affecting <strong>Fraser</strong> <strong>sockeye</strong> inparticular <strong>and</strong> assessing the role of infectious diseases in mortality, especially in wild fish.The approach included a review of peer-reviewed literature, government documents <strong>and</strong> PBScase reports <strong>and</strong> interviews with DFO fish health specialists.The study reviewed each pathogen by taxonomic units, including arbitrary (low, medium, high)potential risk assessment for each. It is rare to have a quantitative risk assessment, so it’s a verysubjective approach. Much of the report consists of a summary for each pathogen, plus the riskassessment. It also includes a review of approaches used to document pathogen-associatedmortality in wild fish, a review of environmental associations with these pathogens, conclusions<strong>and</strong> recommendationsKey metrics: These include whether the pathogen is virulent to Pacific <strong>salmon</strong> <strong>and</strong> to <strong>sockeye</strong> inparticular; occurrence <strong>and</strong> prevalence in wild <strong>salmon</strong> <strong>and</strong> in the <strong>Fraser</strong>; how was this determined(literature reviews <strong>and</strong> interviews); <strong>and</strong> how these metrics are connected to biologically-justifiedhypotheses.The list of pathogens includes a number of viruses, bacteria, fungi, protozoa, myxozoa, worms<strong>and</strong> arthropods. Documented or suspected freshwater outbreaks include IHN virus in fry. In theocean, Parvicapsula is worth looking at (about 15 years ago, there was a report documentingmortality in Barkley Sound pre-spawners – returning fish were trapped <strong>and</strong> suffered heavyinfection) <strong>and</strong> sea lice (Barkley Sound prespawners). There are very few documented reports ofmortality specifically caused by parasites or other pathogens in BC, except when you look at prespawningmortality. Work in Oregon on returning fish shows a long list of pathogens associatedwith pre-spawning mortality, with losses of over 50% in some cases.High risk diseases: There are few pathogens documented or suspected of killing <strong>Fraser</strong> <strong>sockeye</strong>(ones that are recognized as killing <strong>sockeye</strong> <strong>and</strong> suspected of occurring in the <strong>Fraser</strong>). Theseinclude IHN (freshwater virus); Bacterial kidney disease (freshwater <strong>and</strong> ocean), Furunculosis(freshwater <strong>and</strong> ocean) <strong>and</strong> Vibriosis (marine). There is very little <strong>data</strong> on how the latter <strong>impacts</strong>41
wild <strong>salmon</strong>ids, but it is highly lethal for farm <strong>salmon</strong> if they are not vaccinated. Parasitesinclude Parvicapsula (freshwater, marine), Ich (freshwater), PKX (found previously in kokanee;freshwater <strong>and</strong> marine) <strong>and</strong> sea lice. Not a lot of effort was devoted to sea lice because it isexpected to be dealt with in-depth in the fish farm paper. It is very controversial there is noinformation specific to <strong>sockeye</strong> <strong>salmon</strong>.Assessing <strong>impacts</strong> of chronic infections (e.g. parasites): Criteria for investigations includehaving adequate <strong>data</strong> on prevalence <strong>and</strong> abundance; infections that are easy to identify <strong>and</strong>evaluate <strong>and</strong> which persist; <strong>and</strong> temporal studies, which can be difficult to do with <strong>salmon</strong>ids,since you need to look at what is happening over time.Parasite distribution issues include abundance vs. prevalence. Normal is not normal for parasites(negative binomial distribution) <strong>and</strong> having many animals with no or light infections, but fewwith heavy infections. A 1971 Crofton paper compares predicted <strong>and</strong> observed frequency of theparasite, based on <strong>data</strong> from lightly-infected animals, to provide parasite-associated mortality.Impacts of highly-virulent pathogens: Virulence is documented in lab studies <strong>and</strong> prevalenceneeds to be considered at various life stages. Environmental influences include temperature(most pathogens increase with temperature, as do hosts vectors, while temperature influences theimmune status of fish). Pollution <strong>and</strong> contaminants may also play a role. Organic eutrophicationcan increase intermediate hosts <strong>and</strong> opportunistic fungi <strong>and</strong> bacteria. Toxicants can impair fishimmune systems but may also kill invertebrate hosts. L<strong>and</strong> use practices are a key consideration,as temperature <strong>and</strong> organic loads influence prevalence <strong>and</strong> abundance of pathogens, directly <strong>and</strong>indirectly. L<strong>and</strong> use practices have also been strongly linked to these changes in other systems.Conclusions: Most research on disease has focused on hatchery fish <strong>and</strong> there is minimal <strong>data</strong>on the marine phase. There have been few documented outbreaks for BC <strong>sockeye</strong> <strong>and</strong> limitedsurvey <strong>data</strong> do not point to increases. Many potential pathogens could cause wild mortality <strong>and</strong>Kent agrees for the most part with the PSC’s potential list.Recommendations include more research, especially in the marine phase; continuedsurveillance of farmed fish; surveys <strong>and</strong> <strong>data</strong> collection so that established methods can beapplied; collaborative research with ecologists, oceanographers <strong>and</strong> epidemiologists toinvestigate links of prevalence <strong>and</strong> abundance with environmental factors <strong>and</strong> l<strong>and</strong> use practices.DiscussionReynolds: How specific are these pathogens to specific species of <strong>salmon</strong>? And is it a good ideato restrict the scope to known cases involving <strong>sockeye</strong>?Kent: I don’t exclude any from the list. Where <strong>sockeye</strong> are less susceptible to disease, I wouldput it as a moderate risk assessment.Reynolds: Is that a good criterion to use? If studies show sea lice can infect other species of<strong>salmon</strong>, it might be useful to tackle it head-on, to take sea lice out of the picture.Kent: There are some studies, with pretty empirical <strong>data</strong>. Others just reported it in pinks. Itwould be good to separate whether the studies document that <strong>sockeye</strong> are not susceptible orwhether it was just not seen.Q: Will the fish farm study go ahead?42
Levy: It will go ahead in January. It will be timed to be ready for the aquaculture part of thehearings. The implications for us are that we will have to re-open the <strong>cumulative</strong> effectsanalysis.Routledge: It’s correct that there is no evidence re sea lice <strong>and</strong> <strong>Fraser</strong> <strong>sockeye</strong> but there arestudies on <strong>impacts</strong> in Atlantic <strong>salmon</strong>, which are relatively large, <strong>and</strong> they can causemortality, so I wouldn’t want to discount it.Routledge: Is there any evidence of vectors for disease to consider?Kent: You can show in lab studies that Lep can jump from adult fish. Some pathogens forexample are transmitted via leeches but can also transfer through the water. Could sea lice betransmitting disease? In freshwater, there have been increases in snail-borne disease due toincreasing numbers of snails. There is the whirling disease story in the US Rockies, linked tol<strong>and</strong> use <strong>and</strong> eutrophication. Arthropods as vectors is also worthy of addressing.Reynolds: A recent paper showed sea lice do jump from host to host in the wild. Male Lepjumped from pink to coho smolts.Peterman: Re recommendations 3 <strong>and</strong> 4, a problem with pathogens is the need for a rigoroussurvey program over a long period to see something interesting. It would be useful for theCommission to know how you would recommend dealing with this given limited dollars.Kent: One concern is epizootics <strong>and</strong> outbreaks of new pathogens. The other one (work was donewith coho parasite <strong>impacts</strong> on over-winter survival – see the Crofton slide) that can have asignificant impact on populations is that at a certain level you get a dramatic increase inpathogen-associated mortality. So it doesn’t have to be a br<strong>and</strong> new or highly-lethalpathogen. It could be a shift in the severity of the pathogen level. So if you are collecting fishsamples anyway, why not collect disease information as well so that you have informationover time. You can do more sophisticated models that also look at things like the relationshipbetween parasite burden <strong>and</strong> size.Peterman: To get the <strong>data</strong> for that graph, you need a well-designed consistent program. Theseprograms may be opportunistic, which may not be good enough.English: Juveniles can pick up Parvicapsula in freshwater, then migrate out to the ocean. It isreasonable to assume that the Parvicapsula is continuing to impact <strong>and</strong> potentially killingthem or attacking them as returning adults.Kent: Parvicapsula is similar to another estuarine parasite in a US river that infected fish goingout <strong>and</strong> in. There is the question of whether there is a heavier load, so it’s not just a questionof whether they are present or absent. Abundance is driven by temperature <strong>and</strong> most fishleave before temperatures are high enough, but it could be a shift where they are now out ofwhack.Martin: Given temperature <strong>and</strong> geographic changes in survival for a large number of stocks, doesthat eliminate or point to some of the parasites listed today?Kent: There is the example of Parvicapsula (but I’m not saying parasites are a major driver ofmortality).Martin: It could be one contributing factor.43
Kent: (…?) parasite mortality in coho that spans many rivers. Of all the pathogens, Parvicapsulaseems the one to look at in the interim. It is a widespread pathogen <strong>and</strong> there is normally alow intensity of infection, unless something has shifted. Temperature really drives these, sojust a few degrees change in ocean temperature can change these to pathogenic.Marmorek: It would be interesting to take McKinnell’s ocean temperature <strong>data</strong> <strong>and</strong> compare it tothe thresholds for these parasites.Kent: There are high levels of parasites in freshwater <strong>and</strong> the fish are leaving with those so theycould theoretically die in sea water. For Parvicapsula, one study found a high level infreshwater <strong>and</strong> then they didn’t see it in the marine environment, but it needs more studyHinch: We’ve done a lot of work on Parvicapsula. We don’t see it in the kidneys in adults. It’seither turned on or re-acquired. Some years we see strong disease <strong>and</strong> temperaturecorrelations, including Parvicapsula. We should also distinguish between en route <strong>and</strong> prespawningmortality, which are treated distinctly in Canadian management.Ashley: Was whirling disease introduced or did eutrophication amplify existing levels.Kent: This is an endemic pathogen, so l<strong>and</strong> use activities on the Klamath <strong>River</strong> intensified anendemic disease. Snails are also vectors for human disease so there has been lots of work onthe effects of l<strong>and</strong> use practices on snails <strong>and</strong> parasites.Ashley: The message to Cohen regarding watershed management is that these are principles youshould do anyway, but they have been ignored by agriculture.Kent: It was very difficult to tie l<strong>and</strong> use practices to pathogen burdens as you need to show itacross multiple rivers. There are two mechanisms: directly increasing temperature <strong>and</strong>increasing invertebrate hosts important for disease transmission.Staley: How will you deal with Kristi Miller’s work?Kent: I’m meeting her next week. We looked <strong>and</strong> didn’t see brain lesions. We don’t think theevidence is as strong of a pathogenic virus that killed the fish. Can I quote her with herpermission in my report?Levy: Yes.Hinch: Miller has a paper on this about to be published in a journal.Potential effects of contaminantsDon MacDonaldThis project included preparing an inventory of aquatic contaminants in the <strong>Fraser</strong> <strong>River</strong> inrelation to the distribution of <strong>sockeye</strong> CUs, comparing water quality in the <strong>Fraser</strong> to toxicity <strong>data</strong>for <strong>Fraser</strong> <strong>sockeye</strong>, assessing the contaminants <strong>and</strong> natural substances encountered by juvenile<strong>and</strong> adult <strong>sockeye</strong>, <strong>and</strong> evaluating the extent to which reductions in <strong>sockeye</strong> abundance areassociated with contaminant conditions in the river.Approach: An ecological risk-based approach was used to identify where <strong>and</strong> when <strong>sockeye</strong> areexposed to contaminants, which ones they could be exposed to in their life cycle <strong>and</strong> a44
preliminary assessment of potential effects (exposure levels <strong>and</strong> potential adverse effects) toidentify contaminants of concern to guide a more detailed assessment.It was understood in advance that it would be difficult to address potential effects of emergingcontaminants like endocrine disruptors, so the study used qualitative evaluation to take a focusedlook at these substances. The study also set out to identify uncertainties <strong>and</strong> key <strong>data</strong> gaps, beforepresenting conclusions <strong>and</strong> recommendations.Fifteen areas of potential exposure within the <strong>Fraser</strong> watershed were identified by mapping thespawning, rearing <strong>and</strong> migration habitats of <strong>Fraser</strong> <strong>sockeye</strong> CUs. It was also necessary to identifykey exposure times during spawning <strong>and</strong> incubation, juvenile rearing, outmigration <strong>and</strong> adultupstream migration. Given the variable timing among different stocks, the analysis wassimplified by using average timing for each of these four life stages, based on information fromthe literature.Aquatic contaminants inventory: Information from published sources <strong>and</strong> GIS <strong>data</strong>bases wereused to identify l<strong>and</strong> <strong>and</strong> water uses (e.g. pulp mills) with the potential to affect water quality <strong>and</strong>the intensity of each activity in each of the 15 areas of interest. Contaminants associated witheach activity were derived from the literature <strong>and</strong> this information was then integrated to identifycontaminants that might be present for each watershed. This resulted in a lengthy list (29 groupsof contaminants) though only a few of these have usable <strong>data</strong>.The preliminary assessment of effects involved compiling <strong>and</strong> evaluating exposure <strong>data</strong> (theprovincial environmental review process has now been merged with Environment Canada – thereis other <strong>data</strong>, but it probably won’t be available in time). Next steps include selecting toxicityscreening values, calculating hazard quotients, <strong>and</strong> then identifying contaminants of concern.A map of the <strong>Fraser</strong> basin showed the limited areas for which routine water quality <strong>data</strong> isavailable. There is no <strong>data</strong> for many streams <strong>and</strong> rearing lakes. When this information is overlaidwith the locations where <strong>sockeye</strong> could potentially encounter contaminants within the <strong>Fraser</strong>basin, it shows that there is no <strong>data</strong> for most of the 29 contaminant groups that could beencountered in the four freshwater life stages.Toxicity screening <strong>and</strong> threshold values were established to identify which of the contaminantsin the inventory were preliminary contaminants of concern that could be expected to haveadverse effects on <strong>Fraser</strong> <strong>sockeye</strong>.The evaluation of hazards relied primarily on water quality <strong>data</strong>, along with sediment qualityconditions <strong>and</strong> tissue residues where such <strong>data</strong> was available. These <strong>data</strong> were separated into twoperiods (pre- <strong>and</strong> post-1990), marking overall positive <strong>and</strong> negative productivity for most <strong>Fraser</strong><strong>sockeye</strong> stocks. Analysis of maximum hazard quotients for the preliminary list of contaminantsof concern, broken down by stock <strong>and</strong> life history phase, showed that many either declined orchanged very little in the post-1990 period. A water quality index that combines the frequency ofevents exceeding water quality guidelines, along with magnitude <strong>and</strong> other factors, shows noclear pattern for the pre- <strong>and</strong> post-1990 period for the spawning or rearing phases, though therewere possibly some increases for the in <strong>and</strong> out migration phases.Overall, it’s hard to see a strong pattern suggesting water quality has degraded. Further analysisof productivity vs. water quality index revealed no relationship between the two, where <strong>data</strong>, forany of the four freshwater life history phases. This analysis was done for <strong>Fraser</strong> <strong>sockeye</strong> overall<strong>and</strong> for several specific stocks.45
A detailed hazard evaluation, which involves a more realistic estimate of exposure <strong>and</strong> effects, isstill pending. Results are also pending for the focused qualitative evaluation of endocrinedisruptors <strong>and</strong> other emerging contaminants.Data gaps: Few water chemistry <strong>data</strong> are available for spawning <strong>and</strong> incubation areas or juvenilerearing areas. There are no <strong>data</strong> on dissolved metal concentrations, herbicides <strong>and</strong> pesticides,wood preservatives, fire retardants, most endocrine disruptors <strong>and</strong> few sediment chemistry <strong>data</strong>except for the Lower <strong>Fraser</strong>. Fish tissue chemistry <strong>data</strong> are limited to very few studies there is no<strong>data</strong> for the Harrison (the study had hoped to contrast their potential exposure against that forother stocks).Conclusions: The inventory confirms that a wide variety of contaminants has been released intoaquatic habitats within the <strong>Fraser</strong> basin. Existing <strong>data</strong> don’t support that contamination hascontributed to declining <strong>sockeye</strong> productivity since 1990 or to the low returns in 2009, but itcan’t be concluded that contamination is not a factor, due to <strong>data</strong> limitations.DiscussionPeterman: The PSC report came to the same conclusion: there is a lack of information, butcontaminants are probably unlikely causes of the decline in <strong>Fraser</strong> <strong>sockeye</strong>.Q/A: The “00” in Table 7 = No DataMarmorek: Harrison juveniles spend a lot of time in the estuary <strong>and</strong> Greater Vancouver probablyhas higher levels of contaminants than other areas. If they’re doing well it suggestscontaminants are not a smoking gun.MacDonald: Agreed: they should be getting the highest exposureRoutledge: Did you find any contaminants were increasing in concentration?MacDonald: Many of those associated with municipal waste water would be increasing aspopulation increases. Those include new contaminants such as those from personal careproducts like anti-microbials or fire retardants.Q/A: Contaminants in Georgia Strait were not examined.Levy: Johannes’ <strong>and</strong> MacDonald’s studies overlap, so that needs to be discussed.Ashley: Given the significant improvements in effluent discharge quality that resulted from theFederal EEM program for pulp <strong>and</strong> paper mills (Environment Effects Monitoring), did youpick up any changes pre- <strong>and</strong> post 1990?MacDonald: You don’t see it in the routine monitoring <strong>data</strong> but you see it in the five- yearreports. You do see improvement in mill discharges, but the caution is that some of the newproducts may have a stronger endocrine disrupting signal.McKinnell: Did any of the contaminants you have listed, for which there are no <strong>data</strong>, have thecapacity to kill a lot of out-migrating <strong>sockeye</strong> in the river in 2007?MacDonald: An excellent question relating to mass loading. We haven’t completed thosecalculations yet.Ashley: If there was a major event like the Cheakamus spill in the <strong>Fraser</strong>, we should have heardof it.46
MacDonald: We’re waiting for all the <strong>data</strong> to confirm that.McKinnell: Unless it was something relating to the 2007 flooding.Rosenau: Conversely, is it possible that there was an event in 2008 that amelioratedcontaminations (e.g. all mills shut down due to a strike)?MacDonald: There are no <strong>data</strong> to suggest that there was something in 2007 that didn’t happen in2008 – no evidence of “taps turned off” somewhere.Marmorek: With acid rain, there was a major debate between the US <strong>and</strong> Canada over Inco’scontribution, until there was a strike that showed the impact was more than Canada claimed.Freshwater factorsMarc Porter, ESSAFreshwater stressors examined in this study include activities like logging <strong>and</strong> agriculture,urbanization upstream of Hope, water use <strong>and</strong> hydro, as well as factors like temperature <strong>and</strong>contaminants. These stressors can affect the quality or quantity of spawning habitat, theproductivity of rearing lakes or migration conditions.To assess stressor <strong>impacts</strong> on <strong>sockeye</strong>, GIS was used to create spatial layers to define consistent“zones of influence” for these three types of habitat <strong>and</strong> for stressor indicators. These two layersare then overlaid to examine interactions between stressors <strong>and</strong> <strong>sockeye</strong> habitats.The presentation described how the study spatially bounded summaries of freshwater stressorson CU habitat <strong>and</strong> then listed the indicators selected for each of the seven key stressors(urbanization, logging, roads, agriculture, water use, hydro <strong>and</strong> mining).Data sources included provincial agencies, the Canadian Forest Service, BC Hydro <strong>and</strong> Googlemaps. Data analysis is now underway for some of the stressors.Forestry: the analysis addresses harvest levels (stable since early 1970s, but with increaseddensity of road/stream crossings); Mountain Pine Beetle (largest outbreak in history, withdifferent <strong>impacts</strong> from normal logging, but greatly accelerated logging in some <strong>Fraser</strong>watersheds); <strong>and</strong> log storage (log storage agreements in the <strong>Fraser</strong> estuary cover 862 hectarescurrently. There is minimal <strong>data</strong>, so a comparison of aerial photos from 2001 <strong>and</strong> 2009 wasdone).Mining: Analysis focused on effects on spawning habitats, looking at different mine types,density of mines <strong>and</strong> claims across CUs. Shuswap CUs are most heavily impacted by mining butmost of the activity is in the upper river, not geographically linked to major spawning areas.Hydro: The focus was on large-scale projects – two of these (Bridge/Seton <strong>and</strong> Kemano) withthe greatest potential effect on <strong>sockeye</strong> were evaluated. At Bridge/Seton, there were effects onsmolts <strong>and</strong> adults, though smolt mortality was significantly reduced by mitigation. Further workis needed to assess the extent of adults affected. At Kemano, <strong>impacts</strong> included low flows in theNechako, which were mitigated by a water flow model, so minimal <strong>impacts</strong> are assumed.Another consideration is the impact of IPP (Independent Power Production) hydro projects.These are generally located in fish-less reaches <strong>and</strong> short stream channels but have potential<strong>impacts</strong> on gravel <strong>and</strong> water temperature downstream. There is only one IPP in a <strong>Fraser</strong> <strong>sockeye</strong>watershed, so we can’t see explanatory value in the <strong>sockeye</strong> declines.47
Urbanization upstream of Hope since the 1980s has been highly variable. The study is usingmunicipal boundaries, urban road density, domestic water licences, census boundaries <strong>and</strong>human population trends as indicators.Agriculture: Crop production <strong>and</strong> grazing can increase sedimentation, destabilize banks, reduceflows, increase temperature <strong>and</strong> impair water quality. The <strong>Fraser</strong> supports 53% of the province’sfarml<strong>and</strong>, but this <strong>data</strong> is still being analyzed.Water use: Excessive human water use can result in altered or reduced flows <strong>and</strong> hightemperatures. The study is intersecting the locations of water licences <strong>and</strong> allocations with CUhabitat types.The study results will be presented in a “CU Dashboard” format that visually graphs a portfolioof the relative intensity of stressors in each of the above categories for each CU.Interpretations: Initial qualitative <strong>and</strong> quantitative assessments have been completed for a fewof these freshwater stressors, but the integrative analysis across the full set of quantitativeindicators still has to be done. Next steps include completing the portfolio of relative stressorassessments across CUs <strong>and</strong> seeing if a relationship emerges between the relative intensity ofstressors <strong>and</strong> recent population patterns.No recommendations or <strong>data</strong> gaps have yet been identified. In most cases, we lack the full timeseries. Data collection is not repeated on a very frequent basis, so that will be a keyrecommendation: more frequent updates of changes in watershed stressors over time.DiscussionWieckowski: Dorner’s earlier presentation showed <strong>Fraser</strong> <strong>sockeye</strong> stocks in some geographicareas doing well concurrently <strong>and</strong> then switching. Is there any idea yet why this may behappening?Porter: Not yet. The PSC report did not find any relationship but we have more detailed <strong>data</strong> onlocalized <strong>impacts</strong>.Peterman: How will the study look for correlations?Porter: We are still working out how to distinguish the scope of this project from the <strong>cumulative</strong>effects project.Peterman: Has any thought been given as to how you might scale some of these indicators toaddress what levels might represent a stress?Q/A: Groundwater removal is not part of the assessment, nor does it directly quantify flowchanges over time.Reynolds: There are bits <strong>and</strong> pieces of flow information available.Porter: We looked at water restrictions for an indication of some places that might haveproblems.Rosenau: There are good <strong>data</strong> sets available via the Water Survey of Canada, including <strong>data</strong> setsfor the whole year or broken down by the time of year, going back to 1913. They havesampling stations all over the <strong>Fraser</strong> watershed <strong>and</strong> have integrated everything, includingextractions, in one package. Elevation <strong>and</strong> discharge levels are available all over the <strong>Fraser</strong>,48
including Shuswap <strong>and</strong> North Thompson. Some of the <strong>data</strong> go back 100 years, some just 10years. The Coldwater has two gauges, for example, so it’s on a pretty fine scale.Hinch: The <strong>Fraser</strong> <strong>River</strong> Environmental Watch program also has a large monitoring programindependent of that one. It generally operates from spring to fall, with <strong>data</strong> up the <strong>Fraser</strong>mainstem <strong>and</strong> in many of the tributaries since the mid/ late 1990s. Dave Patterson canprovide more information.Routledge: It seems almost like an impossible task. You get all this <strong>data</strong> <strong>and</strong> look for patterns butI suspect that if there are <strong>impacts</strong>, they will be local <strong>and</strong> subtle, such as warm water duringthe return migration on the Horsefly.Peterman: You won’t have ideal <strong>data</strong> sets for all CUs but you may have very useful <strong>data</strong> just forsome, so you should not rule it out if you don’t have <strong>data</strong> for all.Marmorek: We can look at stressor vs. productivity to see if there is a positive, negative orneutral correlation, for example if there is any difference in productivity in areas that havebeen most or least impacted by the Mountain Pine Beetle.Martin: Re <strong>cumulative</strong> effects <strong>and</strong> the graph that says the portfolio stays fairly constant overtime, one way of looking at that is that despite the variation in individual stocks, the <strong>Fraser</strong> isvery resilient because of those different stocks. That you have the same portfolio over 60years highlights the resilience.Pickard: The reality might be multiple stressors.Routledge: It’s upsetting to see the decline in the number of people who are actually out lookingat what’s happening in the Horsefly, for example. We’re sitting here looking at <strong>data</strong> setsinstead of talking to people who actually see things happening <strong>and</strong> that poses the risk ofmissing something.PICES advisory report on the decline of <strong>Fraser</strong> <strong>River</strong> Sockeye <strong>salmon</strong>in relation to marine ecologySkip McKinnell, PICESThe presentation opened with a quote from a 1909 media report describing the “discovery” by apre-eminent ichthyologist that the marine refuge for <strong>Fraser</strong> <strong>salmon</strong> between the time they leavethe river <strong>and</strong> the time they return to spawn is located 10 miles off Vancouver Isl<strong>and</strong>. Thefollowing slide showed <strong>Fraser</strong> <strong>River</strong> <strong>sockeye</strong> tagging locations spanning the entire NortheastPacific. This, McKinnell noted, highlights the difference between what we profess withoutadequate observations <strong>and</strong> what we know when there is relevant <strong>data</strong>.This project looked at marine factors that might be linked to the low <strong>sockeye</strong> returns in 2009 aswell as the gradual decline in productivity.It turns out that <strong>Fraser</strong> <strong>River</strong> <strong>sockeye</strong> smolts that went to sea in 2005 had the lowest survival onrecord (many scientists anticipated that). Those that went to sea in 2007 had the second lowestsurvival overall, except for Harrison <strong>sockeye</strong>, which had the highest total survival on record.The winter of 2006/2007 was an “official” El Nino. Each El Nino is different but severalcharacteristics are fairly common, including lower than average sea level pressure in the Gulf ofAlaska, an eastward shift in storm tracks <strong>and</strong> intensification of storms. Wind patterns tend tofollow the pressure contours, which in the winter of 2007 were blowing towards the BC central49
coast. That winter featured wetter snow <strong>and</strong> the highest snowpack since records began in 1953.A cool spring delayed the melt <strong>and</strong> allowed more snow to accumulate. Then came hot weather inlate May <strong>and</strong> a widespread rain-bearing storm in early June that affected the Bulkley, Skeena <strong>and</strong>nearby central coast basins, leading to extreme river discharge from the north coast <strong>and</strong> centralcoast mountains. There was also high discharge from the <strong>Fraser</strong> (though not extreme). Recorddischarge led to record low salinity in Queen Charlotte Strait/Sound in 2007 – essentially therewas a surface layer of much fresher water covering Queen Charlotte Sound. Mark Trudelhappened to be doing his annual survey early in the melt period (June 28/29) <strong>and</strong> he recorded themost extreme low salinity since sampling began in 1998, extending to a depth of eight metres.The consequence was an unusually stable water column.In a separate analysis of sea surface temperatures, we had found that the only location of extremeSSTs anywhere in the Gulf of Alaska in any month in 2007 occurred right in Queen CharlotteSound. This led to the idea that this heat may have been caused by the freshwater anomalies, notocean circulation from the south. Adding to this theory was our observation that the large-scalewind patterns in Queen Charlotte Sound that summer were extreme. The typical summer patternis for northwesterly winds in June/July, but the average for June/July 2007 had the most extremeeasterly wind anomaly since 1948 when these wind records began (it was essentially a winterwind pattern). There is typically a net flow of surface water out of the Sound in summer but theprevailing winds that year did the opposite, keeping the freshwater layer backed up in QueenCharlotte Sound. The <strong>Fraser</strong> <strong>sockeye</strong> smolts were obligated to migrate through this region ontheir way out to the open ocean.Further insight was provided by Jim Irvine’s observation that marine survival of Chilko <strong>sockeye</strong>is correlated with April chlorophyll concentrations in Queen Charlotte Sound/Strait. Lowchlorophyll indicates a late spring bloom in Queen Charlotte Sound. The 2007 bloom was thelatest in the satellite chlorophyll record going back to 1998. So the smolts would haveencountered extreme salinity, wind, temperature anomalies in addition to a delayed bloom. Otherstudies in the region, of seabirds at Triangle Is. for example, have shown that survival of uppertrophic level animals is sensitive to bloom timing.In summary, our study looked at bottom-up effects to see if we could find conditions that werepotentially lethal to <strong>sockeye</strong>. We know there is correlation between SST <strong>and</strong> survival but wedon’t know much more.Productivity declines: shift or trend?Median values of log (recruits per effective female spawner) were calculated for smolts thatspend one summer rearing in lakes, using <strong>data</strong> from 1950 to the present for 16 <strong>Fraser</strong> <strong>sockeye</strong>stocks with lengthy time series (excluding Harrison). The resulting graph indicated that thepattern of decline was a step shift that occurred in 1992, rather than a gradual decline. Examiningeach of the 16 stocks individually suggested a shift was the better model than a trend for most, sothe idea of a shift is worth paying attention to. There is evidence for a 1992 shift in some otherstocks, including Long Lake, <strong>River</strong>s Inlet, Barkley Sound <strong>and</strong> the Columbia <strong>River</strong> (but notSakinaw).Peterson Index: A group of oceanographers, biologists <strong>and</strong> climate researchers have beenmeeting annually for over a decade to look at what happens in the ocean each year <strong>and</strong> to discusswhat we think it means for <strong>salmon</strong>. Bill Peterson (U.S. National Marine Fisheries Service,Oregon) built an index that combines large-scale ocean variables <strong>and</strong> also local oceanographic50
<strong>and</strong> biological variables. The combined rank for all variables in each year showed 2008 as thebest year in terms of marine conditions for <strong>salmon</strong> <strong>and</strong> 2005 was the worst year. Since 1998, theaggregate index is significantly correlated with Chinook <strong>and</strong> Coho returns to Bonneville Dam.Mackas Ecosystem Productivity Index: Dave Mackas (DFO) has also developed an ecosystemproductivity index for SW Vancouver Isl<strong>and</strong>. His index showed a period of warm, unproductiveconditions starting in 1992. The summer of 1992 was noteworthy for the return of sardines to BCafter a 47 year absence. The warm <strong>and</strong> unproductive period continued through the 1997/98 ElNino. A few years around 2000 were better for coho survival on the west coast but not for <strong>Fraser</strong><strong>sockeye</strong>. Indeed, the 2007 ocean entry year tended to cold <strong>and</strong> productive rather than warm <strong>and</strong>unproductive. The mismatch between the MEPI <strong>and</strong> <strong>Fraser</strong> R. <strong>sockeye</strong> <strong>salmon</strong> survival from1999-2002 may have arisen from differing locations of MEPI <strong>data</strong> <strong>and</strong> <strong>sockeye</strong> migration routes.As with Peterson’s index from the coast of Oregon, the MEPI shows that 2008 was the mostextreme of the years of cold <strong>and</strong> productive.Fulton <strong>and</strong> LeBrasseur’s work in the 1980s indicated that the BC coast is in a transitionbetween two major marine zones. In El Nino years, the west coast of Vancouver Isl<strong>and</strong> isdominated by southern/offshore subtropical copepods instead of the lipid-rich subarcticzooplankton that form the basis of an enriched food web where <strong>salmon</strong> seem to prosper. Andsince 1992, there have been far more unproductive than productive years.In defining the nature of the decline in <strong>Fraser</strong> <strong>River</strong> <strong>sockeye</strong> <strong>salmon</strong> productivity, it’s importantto get the pattern right because you would look for different causes if you think it’s a shift vs. atrend.DiscussionReynolds: Neither Mackas or Peterson predicted the bad 2009 return.McKinnell: The factors that appear to have affected the 2009 return involved climate, ocean<strong>and</strong> terrestrial interactions focused on Queen Charlotte Sound – both the Mackas <strong>and</strong>Peterson indices are based on West Coast indicators. I think the difference is largelybecause a result of where the <strong>data</strong> for the indicators are derived.Reynolds: It would be useful if there was independent <strong>data</strong> to actually show that the correlationbroke down that one year.McKinnell: It would be interesting plot MEPI vs. the salinityPeterman: The PSC report suggested that zooplankton production in Queen CharlotteSound/Strait 2007 was not anomalous.McKinnell: Recall that the spring bloom in Queen Charlotte Sound/Strait was the latest in2007 since records began in 1998. There is also a need to consider where the zooplanktonbiomass records came from. Those near Triangle Is. may have been rather normal, butthose in eastern Queen Charlotte Sound may have been quite different.Peterman: Rick Thompson pointed out there was much stronger downwelling along the coast,which would lead to a consistent effect.McKinnell: There have been significant reorganizations of North Pacific climate systemalong the West coast. There was definitely one around 1977 <strong>and</strong> the next significant51
change was in 1989, but there was no productivity decline that year. The more obviousdecline in productivity in B.C. occurred in 1992.Routledge: You could find a better fit, such as quadratic, for the pattern than a step. I don’t thinkyou can settle whether it’s a step or a shift from that graph.McKinnell: The point is that a shift in productivity has been not considered, yet it occurred in<strong>River</strong>s Inlet <strong>and</strong> Long Lake, so you can’t rule it out.Q/A: The graph was based on median values for the 16 time seriesPeterman: This is intervention analysis. You need to take into account the autocorrelations inthe time series if you do formal hypothesis tests in the future. When you go to a shift vs. atrend, it’s formal intervention analysis.Rosenau: We had the most massive Harrison return in 2010 from the same 2007 sea entry. <strong>Fraser</strong>chum that went to sea in 2007 were down. So these are two stocks with almost the same lifehistory, but one is up <strong>and</strong> one almost collapsed.Groot: It’s probably ocean distribution.Rosenau: Once they get out of Georgia Strait, maybe there is a difference depending onwhere they go.Groot: <strong>Fraser</strong> chum go north through Johnstone Strait, Harrison <strong>River</strong> <strong>sockeye</strong> don’t.Rosenau: These two stocks provide almost a controlled experiment. They spawn in the samegravel <strong>and</strong> both went out to the ocean the same year at the same time.Q/A: By August, the anomaly would have subsided. Harrison smolts go out through Juan deFuca. Beamish found them in Georgia Strait in September 2007. They were found on theWest coast of Vancouver Is. the following March.Groot: The similarity with chum is the difference in timing. Most <strong>sockeye</strong> go right out butnot chum. Harrison <strong>sockeye</strong> also stay around. Probably it was a mismatch for <strong>sockeye</strong>.McKinnell: There are a number of these observations from 2007 that need to fall in line. Thesurvival for age-2.x Chilko Lake <strong>sockeye</strong> <strong>salmon</strong> smolts that went out in 2007 was about 4%vs. 0.3% for the age-1.x. So how did smolts from the same lake, passing through the Strait ofGeorgia at the same time have such a different survivals? Perhaps it’s because the age-2.xsmolts are larger <strong>and</strong> maybe they have more energy to get through bad times.Marmorek: Did you try to compare median recruits per spawner against the Mackas red <strong>and</strong> blueyears?McKinnell: The basic pattern holds, though there are some outliers for the ocean entry years1999-2002.Peterman: <strong>Fraser</strong> pinks that went to sea in 2008 also came back in 2009 in large numbers. Canyou do something similar for WCVI to explain the pattern for other stocks?McKinnell: In 2005, the whole Gulf of Alaska lit up, with positive extreme SSTseverywhere. It was followed by a general cooling trend everywhere. The major exceptionwas from northern Vancouver Isl<strong>and</strong> to SE Alaska in the summer of 2007. For northernVancouver Isl<strong>and</strong>, there was a blip of warm water beginning in July. We think that,because salinities were higher, that a different process was responsible for the warmer52
temperatures. Notably, it doesn’t seem to have affected the West coast <strong>sockeye</strong> <strong>salmon</strong>stocks that, presumably, were migrating along the West coast that year.English: The PSC report discussed harmful algae blooms. Could you have had that in QueenCharlotte Sound?McKinnell: Or parasites. There were very high temperatures, but there is no algae bloommonitoring. Heterosigma has appeared in Georgia Strait in years of higher riverdischarge. There was a persistent Heterosigma bloom in Georgia Strait in July <strong>and</strong>August that year.English: I saw an extensive bloom of some kind in Queen Charlotte Strait while sailingthrough the area that year.Marmorek: Page 74 of the PSC report talks about the Georgia Strait <strong>and</strong> Queen CharlotteSound algae bloom.McKinnell: We looked at bottom-up effects of phytoplankton/chlorophyll, not harmfulblooms. I can imagine that there could have been a combination of undesirable trophicconditions, plus a bloom. But I keep coming back to why the survival of 2-year oldChilko smolts was so much higher than that of the 1-year olds if they both encountered aHeterosigma bloom.English: It could be timing.Christensen: It’s a compelling story, but if this was a prosecutor, his case would be breakingdown <strong>and</strong> we are still trying to find proof of guilt.McKinnell: No one found dead <strong>sockeye</strong> at sea to provide firm proof. But we have observedan extreme effect in biology <strong>and</strong> we are looking to see whether there are equivalentextremes in oceanography. We find that those are far more evident in Queen CharlotteSound/Strait rather than Georgia Strait.Marmorek: The prosecutor may not be the best analogy for what we’re doing. We’re looking atwhat is the relative likelihood of different theories, which may not be mutually exclusive <strong>and</strong>may be collaborating. For example, contaminants don’t seem likely. Which factor orcombination of factors explains the pattern that Peterman <strong>and</strong> Dorner outlined? Did the PSCget it right or does new evidence point elsewhere. We’re looking at conceptual models <strong>and</strong>how factors may be interacting. The idea of an attack from the l<strong>and</strong> is a new idea.Peterman: Did you find the same pattern as we did in terms of a shared trend for stocks outsidethe <strong>Fraser</strong>?Day 2McKinnell: Yes, the spatial scale of the effect is bigger than Georgia Strait.Introductory remarks, plan for Day 2Dave Marmorek, ESSAMarmorek welcomed everyone <strong>and</strong> reviewed the day’s agenda.53
Research program presentations (continued)PredatorsMarine mammal predationAndrew Trites, UBCThe presentation covers which marine mammals eat <strong>sockeye</strong>, marine mammal population levels<strong>and</strong> how much they eat. The assessment was based on peer-reviewed literature, governmentreports <strong>and</strong> unpublished <strong>data</strong>. Key metrics include numbers of marine mammals, populationtrends, diet composition <strong>and</strong> estimated consumption.Changes over time are linked to the history of hunts, culls, protection, recovery, stabilization<strong>and</strong>/or increases (e.g. Stellar sea lions). There are temporal patterns, but no obvious connectionto <strong>sockeye</strong> abundance. Data is too sparse to say whether there is a difference in distribution thatmay relate to <strong>sockeye</strong>. Marine mammals move around – they are not sedentary. On whether anyone life stage appears to be impacted, there is no evidence of significant predation on smolts;predation is limited to adults <strong>and</strong> <strong>sockeye</strong> does not appear to be an important part of their diets.Predation by marine mammals has undoubtedly helped to shape the life history <strong>and</strong> physiologyof <strong>sockeye</strong>, including potential traits such as run timing, density of schools <strong>and</strong> swimmingperformance, all factors which would enhance their ability to escape being eaten.Evidence for stressor: Many species of marine mammals have been observed eating <strong>sockeye</strong> –people fishing notice the mammals taking <strong>sockeye</strong> off their lines. Many populations have alsorecovered to historic highs. And the Strait of Georgia has the highest density of harbor seals inthe world; <strong>and</strong> also because highest density of harbour seals in the world (are they eating <strong>sockeye</strong>or something else?).However, <strong>sockeye</strong> is not a preferred prey species among those marine mammals that eat <strong>salmon</strong>.The seal population in Georgia Strait stabilized in the 1990s, before <strong>Fraser</strong> <strong>sockeye</strong> declined.Predation by marine mammals should also be equal across all <strong>Fraser</strong> <strong>River</strong> <strong>salmon</strong> stocks, <strong>and</strong>should not just be affecting <strong>Fraser</strong> stocks since most marine mammals are not concentrated in theStrait of Georgia.The evidence supports some but not all of the conclusions in the PSC report. It is agreed thatpopulations of several species are back up, including Stellar sea lions, Pacific white-sideddolphins, harbor seals <strong>and</strong> humpback whales. However the evidence disagrees that total foodconsumption by marine mammals is large enough to affect <strong>sockeye</strong> populations. This would onlybe true if they only ate <strong>sockeye</strong> but the evidence suggests that <strong>sockeye</strong> account for less than 1%of their diet, not over 20% of the summer <strong>and</strong> fall diet of Stellar sea lions, as the PSC reportsuggested.Information gaps include outdated diet <strong>data</strong> for harbour seals, limited diet <strong>data</strong> for porpoises <strong>and</strong>dolphins, <strong>data</strong> for other seasons besides the summer months <strong>and</strong> more DNA studies to determinethe species of <strong>salmon</strong> consumed (DNA has been used successfully in the last 5 year).Salmon-eating marine mammals in BC:Stellar sea lions: Populations declined from the late 1950s due to culls, then saw a rapid risefrom the late 1990s <strong>and</strong> are still growing. Populations are still at all-time lows in Alaska.54
Seasonal population distribution patterns show highest concentrations at the northern tip ofVancouver Isl<strong>and</strong> in summer. The much larger males eat 15 – 35 kg per day <strong>and</strong> <strong>salmon</strong>represents 17% of their diet (third highest contributor). Their major food source is forage fish(s<strong>and</strong>lance, herring <strong>and</strong> sardines are believed to be driving the population increases). Most<strong>salmon</strong> are found in their diet in the fall <strong>and</strong> those are mostly adults. There are differentproportions of <strong>salmon</strong> in summer diets by region (North Danger Rocks has the highestproportion of <strong>salmon</strong> at over 35%). Overall, for Southern BC <strong>and</strong> Washington State (CapeCaution to the Columbia <strong>River</strong>), <strong>salmon</strong> comprised 10% of their overall diet. They primarilyprey on adult-size <strong>salmon</strong> from all 5 species of <strong>salmon</strong> <strong>and</strong> steelhead, but mostly focus on pink<strong>and</strong> chum. Sockeye comprises the smallest proportion of all <strong>salmon</strong> species eaten. A 2009 studycovering BC <strong>and</strong> the Eastern Aleutians found <strong>sockeye</strong> represented 9% of total <strong>salmon</strong> in the dietof Stellar sea lions. Unpublished <strong>data</strong> from Olesiuk et al for Southern BC <strong>and</strong> Washingtonconfirmed <strong>sockeye</strong> was the prey in just 5% of all <strong>salmon</strong> DNA diet samples.Harbour seals: Historical populations are thought to have been in the range of 80,000 to100,000. Hunting <strong>and</strong> culling significantly reduced those numbers, but a steady increase hasbrought those numbers back to historical levels. Distribution patterns show they stay close tohome, all around the BC coast, <strong>and</strong> they eat around 1.9 kg per day. Scat studies in the 1980sshow <strong>salmon</strong> was only 4% of their diets. The species of <strong>salmon</strong> eaten is unknown but DNAtesting could reveal that if the samples are still there. Populations tend to be largest in estuarieswith large chum <strong>and</strong> coho runs. They appear to eat mostly adult <strong>salmon</strong>, although two areas(Comox Harbour <strong>and</strong> Port Moody) reported high numbers of chum <strong>and</strong> coho juveniles in scats.California sea lions: The big males come north in the fall, <strong>and</strong> some move into Georgia Strait inwinter with the herring. But only about 3,000 of the total 240,000 California sea lion populationreaches BC waters. Their BC diet is unknown, but likely similar to that of Stellar sea lions. Theyare also not present in the summer.Northern fur seals: Stomach samples in the 1950s <strong>and</strong> 1970s indicated a diverse diet but did notfind any <strong>sockeye</strong>.Killer whales: A 2006 study observed 423 <strong>salmon</strong> kills occurring between May <strong>and</strong> December,but they seem to specialize in Chinook. Only one of the <strong>salmon</strong> killed was a <strong>sockeye</strong>.Other species: There is no significant evidence of <strong>sockeye</strong> predation among other marinemammals such as minke <strong>and</strong> humpback whales, elephant seals, porpoises <strong>and</strong> dolphins.Why killer whales don’t eat more <strong>sockeye</strong> is unknown. Perhaps it relates to quality, swimmingspeed, inconsistent returns, or return timing coinciding with other options during a limitedwindow.Fish & bird predation on <strong>Fraser</strong> <strong>sockeye</strong>Villy Christensen, UBCThis report addresses fish <strong>and</strong> bird predation (neither were addressed in the PSC report) in thefreshwater <strong>and</strong> estuarine environment, Georgia Strait, Queen Charlotte Sound/BC <strong>and</strong> theNortheast Pacific Ocean. There is no doubt that <strong>sockeye</strong> are eaten in large numbers out in theocean, but there has been very little study of what’s eating them out there.A few hundred previous studies were looked at, but very few relate to <strong>sockeye</strong> predationmortality at different life stages. Key metrics include diets (most diet studies are only55
qualitative), abundance of potential predators, trends, predation mortalities (rare) <strong>and</strong> time scales.A few long time series exist, mainly for commercial species, but for most potential fishpredators, there is next to no information available.Freshwater predators: A table was presented summarizing potential freshwater fish predators,including other <strong>salmon</strong> species. Availability of information on abundance estimates, trends <strong>and</strong>monitoring was indicated by shaded blocks. Very little information is available on these potentialpredators, except for abundance estimates for coho <strong>and</strong> Chinook <strong>salmon</strong>. For potential birdpredators in freshwater, abundance <strong>and</strong> trend <strong>data</strong> were available for most species. Many <strong>salmon</strong>tags have been found in bird colonies in the Columbia but there were no major shifts in birdabundance trends (except for bald eagles, but those populations are not large enough to have abig impact). So there were no likely suspects found in freshwater.Ocean predators: A similar table presented for potential ocean predators indicated more <strong>data</strong>available, especially for commercial species. Humboldt squid are not likely the culprit, thoughthey may have some impact. Lamprey took a significant number of smolts but their abundance<strong>and</strong> trends are not known. Spiny dogfish could prey on <strong>sockeye</strong> but stomach samples did not findany evidence for this. It should be noted that there could be some impact even if <strong>sockeye</strong> are avery small proportion of the diet of highly abundant species, but you would need to look atstomach samples at the right time (when <strong>sockeye</strong> are present) <strong>and</strong> you might need to look atthous<strong>and</strong>s of samples to detect it.Daggertooth is an obscure deepwater fish. There is much evidence of Daggertooth wounds onreturning <strong>sockeye</strong> but no information on abundance or trends (efforts are being made to get someinformation from Japan). There is also evidence that sablefish go after smolts <strong>and</strong> they couldhave some impact but their numbers have not been increasing in the last 20 years. Blue sharkpopulations have been increasing in the ocean, but <strong>salmon</strong> represent a small proportion of theirdiet. Salmon sharks <strong>and</strong> Daggertooth are more likely suspects, but there is no <strong>data</strong> on either one.Similarly, there is no “smoking gun” to be found among marine birds that could prey on <strong>Fraser</strong><strong>sockeye</strong>.An evidence levels matrix listed the most likely fish <strong>and</strong> bird predators, summarizing the level ofknowledge in each case about diet, abundance, overlap <strong>and</strong> population increases or decreases.Potential interactions: Can <strong>sockeye</strong> research be isolated from what happens in the ocean? Inorder to explain what happen in the ecosystem, we need to underst<strong>and</strong> changes in productivity aswell as fisheries <strong>and</strong> food webs. Most <strong>salmon</strong> are eaten. More fry means more competition,which means smaller smolts <strong>and</strong> higher predation. Decreased environmental production alsomeans slower growth <strong>and</strong> higher predation.If there is a decline in alternate prey, could predators switch to feeding on <strong>sockeye</strong>? Pacific hakehas declined in Georgia Strait. Herring adults are also down in BC. In the NE Pacific Ocean,Pacific jack mackerel <strong>and</strong> Pacific mackerel are both down. In the Gulf of Alaska, WalleyePollock is way down. They don’t eat <strong>sockeye</strong> but are potential prey for predators like <strong>salmon</strong>sharks. Major shifts have occurred with several fish species in the NE Pacific <strong>and</strong> the Gulf ofAlaska in recent decades. Arrowtooth flounder populations are way up <strong>and</strong> they can eat smolts.Pacific cod is also down. When a predator species like Arrowtooth flounder has grown to a totalbiomass of over 2 million tons at the same time that a prey species like Pacific mackerel declinedsharply from 1.4 billion metric tonnes, it represents a big gap. Salmon biologists are not lookingat total biomass.56
Information gaps: The most important unknown is ecosystem monitoring for key predators.Information is poor for the open ocean <strong>and</strong> in freshwater. DFO’s attempts to implementintegrated management have been very limited <strong>and</strong> the recent ecosystem initiative was so poorlyfunded as to be meaningless. Key research needs include learning more about the abundance ofnon-commercial species <strong>and</strong> what’s happening in the open ocean.DiscussionPeterman: You have made an important point that <strong>sockeye</strong> could represent only 0.1% of the dietof dogfish <strong>and</strong> still suffer significant impact, given the abundance of the latter. We need to dothe rest of these calculations. We haven’t got the total <strong>salmon</strong> biomass that could be eaten bymarine mammals.Christensen: We can say let’s have an experimental fishery. Stomach samples reveal the averagediet. With DNA, you can identify prey that comprises only a very small proportion of thediet.Trites: It’s very simple to do the next step of putting a number on it. We need to do it for the fishas well because the fish eat far more. A big part of the diet of harbour seals was hake. Whatare those hake eating? So the seals could also be controlling other <strong>salmon</strong> predators, thushaving a positive as well as a negative impact. You can’t just put one number out withoutcontext – ecosystem models are important.Christensen: It’s very clear from this that we can’t point to one single species so we are probablylooking at <strong>cumulative</strong> effects.McKinnell: We also have to consider the behaviour of these species. Which predators have abehaviour that could put them in contact with high densities of outgoing <strong>sockeye</strong> smolts (e.g.which ones operate in the top 10 metres of water)?Christensen: This highlights the point in the quote about the <strong>salmon</strong> ocean refuge being 10miles offshore. About 15% of recent <strong>sockeye</strong> samples had daggertooth wounds.McKinnell: Regarding the diet of <strong>salmon</strong> sharks, it’s important to ensure that the target speciesfor the fishery where they are caught for stomach analysis was for <strong>salmon</strong> sharks. They willeat whatever else is in the net, so if they are caught in a <strong>salmon</strong> fishery, that will create bias.Routledge: Do Pacific mackerel only come north when the ocean is warmer?Christensen: That was not a major part of the argument. What is important is the big changeshappening in the Gulf of Alaska.Routledge: It has been hypothesized that mackerel are a major predator during El Nino events.Christensen: I don’t know.Martin: There has been a large change in the biomass of pilchards <strong>and</strong> mackerel over time.Christensen: There are now studies showing how much individual <strong>salmon</strong> sharks move aroundbut little is known about overall populations.Trites: Stellar sea lions are probably the ones that have been best studied, <strong>and</strong> pilchards show upin their diets when there are big changes.Dorner: The likely suspects are in the Gulf of Alaska, but Alaska stocks have not been affected.57
Christensen: Bristol Bay stocks are distributed further to the west. These changes are more in theGulf of Alaska.McKinnell: Those predators live largely on the ocean shelf <strong>and</strong> <strong>sockeye</strong> are mostly distributedoff the shelf.Christensen: That is true after they leave the coast but smolts have to pass through the shelf aswell.McKinnell: So do the Bristol Bay fish.Peterman: This provides a good summary of a lot of things that were not in the PSC report.Important issues include alternate prey <strong>and</strong> what is happening with other <strong>salmon</strong> species (e.g.very high <strong>Fraser</strong> pink abundance) <strong>and</strong> the study that showed total <strong>salmon</strong> abundance in theNorth Pacific is at an all-time high.Christensen: Plus the issue of very high pink <strong>and</strong> chum hatchery releases.Peterman: Sometimes diet indicates different distribution. Conversely finding few <strong>sockeye</strong> in thediet can reflect low <strong>sockeye</strong> abundance.Trites: But there was evidence with the killer whale study where the <strong>sockeye</strong> were there <strong>and</strong> theywere not selecting them.English: Re Beamish’s juvenile <strong>salmon</strong> abundance surveys in Georgia Strait, was informationrequested on the other species caught?Christensen: We requested but did not receive information from DFO. There are indications thatthey caught quite a few potential predators in those surveys.English: Especially important is evidence of trends in abundance for alternate prey. S<strong>and</strong>lance,anchovies, etc are said to be down but that should show up in Beamish’s surveys.Christensen: Hake is another interesting one but information on hake in Georgia Strait is verypoor.English: There were studies on early marine survival in the 1980s. Much of the focus was oninteractions with Chinook but there were also <strong>data</strong> on Barkley Sound <strong>sockeye</strong>. Is there anyinformation on increasing humpback whale populations in the Gulf of Alaska <strong>and</strong> anypotential for a shift to preying on <strong>salmon</strong> smolts?Trites: There are observations around Langara but we don’t see the same bubblehead feedingbehaviour. That’s the group most likely to be getting smolts <strong>and</strong> we need to do more workbut we don’t see the same feeding behaviour. We do know that they are taking a lot ofpilchards off Vancouver Isl<strong>and</strong>.Hinch: We shouldn’t lose sight of what happens in freshwater. There was a tagging study of 200smolts last year <strong>and</strong> half had disappeared by the mouth of the <strong>Fraser</strong>. We saw predation occurearly in the migration.Christensen: Agreed. I’m surprised that isn’t known.Trites: I’m looking for feedback or insights as to possible reasons or behaviour that mightexplain why we are not finding <strong>sockeye</strong> taken by killer whales.58
<strong>Fraser</strong> <strong>sockeye</strong> <strong>salmon</strong> habitat analysis: Lower <strong>Fraser</strong> <strong>River</strong> & Straitof GeorgiaMark Johannes, Golder AssociatesThe study objectives included developing an inventory of <strong>sockeye</strong> habitats in the Lower <strong>Fraser</strong><strong>and</strong> Georgia Strait; identifying potential human factors affecting habitat <strong>and</strong> potential links oroverlaps between human development <strong>and</strong> key <strong>sockeye</strong> habitats/habitat use; summarizing thebiophysical <strong>and</strong> water quality characteristics in Georgia Strait that relate to <strong>sockeye</strong> habitat use;identifying habitat protection approaches; <strong>and</strong> reporting on linkages between <strong>Fraser</strong> <strong>sockeye</strong> <strong>and</strong>human development activities.The approach included identifying key <strong>sockeye</strong> habitats in the Lower <strong>Fraser</strong>, the estuary <strong>and</strong>Georgia Strait, along with indicators of anthropogenic change <strong>and</strong> of biophysical characteristics<strong>and</strong> change in the Strait of Georgia over the study period (1990-2010). A key metric was the lossor degradation of key <strong>sockeye</strong> habitats.Inventory of key <strong>sockeye</strong> habitats: This was based on <strong>Fraser</strong> <strong>sockeye</strong> habitat use at differentlife history stages. During their out-migration, most <strong>sockeye</strong> smolts move very quickly throughthe Lower <strong>Fraser</strong>. Some use very specific habitats, such as the brackish areas just below Hopeinstead of the real estuary, where they develop energy stores before they head out. They use theshelf areas of Georgia Strait <strong>and</strong> travel around both sides of Texada. They also use the 10 – 15metres of water.Human development: GVRD is growing the fastest of all the urban centres – <strong>and</strong> populationgrowth can affect habitat quality. Data was also examined for other indicators, including thenumber <strong>and</strong> location of large projects over time, agricultural l<strong>and</strong> use, changes in forestharvesting, Lower <strong>Fraser</strong> dredging <strong>and</strong> shipping (the only increase is cruise ships) – no evidentlinks.Strait of Georgia biophysical <strong>and</strong> water quality indicators included SST, suspended solids <strong>and</strong>chlorophyll, with the information compiled in a <strong>data</strong>base that breaks the <strong>data</strong> down by timeperiod over the summer. Information on invasive species <strong>and</strong> harmful algae blooms likeHeterosigma was also compiled. Sampling for Heterosigma is principally associated withaquaculture so there is a need to investigate whether the location of blooms overlaps with<strong>sockeye</strong> habitat areas.Management: Habitat <strong>and</strong> management practices are improving but there is a higher volume ofeffluent discharges simply due to the magnitude of population growth. So this needs to be pulledout.So far, initial findings appears consistent with the PSC paper, though more work still needs to bedone. It’s unlikely however that freshwater habitat conditions in the Lower <strong>Fraser</strong> <strong>River</strong> havechanged enough during the study period to affect <strong>sockeye</strong>.Evidence gaps: There are few if any consistent time series for indicators, no clear indicators ofhuman development <strong>and</strong> limited consistent indicators of biophysical conditions in the Strait ofGeorgia. The hope is to develop a better information base so that we are not just makingcircumstantial arguments about associations. We’re still quoting good work that was done 2 – 3decades ago. We haven’t yet seen Beamish’s trawl survey <strong>data</strong>. The hope is to get thecharacteristics of good <strong>sockeye</strong> habitat so that we’re not looking all over the place.59
Comments are welcomed on the indicators <strong>and</strong> their potential influence on <strong>sockeye</strong> habitat use<strong>and</strong> potential risk of loss or degradation of key <strong>sockeye</strong> habitats from 1990 to 2010.DiscussionMcKinnell: When was Roberts Bank built?Johannes: In the 1980s? It’s important mostly for sediment as you don’t catch <strong>sockeye</strong> smoltsthere, only pink <strong>and</strong> chum.McKinnell: I wonder if increased light pollution in Georgia Strait makes <strong>sockeye</strong> smolts morevulnerable to predation?Johannes: We don’t know. The <strong>Fraser</strong> plume is dynamic <strong>and</strong> while there is only one study onthis, I can’t imagine <strong>sockeye</strong> not using the plume wherever possible. They use favourablecurrents in Georgia Strait to move quickly. If they are in good condition, they will stop tofeed, but if conditions are bad they will move fast. Re light pollution, they will shy awaypretty quickly.Dorner: Are there any thoughts on cruise ship discharges <strong>and</strong> Heterosigma blooms?Johannes: We only have Port of Vancouver <strong>data</strong> for ballast discharge. I suspect the amountspales compared to resident discharges. Heterosigma may be part of a “death by a thous<strong>and</strong>knives” pattern.Ashley: Transport Canada regulations specify conditions for ship discharges. I will send you areport that collected <strong>data</strong> on cruise ships.English: This is a very broad topic. I would encourage you to focus on the specific locations <strong>and</strong>times when <strong>sockeye</strong> are in specific areas. For example, what are the river discharges like atthe time when juvenile <strong>sockeye</strong> are migrating out. There is limited <strong>data</strong>, but there is somefrom recent tagging <strong>and</strong> also smolt timing at the Chilko fence, <strong>and</strong> then compare that to algaeblooms, river flow, temperature, etc.Johannes: I’ve taken every observation I can find <strong>and</strong> put it in the <strong>data</strong>base so we will have timeplaceassociation. There is anecdotal information but not good <strong>data</strong> on when the bulk of<strong>sockeye</strong> smolts are moving through the Lower <strong>Fraser</strong>. But we will try to do the associationwith algae blooms, etc.Rosenau: Do you have enough <strong>data</strong> to say where <strong>sockeye</strong> are distributed in Georgia Strait. Is itjust the shorelines?Johannes: They use the (upper limnetic?) habitats, not the littoral zone <strong>and</strong> they use the shelfrather that the deep troughs. I will try to catalogue whatever information exists on whichenvironment <strong>sockeye</strong> are using, but the issue is that it can change from year to year.Rosenau: Where are boundaries of the study? Do you go up to Campbell <strong>River</strong> or does it stopearlier. It’s very different from Campbell <strong>River</strong> to northern Vancouver Isl<strong>and</strong>, <strong>and</strong> this relatesto fish farms <strong>and</strong> massive anthropogenic effects. This may be covered by other groups but weshould look at habitat for the greater Georgia basinJohannes: I can comment in my report but I underst<strong>and</strong> that other groups are investigating it. Thenorthern boundary is Quadra/Cortes <strong>and</strong> I will use whatever information I have. Sockeyemove around a lot <strong>and</strong> how do these changes affect survival. The best <strong>data</strong> I have are herring60
survey <strong>data</strong>, but they were looking for herring, not <strong>sockeye</strong>. There is disparate informationbut we can put it on a map to show how they use the environment <strong>and</strong> how that changes <strong>and</strong>overlay it with other information <strong>and</strong> see what associations there are.Routledge: Michael Price’s sampling information may be useful.Marmorek: On Day One, the Kalman filter analysis showed the pattern was at a largergeographic scale, so how likely is it that Lower <strong>Fraser</strong> habitats are what’s driving the longtermdecline?Johannes: I don’t know. The <strong>data</strong> don’t show how they stop <strong>and</strong> start. Some years they barrelthrough <strong>and</strong> other years they dally around Malaspina <strong>and</strong> Texada. We couldn’t pull apart thecharacteristics by stock but there may be a tie in between what they hit in Queen CharlotteSound – if they find unfavourable conditions there. In other circumstances, they split alongthe two sides of Georgia Strait <strong>and</strong> slow down.Pickard: What <strong>data</strong> indicate the speed at which they travel in Georgia Strait.Johannes: Seine catches (1960s to 2003 catch <strong>data</strong>), June sampling <strong>data</strong> for herring <strong>and</strong> somePOST tagging studies.Pickard: Regarding the northern boundaries, it would seem sensible to include the area with thefish farms.Johannes: I will make clear what information exists <strong>and</strong> doesn’t exist on habitat use <strong>and</strong> how itchanges annually.Marmorek: How does this study relate to the fish farm chapter?Levy: This project needs to be clearly separated from #5.Adult river migration <strong>and</strong> spawning successEn route mortality, pre-spawn mortality <strong>and</strong> intergenerational effectsScott HinchFactors examined for this study were among-year <strong>and</strong> among-stock patterns <strong>and</strong> theirrelationship with spawner abundance <strong>and</strong> spawning success.Definitions: En route loss is defined as the difference between Mission <strong>and</strong> spawning groundescapement estimates, after accounting for in-river harvest (it includes unreported catch). Prespawnmortality is the percent unsuccessful egg deposition by female spawners.En route loss can be large relative to harvest <strong>and</strong> escapement <strong>and</strong> has been very important inrecent years. Prior to 1992 it was rarely shown, which was partly due to the way the <strong>data</strong> werecollected. It has been very high in recent years for Early Stuart. Early Summers show the samepattern of increasing en route losses, though the proportions are lower. Late runs show very largeen route losses, starting suddenly after the mid-1990s.DNA analysis can now be used to assign in-river migration mortalities to specific stocks. Nine of12 <strong>Fraser</strong> <strong>sockeye</strong> stocks had high en route mortality (over 50%) in most recent years, with theearly <strong>and</strong> late stocks suffering the worst <strong>impacts</strong>.61
Key metrics: The most important metric is temperature. The key metrics examined changes overtime <strong>and</strong> found clear temporal patterns. The pattern varies among <strong>Fraser</strong> <strong>sockeye</strong> stocks <strong>and</strong> arelikely to be similar for non-<strong>Fraser</strong> <strong>sockeye</strong> stocks such as those in the Columbia <strong>River</strong>.Biological hypothesis: Thermal <strong>and</strong> related issues play a large role in among- <strong>and</strong> within-stockvariations in en-route <strong>and</strong> pre-spawn mortality. Differences in migration distance <strong>and</strong> entrytiming among stocks directly affects their thermal migratory experience (those that enter early<strong>and</strong> travel long distances accumulate more hot days <strong>and</strong> hotter days). The Early Summer <strong>and</strong>Summer stocks encounter the highest <strong>Fraser</strong> temperatures.Thermal changes: Since the 1950s, there has been an increase of about 2 degrees Centigrade insummer <strong>Fraser</strong> water temperature, <strong>and</strong> an increase of around 1 degree C in the last 20 years.Discharge patterns are changing <strong>and</strong> many recent years have had extreme high summertemperatures. Since 1996, late-run <strong>sockeye</strong> have been entering the river 4 – 6 weeks earlier thannormal, instead of holding as in the past at the mouth of the river, <strong>and</strong> thus encountertemperatures up to 5 degrees C warmer than usual. <strong>River</strong> temperatures of more than 18 degreesC are now routinely experienced during return migrations.High temperature can kill <strong>salmon</strong> in different ways. Even when temperatures are sub-lethal, theycan still cause mortality before the <strong>salmon</strong> reach their spawning grounds. It is not known whetherthese effects have intergenerational consequences.Evidence: Lab studies of swimming <strong>and</strong> cardiac performance under different temperature <strong>and</strong>flow conditions simulated in swim tunnels show that optimum <strong>and</strong> lethal high temperaturethresholds vary among stocks. The results show that stocks are thermally adapted to theirmigration timing, in some cases with a small window between the optimal <strong>and</strong> critical hightemperature thresholds. For example, Early Stuart is adapted to river temperatures between 14<strong>and</strong> 16 degrees C. The Late runs that are now migrating earlier face much warmer temperaturesthan in the past.When adult late-run <strong>sockeye</strong> are held in water warmed to 20 degrees C in the lab, they all die,even if the water is subsequently cooled to 18 degrees. Mortality is only slightly abated if thewater is cooled to around 10 degrees (which speaks to the value of thermal refuges in lakes).Potential interactions among the examined factors <strong>and</strong> other stressors include pathogens <strong>and</strong>disease <strong>and</strong> rate of senescence. Most such interactions are negative or neutral, dependent onmigration timing.For example, Parvicapsula is picked up by all returning <strong>Fraser</strong> <strong>sockeye</strong> in the Lower <strong>Fraser</strong>.Experiments showed that kidney infections in lab-held <strong>sockeye</strong> increased rapidly whenindividual fish had accumulated around 370 degree days. There is a correlation between the levelof disease <strong>and</strong> mortality <strong>and</strong> many diseases are thermally mediated, so the more hot days, themore rapidly the disease agents will act. Field studies show that differences between the Mission<strong>and</strong> spawning ground estimates (i.e. en route mortality) are related to exposures to high rivertemperatures <strong>and</strong> flows. Survival estimates from telemetry studies also show stock-specificrelationships between river survival <strong>and</strong> temperature. For Chilko, higher temperatures did notseem to matter, but other stocks, like Quesnel, seem highly affected. For most stocks, 18 degreesC seems to be a tipping point, with 40% or more of the run lost at 20 degrees C.In 2002, a major research program was launched to investigate the early migration of returningLate-run <strong>sockeye</strong>. Studies showed much higher mortality in recent years with early migration. It62
was also shown that tagged fish returned to the river suffered much higher mortality if they hadbeen kept in warmer water. It’s still not understood why the fish are migrating earlier but theyare returning in poor physiological condition <strong>and</strong> then they encounter much higher rivertemperatures.Pre-spawn mortality: There is a long history of information showing that this affects all stocks,with mortality of up to 90%. Occurrences are variable <strong>and</strong> episodic among years <strong>and</strong> may behigher <strong>and</strong> more variable in recent years. There does not appear to be an overall trend for <strong>Fraser</strong><strong>sockeye</strong> but it does appear to be higher <strong>and</strong> more variable in Late-run stocks.There are many causes of PSM, including disease, stress <strong>and</strong> time spent on spawning grounds.There is evidence that it is simply a continuation of the processes that are killing fish during theirreturn migration.Conclusions: Migration mortality is substantial in many stocks across all run-timing groups inrecent years, particularly when river migration temperatures exceed 18 degrees C. Lab <strong>and</strong> fieldstudies show there are stock-specific differences in how fish deal with acute <strong>and</strong> chronic hightemperatures. Migration mortality is likely a contributing factor in declining trends in spawningabundance for stocks that don’t cope well with high temperatures (early <strong>and</strong> late runs). Prespawnmortality reduces the number of effective female spawners <strong>and</strong> could be a factor indeclining productivity for some late-run stocks.DFO <strong>and</strong> others are starting to do studies on possible inter-generational effects, but results todate are limited <strong>and</strong> equivocal.This study agrees with the three conclusions from the PSC report regarding en-route mortality,pre-spawn mortality <strong>and</strong> intergenerational effects.Information gaps: These include intergenerational effects, direct measures of migrationsurvival, <strong>and</strong> effects of bycatch/discard releases on survival. All three of these information needsare knowable.Climate & climate change effects on <strong>Fraser</strong> <strong>sockeye</strong>: literature reviewEduardo MartinsThe study objectives were to review the literature on documented effects of climate on <strong>sockeye</strong><strong>and</strong> to make a qualitative assessment of the role of recent climate change on the decline in <strong>Fraser</strong><strong>sockeye</strong> productivity.The presentation discusses how the literature was compiled, climate change <strong>and</strong> its effects on<strong>Fraser</strong> <strong>sockeye</strong> habitats, the likelihood of climate change effects on survival, survival by lifestage<strong>and</strong> the likelihood of changes.A search was undertaken of primary <strong>and</strong> grey literature specific to <strong>sockeye</strong>. Most of the papersfocused on freshwater, though there have been more papers on the marine in the past 2 - 3 years.Climate change <strong>and</strong> <strong>Fraser</strong> <strong>sockeye</strong> habitats: Summer temperatures in the <strong>Fraser</strong> <strong>River</strong> havewarmed by 2 degrees C since the 1950s, <strong>and</strong> 13 of the last 20 summers have been the warmest onrecord. There have also been substantial changes in precipitation (an average increase of 22% percentury but highly variable across BC). <strong>Fraser</strong> <strong>River</strong> flows show no trend, though the freshet isslightly earlier. For Georgia Strait <strong>and</strong> the Gulf of Alaska, temperatures have warmed by 0.2563
degrees C per decade, but that trend is confounded by large trends like the ENSO <strong>and</strong> PDO, witha warming trend attributed to the 1977-97 PDO.Likelihood of climate change effects: Climate changes could affect phenology, growth <strong>and</strong>survival, thought this study only examined direct (observations <strong>and</strong> tagging) <strong>and</strong> indirect(productivity) evidence of changes in survival. Criteria were defined for ratings of Unlikely,Possible, Likely <strong>and</strong> Very likely.Egg <strong>and</strong> alevin survival: One study showed survival decreased when there were increasedflows during incubation. Another showed productivity increased in years with more rainfall,which may mean more spawning area. So the two factors may offset each other. The rating wastherefore that survival possibly decreased. Additional comments are that there may be inter-stockvariability, with coastal (Weaver) doing better than interior (Adams) stocks.Fry survival: Evidence from lab <strong>and</strong> field studies suggests that higher temperature possiblydecreased fry survival. Temperature may not affect fry survival directly but it may lead toincreased predation rates on fry (one study suggested that coho predation on <strong>sockeye</strong> increasedwith temperature). A study in the Columbia showed small-mouth bass <strong>and</strong> walleye increasedpredation on <strong>sockeye</strong> fry by 25% to 35%.Smolt <strong>and</strong> post-smolt survival: There is no lab but much field <strong>data</strong> indicating that temperaturesin the ocean <strong>and</strong> estuary area decreased survival, so this was rated as likely decreased. Additionalcomments are that opposite effects were seen in Alaska stocks. Temperature might be a proxy forchanges in food abundance, quality <strong>and</strong>/or increased predation, but we don’t know.Immature <strong>sockeye</strong> survival: There are no lab <strong>and</strong> just one field study suggesting thattemperature decreased survival. This was rated as possibly decreased, but there is very little <strong>data</strong>Adult survival: There is much lab <strong>and</strong> field work showing that temperature reduces survival,<strong>and</strong> some field study showing that high flow decreases survival, so this was rated as very likelydecreased. Studies show low survival across many <strong>sockeye</strong> stocks at 18 – 20 degrees C, withinter-stock variability. Mechanisms for this are relatively well known <strong>and</strong> there is recentevidence that female survival <strong>and</strong> spawning success is exacerbated by warmer temperatures.Possible intergenerational effects need to be considered.Concluding remarks: More <strong>data</strong> is needed: different stocks have different life histories so theyexperience effects differently <strong>and</strong> this could provide valuable clues. More studies of mechanismsare also needed.Cumulative effects: Climate itself could be a significant factor generating a number of<strong>cumulative</strong> effects. If <strong>sockeye</strong> adults return smaller <strong>and</strong> with less energy, they will be moresusceptible to stressors during the return migration. Impacts may also be nested: there may beeffects across all life stages <strong>and</strong> there may also be intergenerational effects with climate playinga role.Conclusion: Climate change is a possible contributor to recent declines in <strong>Fraser</strong> <strong>sockeye</strong>productivity on average, with inter-annual <strong>and</strong> inter-stock variability.DiscussionWoodruff: Is there any information for 2010 on holding patterns for Late-run <strong>sockeye</strong> in GeorgiaStrait?64
English: There was extensive holding among a dominant group.Hinch: Some early fish were also coming in.Woodruff: Pre-spawn mortality for Cultus is quite high. Do we know why? Is it hatcheryrelated?Hinch: They allow some fish to try to spawn naturally though there has been a lot of pre-spawnmortality in recent years. But there have been problems with Cultus for quite a while relatedto lake spawning conditions.Staley: One of the challenges is you can’t find the carcasses because they are lake spawners.Peterman: We have heard of temporal changes in major indices where the focus was either onmarine or freshwater in each case, but it is likely both, since both are linked. Regarding theearlier timing of the freshet in recent years, are there any <strong>data</strong> on this relevant to the bloomtimingmismatch hypothesis?Martins: There are some <strong>data</strong> on zooplankton blooms occurring 30 days earlier <strong>and</strong> for a shorterperiod. If the <strong>Fraser</strong> discharge is very high, it may affect this as well.McKinnell: Wind patterns have a big effect on the BC coast. Mean wind patterns for April showthat starting in 1989, there was a persistence of typical winter wind patterns (average windspeeds <strong>and</strong> direction) into April. Prior to that, the summer northwest wind pattern used to setup about a month earlier. With the southeast winds, you get a combination of warmer windsplus a push of water from south to north. Both Mackas <strong>and</strong> the Peterson index show thattemperature is a reflection of variable patterns in the entire ecosystem.Routledge: There is a one- to two-month time lag from the bloom to the emergence of theplankton that <strong>sockeye</strong> want to eat, so the timing is about right that it would affect them. Wesaw a dramatic change in 2007, as McKinnell described.Data <strong>synthesis</strong> <strong>and</strong> <strong>cumulative</strong> effectsAlex Hall & Darcy Pickard, ESSAThis project involves <strong>data</strong> <strong>synthesis</strong> <strong>and</strong> integration; workshop organization, facilitation <strong>and</strong>reporting; the <strong>cumulative</strong> impact analysis, quantitative analyses across projects; <strong>and</strong>communicating to the Cohen Commission on the complexity of potential interactions. Thetimeline includes a December 15 final deadline to collect <strong>data</strong> from projects, with the final reportdue February 21, in time for the public workshop.Cumulative effects can involve a single type of effect repeated over time or space, multipleeffects that occur at one point in time <strong>and</strong> space, multiple effects that occur over time <strong>and</strong> space,or multiple effects that occur at different times <strong>and</strong> places.It is important to distinguish between relative <strong>impacts</strong> (relative magnitude of each stressor – i.e.which effects have greater relative importance relative to others) <strong>and</strong> <strong>cumulative</strong> <strong>impacts</strong> (whichinvolve mechanisms whereby different stressors combine). This project looks at both, using <strong>data</strong>from the research projects, along with both qualitative <strong>and</strong> quantitative <strong>data</strong> <strong>and</strong> analyses.Limitations include <strong>data</strong> gaps <strong>and</strong> complexity.The presentation reviewed examples of different morbidity-mortality patterns resulting from thecombination of different stressors: a low-level accumulation across the life span that leaves the65
subject less fit to deal with major stresses late in the life cycle; a rapid accumulation in the earlystages that causes an extended sub-lethal level (i.e. leaving the subject vulnerable to any smalladditional impact); or a steady, even accumulation of stressors over the entire life span (steppedpattern – death by a thous<strong>and</strong> cuts). If the situation with <strong>Fraser</strong> <strong>sockeye</strong> resembles the lastpattern, it would be very hard to prove that.Weight of evidence approach: A key challenge is how to use imperfect evidence – complexevidence, with confounding factors <strong>and</strong> <strong>data</strong> gaps – to gain as much insight as possible to guiderational decisions. This requires looking for plausible mechanisms, evidence of exposure <strong>and</strong>adverse effects, including the specificity <strong>and</strong> timing of effects (i.e. ensure there is a match inspace <strong>and</strong> time). Additional questions to be asked include whether the exposure level exceedsthresholds, whether the effect can be experimentally confirmed <strong>and</strong> whether removal of thestressor reduces the effect.Qualitative approaches: Key elements of the proposed approach for this project include aconceptual model of stressors over the life history, showing pathways <strong>and</strong> interactions, a spatiallife history diagram that gives a better idea of the scale <strong>and</strong> spatial overlap of stressors <strong>and</strong> anexpert evaluation of relative likelihood that integrates multiple sources of evidence.Quantitative approaches: The presentation also reviewed <strong>data</strong> availability <strong>and</strong> limitations,noting that <strong>data</strong> was expected from all of the projects except the diseases <strong>and</strong> parasites project(lack of <strong>data</strong>), the aquaculture contract (uncertainty re timing), <strong>and</strong> the fisheries <strong>and</strong> science/management projects (not applicable). The extent of <strong>data</strong> available <strong>and</strong> the ability to correlatepotential stressors to <strong>Fraser</strong> <strong>sockeye</strong> both temporally <strong>and</strong> spatially over their life history variesdramatically between projects. Limitations include missing <strong>data</strong> for some stocks <strong>and</strong> some years,having nothing more than snapshot <strong>data</strong> in some cases, the large number of parameters, <strong>data</strong> thatis sometimes only available at a different spatial scales for some stocks <strong>and</strong> gaps in terms ofbeing able to verify <strong>data</strong> quality, which raises the question of how to weight it (e.g. <strong>data</strong> collectedfor other species <strong>and</strong> purposes that is mined after that fact).Potential analyses: The <strong>data</strong> can be organized by life history stage or habitat type, by location orby project. The proposed approach is to look for evidence through any of these lenses (e.g.evidence from several projects that relates to stressors occurring a particular life-history stage orgeographic location).Univariate analyses: Peterman’s productivity <strong>data</strong> were used to do trend analyses <strong>and</strong> stockprofile summaries (e.g. are fewer stocks making the system less resilient?). Also beingconsidered are control charts to see if there is any evidence of variability that is abnormal for thesystem. A lot can also be done also to assess patterns for stressors in time <strong>and</strong> space. Theindividual projects are covering this so this project will mainly focus on presenting those resultssimultaneously (e.g. likelihood table).An example was presented of the trend analysis for one stock, Early Stuart, showing 1965 as thebreakpoint in an up/down productivity trend since 1950. The intent is to get an idea of the recentproductivity trend so as to focus in on that <strong>and</strong> also to see if it’s possible to determine whether allstocks started to decline at once or if certain groups of stocks showed similar patterns. TheKalman filter is another way of doing this. For Early Stuart, the best-fit model was that a changein productivity happened in 1965. Other stocks show a straight line pattern, which suggests thatit may be more complicated than something that affected all stocks at the same time. Acomparison of stock composition for the total <strong>Fraser</strong> <strong>sockeye</strong> run over different (12-year) time66
periods showed that 4 to 6 stocks (of the 19 that have <strong>data</strong>) consistently made up about 80% ofthe run for each time period.Cross project analysis: The project also involves correlation analyses to assess correlationamong variables across projects <strong>and</strong> also comparisons among groups (run timing, year types,<strong>Fraser</strong> vs. non-<strong>Fraser</strong>, climate periods, migration routes or timing.Multivariate analyses: These include discriminant analysis or logistic regression to determinewhich stressors are best able to “discriminate” among groups of stocks with similar productivitypatterns (don’t have covariates beyond the <strong>Fraser</strong> to follow that through). Principal componentanalysis (<strong>data</strong> reduction <strong>and</strong> interpretability among predictor variables) may provide (?a betteridea of the uncertainty around relationships?).Multiple regression can assess the relative importance of each stressor as well as hypothesizedinteractions <strong>and</strong> is probably the best tool to address the question of relative <strong>and</strong> <strong>cumulative</strong>effects. The intent is to use an information theoretic approach: to develop c<strong>and</strong>idate models, to fitmodels <strong>and</strong> compute AICs, <strong>and</strong> to assess relative weight for each model.Caveats are that while this quantitative analysis is important, it also has important limitations(e.g. stocks with no <strong>data</strong> don’t even enter into the comparisons). There is a tendency to think thatthe numbers trump everything else in terms of validity, but these should be seen as just one pieceto add to the overall weight of evidence <strong>and</strong> every effort will be made to communicate that veryclearly.Questions: These include how to deal with missing <strong>data</strong>: Is interpolation possible or will it benecessary to drop incomplete rows? Is it better to use a reduced set of years with <strong>data</strong> from morestressors or to look at a reduced set of stressors (or both)? Should the project try to come up witha status-only <strong>data</strong>set across all stressors? For the productivity metric, which is the right responsevariable: current slope, CU status or trends? Knowing that there will be many gaps, it is proposedto use expert opinion to develop a complete <strong>data</strong> set: Is that a viable approach?Feedback was sought on redundancies <strong>and</strong> gaps (vs. what other projects were doing), priorityanalyses <strong>and</strong> additional suggestions.DiscussionJohannes: In looking at habitat loss <strong>and</strong> degradation, is 1990 to 2010 an appropriate time period?I have an accumulation of individual <strong>data</strong> sets <strong>and</strong> I don’t know how to address them, but theconceptual model starts to address the question of how to look at them.Pickard: Where is the overlap between stressors in space <strong>and</strong> time? In a more complex model,we use that with the life history model to (…?). If we have <strong>data</strong> – how to use the conceptualmodels to drive (…?) to be able to look at the relative importance of different models toexplain the productivity <strong>data</strong>. I’m not confident that it’s going to work, so we’ll take theunivariate analysis <strong>and</strong> the trends where we do have <strong>data</strong>. It won’t be conclusive but we willhave all the evidence summarized as best we can.Christensen: I like the idea of expert opinion <strong>data</strong> sets. Without complete time series, if yourestrict it to years with <strong>data</strong> it would put more weight on those that have the long time series.Hall: We have limited <strong>data</strong> on stressors for that time period, so that is future work.67
Peterman: Before you conclude from your concentration profile analysis that there has not beenmuch change in the overall stock/life history composition of <strong>Fraser</strong> <strong>sockeye</strong>, you should lookat how that profile compares with one for Bristol Bay <strong>sockeye</strong>. With <strong>cumulative</strong> probabilityplots like your concentration profile, you can have large changes that don’t show up clearlyon the graphs.Hall: Agreed. This was a very quick look at it.Routledge: Blow up the scale to see how the weak stocks are doing. But really, you could throwup your h<strong>and</strong>s in despair at this task. The fundamental purpose is to underst<strong>and</strong> the<strong>cumulative</strong> <strong>impacts</strong> of multiple stressors that could impact <strong>Fraser</strong> <strong>sockeye</strong> in multiple ways. Idon’t think there is much hope of answering that in a couple months. The other idea thatlooks more positive is the notion of trying to tease out effects of different stressors – additive<strong>impacts</strong>. That looks achievable. The other one is important too but I don’t know what we c<strong>and</strong>o, so I encourage you to keep open the option of saying that we don’t really know.Hall: It’s important to take care to avoid mis-communicating the findings or over-stating thecase.Marmorek: If this big circle is the story, the portion told by quantitative <strong>data</strong> is a very smallportion. Most of it will be qualitative or expert judgment.Exploring conceptual modelsDarcy Pickard, ESSAThe draft conceptual model <strong>and</strong> spatial life history diagrams were based on information from thePSC report, plus the progress reports received to date, so they are not exhaustive. Participantswere invited to study the diagrams <strong>and</strong> to add comments regarding missing pieces or elements tosubtract. The intent is to use these diagrams to present all the information from the researchreports in one integrative way, with a focus on the factors that have the greatest explanatorypower in the productivity declines. This will be used to select model sets to test, so having everyfact at every life stage would not be useful.Blewett: Suggest using four colour b<strong>and</strong>s to more clearly show the four key geographicspaces in which these things occur.Integrative workshop tasksPSC report on relative likelihood of hypothesesMarmorek explained the intent of the breakout exercise, stressing the importance of looking atthe big picture. The task was to review the conclusions of the PSC report, as summarized inTable E-1, <strong>and</strong> to consider whether or not participants agreed with their conclusions <strong>and</strong> why.Participants broke up into three groups, <strong>and</strong> their discussions were summarized on flipchartnotes).Recommended monitoring <strong>and</strong> research priorities:Participants were asked to take a few moments to individually review <strong>and</strong> comment on whetheror not they agreed with the monitoring <strong>and</strong> research priorities outlined in Table E-3.68
Q/A: Researchers should also feel free to make recommendations on research priorities in theirreports.DiscussionParticipants were asked to share their most important change to the identified priorities, <strong>and</strong>reported as follows:Peterman: A major effort to construct <strong>and</strong> maintain <strong>data</strong>bases with appropriate QA/ QCprocedures, so that we can answer questions quickly <strong>and</strong> with some credibility. In addition to<strong>salmon</strong> <strong>data</strong>, such <strong>data</strong>bases should include <strong>data</strong> related to mechanisms <strong>and</strong> ecosystems.Routledge: Include condition <strong>and</strong> length in the recommended juvenile assessments.Christensen: The table has a very low emphasis on ocean research: we’re “looking under thestreetlight.” Relevance to management actions is important <strong>and</strong> we should do fisheryexperiments all the time if it’s important. Also research on the abundance of predators.Trites: Predator diet studies (fish <strong>and</strong> mammals) using DNA to see which <strong>salmon</strong> species theyare eating.Dorner: Studies of outside migration routes are just as important as inside studies.Staley: I agree with the <strong>data</strong>base suggestion. Also ensuring that we maintain capacity to managethe fishery. We should not lose sight of this in looking for interesting information about thefish.Blewett: I also agree with Peterman. Take these recommendations <strong>and</strong> combine them with asimilar description of the monitoring that’s being done now, put them together <strong>and</strong> put cost<strong>data</strong> against each one so that you can make good decisions about how to optimizeinvestments in research programs.Rosenau: Georgia Strait is the term used here. It should be clarified that we need to look atmigration <strong>and</strong> survival routes from Campbell <strong>River</strong> north to the tip of Vancouver Isl<strong>and</strong> <strong>and</strong>south via the Strait of Juan de Fuca. We need discrete macro units assessed for juvenilemigration patterns <strong>and</strong> survival rates.Martin: Focus on productivity <strong>and</strong> changes in rearing lakes: limnology, smolt <strong>and</strong> fall fry studies.Ashley: A user-friendly annual report on the state of the <strong>salmon</strong>. Start with <strong>sockeye</strong> butultimately cover all species.Johannes: Redefine the rows in this table <strong>and</strong> link Rows 2, 3 <strong>and</strong> 4 as a single program.Successfully-funded programs are life-history specific. POST is one mechanism for studyingit but we no longer have sampling programs that look at the distribution of smolts. We haveno index for smolts. We don’t need fences, do net catches. There is also nothing on thetiming of the freshet.English: Too much energy is going into improving forecasting instead of into doing proper inseasonmonitoring. We need inside Georgia Strait studies. A first priority should be an initialscoping of <strong>data</strong> – it’s unlikely to be done in the next two weeks – on things like harmfulalgae <strong>and</strong> contaminants. Some things could be done via existing <strong>data</strong> <strong>and</strong> it could guide afuture program. Also what’s happening with fish going through Georgia Strait. If the actionis outside Georgia Strait we will need major dollars to study it.69
McKinnell: There are no marine survival indices – the fences are all up in the rivers so there isno starting point from which to generate abundance information. So monitoring needs toestimate post-smolt emigration from river by stock. We should expend some effort to try tofind dead <strong>sockeye</strong> smolts. Find a way to see how <strong>sockeye</strong> are dying. We can’t use recruitsper spawner or smolt survival – we need a census of population as they enter the sea. Ideally,you could sample them at a “fence” in Johnston Strait to say what is coming out of GeorgiaStrait.Q/A: The difficulty with POST is that it is labour-intensive. Alternatives include sonar.Martins: My concern is that parental spawning success <strong>and</strong> incubation is a low priority. This isimportant to management. I agree with Martin’s suggestion about lake studies. Alsopredation.Hinch: I agree with Johannes, McKinnell <strong>and</strong> English. We need direct assessment of survival inthe juvenile <strong>and</strong> post-juvenile stages. We can make statements with the adults because wemeasure those but we do very little with juveniles. It transcends several of these categories –we need a way to assess relative abundance as they’re migrating out. Whether we use POSTor another technology that’s not as expensive, we can link that with oceanography or coastalresearch.Marmorek: The first step is to find where <strong>and</strong> when the victim died.Kent: My comment is about the near-shore research for pathogens. I think it’s important, thoughothers don’t think pathogens are important. If you do it, you need to look at pre-smolt fish aspathogen research requires you to look at the host through different life stages.Porter: Methods to address broad changes in the quality of spawning habitat. Assessment acrossa CU’s spawning reaches <strong>and</strong> showing annual changes. There is no method in place to dothat. This includes water quality.Wieckowski: Looking at whether there are any inter-generational <strong>impacts</strong> from adults coming inreally stressed, if this could be more common in the future.MacDonald: A general comment is that I like a lot of it but that there is opportunity to sharpenup a lot of these recommendations to more specifically address what we’re looking at.Priorities include temperature effects <strong>and</strong> en route losses <strong>and</strong> interactive effects oftemperature <strong>and</strong> contaminants in en route losses.Groot: What is obvious is our lack of biological information on what they do in the open ocean.We are way behind the oceanographers. We now have lighthouses, Argus floats <strong>and</strong>monitoring stations, so use the technology that we have (we use tags for birds, evenbutterflies, so use them for <strong>salmon</strong> too). With changing climate there will be morefluctuations, so we need to get out <strong>and</strong> observer instead of continually rehashing the old <strong>data</strong>.Peterman: We were discussing the same thing. Astronomers <strong>and</strong> oceanographers get big,expensive projects approved.Martin: We need a <strong>sockeye</strong> research collaborative – not just for BC but international – that looksat the flow through the whole life history – a big picture approach.70
Peterman: We’re lacking the big picture because we’re not thinking big enough. The proposal fora fully-integrated Strait of Georgia study is not thinking big enough - everyone is studyingsmall pieces.McKinnell: I think there is an opportunity. The coastal <strong>salmon</strong> ecology group is meetingannually <strong>and</strong> has had some success with regard to ocean survival of <strong>salmon</strong> in the early lifestages. We are trying to find an umbrella to share observations from California to Alaska.Take a network of people who are working under the radar <strong>and</strong> formalize it as anorganization, an international cooperative that has the same research objectives.Levy: With this Commission we have a unique opportunity to advance some of these concepts sothere is no problem thinking big. The government of Canada will be listening.McKinnell: Even something like the old Fisheries Research Board model. Look at what is failing<strong>and</strong> where advances could be made in a way that is cost effective <strong>and</strong> that provides newinsights.Peterman: Not just for <strong>Fraser</strong> <strong>sockeye</strong>: we need something to compare <strong>Fraser</strong> <strong>sockeye</strong> with forthe whole life history, with well-focused questions.Kent: I’m involved in three Oregon studies that were part of a bigger program. It was veryrewarding because the work was so well integrated with toxicology <strong>and</strong> fishery biology.Christensen: Is this what DFO has in the 5-year plan? It’s worth looking at the ecosystemresearch initiative <strong>and</strong> how effective it has been. They are chopping the funding into suchsmall pieces.Marmorek: There is a report that deals with DFO management <strong>and</strong> science so that seems like thelogical place to address it.Johannes: It would be useful to have a group of authors write a white paper on this.Levy: ESSA’s <strong>cumulative</strong> effects paper would be a good place to do it.ACTION: Email any further comments on conceptual models to ESSA (Darcy)Closing commentsLevy thanked everyone for an enlightening discussion, noting the brain power in the room hadbeen effectively harnessed in the agenda, that he was very pleased with the progress heard <strong>and</strong>that he looked forward to continuing to work with the researchers.Q/A: The report deadline is fixed, <strong>and</strong> further changes after the deadline would not beencouraged.Levy closed by thanking ESSA for a great job organizing <strong>and</strong> facilitating the workshop.Adjourned: 4:4571
List of ParticipantsDave Marmorek, ESSA (Facilitator)Darcy Pickard, ESSAAlex Hall, ESSAMarc Porter, ESSAKatherine Wieckowski, ESSALiz Martell, ESSADave Levy, Cohen CommissionPatricia Woodruff, Cohen CommissionCarla Shore, Cohen CommissionDon MacDonald, MESLMichael Kent, Oregon State UniversityMark Johannes, Golder AssociatesKees Groot, DFO retiredMarc Labelle, L4 BiotechAl Martin, MoE retiredKen Ashley, BCITEdwin Blewett, CounterpointMike Staley, CounterpointBert Ionson, CounterpointBrigitte Dorner, SFU/Driftwood DesignsAndrew Trites, UBCVilly Christensen, UBCR<strong>and</strong>all Peterman, SFUSean Cox, SFUMarvin Rosenau, BCITKarl English, LGLSkip McKinnell, PICESEduardo Martins, UBCScott Hinch, UBCRick Routledge, SFUJohn Reynolds, SFUDawn Steele (note-taker)Summary of action itemsLevy to advise whether reviewer comments <strong>and</strong> responses should be reported individually oras summary reviews <strong>and</strong> summary responses.Scientific contractors requested to keep Excel <strong>and</strong> Access files h<strong>and</strong>y to facilitate translationof all figures in their reports (tables should be okay).Email any further comments on conceptual models to ESSA (Darcy)72
Appendix D: Table of likelihood/ hypothesesWorkshop participants were asked to examine the PSC Report Probability of, or relativelikelihood of, alternative hypotheses (i.e. Table E-1, Peterman et al. 2010) <strong>and</strong> compare theresults to the workshop findings. Participants judged the relative likelihood that a givenhypothesis contributed to both the poor returns in 2009 <strong>and</strong> the long-term decline in productivityof <strong>Fraser</strong> <strong>River</strong> <strong>sockeye</strong> <strong>salmon</strong>. Ratings are shown for both the PSC Panel (“PSC”, grey -contributing factor; black - major factor) <strong>and</strong> the participants at the Cohen Commissionworkshop (“workshop”, orange – contributing; red - major). Participants used qualitative terms(very likely, likely, possible, unlikely, or very unlikely) to rate the hypotheses. Strength ofevidence was only recorded at the workshop where participants felt there was a need to qualifytheir judgments.CohenCommissionProject1 – Diseases &Parasites2 –Contaminants3 – FreshwaterFactors4 – MarineEcology (insideGeorgia Strait)4 – MarineEcology(outside GeorgiaStrait) 58 – Predators 1(Mammals)8 – Predators 2(Fish & Birds)TimePeriodStrengthofevidenceSource ofRatingsRelative likelihood that each hypothesis contributed significantlyto observed changes in productivityVeryVeryLikely Possible UnlikelyLikelyUnlikelyoverall Fair PSCWorkshop2009 Fair PSCWorkshopoverall Poor PSCGood Workshop2009 Poor PSCGood Workshopoverall Fair PSCND 4 Workshop2009 Fair PSCND Workshopoverall Fair PSCWorkshop2009 Good PSCWorkshopoverall Fair PSCWorkshop2009 Fair PSCGood Workshopoverall Fair PSCWorkshop2009 Fair PSCWorkshopoverall PSC not evaluated by PSCfew <strong>data</strong> Workshop2009 PSC not evaluated by PSCfew <strong>data</strong> Workshop9 – Climate overall Good PSC4 ND = no <strong>data</strong> presented at workshop; only qualitative judgments5 evaluation of this factor at the workshop focused on Queen Charlotte Sound
CohenCommissionProjectChange 1 (enroute mortality)9 – ClimateChange 2(effects of enroute mortalityon nextgeneration)9 – ClimateChange 3(overall effects)10 – DelayedDensityDependenceTimePeriodStrengthofevidenceSource ofRatingsRelative likelihood that each hypothesis contributed significantlyto observed changes in productivityVeryVeryLikely Possible UnlikelyLikelyUnlikelyWorkshop for S 62009 Good PSCWorkshopoverall Poor PSCND Workshop for S for R/S2009 Poor PSCWorkshopNDfor Sfor R/Soverall PSC not evaluated by PSCGood Workshop2009 PSC not evaluated by PSCGood Workshopoverall Fair PSCWorkshop2009 Fair PSCWorkshop6 S = returns of spawners; R/S = recruits / spawner (en route mortality already included in R, together with returningspawners <strong>and</strong> harvest)