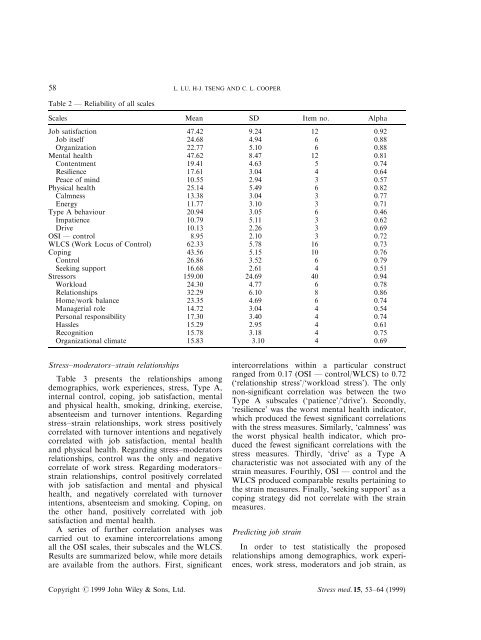
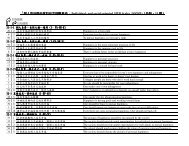
58 L. LU, H-J. TSENG AND C. L. COOPERTable 2 Ð Reliability of all scalesScales Mean SD Item no. AlphaJob <strong>satisfaction</strong> 47.42 9.24 12 0.92Job itself 24.68 4.94 6 0.88Organization 22.77 5.10 6 0.88Mental <strong>health</strong> 47.62 8.47 12 0.81Contentment 19.41 4.63 5 0.74Resilience 17.61 3.04 4 0.64Peace of m<strong>in</strong>d 10.55 2.94 3 0.57Physical <strong>health</strong> 25.14 5.49 6 0.82Calmness 13.38 3.04 3 0.77Energy 11.77 3.10 3 0.71Type A behaviour 20.94 3.05 6 0.46Impatience 10.79 5.11 3 0.62Drive 10.13 2.26 3 0.69OSI Ð control 8.95 2.10 3 0.72WLCS (Work Locus of Control) 62.33 5.78 16 0.73Cop<strong>in</strong>g 43.56 5.15 10 0.76Control 26.86 3.52 6 0.79Seek<strong>in</strong>g support 16.68 2.61 4 0.51Stressors 159.00 24.69 40 0.94Workload 24.30 4.77 6 0.78Relationships 32.29 6.10 8 0.86Home/work balance 23.35 4.69 6 0.74<strong>Managerial</strong> role 14.72 3.04 4 0.54Personal responsibility 17.30 3.40 4 0.74Hassles 15.29 2.95 4 0.61Recognition 15.78 3.18 4 0.75Organizational climate 15.83 3.10 4 0.69Stress±moderators±stra<strong>in</strong> relationshipsTable 3 presents the relationships amongdemographics, work experiences, <strong>stress</strong>, Type A,<strong>in</strong>ternal control, cop<strong>in</strong>g, <strong>job</strong> <strong>satisfaction</strong>, mental<strong>and</strong> physical <strong>health</strong>, smok<strong>in</strong>g, dr<strong>in</strong>k<strong>in</strong>g, exercise,absenteeism <strong>and</strong> turnover <strong>in</strong>tentions. Regard<strong>in</strong>g<strong>stress</strong>±stra<strong>in</strong> relationships, work <strong>stress</strong> positivelycorrelated with turnover <strong>in</strong>tentions <strong>and</strong> negativelycorrelated with <strong>job</strong> <strong>satisfaction</strong>, mental <strong>health</strong><strong>and</strong> physical <strong>health</strong>. Regard<strong>in</strong>g <strong>stress</strong>±moderatorsrelationships, control was the only <strong>and</strong> negativecorrelate of work <strong>stress</strong>. Regard<strong>in</strong>g moderators±stra<strong>in</strong> relationships, control positively correlatedwith <strong>job</strong> <strong>satisfaction</strong> <strong>and</strong> mental <strong>and</strong> physical<strong>health</strong>, <strong>and</strong> negatively correlated with turnover<strong>in</strong>tentions, absenteeism <strong>and</strong> smok<strong>in</strong>g. Cop<strong>in</strong>g, onthe other h<strong>and</strong>, positively correlated with <strong>job</strong><strong>satisfaction</strong> <strong>and</strong> mental <strong>health</strong>.A series of further correlation analyses wascarried out to exam<strong>in</strong>e <strong>in</strong>tercorrelations amongall the OSI scales, their subscales <strong>and</strong> the WLCS.Results are summarized below, while more detailsare available from the authors. First, signi®cant<strong>in</strong>tercorrelations with<strong>in</strong> a particular constructranged from 0.17 (OSI Ð control/WLCS) to 0.72(`relationship <strong>stress</strong>'/`workload <strong>stress</strong>'). The onlynon-signi®cant correlation was between the twoType A subscales (`patience'/`drive'). Secondly,`resilience' was the worst mental <strong>health</strong> <strong>in</strong>dicator,which produced the fewest signi®cant correlationswith the <strong>stress</strong> measures. Similarly, `calmness' wasthe worst physical <strong>health</strong> <strong>in</strong>dicator, which producedthe fewest signi®cant correlations with the<strong>stress</strong> measures. Thirdly, `drive' as a Type Acharacteristic was not associated with any of thestra<strong>in</strong> measures. Fourthly, OSI Ð control <strong>and</strong> theWLCS produced comparable results perta<strong>in</strong><strong>in</strong>g tothe stra<strong>in</strong> measures. F<strong>in</strong>ally, `seek<strong>in</strong>g support' as acop<strong>in</strong>g strategy did not correlate with the stra<strong>in</strong>measures.Predict<strong>in</strong>g <strong>job</strong> stra<strong>in</strong>In order to test statistically the proposedrelationships among demographics, work experiences,work <strong>stress</strong>, moderators <strong>and</strong> <strong>job</strong> stra<strong>in</strong>, asCopyright # 1999 John Wiley & Sons, Ltd. Stress med. 15, 53±64 (1999)
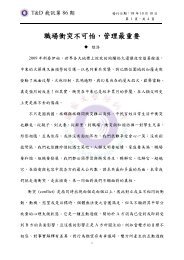
MANAGERIAL STRESS IN TAIWAN 59Table 3 Ð Correlations among demographics, work experiences, <strong>health</strong> habits, absenteeism, turnover <strong>in</strong>tentions <strong>and</strong> other aggregated scales1 2 3 4 5 6 7 8 9 10 11 12 13 14 15 16 17 181. Sex 12. Age 0.24*** 13. Edu. 0.02 0.10 14. Mar. 0.21*** 0.42*** 0.01 15. Tenure 0.01 0.70*** 0.07 0.28*** 16. Rank 0.17*** 0.37*** 0.05 0.25*** 0.20*** 17. Smok<strong>in</strong>g 0.38*** 0.10 0.16** 0.08 0.11 0.06 18. Dr<strong>in</strong>k<strong>in</strong>g 0.44*** 0.06 0.01 0.06 0.04 0.19*** 0.44*** 19. Exercise 0.19*** 0.16** 0.04 0.03 0.16** 0.11* 0.06 0.07 110. Leave 0.10 0.03 0.07 0.08 0.10 0.07 0.09 0.07 0.03 111. Quit 0.06 0.18** 0.06 0.24*** 0.18*** 0.29*** 0.03 0.04 0.03 0.09 112. JS 0.00 0.12* 0.10 0.17** 0.05 0.17** 0.03 0.07 0.11 0.07 0.34*** 113. MH 0.04 0.24*** 0.02 0.18*** 0.19*** 0.13* 0.04 0.04 0.09 0.15** 0.29*** 0.30*** 114. PH 0.04 0.26*** 0.01 0.19*** 0.17** 0.10 0.19*** 0.06 0.07 0.21*** 0.18*** 0.24*** 0.59*** 115. Stress 0.07 0.05 0.08 0.03 0.01 0.11 0.01 0.05 0 0.01 0.12* 0.23*** 0.33*** 0.18*** 116. Type A 0.15** 0.01 0.06 0.12* 0.02 0.09 0.03 0.04 0.02 0.06 0 0.07 0.05 0.12 0.03 117. Control 0.03 0.09 0.13* 0.08 0.14* 0.15** 0.03 0.08 0.02 0.08 0.17*** 0.30*** 0.25*** 0.17*** 0.25*** 0.04 118. WLCS 0.09 0.07 0.10 0.07 0.01 0.18*** 0.11* 0.07 0.01 0.19*** 0.16** 0.26*** 0.24*** 0.17** 0.02 0.03 0.17** 119. Cop<strong>in</strong>g 0.04 0.11 0.15** 0.06 0.08 0.14* 0.02 0.06 0.03 0.02 0.10 0.15** 0.13* 0.06 0.08 0.03 0.02 0.14*Sex, 1 ˆ M, 2 ˆ F; Edu., years of education; Mar., 1 ˆ s<strong>in</strong>gle, 2 ˆ married; Rank, 1 ˆ high-level, 2 ˆ low-level; Smok<strong>in</strong>g, 1 ˆ smokers, 2 ˆ non-smokers; Dr<strong>in</strong>k<strong>in</strong>g,1 ˆ dr<strong>in</strong>kers, 2 ˆ non-dr<strong>in</strong>kers; Leave, days of sick leave; JS, <strong>job</strong> <strong>satisfaction</strong>; MH, mental <strong>health</strong>; PH, physical <strong>health</strong>.*p 4 0.05; **p 4 0.01; ***p 4 0.001.depicted <strong>in</strong> Fig. 1, a series of hierarchicalregression analyses was conducted to predict<strong>job</strong> <strong>satisfaction</strong>, mental <strong>health</strong> <strong>and</strong> physical<strong>health</strong> separately. Signi®cant zero-order Pearson'scorrelation coecients between pairs of <strong>in</strong>dependent<strong>and</strong> dependent variables, as presented <strong>in</strong>Table 3, formed the <strong>in</strong>itial criterion for the<strong>in</strong>clusion of potential predictors. In each case,demographics were entered ®rst <strong>in</strong>to the equation,followed by work-related experiences at the secondstep, to statistically control their <strong>in</strong>¯uences. At thethird step, work <strong>stress</strong> was entered <strong>in</strong>to theequation, followed by moderators at the fourthstep. F<strong>in</strong>ally, the <strong>in</strong>teractions between work <strong>stress</strong><strong>and</strong> moderators were <strong>in</strong>cluded <strong>in</strong> the regression.In predict<strong>in</strong>g physical <strong>health</strong>, as smok<strong>in</strong>g wassigni®cantly correlated with global physical <strong>health</strong>,it was also <strong>in</strong>cluded <strong>in</strong> the equation to partial outits potential e€ects on the dependent variable. Inan attempt to achieve model parsimony, those<strong>in</strong>itially <strong>in</strong>cluded <strong>in</strong>dependent variables whichmade no signi®cant contribution to the R-squarewere deleted <strong>and</strong> the analysis repeated. Table 4presents the ®nal results of the three regressionanalyses.When predict<strong>in</strong>g <strong>job</strong> <strong>satisfaction</strong>, four out of®ve layers of <strong>in</strong>dependent variables were presented<strong>in</strong> the ®nal equation, <strong>and</strong> a total of 19 per cent ofthe variance <strong>in</strong> the dependent variables wasaccounted for by the ®ve predictors. Amongthem, <strong>in</strong>ternal control demonstrated the strongest(positive) <strong>in</strong>¯uence on <strong>job</strong> <strong>satisfaction</strong>, whereaswork <strong>stress</strong> demonstrated the strongest (negative)<strong>in</strong>¯uence. None of the <strong>in</strong>teraction terms reachedstatistical signi®cance. In other words, there wasno evidence of the bu€er<strong>in</strong>g e€ects of <strong>in</strong>ternalcontrol as a moderator of the <strong>stress</strong>±stra<strong>in</strong>relationship.When predict<strong>in</strong>g mental <strong>health</strong>, four predictorsrema<strong>in</strong>ed signi®cant <strong>in</strong> the ®nal equation, account<strong>in</strong>gfor a total of 23 percent of the variance <strong>in</strong>mental <strong>health</strong>. Age <strong>and</strong> <strong>in</strong>ternal control werepositively related to mental <strong>health</strong>, whereas work<strong>stress</strong> was negatively related to it. Interest<strong>in</strong>gly, the<strong>in</strong>teraction term between work <strong>stress</strong> <strong>and</strong> <strong>in</strong>ternalcontrol reta<strong>in</strong>ed its statistical signi®cance, <strong>in</strong>dicat<strong>in</strong>ga vulnerability e€ect of <strong>in</strong>ternal control on the<strong>stress</strong>±stra<strong>in</strong> relationship.When predict<strong>in</strong>g physical <strong>health</strong>, four predictorsrema<strong>in</strong>ed signi®cant <strong>in</strong> the ®nal equation,account<strong>in</strong>g for a total of 14 percent of the variance<strong>in</strong> physical <strong>health</strong>. Age <strong>and</strong> be<strong>in</strong>g marriedwere positively related to mental <strong>health</strong>, whereasCopyright # 1999 John Wiley & Sons, Ltd. Stress med. 15, 53±64 (1999)