2007 - Centre for Ecological Sciences - Indian Institute of Science
2007 - Centre for Ecological Sciences - Indian Institute of Science
2007 - Centre for Ecological Sciences - Indian Institute of Science
- No tags were found...

You also want an ePaper? Increase the reach of your titles
YUMPU automatically turns print PDFs into web optimized ePapers that Google loves.
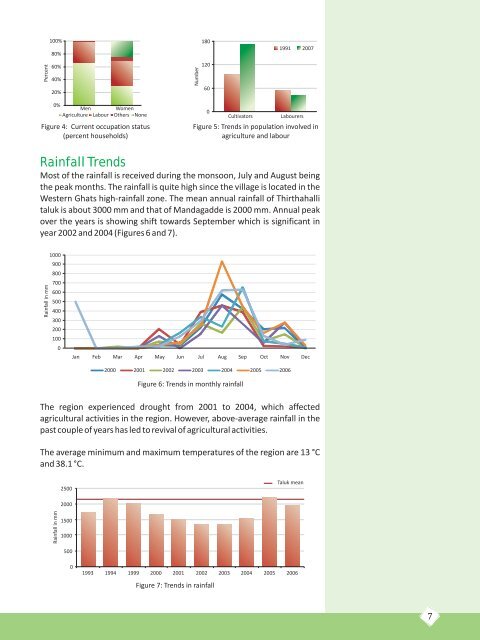
Percent100%80%60%40%20%Number180120601991 <strong>2007</strong>0%Men WomenAgriculture Labour Others NoneFigure 4: Current occupation status(percent households)0CultivatorsLabourersFigure 5: Trends in population involved inagriculture and labourRainfall TrendsMost <strong>of</strong> the rainfall is received during the monsoon, July and August beingthe peak months. The rainfall is quite high since the village is located in theWestern Ghats high-rainfall zone. The mean annual rainfall <strong>of</strong> Thirthahallitaluk is about 3000 mm and that <strong>of</strong> Mandagadde is 2000 mm. Annual peakover the years is showing shift towards September which is significant inyear 2002 and 2004 (Figures 6 and 7).Rainfall in mm10009008007006005004003002001000Jan Feb Mar Apr May Jun Jul Aug Sep Oct Nov Dec2000 2001 2002 2003 2004 2005 2006Figure 6: Trends in monthly rainfallThe region experienced drought from 2001 to 2004, which affectedagricultural activities in the region. However, above-average rainfall in thepast couple <strong>of</strong> years has led to revival <strong>of</strong> agricultural activities.The average minimum and maximum temperatures <strong>of</strong> the region are 13 °Cand 38.1 °C.2500Taluk mean2000Rainfall in mm1500100050001993 1994 1999 2000 2001 2002 2003 2004 2005 2006Figure 7: Trends in rainfall7