The utility of song and morphological characters in delineating ...
The utility of song and morphological characters in delineating ...
The utility of song and morphological characters in delineating ...

Create successful ePaper yourself
Turn your PDF publications into a flip-book with our unique Google optimized e-Paper software.
METRANI AND BALAKRISHNAN Journal <strong>of</strong> Orthoptera Research 2005,14(1):5-20 5<strong>The</strong> <strong>utility</strong> <strong>of</strong> <strong>song</strong> <strong>and</strong> <strong>morphological</strong> <strong>characters</strong> <strong>in</strong> del<strong>in</strong>eat<strong>in</strong>g speciesboundaries among sympatric tree crickets <strong>of</strong> the genus Oecanthus(Orthoptera: Gryllidae: Oecanth<strong>in</strong>ae): a numerical taxonomic approachSAPNA METRANI AND ROHINI BALAKRISHNANCentre for Ecological Sciences, Indian Institute <strong>of</strong> Science, Bangalore, India. E-mail: roh<strong>in</strong>i@ces.iisc.ernet.<strong>in</strong>AbstractDelimitation <strong>of</strong> species <strong>and</strong> identification <strong>of</strong> specimens to the species levelcont<strong>in</strong>ue to be difficult problems for practis<strong>in</strong>g entomologists, particularlythose <strong>in</strong> tropical countries who <strong>of</strong>ten have no access to the holotype specimensor orig<strong>in</strong>al literature <strong>of</strong> their local fauna. As a first step to the development<strong>of</strong> accurate Web-based species identification keys for Indian gryllids, wehave exam<strong>in</strong>ed the <strong>utility</strong> <strong>of</strong> <strong>morphological</strong> <strong>and</strong> <strong>song</strong> <strong>characters</strong> <strong>in</strong> correctlydel<strong>in</strong>eat<strong>in</strong>g species boundaries among 4 sympatric species <strong>of</strong> tree crickets<strong>of</strong> the Genus Oecanthus. Us<strong>in</strong>g a numerical taxonomic approach, pheneticclusters <strong>and</strong> ord<strong>in</strong>ations were constructed on the basis <strong>of</strong> <strong>morphological</strong><strong>and</strong> <strong>song</strong> <strong>characters</strong>. Quantitative <strong>and</strong> qualitative <strong>morphological</strong> <strong>characters</strong>were analysed <strong>in</strong>dependently <strong>and</strong> the results compared. <strong>The</strong> efficacy <strong>of</strong> thecluster<strong>in</strong>g <strong>and</strong> ord<strong>in</strong>ation techniques <strong>in</strong> species delimitation was exam<strong>in</strong>edby both <strong>in</strong>ternal <strong>and</strong> external allocation <strong>of</strong> <strong>in</strong>dividual specimens. Both thedelimitation <strong>of</strong> species <strong>and</strong> the allocation <strong>of</strong> new specimens were 95 to 100%accurate us<strong>in</strong>g <strong>song</strong> or qualitative <strong>morphological</strong> <strong>characters</strong>. Quantitative<strong>morphological</strong> <strong>characters</strong> could also accurately delimit species, provided alarge number <strong>of</strong> <strong>characters</strong> were used, irrespective <strong>of</strong> the specific <strong>characters</strong>chosen. For quantitative <strong>morphological</strong> <strong>characters</strong>, ord<strong>in</strong>ation was foundto be more accurate than cluster analysis, both for delimit<strong>in</strong>g species <strong>and</strong><strong>in</strong> the allocation <strong>of</strong> new specimens.Key wordstree crickets, species boundaries, <strong>song</strong>, India, OecanthusIntroductionAlthough the classification <strong>and</strong> identification <strong>of</strong> species has beenthe subject <strong>of</strong> active <strong>in</strong>quiry for centuries, accurate taxonomic identificationto the species level cont<strong>in</strong>ues to pose a difficult problem topractis<strong>in</strong>g entomologists, particularly those work<strong>in</strong>g <strong>in</strong> the tropics.Crickets (sub-order Ensifera) <strong>of</strong> the Indian subcont<strong>in</strong>ent providea good example <strong>of</strong> a taxonomic group <strong>in</strong> which identification tothe species level is difficult. In the case <strong>of</strong> the family Tettigoniidae,there are no taxonomic keys or comprehensive monographs on theIndian fauna (Ingrisch & Shishodia 1998). <strong>The</strong> keys for taxonomicidentification <strong>of</strong> the Indian Gryllidae are provided <strong>in</strong> Chopard’s“Fauna <strong>of</strong> India <strong>and</strong> adjacent countries” (1969). Although this is amonumental treatise on the subject, the taxonomic keys <strong>in</strong> this workare <strong>of</strong>ten not sufficient for unambiguous assignment <strong>of</strong> specimensto the species, <strong>and</strong> sometimes even the generic, level. <strong>The</strong> reasonsfor this are briefly outl<strong>in</strong>ed below.<strong>The</strong> first reason is imprecise character def<strong>in</strong>ition which, togetherwith a paucity <strong>of</strong> illustrations to effectively convey the exact nature<strong>of</strong> the def<strong>in</strong>ed <strong>characters</strong>, makes it difficult to follow either keys ordescriptions. <strong>The</strong> species descriptions are brief <strong>and</strong> rarely exhaustive<strong>and</strong> suffer from an <strong>in</strong>consistent <strong>in</strong>clusion <strong>of</strong> <strong>characters</strong>, evenJOURNAL OF ORTHOPTERA RESEARCH 2005, 14(1)among descriptions <strong>of</strong> very similar species. <strong>The</strong> second reason lies<strong>in</strong> the completely hierarchical, dichotomous structure <strong>of</strong> the keyswhich, comb<strong>in</strong>ed with the ambiguity <strong>in</strong> the def<strong>in</strong>ition <strong>of</strong> some <strong>of</strong>the dist<strong>in</strong>guish<strong>in</strong>g <strong>characters</strong>, makes it difficult to follow the keyscorrectly.<strong>The</strong> third reason is the lack, <strong>in</strong> some cases, <strong>of</strong> sufficient samplesizes <strong>and</strong> <strong>of</strong> objective criteria for def<strong>in</strong><strong>in</strong>g an <strong>in</strong>dividual specimenas the st<strong>and</strong>ard reference holotype for a species: holotypes havesometimes been designated without exam<strong>in</strong>ation <strong>of</strong> a sufficientnumber <strong>of</strong> specimens to take <strong>in</strong>to account <strong>in</strong>ter-<strong>in</strong>dividual variability<strong>in</strong> different <strong>characters</strong>. For example, the discrim<strong>in</strong>ation betweensome species <strong>of</strong> crickets (Chopard 1969) is made on the basis <strong>of</strong>differences <strong>in</strong> the number <strong>of</strong> tibial sp<strong>in</strong>es: there were several casesthat we exam<strong>in</strong>ed, however, where the difference <strong>in</strong> sp<strong>in</strong>e numberbetween the left <strong>and</strong> right tibiae <strong>of</strong> the same specimen exceededor equaled the variation <strong>in</strong> sp<strong>in</strong>e numbers between the designatedspecies. In the absence <strong>of</strong> other dist<strong>in</strong>guish<strong>in</strong>g <strong>characters</strong> <strong>in</strong> thekeys or descriptions, it was essentially impossible to assign suchspecimens to a given species.<strong>The</strong>se problems are further compounded for taxonomists <strong>in</strong>tropical countries by the <strong>in</strong>accessibility <strong>of</strong> both the taxonomicliterature on previous descriptions <strong>and</strong> revisions, <strong>and</strong> the referencespecimens or holotypes, which are largely available only <strong>in</strong>museums <strong>in</strong> Europe <strong>and</strong> North America, as a result <strong>of</strong> a history <strong>of</strong>colonisation. Added to this is the global decl<strong>in</strong>e <strong>in</strong> the number <strong>of</strong>pr<strong>of</strong>essional taxonomists, particularly for <strong>in</strong>vertebrate animal groups(Gaston & May 1992).A possible solution to some <strong>of</strong> these problems, which is beg<strong>in</strong>n<strong>in</strong>gto be implemented, is the development <strong>of</strong> Internet-accessibletaxonomic databases (Godfray 2002, Mallet & Wilmott 2003). <strong>The</strong>Orthoptera Species File Onl<strong>in</strong>e (Otte & Naskrecki 1997) is an <strong>in</strong>valuablefirst step <strong>in</strong> this direction. Although it provides valuable<strong>in</strong>formation on the past literature <strong>and</strong>, <strong>in</strong>creas<strong>in</strong>gly, pictures <strong>of</strong>holotype specimens <strong>and</strong> <strong>song</strong> record<strong>in</strong>gs, it is still not sufficient tomake a taxonomic identification. Although one is made aware <strong>of</strong>the existence <strong>of</strong> past literature, the actual works are largely unavailable.Secondly, the pictures, although an important asset, do noton their own allow identification, s<strong>in</strong>ce some <strong>of</strong> the key <strong>characters</strong>may not be visible or described <strong>in</strong> detail. In addition, what areurgently needed are databases that provide good taxonomic keysfor unambiguous identification.Our aim, <strong>in</strong> the long term, is to develop Web-based taxonomickeys for Indian gryllids based on an extensive <strong>and</strong> detailed exam<strong>in</strong>ation<strong>of</strong> several <strong>characters</strong> <strong>in</strong> a consistent <strong>and</strong> systematic manner. <strong>The</strong>keys would be either entirely or partially probabilistic <strong>and</strong> based on
Type verificationOecanthus rufescens.—Lectotype, 1 ♀ (Museum National d’HistoireNaturelle, Paris, France). Male miss<strong>in</strong>g (L. Desutter Gr<strong>and</strong>colas, pers.comm.); <strong>morphological</strong> description matches that <strong>of</strong> the AustralianO. rufescens (Otte & Alex<strong>and</strong>er 1983) <strong>and</strong> so do all <strong>song</strong> featuresexcept the syllable repetition rate, which is higher <strong>in</strong> our species.<strong>The</strong> assignment <strong>of</strong> the O. rufescens <strong>in</strong> the current study (locality:Bangalore) to the same species as the Australian O. rufescens (Otte& Alex<strong>and</strong>er 1983) must be regarded as tentative (L. Desutter-Gr<strong>and</strong>colas, pers. comm.).Oecanthus <strong>in</strong>dicus: <strong>The</strong> specimens <strong>in</strong> the current study were comparedaga<strong>in</strong>st paratypes <strong>and</strong> fit the orig<strong>in</strong>al species description (L.Desutter Gr<strong>and</strong>colas, Museum National d’Histoire naturelle, Paris,France: pers. comm.).Oecanthus bil<strong>in</strong>eatus: Verified aga<strong>in</strong>st paratype specimens (ForestResearch Institute, Dehra Dun, India) orig<strong>in</strong>ally designated by L.Chopard. Courtesy: Sudhir S<strong>in</strong>gh, FRI, Dehra Dun.Oecanthus henryi: Type specimens could not be traced at the NationalMuseum <strong>of</strong> Natural History, Colombo, Sri Lanka <strong>and</strong> are possiblymiss<strong>in</strong>g. Location <strong>of</strong> any other designated paratypes is not specified<strong>in</strong> the orig<strong>in</strong>al descriptions (S<strong>and</strong>rasagara 1954, Chopard 1969).Specimens used <strong>in</strong> the study fit the species description (Chopard1969).Statistical analysisMorphological <strong>characters</strong>.— Multivariate analysis was performed separatelyfor qualitative <strong>and</strong> quantitative <strong>morphological</strong> <strong>characters</strong>. Formultivariate analysis us<strong>in</strong>g qualitative <strong>characters</strong>, the states <strong>of</strong> eachcharacter were given <strong>in</strong>teger codes (0, 1, 2, 3.. .n) depend<strong>in</strong>g onthe number <strong>of</strong> character states. <strong>The</strong>se values were not st<strong>and</strong>ardizeds<strong>in</strong>ce all <strong>characters</strong> were coded as <strong>in</strong>tegers. A dissimilarity matrixwas then calculated from these data for use <strong>in</strong> further analysis. Forquantitative <strong>morphological</strong> <strong>characters</strong>, the values <strong>of</strong> each <strong>of</strong> the42 <strong>characters</strong> were st<strong>and</strong>ardized by subtract<strong>in</strong>g the mean value<strong>and</strong> divid<strong>in</strong>g by the st<strong>and</strong>ard deviation for each character (Manly1986). A Euclidean distance matrix was then calculated from thesest<strong>and</strong>ardized variables for use <strong>in</strong> further analysis.Song <strong>characters</strong>.— <strong>The</strong> <strong>song</strong> <strong>characters</strong> used <strong>in</strong> the multivariate analyses<strong>in</strong>cluded the mean fundamental frequency, mean call duration,mean call repetition rate <strong>and</strong> mean syllable repetition rate (meansrefer to the mean values for an <strong>in</strong>dividual). Each character was subjectedto l<strong>in</strong>ear regression analysis to check for any significant effect<strong>of</strong> temperature. This was carried out for 3 <strong>of</strong> the 4 species (exclud<strong>in</strong>gO. bil<strong>in</strong>eatus). <strong>The</strong> values <strong>of</strong> all <strong>song</strong> <strong>characters</strong> that showed significanttemperature effects were regressed to 22° C (the temperature atwhich most <strong>of</strong> the <strong>song</strong> record<strong>in</strong>gs <strong>of</strong> O. bil<strong>in</strong>eatus were obta<strong>in</strong>ed)<strong>and</strong> then used for the multivariate analysis. Song <strong>characters</strong> wereanalysed <strong>in</strong> the same way as quantitative <strong>morphological</strong> <strong>characters</strong>for calculat<strong>in</strong>g the Euclidean distance matrix.Each <strong>of</strong> the 3 sets <strong>of</strong> <strong>characters</strong>, namely <strong>morphological</strong> qualitative,<strong>morphological</strong> quantitative <strong>and</strong> <strong>song</strong>, was subjected to analysesus<strong>in</strong>g 2 methods: hierarchical cluster<strong>in</strong>g (UPGMA: Sneath & Sokal1973) <strong>and</strong> an ord<strong>in</strong>ation technique (non-metric multi-dimensionalscal<strong>in</strong>g, Manly 1986). Statistical analyses were carried out us<strong>in</strong>gStatistica (1999, Stats<strong>of</strong>t Inc., USA) s<strong>of</strong>tware.METRANI AND BALAKRISHNAN 7JOURNAL OF ORTHOPTERA RESEARCH 2005, 14(1)Analysis was carried out <strong>in</strong> 4 steps for each data set:1) Cluster<strong>in</strong>g <strong>and</strong> ord<strong>in</strong>ation (2-D MDS) to obta<strong>in</strong> the graphicalrepresentation <strong>of</strong> the distances between <strong>in</strong>dividuals <strong>in</strong> terms <strong>of</strong>phenetic similarity.2) <strong>The</strong> evaluation <strong>of</strong> the fidelity <strong>of</strong> the cluster<strong>in</strong>g <strong>and</strong> ord<strong>in</strong>ationalgorithms <strong>in</strong> represent<strong>in</strong>g the orig<strong>in</strong>al distance matrix, us<strong>in</strong>g themethod <strong>of</strong> co-phenetic correlations (Sneath & Sokal 1973).3) <strong>The</strong> evaluation <strong>of</strong> the efficacy <strong>of</strong> the cluster<strong>in</strong>g <strong>and</strong> ord<strong>in</strong>ationalgorithms <strong>in</strong> delimit<strong>in</strong>g species, us<strong>in</strong>g <strong>in</strong>ternal allocation.4) <strong>The</strong> evaluation <strong>of</strong> the validity <strong>of</strong> the clusters <strong>and</strong> ord<strong>in</strong>ations<strong>in</strong> terms <strong>of</strong> identify<strong>in</strong>g new specimens correctly (externalallocation).Cophenetic correlations: <strong>The</strong> m<strong>in</strong>imum distance between all pairs<strong>of</strong> <strong>in</strong>dividuals <strong>in</strong> the cluster or ord<strong>in</strong>ation was calculated to generatea cophenetic matrix. A Pearson correlation coefficient (r cs) wascalculated between the values <strong>of</strong> the orig<strong>in</strong>al distance matrix <strong>and</strong>the correspond<strong>in</strong>g values for the cophenetic matrix, provid<strong>in</strong>g ameasure <strong>of</strong> the similarity between the cluster or ord<strong>in</strong>ation <strong>and</strong>the orig<strong>in</strong>al distance matrix. <strong>The</strong> similarity between 2 clusters orord<strong>in</strong>ations (r c1c2) was also evaluated us<strong>in</strong>g the Pearson correlationcoefficient between the cophenetic matrices derived from the 2clusters or ord<strong>in</strong>ations (Sneath & Sokal 1973).Internal allocation <strong>of</strong> each <strong>of</strong> the 40 <strong>in</strong>dividuals to one <strong>of</strong> the 4species was carried out <strong>in</strong> the follow<strong>in</strong>g manner: the centroid, def<strong>in</strong>edas the <strong>in</strong>dividual possess<strong>in</strong>g the mean value <strong>of</strong> all measured<strong>characters</strong> (or modal value <strong>in</strong> the case <strong>of</strong> qualitative <strong>morphological</strong><strong>characters</strong>), was specified for each species <strong>in</strong> the orig<strong>in</strong>al data matrix,<strong>and</strong> <strong>in</strong>cluded <strong>in</strong> the cluster<strong>in</strong>g or ord<strong>in</strong>ation analysis. <strong>The</strong> centroid<strong>of</strong> each species was thus assigned a particular po<strong>in</strong>t <strong>in</strong> space <strong>in</strong>the resultant cluster or ord<strong>in</strong>ation. <strong>The</strong> Euclidean distance <strong>of</strong> each<strong>in</strong>dividual was then calculated to the centroids <strong>of</strong> each <strong>of</strong> the 4 species<strong>in</strong> the cluster or ord<strong>in</strong>ation, <strong>and</strong> the <strong>in</strong>dividual was assigned tothe species to whose centroid its distance was m<strong>in</strong>imum. S<strong>in</strong>ce thespecies identity <strong>of</strong> each <strong>of</strong> the <strong>in</strong>dividuals was known beforeh<strong>and</strong>, itwas possible to evaluate the accuracy <strong>of</strong> <strong>in</strong>ternal allocation for each<strong>of</strong> the 4 species (as the number correctly assigned out <strong>of</strong> 10).External allocation was carried out us<strong>in</strong>g new specimens (or<strong>song</strong>s) that had not been used to construct the clusters or ord<strong>in</strong>ations.Allocation was carried out on one specimen at a time <strong>in</strong> thefollow<strong>in</strong>g manner: the specimen to be allocated was <strong>in</strong>cluded <strong>in</strong>the distance matrix (but the values <strong>of</strong> its <strong>characters</strong> were not usedto calculate the centroid <strong>of</strong> its species) <strong>and</strong> the cluster or ord<strong>in</strong>ationanalysis was re-run to <strong>in</strong>clude the new specimen. <strong>The</strong> distance <strong>of</strong>this specimen from the centroids <strong>of</strong> each <strong>of</strong> the 4 species was thencalculated as described above, <strong>and</strong> the specimen allocated to thespecies to whose centroid its distance was the m<strong>in</strong>imum. Aga<strong>in</strong>,s<strong>in</strong>ce the species identity <strong>of</strong> the new specimen was known, it waspossible to evaluate the accuracy <strong>of</strong> external allocation for eachspecies. External allocation was carried out for all species exceptO. bil<strong>in</strong>eatus, for which the sample size was too small. <strong>The</strong> entireanalysis, <strong>in</strong>clud<strong>in</strong>g <strong>in</strong>ternal <strong>and</strong> external allocation, was carried outexclusively on male specimens.ResultsExternal <strong>morphological</strong> features <strong>of</strong> the 4 Oecanthus speciesIn this section, we provide a detailed <strong>and</strong> exhaustive description<strong>of</strong> the morphology <strong>of</strong> O. henryi, O. <strong>in</strong>dicus, O. rufescens <strong>and</strong> O.bil<strong>in</strong>eatus, extend<strong>in</strong>g previous observations (Chopard 1969, Otte &Alex<strong>and</strong>er 1983). <strong>The</strong> major dist<strong>in</strong>guish<strong>in</strong>g features (from previ-
8METRANI AND BALAKRISHNANous literature) on the basis <strong>of</strong> which the 4 species were <strong>in</strong>itiallyclassified are briefly summarised. Oecanthus henryi <strong>and</strong> Oecanthusbil<strong>in</strong>eatus may be dist<strong>in</strong>guished from the other 2 species <strong>in</strong> that theypossess a black spot on the <strong>in</strong>ner face <strong>of</strong> both the first <strong>and</strong> secondantennal segments (Chopard 1969; fig. 1, table 1). <strong>The</strong> spots <strong>of</strong> O.bil<strong>in</strong>eatus were, however, dist<strong>in</strong>ct from those <strong>of</strong> O. henryi <strong>in</strong> be<strong>in</strong>gsurrounded by a white rim (Fig.1). In addition, O. bil<strong>in</strong>eatus maybe dist<strong>in</strong>guished from O. henryi because the former possess a middorsalwhite stripe (flanked by f<strong>in</strong>e black l<strong>in</strong>es) on the head <strong>and</strong>pronotum (Chopard 1969). Oecanthus bil<strong>in</strong>eatus is also dist<strong>in</strong>ct fromall the other species <strong>in</strong> that males have a pair <strong>of</strong> closely spaced blackspots on the elytra near the anal knot (Chopard 1969). Oecanthushenryi does not possess a mid-dorsal stripe on the head or thoraxbut may be dist<strong>in</strong>guished by the presence <strong>of</strong> a black spot at the base<strong>of</strong> each <strong>of</strong> the 6 tibiae (Chopard 1969). Oecanthus rufescens can bedist<strong>in</strong>guished from Oecanthus <strong>in</strong>dicus by the row <strong>of</strong> mid-dorsal spotsalong the length <strong>of</strong> the abdomen (Otte & Alex<strong>and</strong>er 1983; fig. 1,table 1).Body colour did not always provide a reliable clue to speciesidentity: specimens <strong>of</strong> O. henryi were always light green, whereasthose <strong>of</strong> O. rufescens were always brown. Both O. bil<strong>in</strong>eatus <strong>and</strong> O.<strong>in</strong>dicus did, however, occur <strong>in</strong> both green <strong>and</strong> brown forms. <strong>The</strong>states or values <strong>of</strong> important dist<strong>in</strong>guish<strong>in</strong>g <strong>morphological</strong> features<strong>of</strong> the 4 species are shown <strong>in</strong> Table 1. O. rufescens <strong>and</strong> O.<strong>in</strong>dicuswere larger <strong>in</strong> size than O. bil<strong>in</strong>eatus <strong>and</strong> O. henryi (Table 1). <strong>The</strong>rewere no significant differences between the sexes <strong>in</strong> body <strong>and</strong> elytrallength <strong>in</strong> any <strong>of</strong> the species other than O. <strong>in</strong>dicus, <strong>in</strong> which maleswere significantly larger than females (Table 1).As is typical <strong>in</strong> s<strong>in</strong>g<strong>in</strong>g species <strong>of</strong> gryllids, however, male elytrashowed a number <strong>of</strong> specialisations absent <strong>in</strong> the female: the occurrence<strong>of</strong> specialised resonat<strong>in</strong>g structures such as the harp <strong>and</strong>mirror on the dorsal field, <strong>and</strong> the stridulatory structures, <strong>in</strong>clud<strong>in</strong>gthe plectrum <strong>and</strong> file (Fig. 2). Except for size differences, the overallstructure <strong>of</strong> the elytra was remarkably similar between males <strong>of</strong>the 4 species (Fig. 2). O. rufescens had a significantly higher elytralwidth <strong>and</strong> mirror area than O. <strong>in</strong>dicus , <strong>and</strong> O. bil<strong>in</strong>eatus had a significantlyhigher elytral width <strong>and</strong> mirror area than O. henryi (Table1). <strong>The</strong> length <strong>of</strong> the stridulatory file was not significantly differentbetween O. henryi <strong>and</strong> O. bil<strong>in</strong>eatus, whereas that <strong>of</strong> O. <strong>in</strong>dicus wassignificantly higher than O. bil<strong>in</strong>eatus <strong>and</strong> O. henryi (Table 1). <strong>The</strong>mean number <strong>of</strong> pegs on the stridulatory file was not significantlydifferent between O. henryi <strong>and</strong> O. bil<strong>in</strong>eatus (Table 1). <strong>The</strong> meannumber <strong>of</strong> stridulatory pegs <strong>in</strong> O. <strong>in</strong>dicus was, however, significantlylower than <strong>in</strong> O. rufescens (Table 1). <strong>The</strong> morphology <strong>of</strong> the pegs wasexam<strong>in</strong>ed us<strong>in</strong>g scann<strong>in</strong>g electron microscopy (Fig. 3): peg structurewas essentially identical <strong>in</strong> all the 4 species (data shown only for O.rufescens), with <strong>in</strong>dividual pegs oriented at right angles to the file.<strong>The</strong> ventral surfaces <strong>of</strong> the pegs were rippled (Fig. 3c) <strong>and</strong> the pegsevenly spaced along the length <strong>of</strong> the file. <strong>The</strong> ultrastructure <strong>of</strong> thepegs <strong>in</strong> Oecanthus is very dist<strong>in</strong>ctive from that <strong>of</strong> field crickets <strong>of</strong>the sub-family Gryll<strong>in</strong>ae (Walker & Carlysle 1975).<strong>The</strong> metanotal or Hancock’s gl<strong>and</strong>, found only <strong>in</strong> male treeTable 1. Dist<strong>in</strong>ctive <strong>morphological</strong> <strong>characters</strong> <strong>of</strong> the 4 Oecanthus species.Character/Species O. henryi O. bil<strong>in</strong>eatus O. <strong>in</strong>dicus O. rufescensMales <strong>and</strong> females (n = 12 specimens)1 Black spot on antennal scape <strong>and</strong> pedicel Present Present Absent Absent2 Mid-dorsal stripe on head <strong>and</strong> thorax Absent Present Absent Absent3 Black spot at the base <strong>of</strong> the tibia Present Absent Absent Absent4 Row <strong>of</strong> brown spots on abdomen Absent Absent Absent Present5 Scutal tubercle <strong>of</strong> metanotal gl<strong>and</strong> Mushroom shaped Absent Dumb-bell shaped Bud-likeMales (n = 10 specimens) Mean + s Mean + s Mean + s Mean + s6 Body length 12.42 + 0.73 11.64 + 0.84 15.32 + 1.03* 16.42 + 1.167 Elytral length 9.72 + 0.60 9.94 + 0.35 13.05 + 0.62* 13.91 + 0.36*8 Elytral width (maximum) 3.04 + 0.15 3.57 + 0.17* 4.12 + 0.03* 4.87 + 0.02*9 Mirror area 9.67 + 1.13 12.6 + 1.25* 19.23 + 2.44* 23.78 + 2.98*10 Length <strong>of</strong> stridulatory file 1.13 + 0.07 1.15 + 0.05 1.55 + 0.10* 1.64 + 0.1011 Number <strong>of</strong> stridulatory pegs on file 32.4 + 0.84 33 + 0.47 36 + 1.80* 43.3 + 2.31*12 Length <strong>of</strong> posterior tympanum 1.02 + 0.08 0.66 + 0.18* 1.15 + 0.07* 0.99 + 0.09*13 Width <strong>of</strong> posterior tympanum (maximum) 0.26 + 0.05 0.21 + 0.02* 0.35 + 0.04* 0.26 + 0.05*14 Length <strong>of</strong> anterior tympanum 1.05 + 0.12 0.86 + 0.13* 1.17 + 0.1* 0.99 + 0.06*15 Width <strong>of</strong> anterior tympanum (maximum) 0.27 + 0.05 0.235 + 0.1* 0.395 + 0.04* 0.3 + 0.04*16 Width <strong>of</strong> scutum (metanotal gl<strong>and</strong>) 1.48 + 0.1 1.71 + 0.09* 1.8 + 0.09 1.87 + 0.117 Length <strong>of</strong> scutum (metanotal gl<strong>and</strong>) 0.74 + 0.13 1.01 + 0.07* 0.82 + 0.08* 0.61 + 0.07*18 Width <strong>of</strong> scutellum (metanotal gl<strong>and</strong>) 1.22 + 0.04 1.4 + 0.07* 1.42 + 0.06 1.41 + 0.0919 Length <strong>of</strong> scutellum (meatanotal gl<strong>and</strong>) 1.03 + 0.1 0.81 + 0.06* 1.29 + 0.09* 1.21 + 0.09Females (n = 2 specimens)1 Body length 12.5 + 0.70 11.8 + 1.13 13 + 0.01 16.55 + 0.07*2 Elytral length 9.65 + 0.49 10.65 + 0.212 11.5 + 0.70 13 + 03 Length <strong>of</strong> ovipositor 5.1 + 0.14 4.35 + 0.21 5.75 + 0.07 6.05 + 0.21All size measurements are <strong>in</strong> mm (or mm 2 ); asterisks <strong>in</strong>dicate statistically significant differences <strong>in</strong> mean values from the species <strong>in</strong> the column to theleft at a significance level <strong>of</strong> alpha = 0.01 (<strong>in</strong>dependent samples t-tests).JOURNAL OF ORTHOPTERA RESEARCH 2005, 14(1)
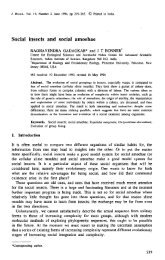
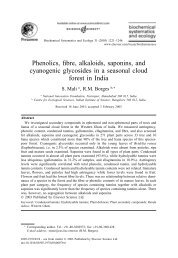
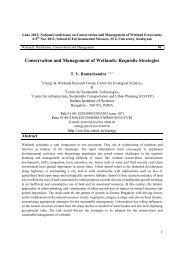
Fig. 1. Dist<strong>in</strong>guish<strong>in</strong>g <strong>morphological</strong> features <strong>of</strong> the 4 Oecanthusspecies. A-D, dorsal view <strong>of</strong> head <strong>and</strong> thorax. A) O. henryi, B) O.bil<strong>in</strong>eatus, C) O. rufescens, <strong>and</strong> D) O. <strong>in</strong>dicus; E,F, dorsal view <strong>of</strong>abdomen. E) O. rufescens <strong>and</strong> F) O. <strong>in</strong>dicus.crickets, is also an important taxonomic character (Walker & Gurney1967, Chopard 1969). Exam<strong>in</strong>ation <strong>of</strong> the structure <strong>of</strong> themetanotal gl<strong>and</strong>s revealed clear dist<strong>in</strong>guish<strong>in</strong>g features betweenthe 4 species (Fig. 4). <strong>The</strong> absence <strong>of</strong> the posterior median lobe <strong>and</strong>gl<strong>and</strong>ular pit <strong>of</strong> the scutum (term<strong>in</strong>ology from Walker & Gurney1967, Chopard 1969) dist<strong>in</strong>guished O. bil<strong>in</strong>eatus from the other 3species. Instead, O. bil<strong>in</strong>eatus possessed 2 sets <strong>of</strong> prom<strong>in</strong>ent setaethat projected backwards from the posterior marg<strong>in</strong> <strong>of</strong> the scutum.In dorsal view, the shape <strong>of</strong> the tubercle <strong>of</strong> the posterior medianlobe <strong>of</strong> the scutum was characteristic <strong>in</strong> each <strong>of</strong> the other 3 species,be<strong>in</strong>g mushroom-like <strong>in</strong> O. henryi, bud-shaped with a r<strong>in</strong>g <strong>of</strong> setaeMETRANI AND BALAKRISHNAN 9JOURNAL OF ORTHOPTERA RESEARCH 2005, 14(1)<strong>in</strong> O. rufescens, <strong>and</strong> flattened <strong>and</strong> dumb-bell shaped <strong>in</strong> O. <strong>in</strong>dicus(Fig. 4). With respect to quantitative <strong>characters</strong>, O. bil<strong>in</strong>eatus hada significantly larger scutum but shorter scutellum than O. henryi(Table 1); O. rufescens could be dist<strong>in</strong>guished from O. <strong>in</strong>dicus onlyon the basis <strong>of</strong> scutal length (Table 1).Structure <strong>of</strong> the call<strong>in</strong>g <strong>song</strong>s <strong>of</strong> the 4 Oecanthus speciesAll 4 Oecanthus species were found to be sympatric <strong>in</strong> areas <strong>of</strong>natural vegetation <strong>in</strong> <strong>and</strong> around Bangalore. Adults <strong>of</strong> O. henryi,O. <strong>in</strong>dicus <strong>and</strong> O. rufescens were most abundant dur<strong>in</strong>g the periodfrom October to February, whereas O. bil<strong>in</strong>eatus was most abundantbetween June <strong>and</strong> September. <strong>The</strong> preferred microhabitats were alsodifferent: O. bil<strong>in</strong>eatus preferred higher call<strong>in</strong>g sites <strong>in</strong> trees, whereasO. rufescens was usually found <strong>in</strong> dry, grassy areas. O. henryi <strong>and</strong> O.<strong>in</strong>dicus were found on bushes, with <strong>in</strong>dividual males <strong>of</strong>ten s<strong>in</strong>g<strong>in</strong>gat the same time on adjacent bushes. <strong>The</strong> peak period <strong>of</strong> call<strong>in</strong>gactivity for all the species was from 7 p.m. to 10 p.m.<strong>The</strong> call<strong>in</strong>g <strong>song</strong>s <strong>of</strong> O. henryi were the most regular, with shortchirps repeated once or twice per second, each chirp be<strong>in</strong>g composed<strong>of</strong> 11 to 17 syllables (Fig. 5). <strong>The</strong> <strong>song</strong>s <strong>of</strong> O. <strong>in</strong>dicus were highlyvariable <strong>in</strong> call length, rang<strong>in</strong>g from short chirps to long, irregulartrills (even with<strong>in</strong> <strong>in</strong>dividual s<strong>in</strong>g<strong>in</strong>g bouts). Oecanthus bil<strong>in</strong>eatus<strong>and</strong> Oecanthus rufescens both produced regular trills: whereas theformer were usually 1 to 2 s <strong>in</strong> length, those <strong>of</strong> O. rufescens <strong>of</strong>tencont<strong>in</strong>ued un<strong>in</strong>terrupted for 10 to 50 s (Fig. 5).S<strong>in</strong>ce temperature is known to affect several <strong>of</strong> the features <strong>of</strong> treecricket call<strong>in</strong>g <strong>song</strong>s (Walker 1962a), its effect on 4 <strong>song</strong> features,namely syllable repetition rate, call (chirp or trill) repetition rate, callduration <strong>and</strong> carrier frequency was exam<strong>in</strong>ed us<strong>in</strong>g a l<strong>in</strong>ear regressionanalysis for 3 <strong>of</strong> the 4 species. Oecanthus bil<strong>in</strong>eatus could notbe analysed s<strong>in</strong>ce s<strong>in</strong>g<strong>in</strong>g males only occurred dur<strong>in</strong>g the monsoonmonths when the variation <strong>in</strong> ambient temperature was low. Analysis<strong>of</strong> the <strong>song</strong> structure <strong>of</strong> the 3 species over the temperature range 17to 29° C revealed several <strong>in</strong>terest<strong>in</strong>g features (Fig. 6). O. rufescenshad the longest call durations rang<strong>in</strong>g from 1 to 50 s, whereas O.henryi had the shortest calls (0.18 to 0.34 s). Oecanthus <strong>in</strong>dicus hadcalls that were, on average, longer (0.33 to 1.34 s) than those <strong>of</strong> O.henryi. As expected from the long call durations, the call repetitionrate <strong>of</strong> O. rufescens was the lowest (0.02 to 0.55 Hz). Interest<strong>in</strong>gly,both O. henryi <strong>and</strong> O. <strong>in</strong>dicus had similar call repetition rates (1 to2 Hz) despite the fact that the calls <strong>of</strong> O. <strong>in</strong>dicus were on averagelonger than those <strong>of</strong> O. henryi. Call duration was not correlatedwith temperature <strong>in</strong> O. rufescens <strong>and</strong> O. <strong>in</strong>dicus (P = 0.37 <strong>and</strong> 0.22respectively), whereas call duration <strong>in</strong> O. henryi showed a significantdecrease with <strong>in</strong>crease <strong>in</strong> temperature (P = 0.002). In O. rufescens,call repetition rate was also not correlated with temperature (P =0.87), whereas this feature showed a l<strong>in</strong>ear <strong>in</strong>crease with temperatureat a rate <strong>of</strong> about 0.1 Hz per degree Celsius <strong>in</strong> both O. henryi <strong>and</strong>O. <strong>in</strong>dicus (P < 0.001 <strong>in</strong> both cases).O. <strong>in</strong>dicus showed the lowest syllable repetition rate (35 to 54 Hz);that <strong>of</strong> O. rufescens ranged from 38 to 65 Hz, whereas O. henryi hada slightly higher syllable repetition rate (44 to 68 Hz) overlapp<strong>in</strong>gwith that <strong>of</strong> O. rufescens. Over the temperature range 22 to 25°C,O. bil<strong>in</strong>eatus had the highest syllable repetition rate <strong>of</strong> the 4 species(mean = 67.5 Hz). As expected, syllable repetition rate showed arelatively steep l<strong>in</strong>ear <strong>in</strong>crease with temperature (1.5 to 2.0 Hz per°C), <strong>in</strong> all 3 species exam<strong>in</strong>ed (P < 0.0001 <strong>in</strong> all cases).<strong>The</strong> carrier frequencies <strong>of</strong> O. rufescens (2.9 to 4.0 kHz) <strong>and</strong> O.bil<strong>in</strong>eatus (3.7 kHz at 22°C) were, on average, about 1 kHz higherthan those <strong>of</strong> O. henryi (2.4 to 3.3 kHz) <strong>and</strong> O. <strong>in</strong>dicus (2.2 to 2.8
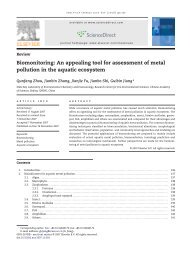
10METRANI AND BALAKRISHNANFig. 2. Ventral view <strong>of</strong> the right elytron. A) O. henryi, B) O. bil<strong>in</strong>eatus,C) O. rufescens, <strong>and</strong> D) O. <strong>in</strong>dicus. h = harp, l = lateral field,m = mirror.Fig. 3. Ultrastructure <strong>of</strong> the stridulatory file <strong>and</strong> pegs <strong>of</strong> O. rufescens.A) scann<strong>in</strong>g electron microscopic view <strong>of</strong> the stridulatory file, B)magnified view (× 500) to show the arrangement <strong>of</strong> pegs <strong>and</strong>, C)ultrastructure <strong>of</strong> a s<strong>in</strong>gle peg.JOURNAL OF ORTHOPTERA RESEARCH 2005, 14(1)
METRANI AND BALAKRISHNAN 11Fig. 4. Metanotal gl<strong>and</strong>s <strong>of</strong> the 4 Oecanthus species <strong>in</strong> dorsal view. A) O. bil<strong>in</strong>eatus, B) O. henryi, C) O. rufescens <strong>and</strong> D) O. <strong>in</strong>dicus. MagnificationA,B = 20 ×; C,D = 160×. PML = posterior median lobe <strong>of</strong> the scutum.kHz). <strong>The</strong> carrier frequencies <strong>of</strong> the 3 species exam<strong>in</strong>ed showeda significant l<strong>in</strong>ear <strong>in</strong>crease with temperature (P < 0.0001 <strong>in</strong> allcases), though the rates <strong>of</strong> <strong>in</strong>crease were slightly different for thethree species (Fig. 6).<strong>The</strong> call<strong>in</strong>g <strong>song</strong>s <strong>of</strong> O. henryi <strong>and</strong> O. <strong>in</strong>dicus showed overlap <strong>in</strong>the values <strong>of</strong> 3 <strong>of</strong> the 4 <strong>characters</strong> analysed: similar carrier frequencies<strong>and</strong> almost identical call repetition rates, <strong>and</strong> some overlap <strong>in</strong>call duration. <strong>The</strong> only feature with a non-overlapp<strong>in</strong>g distribution<strong>of</strong> values was the syllable repetition rate (Fig. 6).Multivariate analysesIn order to exam<strong>in</strong>e the <strong>utility</strong> <strong>of</strong> a numerical taxonomic approachto def<strong>in</strong><strong>in</strong>g species boundaries <strong>and</strong> <strong>in</strong> identification, wesubjected both the <strong>morphological</strong> <strong>and</strong> <strong>song</strong> <strong>characters</strong> <strong>of</strong> all thespecies to analysis us<strong>in</strong>g 2 multivariate statistical methods: UPGMAcluster<strong>in</strong>g <strong>and</strong> multi-dimensional scal<strong>in</strong>g (MDS). <strong>The</strong> qualitativeJOURNAL OF ORTHOPTERA RESEARCH 2005, 14(1)<strong>and</strong> quantitative <strong>morphological</strong> <strong>characters</strong> were analysed separately<strong>and</strong> compared with each other <strong>and</strong> with <strong>song</strong> <strong>characters</strong> <strong>in</strong> orderto determ<strong>in</strong>e the k<strong>in</strong>ds <strong>of</strong> <strong>characters</strong> that would be most effective<strong>in</strong> del<strong>in</strong>eat<strong>in</strong>g the species boundaries.Types <strong>of</strong> <strong>characters</strong>.—In the first round <strong>of</strong> analysis, we used themaximum number <strong>of</strong> <strong>characters</strong> measured for each type: 42 quantitative<strong>morphological</strong>, 12 qualitative <strong>morphological</strong> <strong>and</strong> 4 <strong>song</strong><strong>characters</strong>. <strong>The</strong> results <strong>of</strong> the cluster<strong>in</strong>g <strong>and</strong> ord<strong>in</strong>ation <strong>of</strong> thesethree data sets are shown <strong>in</strong> Fig. 7. All 3 sets <strong>of</strong> <strong>characters</strong> resulted<strong>in</strong> 4 discrete clusters correspond<strong>in</strong>g to the 4 known species whensubjected to either UPGMA cluster<strong>in</strong>g or multi-dimensional scal<strong>in</strong>g(Fig. 7). <strong>The</strong> fidelity <strong>of</strong> the cluster<strong>in</strong>g or ord<strong>in</strong>ation algorithm<strong>in</strong> its representation <strong>of</strong> the orig<strong>in</strong>al distance matrix was evaluatedus<strong>in</strong>g the co-phenetic correlation coefficient (r cs). Both cluster<strong>in</strong>g<strong>and</strong> ord<strong>in</strong>ation showed very high fidelity <strong>of</strong> representation (0.98 to0.99) <strong>in</strong> the case <strong>of</strong> qualitative <strong>morphological</strong> <strong>and</strong> <strong>song</strong> <strong>characters</strong>,
12METRANI AND BALAKRISHNANFig. 5. Temporal <strong>and</strong> spectral structure <strong>of</strong> the call<strong>in</strong>g <strong>song</strong>s <strong>of</strong> the 4 Oecanthus species represented by oscillograms <strong>and</strong> power spectra. A)O. henryi, B) O. bil<strong>in</strong>eatus, C) O. <strong>in</strong>dicus <strong>and</strong> D) O. rufescens. For each species, the uppermost oscillogram reveals the call structure (chirp/trill), the lower magnified view reveals the syllabic structure <strong>of</strong> the call <strong>and</strong> the power spectrum below shows the carrier frequency.JOURNAL OF ORTHOPTERA RESEARCH 2005, 14(1)
METRANI AND BALAKRISHNAN 13but multi-dimensional scal<strong>in</strong>g gave a far superior representation <strong>in</strong>the case <strong>of</strong> quantitative <strong>morphological</strong> <strong>characters</strong> (Table 2).In the case <strong>of</strong> 42 quantitative <strong>morphological</strong> <strong>characters</strong> (Fig.7A,B), <strong>in</strong>ternal allocation <strong>of</strong> each <strong>of</strong> the 40 <strong>in</strong>dividuals (Table 2)resulted <strong>in</strong> 100% (10 out <strong>of</strong> 10) correct species allocation <strong>of</strong> O.bil<strong>in</strong>eatus <strong>and</strong> O. <strong>in</strong>dicus, <strong>and</strong> 90% (9 out <strong>of</strong> 10) correct allocation<strong>of</strong> O. henryi with both cluster<strong>in</strong>g <strong>and</strong> MDS. O. rufescens was, however,100% correctly allocated us<strong>in</strong>g MDS whereas there was onemisallocation us<strong>in</strong>g the cluster<strong>in</strong>g algorithm. External allocation <strong>of</strong>10 new O. <strong>in</strong>dicus <strong>and</strong> O. henryi males, <strong>and</strong> 9 O. rufescens resulted<strong>in</strong> 100% correct allocation <strong>of</strong> O. <strong>in</strong>dicus <strong>and</strong> O. henryi us<strong>in</strong>g MDS(Table 2). External allocation us<strong>in</strong>g cluster<strong>in</strong>g was less successful,with only 40 to 50% correct allocation <strong>of</strong> O. <strong>in</strong>dicus <strong>and</strong> O. rufescens,<strong>and</strong> 80% correct allocation <strong>of</strong> O. henryi.In the case <strong>of</strong> the 12 qualitative <strong>morphological</strong> <strong>characters</strong> (Fig.7C,D), <strong>in</strong>ternal allocation <strong>of</strong> each <strong>of</strong> the 40 <strong>in</strong>dividuals resulted <strong>in</strong>100% correct allocation (10 out <strong>of</strong> 10) for all 4 species us<strong>in</strong>g boththe cluster<strong>in</strong>g <strong>and</strong> the MDS methods (Table 2). In external allocationalso, there was100% correct species allocation <strong>of</strong> the 3 speciesexam<strong>in</strong>ed us<strong>in</strong>g both cluster<strong>in</strong>g <strong>and</strong> ord<strong>in</strong>ation.In the case <strong>of</strong> the clusters <strong>and</strong> ord<strong>in</strong>ations obta<strong>in</strong>ed us<strong>in</strong>g 4<strong>song</strong> <strong>characters</strong> (Fig. 7 E,F), there was aga<strong>in</strong> 100% correct <strong>in</strong>ternalallocation for each <strong>of</strong> the 4 species with both methods. <strong>The</strong> <strong>song</strong>s<strong>of</strong> 10 males (<strong>of</strong> each <strong>of</strong> the 3 species O. <strong>in</strong>dicus, O. henryi <strong>and</strong> O.rufescens) that had not been used to construct the species clusterswere employed, one at a time, for external allocation <strong>of</strong> speciesidentity. <strong>The</strong> cluster<strong>in</strong>g algorithm gave 100% correct allocation (10out <strong>of</strong> 10) <strong>in</strong> the case <strong>of</strong> O. henryi <strong>and</strong> O. <strong>in</strong>dicus, <strong>and</strong> 90% correctallocation (9 out <strong>of</strong> 10) <strong>in</strong> the case <strong>of</strong> O. rufescens (Table 2). <strong>The</strong>MDS technique yielded 100% correct allocation (10 out <strong>of</strong> 10) <strong>in</strong>the case <strong>of</strong> O. henryi <strong>and</strong> O. rufescens, <strong>and</strong> 90% correct allocation<strong>of</strong> O. <strong>in</strong>dicus.In summary, both the cluster<strong>in</strong>g <strong>and</strong> ord<strong>in</strong>ation techniqueswere 90 to 100% successful <strong>in</strong> achiev<strong>in</strong>g correct species allocation(with new specimens) <strong>in</strong> the case <strong>of</strong> <strong>song</strong> <strong>and</strong> qualitative <strong>characters</strong>.In the case <strong>of</strong> quantitative <strong>morphological</strong> <strong>characters</strong>, however, theMDS was superior <strong>and</strong> gave close to 100% correct allocation <strong>of</strong> newspecimens, whereas the cluster<strong>in</strong>g algorithm performed poorly for2 <strong>of</strong> the 3 species <strong>in</strong> external allocation (Table 2).Number <strong>of</strong> <strong>characters</strong>.—In the analyses described above, the number<strong>of</strong> <strong>characters</strong> <strong>in</strong> the 3 sets to be compared (quantitative <strong>morphological</strong>,qualitative <strong>morphological</strong> <strong>and</strong> <strong>song</strong>) were unequal, evenby an order <strong>of</strong> magnitude. In order to exam<strong>in</strong>e more closely theeffect <strong>of</strong> the number <strong>of</strong> <strong>characters</strong> on the efficacy <strong>of</strong> species group<strong>in</strong>g<strong>and</strong> allocation, <strong>in</strong> the next set <strong>of</strong> analyses we varied the number <strong>of</strong>quantitative <strong>and</strong> qualitative <strong>morphological</strong> <strong>characters</strong> used.Quantitative <strong>characters</strong>.— Cluster<strong>in</strong>g <strong>and</strong> MDS analyses were carriedout us<strong>in</strong>g 26, 12 <strong>and</strong> 4 r<strong>and</strong>omly picked quantitative <strong>morphological</strong><strong>characters</strong> from the total set <strong>of</strong> 42. This was repeated 10 times foreach <strong>of</strong> the sets. <strong>The</strong> results (<strong>in</strong> the form <strong>of</strong> one exemplar from eachset) are graphically illustrated <strong>in</strong> Fig. 8. A visual <strong>in</strong>spection suggestedthat the goodness <strong>of</strong> the clusters <strong>in</strong> both algorithms deterioratedwith a decrease <strong>in</strong> the number <strong>of</strong> <strong>characters</strong> used.To exam<strong>in</strong>e this more quantitatively, we calculated 1) the copheneticcorrelation coefficient r csbetween the orig<strong>in</strong>al distancematrix <strong>and</strong> the representation as a result <strong>of</strong> cluster<strong>in</strong>g or ord<strong>in</strong>ation<strong>and</strong> 2) the co-phenetic correlation coefficient between matricesrepresent<strong>in</strong>g 2 clusters or ord<strong>in</strong>ations, r c1c2(Sneath & Sokal 1973),<strong>of</strong> which one (the reference) was always the cluster or ord<strong>in</strong>ationthat resulted from the analysis <strong>of</strong> 42 quantitative <strong>morphological</strong><strong>characters</strong>. <strong>The</strong> mean value <strong>of</strong> r cs<strong>and</strong> r c1c2(based on 10 runs <strong>of</strong>cluster<strong>in</strong>g <strong>and</strong> ord<strong>in</strong>ation) was calculated <strong>in</strong> the case <strong>of</strong> 26, 12 <strong>and</strong>4 quantitative <strong>morphological</strong> <strong>characters</strong>.<strong>The</strong> results, summarised <strong>in</strong> Table 3, showed that the averagevalue <strong>of</strong> both r cs<strong>and</strong> r <strong>in</strong>creased with the number <strong>of</strong> r<strong>and</strong>omlyc1c2picked <strong>characters</strong> <strong>in</strong> both cluster<strong>in</strong>g <strong>and</strong> ord<strong>in</strong>ation. In other words,the fidelity with which the cluster<strong>in</strong>g or ord<strong>in</strong>ation represented theorig<strong>in</strong>al distance matrix <strong>in</strong>creased with the number <strong>of</strong> <strong>characters</strong>. <strong>The</strong>MDS technique was, however, consistently superior to the clusteranalysis <strong>in</strong> its fidelity to the orig<strong>in</strong>al distance matrix (Table 3). <strong>The</strong>clusters or ord<strong>in</strong>ations also became progressively more similar tothe pattern produced by 42 <strong>characters</strong>, with r c1c2<strong>in</strong>creas<strong>in</strong>g froman average <strong>of</strong> 0.64 for 4 <strong>characters</strong> to 0.95 for 26 <strong>characters</strong> <strong>in</strong> thecase <strong>of</strong> cluster<strong>in</strong>g <strong>and</strong> from 0.75 to 0.97 <strong>in</strong> the case <strong>of</strong> MDS (Table3). In addition, the variation <strong>in</strong> both r cs<strong>and</strong> r c1c2decreased (shownTable 2. Internal <strong>and</strong> external allocation <strong>of</strong> <strong>in</strong>dividuals after cluster<strong>in</strong>g <strong>and</strong> ord<strong>in</strong>ation us<strong>in</strong>g different types <strong>of</strong> <strong>characters</strong>Type <strong>of</strong> characterUPGMA cluster analysisO. bil<strong>in</strong>eatus O. henryi O. <strong>in</strong>dicus O. rufescens rcsQuantitative <strong>morphological</strong> (n = 42) 10/10 9/10 (8/10) 10/10 (4/10) 9/10 (4/9) 0.86Qualitative <strong>morphological</strong> (n = 12) 10/10 10/10 (10/10) 10/10 (10/10) 10/10(9/9) 0.98Song (n = 4) 10/10 10/10 (10/10) 10/10 (10/10) 10/10 (9/10) 0.99Multi-dimensional scal<strong>in</strong>gQuantitative <strong>morphological</strong> (n = 42) 10/10 9/10 (10/10) 1010 (10/10) 10/10 (8/9) 0.98Qualitative <strong>morphological</strong> (n = 12) 10/10 10/10 (10/10) 10/10 (10/10) 10/10 (9/9) 0.98Song (n = 4) 10/10 10/10 (10/10) 10/10 (9/10) 10/10 (10/10) 0.99Numbers <strong>in</strong>dicate number <strong>of</strong> correctly allocated <strong>in</strong>dividuals for <strong>in</strong>ternal allocationNumbers <strong>in</strong> brackets <strong>in</strong>dicate number <strong>of</strong> correctly allocated <strong>in</strong>dividuals for external allocationNumber <strong>of</strong> <strong>in</strong>dividuals <strong>of</strong> each species used for <strong>in</strong>ternal allocation = 10Number <strong>of</strong> <strong>in</strong>dividuals used for external allocation with <strong>morphological</strong> <strong>characters</strong>: O. henryi = 10, O. <strong>in</strong>dicus = 10, O. rufescens = 9Number <strong>of</strong> <strong>in</strong>dividuals used for external allocation with <strong>song</strong> <strong>characters</strong>: O. henryi = 10, O. <strong>in</strong>dicus = 10, O. rufescens = 10r cs =cophenetic correlation coefficient between the orig<strong>in</strong>al distance matrix <strong>and</strong> the cophenetic distance matrix derived from the cluster or ord<strong>in</strong>ationJOURNAL OF ORTHOPTERA RESEARCH 2005, 14(1)
14METRANI AND BALAKRISHNANFig. 6. <strong>The</strong> effect <strong>of</strong> temperature on 4 different features <strong>of</strong> the call<strong>in</strong>g <strong>song</strong>s <strong>of</strong> the Oecanthus species. A) call duration, B) call repetitionrate, C) syllable repetition rate <strong>and</strong> D) carrier frequency . Syllable repetition rate <strong>and</strong> carrier frequency <strong>in</strong>creased significantly withtemperature for the 3 species analysed (see text for details). Note the logarithmic scale on the Y axes <strong>of</strong> graphs A <strong>and</strong> B.as the decrease <strong>in</strong> the range <strong>of</strong> values) with <strong>in</strong>creas<strong>in</strong>g numbers <strong>of</strong><strong>characters</strong>: with 26 quantitative <strong>characters</strong>, all 10 runs producedr csvalues greater than 0.8 [the value proposed by Sneath & Sokal(1973) as the m<strong>in</strong>imum for a good representation] <strong>and</strong> r c1c2valuesbetween 0.9 <strong>and</strong> 0.98.Internal allocation was carried out as described before on each<strong>of</strong> the 40 <strong>in</strong>dividuals <strong>of</strong> the 4 species for each <strong>of</strong> the sets <strong>of</strong> 10 runs.<strong>The</strong> results are summarised <strong>in</strong> Table 4, show<strong>in</strong>g the mean number<strong>of</strong> correct assignments (out <strong>of</strong> 10) for each species with decreas<strong>in</strong>gnumbers <strong>of</strong> <strong>characters</strong>: <strong>in</strong>terest<strong>in</strong>gly, 26 <strong>characters</strong> were as effectiveas 42, with a very small range <strong>of</strong> values <strong>of</strong> the number correctlyassigned <strong>in</strong> the 10 runs <strong>of</strong> r<strong>and</strong>omly picked variables. Whereas themean number <strong>of</strong> correct assignments still rema<strong>in</strong>ed fairly high (8 to9.5) even with only 4 <strong>characters</strong>, the range <strong>of</strong> values became large(from 2 to 10 for O. henryi or 5 to 10 for O. rufescens). <strong>The</strong> trendswere similar regardless <strong>of</strong> the method: both cluster<strong>in</strong>g <strong>and</strong> MDSgave similar results <strong>in</strong> this case.Thus, the identity <strong>of</strong> the <strong>characters</strong> picked probably became morecrucial as the number <strong>of</strong> <strong>characters</strong> for the analysis was decreased.To test this, we repeated the above analysis with a non-r<strong>and</strong>om set<strong>of</strong> 12 variables that happened to give 100% correct assignments.This set consisted almost exclusively <strong>of</strong> <strong>characters</strong> <strong>of</strong> the metanotalgl<strong>and</strong>, stridulatory structures <strong>and</strong> tympana. Four variables werer<strong>and</strong>omly picked from the above set 10 times <strong>and</strong> used for cluster<strong>in</strong>g<strong>and</strong> ord<strong>in</strong>ation. <strong>The</strong> result<strong>in</strong>g average co-phenetic correlationcoefficients r cs<strong>and</strong> r c1c2were both higher than <strong>in</strong> the case <strong>of</strong> fourvariables picked r<strong>and</strong>omly from the entire set <strong>of</strong> 42 (Table 3). <strong>The</strong>average number <strong>of</strong> correct allocations (Table 4) was also somewhathigher than <strong>in</strong> the case <strong>of</strong> 4 r<strong>and</strong>omly picked variables, though thedifferences appeared small.In the next analysis, we exam<strong>in</strong>ed whether the effectiveness <strong>of</strong>us<strong>in</strong>g a larger number <strong>of</strong> <strong>characters</strong> was expla<strong>in</strong>ed by the fact that it<strong>in</strong>creased the probability <strong>of</strong> choos<strong>in</strong>g crucial diagnostic <strong>characters</strong>.In order to test this, we dropped several <strong>of</strong> the diagnostic <strong>characters</strong><strong>of</strong> crickets that are typically species-specific, <strong>in</strong>clud<strong>in</strong>g those <strong>of</strong> themetanotal gl<strong>and</strong>, w<strong>in</strong>g <strong>and</strong> stridulatory structures, <strong>and</strong> measurements<strong>of</strong> tympana, many <strong>of</strong> which were used <strong>in</strong> classical taxonomy(Chopard 1969) <strong>and</strong> which were part <strong>of</strong> the above set <strong>of</strong> 12 <strong>characters</strong>JOURNAL OF ORTHOPTERA RESEARCH 2005, 14(1)
A BDimension 21.20.80.40.0-0.4-0.8HHH HHHHHDimension 1C DDimension 2E FDimension 2HMETRANI AND BALAKRISHNAN 151242 quantitative <strong>morphological</strong> <strong>characters</strong> 42 quantitative <strong>morphological</strong> <strong>characters</strong>RRR R10BRBRB BBB B BRR8RRIIIIII I I-1.2-1.6 -1.2 -0.8 -0.4 0.0 0.4 0.8 1.2 1.61.20.80.40.0-0.4-0.81.20.80.40.0-0.4-0.8-1.2RRRIIIIII I III IIIIRRRIH HH HHIIL<strong>in</strong>kage DistanceL<strong>in</strong>kage Distance432106420R R R R R R R R R R I I I I I I I I I I H B B B B B B B B B B H H H H H H H H H512 qualitative <strong>morphological</strong> <strong>characters</strong> 12 qualitative <strong>morphological</strong> <strong>characters</strong>RDimension 1HH H H HH HRR R RRR RRRRDimension 1BB BBBBBB-1.2-1.0 -0.6 -0.2 0.2 0.6 1.0 1.4 1.8B BBB4 quantitative <strong>song</strong> <strong>characters</strong>-1.6-1.6 -1.0 -0.4 0.2 0.8 1.4 2.0L<strong>in</strong>kage Distance4.03.53.02.52.01.51.00.50.0B B B B B B B B B B I I I I I I I I I I R R R R R R R R R R H H H H H H H H H H4 quantitative <strong>song</strong> <strong>characters</strong>B B B B B B B B B B R R R R R R R R R R I I I I I I I I I I H H H H H H H H H HFig. 7. Phenetic clusters <strong>of</strong> the 4 Oecanthus species obta<strong>in</strong>ed by multidimensional scal<strong>in</strong>g (left panels) <strong>and</strong> UPGMA cluster<strong>in</strong>g (rightpanels) us<strong>in</strong>g 42 quantitative <strong>morphological</strong> <strong>characters</strong> (A,B), 12 qualitative <strong>morphological</strong> <strong>characters</strong> (C,D) <strong>and</strong> 4 quantitative <strong>song</strong><strong>characters</strong> (E,F). B = O. bil<strong>in</strong>eatus, H = O. henryi, I = O. <strong>in</strong>dicus <strong>and</strong> R = O. rufescens. Each symbol represents an <strong>in</strong>dividual male.that could unambiguously dist<strong>in</strong>guish the 4 species. We then had aset <strong>of</strong> 25 general quantitative <strong>characters</strong> which we used to performcluster<strong>in</strong>g <strong>and</strong> ord<strong>in</strong>ation. Interest<strong>in</strong>gly, the clusters <strong>and</strong> ord<strong>in</strong>ationproduced by this set had high cophenetic correlation coefficients(cluster<strong>in</strong>g: r cs<strong>and</strong> r c1c2= 0.83 <strong>and</strong> 0.94 respectively; MDS: r cs<strong>and</strong>r c1c2= 0.95 <strong>and</strong> 0.94) <strong>and</strong> showed 80 to 100% correct <strong>in</strong>ternalallocation (Tables 3, 4).Qualitative <strong>characters</strong>.— Four qualitative <strong>characters</strong> were r<strong>and</strong>omlypicked from the set <strong>of</strong> 12 <strong>and</strong> the above analysis repeated 5 times.Internal allocation (Table 4) showed that whereas there was 100%correct assignment for O. bil<strong>in</strong>eatus, <strong>and</strong> 90 to 100% correct assignment<strong>of</strong> O. henryi us<strong>in</strong>g both methods, the assignments <strong>of</strong> O.<strong>in</strong>dicus <strong>and</strong> O. rufescens were not as successful, with a high variability<strong>in</strong> the number correctly assigned, particularly with the cluster<strong>in</strong>gtechnique.DiscussionUtility <strong>of</strong> the numerical taxonomic approach to species classification<strong>and</strong> identificationOur results clearly demonstrate the practical <strong>utility</strong> <strong>of</strong> a numericaltaxonomic approach to the classification <strong>and</strong> identification <strong>of</strong> species<strong>of</strong> the tree cricket genus Oecanthus from Southern India. BothUPGMA cluster analysis <strong>and</strong> multi-dimensional scal<strong>in</strong>g grouped theJOURNAL OF ORTHOPTERA RESEARCH 2005, 14(1)
16METRANI AND BALAKRISHNANADimension 21.41.00.60.2-0.2-0.6-1.0626 <strong>characters</strong> 26 <strong>characters</strong>RBB B BB BBB 1H HH2HHHHHHDimension 1IRII 3III I I-1.4-1.6 -1.2 -0.8 -0.4 0.0 0.4 0.8 1.2 1.6R4RR RRRIRIRBL<strong>in</strong>kage Distance543210R R R R R 4 R R R R R I I I I I I 3 I I I I H H H H H H 2 H H H H B B B B B B 1 B B B BC DDimension 21.41.00.60.2-0.2-0.6912 <strong>characters</strong> 12 <strong>characters</strong>R8BBBB1 BB BBHIH H 2HHHH H H HR RRRR4RRRI I3I II IIIIRL<strong>in</strong>kage Distance765432-1.0-1.6 -1.2 -0.8 -0.4 0.0 0.4 0.8 1.2 1.6Dimension 110R R R R R R R R 4 R R I I I I I I I I 3 I I H H H B B B B B B 1 B B B H H H H 2 H H H HEDimension 2F1.63.54 <strong>characters</strong> H H H4 <strong>characters</strong>3.01.02 HHI H HH2.5H0.4B BBI I2.0B 1 BIB BI I3 R-0.2I I I1.5R R 4 R IR-0.81.0R R RL<strong>in</strong>kage Distance-1.4-2.0 -1.5 -1.0 -0.5 0.0 0.5 1.0 1.5 2.0Dimension 1Fig. 8. Phenetic clusters <strong>of</strong> the 4 Oecanthus species obta<strong>in</strong>ed by multidimensional scal<strong>in</strong>g (left panels) <strong>and</strong> UPGMA cluster<strong>in</strong>g (rightpanels) us<strong>in</strong>g 26 (A,B), 12 (C,D) <strong>and</strong> 4 (E,F) r<strong>and</strong>omly chosen quantitative <strong>morphological</strong> <strong>characters</strong> out <strong>of</strong> the total set <strong>of</strong> 42 <strong>characters</strong>.Centroids <strong>of</strong> the 4 species clusters are designated as 1 (O. bil<strong>in</strong>eatus), 2 (O. henryi), 3 (O. <strong>in</strong>dicus) <strong>and</strong> 4 (O. rufescens). Otherabbreviations are the same as <strong>in</strong> Fig. 7.0.50.0H R R 4 R R R R R I I R R I I I R 3 I I I I I H H H H 2 H H H H H B B B B B B B 1 B B B40 <strong>in</strong>dividuals exam<strong>in</strong>ed <strong>in</strong>to 4 discrete clusters that correspondedwith the species groups based on classical taxonomy. Both clusteranalysis <strong>and</strong> MDS were comparable <strong>in</strong> their high fidelity <strong>of</strong> representation<strong>of</strong> the distance matrix <strong>and</strong> 90 to 100% correct allocation<strong>of</strong> new specimens us<strong>in</strong>g <strong>song</strong> <strong>and</strong> qualitative <strong>morphological</strong> <strong>characters</strong>.With quantitative <strong>morphological</strong> <strong>characters</strong>, however, MDSwas undoubtedly the better method, both due to its higher fidelity<strong>of</strong> representation <strong>of</strong> the data <strong>and</strong> the much higher percentage <strong>of</strong>correct species allocation <strong>of</strong> new specimens, <strong>and</strong> we advocate itsuse over cluster<strong>in</strong>g methods.Cluster<strong>in</strong>g techniques <strong>in</strong>herently impose hierarchical structures,whether or not they really exist, <strong>and</strong> may therefore not provide the bestrepresentation <strong>of</strong> the data (Sneath & Sokal 1973). Further, differentcluster<strong>in</strong>g algorithms may result <strong>in</strong> different cluster topologies forthe same data set, thus render<strong>in</strong>g phenetic cluster<strong>in</strong>g an unreliablemethod for the classification <strong>of</strong> higher level taxa (Ridley 1986).Multidimensional scal<strong>in</strong>g does not impose a hierarchical structure<strong>and</strong> is thus better suited to the problem <strong>of</strong> delimit<strong>in</strong>g species <strong>and</strong>allocat<strong>in</strong>g <strong>in</strong>dividuals to species based on these delimitations. <strong>The</strong>current study shows, however, that both phenetic cluster<strong>in</strong>g <strong>and</strong>ord<strong>in</strong>ation techniques are powerful <strong>in</strong> del<strong>in</strong>eat<strong>in</strong>g species boundariesthat are concordant with those based on morphology us<strong>in</strong>gclassical taxonomic methods.Numerical taxonomic methods are currently used largely <strong>in</strong>microbial classification (Sneath 1995), where phylogenetic trees<strong>and</strong> species boundaries may be difficult to <strong>in</strong>fer due to the fre-JOURNAL OF ORTHOPTERA RESEARCH 2005, 14(1)
METRANI AND BALAKRISHNAN 17Table 3. Cophenetic correlations <strong>in</strong> relation to the number <strong>of</strong> quantitative <strong>morphological</strong> <strong>characters</strong> used <strong>in</strong> the analysis.Number <strong>of</strong> <strong>characters</strong> UPGMA cluster analysis Multi-dimensional scal<strong>in</strong>gr csr c1c2r csr c1c226 (r<strong>and</strong>om) 0.84 (0.81 – 0.87) 0.95 (0.9 - 0.98) 0.97 (0.97 - 0.98) 0.97 (0.96 – 0.98)12 (r<strong>and</strong>om) 0.79 (0.58 – 0.86) 0.83 (0.74 – 0.97) 0.96 (0.93 - 0.97) 0.91 (0.87 – 0.95)4 (r<strong>and</strong>om) 0.75 (0.66 – 0.85) 0.64 (0.46 – 0.73) 0.91 (0.44 – 0.99) 0.75 (0.65 – 0.92)4 (non-r<strong>and</strong>om) 0.82 (0.74 – 0.9) 0.73 (0.54 – 0.85) 0.98 (0.89 – 1) 0.78 (0.70 – 0.83)25 (non-r<strong>and</strong>om) 0.83* 0.94* 0.95* 0.94*Numbers <strong>in</strong>dicate mean values (n = 10 runs); numbers <strong>in</strong> brackets <strong>in</strong>dicate the range <strong>of</strong> values; * = s<strong>in</strong>gle run.r cs =cophenetic correlation coefficient between the orig<strong>in</strong>al distance matrix <strong>and</strong> the cophenetic distance matrix derived from the cluster or ord<strong>in</strong>ation.r c1c2= correlation coefficient between two cophenetic distance matrices; <strong>in</strong> this case, the cophenetic matrix derived from each <strong>of</strong> the above runs wascompared with the cophenetic matrix derived from the cluster or ord<strong>in</strong>ation result<strong>in</strong>g from 42 quantitative <strong>characters</strong>.Table 4. Internal allocation <strong>of</strong> <strong>in</strong>dividuals after cluster<strong>in</strong>g <strong>and</strong> ord<strong>in</strong>ation us<strong>in</strong>g different numbers <strong>of</strong> <strong>morphological</strong> <strong>characters</strong>.UPGMA cluster analysisMulti-dimensional scal<strong>in</strong>gNumber <strong>of</strong> <strong>characters</strong> O. bil<strong>in</strong>eatus O. henryi O. <strong>in</strong>dicus O. rufescens O. bil<strong>in</strong>eatus O. henryi O. <strong>in</strong>dicus O. rufescens26 (r<strong>and</strong>om, qn)10(10 - 10)9.2(9 - 10)10(10 - 10)10(10 - 10)10(10 - 10)9.2(9 - 10)9.9(9 - 10)9.9(9 - 10)12 (r<strong>and</strong>om, qn)10(10 - 10)9.4(8 - 10)9.3(5 - 10)9.4(6 - 10)10(10 - 10)9.2(8 - 10)9(6 - 10)8.8(5 - 10)4 (r<strong>and</strong>om, qn)9.5(8 - 10)8(2 - 10)7.9(6 - 10)7.9(5 - 10)8.8(6 - 10)7.6(5 - 10)8.1(5 - 10)8.4(6 - 10)4 (non-r<strong>and</strong>om, qn)9.3(6 - 10)8.4(5 - 10)9.5(8 - 10)9.2(5 - 10)9.5(7 - 10)9.1(7 - 10)8.6(7 - 10)9.1(8 - 10)25 (non-r<strong>and</strong>om, qn) 10* 9* 10* 10* 10* 8* 9* 10*4 (r<strong>and</strong>om, ql)10(10 - 10)9(9 – 9)7.8(3 - 10)6.6(3 - 10)10(10 - 10)9.8(9 - 10)8.8(7 - 10)8.8(6 - 10)Total number <strong>of</strong> <strong>in</strong>dividuals <strong>of</strong> each species used for <strong>in</strong>ternal allocation = 10;Numbers <strong>in</strong>dicate mean values <strong>of</strong> number <strong>of</strong> correctly allocated <strong>in</strong>dividuals (n = 10 runs);Numbers <strong>in</strong> brackets <strong>in</strong>dicate the range <strong>of</strong> values (<strong>in</strong> ten runs) <strong>of</strong> correctly allocated <strong>in</strong>dividuals;* = s<strong>in</strong>gle run; qn = quantitative <strong>characters</strong>; ql = qualitative <strong>characters</strong>quent occurrence <strong>of</strong> reticulate transfer <strong>of</strong> genetic material. <strong>The</strong>setechniques are also used to delimit species <strong>in</strong> some plant taxa thatare characterised by extensive <strong>in</strong>ter-specific hybridization, where acladistic approach could be problematic (McDade 1992). Numericaltaxonomic methods were used by Blackith & Blackith (1968) <strong>in</strong> anattempt to provide a quantitative framework for the classification<strong>and</strong> rank<strong>in</strong>g <strong>of</strong> higher order taxa <strong>of</strong> orthopteroid <strong>in</strong>sects (<strong>in</strong>clud<strong>in</strong>gphasmids, dictyopterans <strong>and</strong> dermapterans). Otte (1994) appliedcluster analysis to morphometric data on male genitalic structuresto def<strong>in</strong>e the species groups <strong>of</strong> Hawaiian crickets <strong>of</strong> the GenusLaupala (Subfamily: Trigoniid<strong>in</strong>ae). To our knowledge, numericaltaxonomic methods have not so far been applied to the problem <strong>of</strong>species delimitation <strong>and</strong> identification <strong>in</strong> gryllid taxa. Although thisapproach has been successful with 4 species <strong>of</strong> the genus Oecanthus,we now aim to test it on a much larger taxon: the sub-family Gryll<strong>in</strong>ae,compris<strong>in</strong>g the field crickets, <strong>of</strong> which there are currently 130reported species from the Indian sub-cont<strong>in</strong>ent (Chopard 1969).JOURNAL OF ORTHOPTERA RESEARCH 2005, 14(1)Song <strong>and</strong> <strong>morphological</strong> <strong>characters</strong> as tools for the del<strong>in</strong>eation <strong>of</strong>species boundaries<strong>The</strong> traditional classification <strong>of</strong> most taxa, <strong>in</strong>clud<strong>in</strong>g gryllids,is based largely on <strong>morphological</strong> <strong>characters</strong>, both qualitative <strong>and</strong>quantitative. Chopard (1968) has provided the most extensiveclassification <strong>of</strong> gryllids worldwide, based on <strong>morphological</strong> <strong>characters</strong>,largely <strong>of</strong> museum specimens. <strong>The</strong> fact that the Oecanthusspecies delimited by us, us<strong>in</strong>g more quantitative methods <strong>and</strong> <strong>song</strong><strong>characters</strong> unavailable to him at the time, are concordant with thespecies that he def<strong>in</strong>ed, bear testimony to the rigour <strong>and</strong> <strong>in</strong>tuition<strong>of</strong> the classical taxonomist. In this context, we have ma<strong>in</strong>ta<strong>in</strong>edthe nomenclature <strong>of</strong> Chopard (1969) <strong>in</strong> our analysis, even thoughone <strong>of</strong> the 4 species <strong>of</strong> Oecanthus described there<strong>in</strong>, O. bil<strong>in</strong>eatus,bears some (but not all) <strong>characters</strong> <strong>in</strong> common with the new genusViphyus <strong>of</strong> African tree crickets (Toms & Otte 1988).<strong>The</strong> demonstration <strong>of</strong> the role <strong>of</strong> call<strong>in</strong>g <strong>song</strong>s <strong>in</strong> mediat<strong>in</strong>gpre-mat<strong>in</strong>g isolation between cricket species (Walker 1957) led to
18METRANI AND BALAKRISHNANtheir use as reliable <strong>characters</strong> for the taxonomic identification <strong>and</strong>classification <strong>of</strong> species (Walker 1962b, Otte & Alex<strong>and</strong>er 1983).<strong>The</strong> question <strong>of</strong> whether call<strong>in</strong>g <strong>song</strong> structure accurately reflectsdist<strong>in</strong>ct breed<strong>in</strong>g populations was explicitly tested by Shaw (1999)for the Hawaiian cricket species <strong>of</strong> the Genus Laupala (Subfamily:Trigoniid<strong>in</strong>ae) by exam<strong>in</strong><strong>in</strong>g the concordance between speciesboundaries implied by mitochondrial DNA haplotypes <strong>and</strong> thosedesignated on the basis <strong>of</strong> call<strong>in</strong>g <strong>song</strong> structure by Otte (1994).For 3 out <strong>of</strong> 4 sympatric, congeneric communities exam<strong>in</strong>ed <strong>in</strong>her study, there was concordance between the species boundariesdel<strong>in</strong>eated by the 2 types <strong>of</strong> <strong>characters</strong>.<strong>The</strong> classification <strong>and</strong> identification <strong>of</strong> tree cricket species aspractised by most taxonomists today typically uses a comb<strong>in</strong>ation<strong>of</strong> <strong>morphological</strong> <strong>and</strong> <strong>song</strong> <strong>characters</strong>, together with <strong>in</strong>formationon range <strong>and</strong> distribution (Walker 1962b, 1963; Toms & Otte 1988;Otte 1994). Morphological <strong>characters</strong> that are peculiar to stridulat<strong>in</strong>gspecies, such as the number <strong>of</strong> pegs <strong>and</strong> length <strong>of</strong> the stridulatoryfile, have proved to be good <strong>characters</strong> to delimit species (Walker1962b). Walker & Gurney (1967) also demonstrated the <strong>utility</strong> <strong>of</strong> themetanotal gl<strong>and</strong> <strong>in</strong> species identification <strong>of</strong> tree crickets. Genitaliausually provide excellent <strong>characters</strong> for cricket species identification(Chopard 1969) but this is not the case <strong>in</strong> tree crickets, where it hasbeen difficult to f<strong>in</strong>d <strong>characters</strong> that dist<strong>in</strong>guish congeneric species(Toms & Otte 1988). In our analysis, we have <strong>in</strong>corporated all <strong>of</strong>the above <strong>characters</strong> (except <strong>in</strong>formation on range <strong>and</strong> habitat) <strong>and</strong>tested the <strong>utility</strong> <strong>of</strong> <strong>song</strong> <strong>and</strong> <strong>morphological</strong> <strong>characters</strong> separately.Genitalic <strong>characters</strong> were not used largely because we <strong>in</strong>tend to developa classification scheme that may be used by non-taxonomists,<strong>and</strong> the dissection <strong>and</strong> analysis <strong>of</strong> <strong>in</strong>sect genitalia requires specialskills <strong>and</strong> knowledge.Our study shows that, us<strong>in</strong>g numerical taxonomic methods,both <strong>song</strong> <strong>and</strong> external <strong>morphological</strong> <strong>characters</strong> can provide highlevels <strong>of</strong> accuracy <strong>in</strong> species classification <strong>and</strong> identification. Song<strong>characters</strong> were very powerful <strong>in</strong> correctly delimit<strong>in</strong>g species: 4 <strong>song</strong><strong>characters</strong> could resolve the 4 species with 100% accuracy. In theallocation <strong>of</strong> new specimens also, <strong>song</strong> <strong>characters</strong> correctly allocatedall specimens <strong>in</strong> 2 <strong>of</strong> the 3 species exam<strong>in</strong>ed, <strong>and</strong> misallocated justone specimen <strong>in</strong> the 3 rd species. Qualitative <strong>morphological</strong> <strong>characters</strong>were superior to quantitative ones for species delimitation <strong>in</strong> thisgroup <strong>of</strong> crickets. Quantitative <strong>morphological</strong> <strong>characters</strong>, on theirown, also successfully del<strong>in</strong>eated species boundaries, provided alarge number <strong>of</strong> <strong>characters</strong> were used (greater than 25 <strong>in</strong> this case).Interest<strong>in</strong>gly, species boundaries were correctly del<strong>in</strong>eated even whenall <strong>of</strong> the diagnostic <strong>characters</strong> (<strong>in</strong>clud<strong>in</strong>g stridulatory structures,tympana <strong>and</strong> metanotal gl<strong>and</strong>) were excluded from the analysis,provided that a sufficient number <strong>of</strong> <strong>characters</strong> were <strong>in</strong>cluded.Concordance <strong>in</strong> species boundaries derived from <strong>song</strong> <strong>and</strong><strong>morphological</strong> <strong>characters</strong>In our analysis, clusters derived from <strong>morphological</strong> <strong>characters</strong>have been used to represent the phenetic (<strong>morphological</strong>) speciesconcept whereas those derived from <strong>song</strong> <strong>characters</strong> have beentreated as <strong>in</strong>dicative <strong>of</strong> species as def<strong>in</strong>ed by the biological speciesconcept (reproductive isolation: Mayr 1942). For crickets, thelatter assumption is probably justified, s<strong>in</strong>ce the species-specificcall<strong>in</strong>g <strong>song</strong>s are reliable <strong>in</strong>dicators <strong>of</strong> species identity (Cade 1985,Alex<strong>and</strong>er et al. 1997) <strong>and</strong> different <strong>song</strong> structures may be usedas legitimate substitutes for actual tests <strong>of</strong> reproductive isolationbetween species, particularly those <strong>in</strong> sympatry (Shaw 1999). Ourresults demonstrate the concordance <strong>in</strong> species boundaries providedby <strong>song</strong> <strong>and</strong> <strong>morphological</strong> <strong>characters</strong> <strong>in</strong> the genus Oecanthus,imply<strong>in</strong>g that the phenetic clusters based on morphology correctlyreflect the species boundaries def<strong>in</strong>ed by reproductive isolation <strong>in</strong>the tree cricket species <strong>in</strong>vestigated.Implications for the development <strong>of</strong> Web-based speciesidentification keys for gryllidsOur results with tree crickets provide one possible method,multivariate analysis, for accurate species-level identification us<strong>in</strong>gdifferent sets <strong>of</strong> <strong>characters</strong>. Parallel identification keys could bedeveloped us<strong>in</strong>g qualitative <strong>morphological</strong> <strong>characters</strong>, quantitative<strong>morphological</strong> <strong>characters</strong> <strong>and</strong> <strong>song</strong>. This opens up the possibility toidentify species based on <strong>song</strong> record<strong>in</strong>gs alone, field exam<strong>in</strong>ation<strong>of</strong> qualitative <strong>characters</strong> or a thorough exam<strong>in</strong>ation <strong>of</strong> quantitative<strong>morphological</strong> <strong>characters</strong>. Which option is exercised could dependon whether sampl<strong>in</strong>g is required to be non-<strong>in</strong>vasive (<strong>of</strong>ten the case<strong>in</strong> biodiversity surveys <strong>in</strong> protected areas) <strong>and</strong> on the time <strong>and</strong> facilitiesat h<strong>and</strong>. In the case <strong>of</strong> the Oecanthus species studied, <strong>song</strong><strong>and</strong> qualitative <strong>morphological</strong> <strong>characters</strong> were slightly superior toquantitative <strong>morphological</strong> <strong>characters</strong> <strong>in</strong> terms <strong>of</strong> accuracy <strong>of</strong> allocation,which could be another factor <strong>in</strong>fluenc<strong>in</strong>g the decisionon which <strong>characters</strong> to use to identify species. We prefer numericaltaxonomic methods for species-level identification s<strong>in</strong>ce they use alarge number <strong>of</strong> <strong>characters</strong> <strong>in</strong> a consistent, systematic <strong>and</strong> quantitativemanner <strong>and</strong> these can be easily adapted <strong>in</strong> the construction<strong>of</strong> taxonomic keys. <strong>The</strong>se methods need, however, to be testedwith more species-rich genera <strong>and</strong> different geographic variants <strong>of</strong>species, <strong>in</strong> order to confirm their general <strong>utility</strong> for gryllid speciesidentification.We believe that quantitative <strong>in</strong>formation on <strong>song</strong>s <strong>and</strong>morphology, <strong>in</strong>clud<strong>in</strong>g <strong>in</strong>ter-<strong>in</strong>dividual variation, if available on theInternet, would be more valuable for species-level identification thanthe qualitative <strong>in</strong>formation provided by images <strong>of</strong> type specimens<strong>and</strong> oscillograms (the latter be<strong>in</strong>g important supplements). Webbasedtaxonomic keys would also solve the problem <strong>of</strong> hav<strong>in</strong>g toidentify species <strong>in</strong> the absence <strong>of</strong> access to type specimens, s<strong>in</strong>ce theonus <strong>of</strong> type verification (for the sake <strong>of</strong> nomenclature) would be onthose who develop the databases <strong>and</strong> keys rather than on the users.Web-based taxonomic keys us<strong>in</strong>g numerical taxonomic methodscould provide an objective <strong>and</strong> quantitative method <strong>of</strong> perform<strong>in</strong>g,<strong>and</strong> evaluat<strong>in</strong>g the probability <strong>of</strong>, correct species identification.AcknowledgementsWe are grateful to a number <strong>of</strong> people who helped with <strong>song</strong>record<strong>in</strong>g, specimen collection <strong>and</strong> <strong>song</strong> analysis. Divya, B. U. <strong>and</strong>Savita Swamy obta<strong>in</strong>ed most <strong>of</strong> the record<strong>in</strong>gs <strong>and</strong> specimens; NatashaMhatre, Vivek Nityan<strong>and</strong>a <strong>and</strong> Swati Diwakar contributed alot to the <strong>song</strong> analysis; Geeta Nayak helped with data acquisition<strong>and</strong> organisation. Sayantan Biswas <strong>in</strong>itiated this study <strong>and</strong> carriedout some <strong>of</strong> the prelim<strong>in</strong>ary work <strong>and</strong> gave detailed commentson the manuscript. Many thanks to Saravanakumar for tak<strong>in</strong>g thephotographs <strong>in</strong> Fig. 1 <strong>and</strong> to Maneesha Inamdar <strong>of</strong> JNCASR forthe use <strong>of</strong> her optical microscope. We also thank the Solid StateChemistry Unit <strong>of</strong> the Indian Institute <strong>of</strong> Science for the use <strong>of</strong> boththeir optical microscope <strong>and</strong> their scann<strong>in</strong>g electron microscopefacility. This project was funded by the Department <strong>of</strong> Science <strong>and</strong>Technology, Government <strong>of</strong> India (Project No. SP/SO/C-50/98).JOURNAL OF ORTHOPTERA RESEARCH 2005, 14(1)
METRANI AND BALAKRISHNAN 19ReferencesAlex<strong>and</strong>er R.D., Marshall D.C. , Cooley J.R. 1997. Evolutionary perspectiveson <strong>in</strong>sect mat<strong>in</strong>g, pp. 4-31. In: Choe J. C. Crespi B. J. (Eds) <strong>The</strong> Evolution<strong>of</strong> Mat<strong>in</strong>g Systems <strong>in</strong> Insects <strong>and</strong> Arachnids. Cambridge University Press,Cambridge.Blackith R.E., Blackith R.M. 1968. A numerical taxonomy <strong>of</strong> orthopteroid<strong>in</strong>sects. Australian Journal <strong>of</strong> Zoology 16: 111-131.Cade W.H. 1985. Insect mat<strong>in</strong>g <strong>and</strong> courtship behavior, pp. 591-619. In: KerkutG. A., Gilbert L. I. (Eds) Comprehensive Insect Physiology, Biochemistry<strong>and</strong> Pharmacology, Volume 9. Pergamon Press, Oxford.Chopard L. 1932. <strong>The</strong> African species <strong>of</strong> the Genus Oecanthus, Serv. (Orth.Gryllidae). Stylops 1: 242-247.Chopard L. 1968. Gryllides. In: Beier M. (Ed.) Orthopterum catalogus. Pars.12. W. Junk, Gravenhage.Chopard L. 1969. <strong>The</strong> Fauna <strong>of</strong> India <strong>and</strong> the Adjacent Countries: OrthopteraVolume 2. Baptist Mission Press, Calcutta.Gaston K.J., May R.M. 1992. Taxonomy <strong>of</strong> taxonomists. Nature 356: 281-282.Godfray H.C.J. 2002. Challenges for taxonomy. Nature 417: 17-19.Ingrisch S., Shishodia M.S. 1998. New species <strong>and</strong> records <strong>of</strong> Tettigoniidae fromIndia (Ensifera). Mitteilungen der Schweizerischen EntomologischenGesellschaft 71: 355-371.Mallet J., Willmott K. 2003. Taxonomy: renaissance or Tower <strong>of</strong> Babel?Trends <strong>in</strong> Ecology <strong>and</strong> Evolution 18: 57-59.Manly B.F.J. 1986. Multivariate Statistical Methods. Chapman <strong>and</strong> Hall,London.Mayr E. 1942. Systematics <strong>and</strong> the Orig<strong>in</strong> <strong>of</strong> Species from the Viewpo<strong>in</strong>t <strong>of</strong>a Zoologist. Columbia University Press: New York.Mayr E. 1976. Typological versus population th<strong>in</strong>k<strong>in</strong>g. In: Evolution <strong>and</strong>the Diversity <strong>of</strong> Life. Belknap Press, Harvard University, Cambridge,Massachusetts.McDade L.A. 1992. Hybrids <strong>and</strong> phylogenetic systematics II. <strong>The</strong> impact <strong>of</strong>hybrids on cladistic analysis. Evolution 46: 1329-1346.Otte D., Alex<strong>and</strong>er R.D. 1983. <strong>The</strong> Australian Crickets. Monograph No. 22.<strong>The</strong> Academy <strong>of</strong> Natural Sciences <strong>of</strong> Philadelphia. Allen Press, Kansas.Otte D. 1994. <strong>The</strong> Crickets <strong>of</strong> Hawaii: Orig<strong>in</strong>, Systematics <strong>and</strong> Evolution.<strong>The</strong> Orthopterists’ Society, Academy <strong>of</strong> Natural Sciences <strong>of</strong> Philadelphia,Pennsylvania, USA.Otte D., Naskrecki P. 1997. Orthoptera Species Onl<strong>in</strong>e. http://viceroy.eeb.uconn.edu/OrthopteraRidley M. 1986. Evolution <strong>and</strong> Classification. Longman Group Limited,London <strong>and</strong> New York.S<strong>and</strong>rasagara T.R. 1954. Checklist <strong>of</strong> the Tridactylidae <strong>and</strong> Gryllidae (Insecta,Orthoptera) <strong>of</strong> Ceylon, with records <strong>of</strong> distribution. Journal <strong>of</strong> theBombay Natural History Society 52: 540-562.Shaw K.L. 1999. A nested analysis <strong>of</strong> <strong>song</strong> groups <strong>and</strong> species boundaries<strong>in</strong> the Hawaiian cricket Genus Laupala. Molecular Phylogenetics <strong>and</strong>Evolution 11: 332-341.Sneath P.H.A., Sokal R.R. 1973. Numerical Taxonomy. W.H. Freeman <strong>and</strong>Company, San Francisco.Sneath P.H.A. 1995. Thirty years <strong>of</strong> numerical taxonomy. Systematic Biology44: 281-298.Toms R.B., Otte D. 1988. New genera, species <strong>and</strong> records <strong>of</strong> East <strong>and</strong> SouthAfrican tree crickets (Orthoptera: Gryllidae: Oecanth<strong>in</strong>ae). Annals <strong>of</strong> theTransvaal Museum 34: 469-521.Walker T.J. 1957. Specificity <strong>in</strong> the response <strong>of</strong> female tree crickets (Orthoptera,Gryllidae, Oecanth<strong>in</strong>ae) to call<strong>in</strong>g <strong>song</strong>s <strong>of</strong> the males. Annals <strong>of</strong> theEntomological Society <strong>of</strong> America 50: 626-636.Walker T.J. 1962a. Factors responsible for <strong>in</strong>traspecific variation <strong>in</strong> the call<strong>in</strong>g<strong>song</strong>s <strong>of</strong> crickets. Evolution 16: 407-428.Walker T.J. 1962b. <strong>The</strong> taxonomy <strong>and</strong> call<strong>in</strong>g <strong>song</strong>s <strong>of</strong> United States treecrickets (Orthoptera: Gryllidae: Oecanth<strong>in</strong>ae). I. <strong>The</strong> Genus Neoxabea<strong>and</strong> the niveus <strong>and</strong> varicornis groups <strong>of</strong> the Genus Oecanthus. Annals <strong>of</strong>the Entomological Society <strong>of</strong> America 55: 303-322.Walker T.J. 1963. <strong>The</strong> taxonomy <strong>and</strong> call<strong>in</strong>g <strong>song</strong>s <strong>of</strong> United States treecrickets (Orthoptera: Gryllidae: Oecanth<strong>in</strong>ae). II. <strong>The</strong> nigricornis group<strong>of</strong> the Genus Oecanthus. Annals <strong>of</strong> the Entomological Society <strong>of</strong> America56: 772-789.Walker T.J., Gurney A.B. 1967. <strong>The</strong> metanotal gl<strong>and</strong> as a taxonomic character<strong>in</strong> Oecanthus <strong>of</strong> the United States. Proceed<strong>in</strong>gs <strong>of</strong> the EntomologicalSociety <strong>of</strong> Wash<strong>in</strong>gton 69: 157-161.Walker T.J., Carlysle T.C. 1975. Stridulatory file teeth <strong>in</strong> crickets: taxonomic<strong>and</strong> acoustic implications (Orthoptera: Gryllidae). International Journal<strong>of</strong> Morphology <strong>and</strong> Embryology 4: 151-158.JOURNAL OF ORTHOPTERA RESEARCH 2005, 14(1)
20METRANI AND BALAKRISHNANAppendix 1. List <strong>of</strong> <strong>morphological</strong> <strong>characters</strong> used <strong>in</strong> the multivariate analysisQuantitative <strong>characters</strong>1 Body length (head to abdom<strong>in</strong>al tip) 22 Number <strong>of</strong> tibial denticles (<strong>in</strong>ner)2 Length <strong>of</strong> fifth segment <strong>of</strong> maxillary palp 23 Length <strong>of</strong> the longest tibial spur3 Length <strong>of</strong> fourth segment <strong>of</strong> maxillary palp. 24 Length <strong>of</strong> the elytron4 Length <strong>of</strong> third segment <strong>of</strong> maxillary palp. 25 Breadth <strong>of</strong> the dorsal field <strong>of</strong> elytron5 Pronotum width (m<strong>in</strong>imum) 26 Length <strong>of</strong> the h<strong>in</strong>d w<strong>in</strong>g6 Pronotum width (maximum) 27 Length <strong>of</strong> the abdom<strong>in</strong>al cercus7 Pronotum length 28 Maximum width <strong>of</strong> abdom<strong>in</strong>al cercus8 Anterior tibia length 29 Scutum width (metanotal gl<strong>and</strong>)9 Anterior tibia breadth (m<strong>in</strong>) 30 Scutellum width (metanotal gl<strong>and</strong>)10 Anterior tibia breadth (max) 31 Scutum length (metanotal gl<strong>and</strong>)11 Posterior tympanum length 32 Scutellum length (metanotal gl<strong>and</strong>)12 Posterior tympanum breadth 33 Width <strong>of</strong> posterior median lobe <strong>of</strong> metanotal gl<strong>and</strong>13 Anterior tympanum length 34 Groove width <strong>of</strong> metanotal gl<strong>and</strong>.14 Anterior tympanum breadth 35 Groove length <strong>of</strong> metanotal gl<strong>and</strong>15 Maximum width <strong>of</strong> the posterior femur 36 Tubercle width <strong>of</strong> metanotal gl<strong>and</strong>16 Length <strong>of</strong> the posterior femur 37 Tubercle length <strong>of</strong> metanotal gl<strong>and</strong>17 Length <strong>of</strong> the posterior tibia 38 Area <strong>of</strong> elytral mirror18 Length <strong>of</strong> the posterior metatarsus 39 Dorsal field <strong>of</strong> elytron19 Number <strong>of</strong> tibial sp<strong>in</strong>es (outer) 40 Lateral field <strong>of</strong> elytron20 Number <strong>of</strong> tibial sp<strong>in</strong>es (<strong>in</strong>ner) 41 Length <strong>of</strong> stridulatory file21 Number <strong>of</strong> tibial denticles (outer) 42 Number <strong>of</strong> stridulatory pegs on fileQualitative Characters1 Body colour2 No. <strong>of</strong> spots on the first antennal segment (= scape)3 No. <strong>of</strong> spots on the second antennal segment (= pedicel)4 Presence <strong>of</strong> post orbital spot5 Presence <strong>of</strong> median b<strong>and</strong> on the head6 Presence <strong>of</strong> median b<strong>and</strong> on the pronotum7 Presence <strong>of</strong> spots on the abdomen8 Presence <strong>of</strong> spots on the external face <strong>of</strong> the posterior femora9 Presence <strong>of</strong> a small black spot at the base <strong>of</strong> the tibia10 Presence <strong>of</strong> two small black spots near the anal knot11 Presence <strong>of</strong> scutal tubercle (metanotal gl<strong>and</strong>)12 Shape <strong>of</strong> tubercle (metanotal gl<strong>and</strong>)JOURNAL OF ORTHOPTERA RESEARCH 2005, 14(1)