2007 - Centre for Ecological Sciences - Indian Institute of Science
2007 - Centre for Ecological Sciences - Indian Institute of Science
2007 - Centre for Ecological Sciences - Indian Institute of Science
- No tags were found...

Create successful ePaper yourself
Turn your PDF publications into a flip-book with our unique Google optimized e-Paper software.
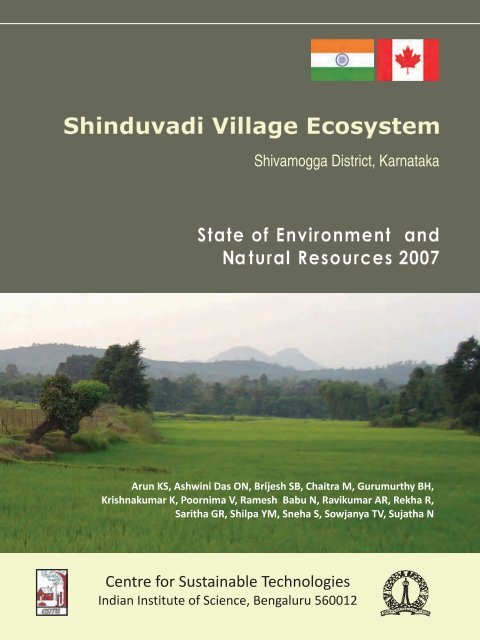
Shinduvadi Village EcosystemShivamogga District, KarnatakaState <strong>of</strong> Environment andNa tural Resources <strong>2007</strong>Arun KS, Ashwini Das ON, Brijesh SB, Chaitra M, Gurumurthy BH,Krishnakumar K, Poornima V, Ramesh Babu N, Ravikumar AR, Rekha R,Saritha GR, Shilpa YM, Sneha S, Sowjanya TV, Sujatha N<strong>Centre</strong> <strong>for</strong> Sustainable Technologies<strong>Indian</strong> <strong>Institute</strong> <strong>of</strong> <strong>Science</strong>, Bengaluru 560012
State <strong>of</strong> Environment and Natural Resources <strong>2007</strong>Shinduvadi Village EcosystemShivamogga District, KarnatakaVillage Natural Resource Monitoring Cell<strong>Centre</strong> <strong>for</strong> Sustainable Technologies<strong>Indian</strong> <strong>Institute</strong> <strong>of</strong> <strong>Science</strong>
Shinduvadi Village Ecosystem: State <strong>of</strong> Environment and NaturalResources <strong>2007</strong>Published by<strong>Centre</strong> <strong>for</strong> Sustainable Technologies<strong>Indian</strong> <strong>Institute</strong> <strong>of</strong> <strong>Science</strong>, Bengaluru 560012Year <strong>of</strong> publication2008Conceived and Coordinated byRakesh Tiwari<strong>Centre</strong> <strong>for</strong> Sustainable Technologies, <strong>Indian</strong> <strong>Institute</strong> <strong>of</strong> <strong>Science</strong>Guidance and supportPr<strong>of</strong>. NH Ravindranath, Indu K Murthy, Sandhya RaoTechnical SupportMythri DJ, Ajay GA, Rashmi Tiwari, Swarnima SinghField teamArun KS, Ashwini Das ON, Brijesh SB, Chaitra M, Gurumurthy BH,Krishnakumar K, Poornima V, Ramesh Babu N, Ravikumar AR, Rekha R,Saritha GR, Shilpa YM, Sneha S, Sowjanya TV, Sujatha NTeam supported byPathways unitSahyadri <strong>Science</strong> CollegeShivamoggaSupported byIndia Canada Environment FacilityNew Delhi 110066ContactVNRM Cell<strong>Centre</strong> <strong>for</strong> Sustainable Technologies<strong>Indian</strong> <strong>Institute</strong> <strong>of</strong> science, Bengaluru 560012Karnataka, Indiavnrmcell@astra.iisc.ernet.inPhotographyShimogarakeshReport available online:http://ces.iisc.ernet.in/ravi/vnrm/Home.html
ForewordIt is the youth, the students who will redefine the development <strong>of</strong> the country. Thisunique piece <strong>of</strong> work is an output <strong>of</strong> dedicated work carried out by theundergraduate students <strong>of</strong> Pathways Unit, Sahyadri <strong>Science</strong> College, Shivamogga.Students from varied streams put together their ef<strong>for</strong>ts and valuable time tounderstand the problems and issues related to natural resources and communitiesdepending on them by interacting with the people <strong>of</strong> Shinduvadi. The students gotan opportunity to learn basic research methodologies at a budding stage. Theactivity also sensitized the students to issues and problems <strong>of</strong> the farmingcommunity and the underlying causes. This coordinated work is a cleardemonstration <strong>of</strong> research reaching the lowest <strong>of</strong> the economic strata. Thisendeavour by students is probably a first <strong>of</strong> its kind in the country wherecollaboration between a research institute and a college has produced an outputwhich could be used <strong>for</strong> policy-making at the grassroots' level. This also sets anexample <strong>for</strong> other colleges <strong>for</strong> taking up pro-society research initiatives.VNRM cell<strong>Centre</strong> <strong>for</strong> Sustainable Technologies<strong>Indian</strong> <strong>Institute</strong> <strong>of</strong> <strong>Science</strong>
AcknowledgementWe would like to thank the people <strong>of</strong> Shinduvadi <strong>for</strong> extending support, withoutwhich this exercise would not have been possible. Thanks are also due to thefollowing:Mr. Rudresh, Tahashildar and staff members, Thirthahalli talukMr. Siddappa, Deputy Tahashildar, Thirthahalli talukMr. Mahesh Gowdru, President <strong>of</strong> Mandagadde panchayatMr. K.V. Subbanna, Village Accountant, Mandagadde panchayatMr. Rajanna, Revenue Officer, MandagaddeMr. Eshwar, Member <strong>of</strong> Gram panchayat, ShinduvadiMr. Bhaskar, Mr. Hiriyanna, Mr. Preetham, Mr. Prem Kumar, Mr. Satish andMr. Vasappa, ShinduvadiDr. G.J. Satish, Lecturer, Department <strong>of</strong> Biochemistry, Sahyadri <strong>Science</strong>College, Shivamogga.We would like to thank Pr<strong>of</strong>. Martin Mortimer, School <strong>of</strong> Biological <strong><strong>Science</strong>s</strong>,University <strong>of</strong> Liverpool, PR Bhat, <strong>Centre</strong> <strong>for</strong> <strong>Ecological</strong> <strong><strong>Science</strong>s</strong>, Uttara Kannada,Suresh HS, <strong>Centre</strong> <strong>for</strong> <strong>Ecological</strong> <strong><strong>Science</strong>s</strong>, KR Thiruppathi, B Radha Tiwari, andSomashekhara Achar KG <strong>for</strong> taking time to read this report and <strong>for</strong> providingvaluable inputs.
ContentsIntroduction 1The village 3Demography and rainfall 6Land 8Cropping pattern 9Agro-<strong>for</strong>estry 12Forest and wildlife 13Livestock 16Soil and water 18Energy infrastructure and sanitation 20Shinduvadi ecosystem—an overview 21
Soil: types, distribution and soil organic carbon (SOC) statusWater: irrigation water (availability, seasonality and groundwaterstatus), drinking water (availability or accessibility, seasonality, qualityand ef<strong>for</strong>t involved)Livestock: population, composition, grazing pattern, fodder availabilityand dung productionWild fauna: composition <strong>of</strong> major birds and vertebrate pestsApart from these resources, in<strong>for</strong>mation was also gathered on parameterssuch as demography, land-holding and occupation pattern, rainfall pattern,sanitation, electrification status, use <strong>of</strong> energy devices, human ef<strong>for</strong>tinvolved in collection <strong>of</strong> drinking water and fuelwood and institutionalstatus.NWESShivamogga districtShinduvadiAgro-ecological zones35.26.16.26.36.47.17.27.38.18.28.310.110.210.310.41112.112.212.315.118.118.218.318.418.519.119.219.3Figure 1: AEZ map <strong>of</strong> South India showing Shivamogga district and ShinduvadiMethodsThe following methods, which are based on the guidelines and protocolsdeveloped by the <strong>Centre</strong> <strong>for</strong> Sustainable Technologies, <strong>Indian</strong> <strong>Institute</strong> <strong>of</strong><strong>Science</strong>, were adopted.Secondary records were consulted to obtain general in<strong>for</strong>mation aboutthe village, including demography, rainfall, past land-use, croppingpattern, irrigation and livestock. The in<strong>for</strong>mation was gathered from4
different departments such as the Thirthahalli taluk <strong>of</strong>fice andMandagadde panchayat. A cadastral map <strong>of</strong> the village, dated 1910,was used as the base map.Field studies, which are given below, were conducted to gatherin<strong>for</strong>mation on different resource indicators <strong>of</strong> the village ecosystem.Land survey The land was surveyed to demarcate and map currentland-use systems, cropping pattern and irrigation sources. A mapprepared in 1910 was digitized and used as the base map todemarcate current land-use. Latitudes and longitudes <strong>of</strong> strategiclocations were ascertained and recorded. Land history was recordedwherever available.Vegetation survey To understand the extent <strong>of</strong> different <strong>for</strong>esttypes, species composition, regeneration status and biomasscomposition, four sample plots measuring 50 × 20 m were laid out.Each plot was evaluated <strong>for</strong> trees with height above 130 cm and girthgreater than 10 cm at breast height. In each tree plot, two shrubplots (5 × 5 m each) and four herb plots (1 × 1m each) were laid.Agro-<strong>for</strong>estry survey The survey was in fact a census and wasextended to trees above 10 cm in girth at breast height and 130 cm inheight to study the non-<strong>for</strong>est tree cover <strong>of</strong> the village, especiallycropland bunds and block plantations. Parameters consideredinclude species composition and density.Soil and water Soil samples were collected representing major landuse and cropping systems and samples <strong>of</strong> drinking water werecollected from major drinking water sources.Bird survey An all-out search <strong>for</strong> terrestrial birds in differentland-use systems (cropland and <strong>for</strong>est) was carried out during earlymonsoon (June) to understand the avifaunal composition <strong>of</strong> thevillage.Household survey was undertaken to obtain additional in<strong>for</strong>mation oncropping methods, fertilizer and manure application, water and fuelsources, consumption pattern, etc.Participatory rural appraisal was carried out to understand communityperception <strong>of</strong> the status and trends in various resources, the usagepatterns and the factors <strong>for</strong> changes, if any.Laboratorymeasurements were made to determine the status <strong>of</strong> soilsfrom different land-use systems and the quality <strong>of</strong> drinking water fromdifferent sources.The inventory was carried out from October <strong>2007</strong> to February 2008, whichis referred as the current period in this report. The land-use and croppingparticulars are <strong>of</strong> kharif, the main cropping season (conducted during theharvesting period). The bird survey was carried out in June 2008.5
Demography and rainfallPhoto: Dr. BC PatilThe current population <strong>of</strong> the village is 246, comprising 95 men, 98 womenand 53 children in 42 households. There has been a decreasing trend (43%)in the population <strong>of</strong> the village over the past three decades. The number <strong>of</strong>households has also decreased by 44% over the past 25 years. Thisreduction is mainly driven by reduced returns from agriculture,abandonment <strong>of</strong> agriculture in a few cases and migration in search <strong>of</strong>livelihood opportunities (Figures 2 and 3).Number4503753002251507501971 1981 1991 2001 <strong>2007</strong>Figure 2: Trends in populationNumber8060402001981 1991 2001 <strong>2007</strong>Figure 3: Trends in number <strong>of</strong> householdsSmall14%Large17%Medium49%Landless20%Current land holding status(percent households)Land Holding and OccupationAgriculture is the primary occupation <strong>of</strong> about 45% <strong>of</strong> the households inShinduvadi and 49% are involved in agriculture-related businesses. About50% <strong>of</strong> the farmers are categorized as medium farmers (holding 3–10acres); 17% are large farmers (holding more than 10 acres) and 14% aresmall farmers (less than 3 acres). About 20% <strong>of</strong> the households are <strong>of</strong>landless labourers. All men in the village are engaged in agriculturalactivities; about a third are labourers. Approximately 18% <strong>of</strong> the men areinvolved in secondary occupations such as fishing and other agro-basedindustries. About 75% <strong>of</strong> the women work: agriculture (31%), labour (39%)and others (5%).Trends and ImplicationsThe number <strong>of</strong> land-owning farmers has increased by 77% whereas that <strong>of</strong>landless labourers has decreased by about 25% over the past 15 years. Theincrease in the number <strong>of</strong> medium farmers can be attributed t<strong>of</strong>ragmentation <strong>of</strong> land holdings. Migration <strong>for</strong> employment and betterincome has led to the decline in the number <strong>of</strong> agricultural labourersleading to labour scarcity (Figures 4 and 5).6
Percent100%80%60%40%20%Number180120601991 <strong>2007</strong>0%Men WomenAgriculture Labour Others NoneFigure 4: Current occupation status(percent households)0CultivatorsLabourersFigure 5: Trends in population involved inagriculture and labourRainfall TrendsMost <strong>of</strong> the rainfall is received during the monsoon, July and August beingthe peak months. The rainfall is quite high since the village is located in theWestern Ghats high-rainfall zone. The mean annual rainfall <strong>of</strong> Thirthahallitaluk is about 3000 mm and that <strong>of</strong> Mandagadde is 2000 mm. Annual peakover the years is showing shift towards September which is significant inyear 2002 and 2004 (Figures 6 and 7).Rainfall in mm10009008007006005004003002001000Jan Feb Mar Apr May Jun Jul Aug Sep Oct Nov Dec2000 2001 2002 2003 2004 2005 2006Figure 6: Trends in monthly rainfallThe region experienced drought from 2001 to 2004, which affectedagricultural activities in the region. However, above-average rainfall in thepast couple <strong>of</strong> years has led to revival <strong>of</strong> agricultural activities.The average minimum and maximum temperatures <strong>of</strong> the region are 13 °Cand 38.1 °C.2500Taluk mean2000Rainfall in mm1500100050001993 1994 1999 2000 2001 2002 2003 2004 2005 2006Figure 7: Trends in rainfall7
LandMajor land-use systems in the village include cropland, <strong>for</strong>est land, waterbodies, wasteland and grazing land. Cropland (230 ha) accounts <strong>for</strong> 46% <strong>of</strong>the total area <strong>of</strong> the village. Forests and plantations (104 ha) account <strong>for</strong>21%. Four ponds (71 ha) account <strong>for</strong> 14% and other land categoriesincluding wasteland (21 ha) and grazing land (15 ha) account <strong>for</strong> theremaining 20% <strong>of</strong> the total area (Figure 8).Trends in Land-usePast land-use data were obtained from secondary records collected fromthe revenue department. The data were available <strong>for</strong> 1987 and 1995.Figures related to cropping pattern and irrigation sources were also derivedfrom past records.Area under cultivation decreased by 50% between 1987 and 1995 to147 ha;however, it increased later and measures 230 ha at present. Area undercrops has decreased and in few cases, agricultural lands have beenabandoned. Dedicated grazing lands are totally lost: in the past threedecades, they have been either converted to tree plantations orabandoned.NWES200 mArecaAreca mixedBananaC<strong>of</strong>feePaddyKhushki*Grazing landAbandoned c<strong>of</strong>feePondSettlementSoppinabettaOthersFigure 8: Current land use* non-arable drylands8
Cropping patternCropping CalendarThe cropping pattern <strong>of</strong> the village consists <strong>of</strong> both perennial and annualcrops. Perennials or plantations mainly include areca. Paddy is the majorannual crop. Currently paddy is cultivated as a kharif crop, dependentmainly on rains. Due to non-availability <strong>of</strong> irrigation during summer, paddyis not cultivated in the second season i.e., rabi.Paddy55%Areca29%Areca mixed12%Current StatusPaddy is the major crop <strong>of</strong> Shinduvadi, currently grown on 128 ha (55% <strong>of</strong>the total). The crop is primarily rainfed and cultivated during kharif withponds as an additional source <strong>of</strong> irrigation. Areca is the second major crop,currently cultivated on 94 ha (41% <strong>of</strong> the total); 27 ha <strong>of</strong> these support suchintercrops and mixed crops as paddy, banana, vanilla, turmeric and c<strong>of</strong>fee(Figure 9).Tree plantation4%Current crop compositionNWESArecaAreca mixedPaddyFigure 9: Current cropping patternTrendsAgricultural activities in Shinduvadi have been fluctuating over the past twodecades. In a few cases, agricultural lands have been abandoned andplantations established (about 132 ha <strong>of</strong> c<strong>of</strong>fee plantation has beenabandoned). Such changes may be due to factors such as shortage <strong>of</strong>labour, increased cost <strong>of</strong> cultivation and price fluctuations.9
Area in ha2502001501005001987 1995 <strong>2007</strong>Trends in cultivated areaArea under areca has increased threefold over the past three decades.Areca is fast replacing paddy, area under which has been fluctuating owingto non-availability <strong>of</strong> irrigation. About 20 years ago, paddy was cultivatedtwice a year, as a rainfed crop in kharif and irrigated with pond water in rabi.Currently the ponds are silted and farmers are <strong>for</strong>ced to depend on rainsand harvest only one crop a year. C<strong>of</strong>fee, which was introduced during earlyyears <strong>of</strong> the 20th century, was the major crop during the 1980s. Cultivation<strong>of</strong> c<strong>of</strong>fee was completely abandoned in the past decade mainly because <strong>of</strong>lack <strong>of</strong> a good market, fluctuating prices and labour scarcity, although suchfactors as inadequate rainfall and lack <strong>of</strong> transport also played a role.Farmers are currently introducing rubber in an ef<strong>for</strong>t to stabilize returnsfrom agriculture (Figure 10).1401987 1995 <strong>2007</strong>105Area in ha70350Areca C<strong>of</strong>fee Banana PaddyFigure 10: Trends in major cropsCrop VarietiesPaddy varieties currently cultivated include Jaya, Jyothi, BGM Sona, IT andBhagyajyothi. Areca variety cultivated is local. There has been a gradualchange in the varieties <strong>of</strong> paddy being cultivated. Varieties cultivated 10–15years ago included Jyothi, 1001, 1010 and Intan; farmers now preferimproved varieties <strong>for</strong> higher yields and returns.Pests and Pest ControlBlast <strong>of</strong> paddy, a fungal disease, is the major disease; it was reported by 52%<strong>of</strong> the cultivating households. Aphid infestation was reported by 9% <strong>of</strong> theresponding households whereas 22% <strong>of</strong> the responding householdsreported no pests. The major disease <strong>of</strong> areca is koleroga, a fungal disease,which was reported by 87% <strong>of</strong> the cultivating households; 9% reportedother diseases as well.Control measures adopted <strong>for</strong> blast <strong>of</strong> paddy include application <strong>of</strong>pesticides such as enosan and democran. Bordeaux mixture (1:1:1 ratio byweight <strong>of</strong> copper sulphate, lime and adjuvant) is applied to control koleroga<strong>of</strong> areca at the rate <strong>of</strong> 25–40 barrels (3100–4600 litres) per ha annually.Usually a precautionary spray is given be<strong>for</strong>e the rains and once infection isobserved, three to four rounds <strong>of</strong> bordeaux application are undertaken.Organic pesticides such as neem cake and neem oil are also used <strong>for</strong>koleroga in a few cases.10
Fertilizer and Manure ApplicationFertilizers are applied in larger doses <strong>for</strong> areca (0.6 t/ha) than <strong>for</strong> paddy (0.4t/ha). On the other hand, paddy gets greater quantities <strong>of</strong> organic manure(4.8 t/ha) than areca (2.9 t/ha).There has been a drastic reduction (about 90%) in the application <strong>of</strong> organicmanure to the croplands. Although there is land legally earmarked assoppinabetta <strong>for</strong> supplying green manure <strong>for</strong> areca, neither green leavesnor dry leaves from <strong>for</strong>est are used as manure, and gliricidia, which exists inabundance on bunds and is a good source <strong>of</strong> leafy manure, is hardly used.Trends in Crop YieldsHalf <strong>of</strong> the areca-cultivating households reported reduction in yield overthe past 5–10 years, 38% reported an increase and the rest reported nochange. The reduction in yield can be attributed to koleroga infection,which can reduce yields by up to 21%. In the case <strong>of</strong> paddy, 36% householdsreported increased yields, an equal proportion reported no change and therest 28% reported reduction. Increase in yield can be attributed to suchhigh-yielding varieties as Jaya and Bhagyajyothi.Wild boars are a major vertebrate pest, which can cause losses <strong>of</strong> paddyyields from 50% to 100%. Monkeys are a menace to areca, and can causelosses up to 50%.% change100806040200ArecaPaddyIncrease Decrease No changeTrends in crop yields11
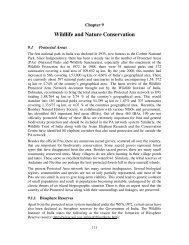
Forest and wildlifeNatural ForestsThere are 19 tree species represented by 245 individuals/ha in the natural<strong>for</strong>ests <strong>of</strong> Shinduvadi. Syzygium cuminii, an evergreen tropical tree, is thedominant species, accounting <strong>for</strong> almost a quarter <strong>of</strong> the total number <strong>of</strong>individual trees. The other dominant species include Erythrina suberosa(20%), Ficus glomerata (8%), Vitex altissima (8%) and Ficus infectoria (6%).Almost one-third <strong>of</strong> the total number <strong>of</strong> individuals are in the largest girthclass <strong>of</strong> >40 cm, followed by 21% in the 30–40 cm girth class. This indicatesthat regeneration in natural <strong>for</strong>ests is affected, given that larger treesoutnumber smaller trees. The diversity index <strong>of</strong> the <strong>for</strong>est is 2.46, indicatinga larger diversity.PlantationsTree density in the plantations is 645 trees/ha belonging to 12 species. Theplantations are, however, predominantly a monoculture <strong>of</strong> Acaciaauriculi<strong>for</strong>mis with about 550 individual trees/ha. Naturally regeneratedspecies in the plantation include Diospyros montana, Terminalia bellerica,Elangium lamarkii, Ervatamia heyneana and seven other species (Table 1).The number <strong>of</strong> trees in the 10–20 cm girth class is maximum, followed bythat in the 20–30 cm girth class. Girth class <strong>of</strong> >40 cm accounts <strong>for</strong> the leastnumber, indicating recent ef<strong>for</strong>ts to raise plantations. The diversity index <strong>of</strong>the plantations is low at 0.75, indicating dominance <strong>of</strong> a single species, inthis case Acacia auricul<strong>for</strong>mis (Figure 12).350300PlantationNatural <strong>for</strong>estNUmber <strong>of</strong> individuals2502001501005000-10 10-20 20-30 30-40 >40Girth classFigure 12: Composition <strong>of</strong> trees—girth wise13
Biomass StockBasal area is an indicator <strong>of</strong> the growing stock and biomass production <strong>of</strong> a<strong>for</strong>est. The basal area recorded in natural <strong>for</strong>ests and plantations are2comparable at about 26 m /ha. Acacia auriculi<strong>for</strong>mis, the dominant speciesin the plantations, contributes 67% <strong>of</strong> the total basal area in plantations.However, in the natural <strong>for</strong>ests Vitex altissima (25.3%) and Syzygiumcuminii (23.6%) together contribute about 50% <strong>of</strong> the total basal area innatural <strong>for</strong>ests. The total biomass is higher in the plantations (162 t/ha)than in natural <strong>for</strong>ests (107 t/ha).Table 1: Species richness, biomass and basal area in <strong>for</strong>estsPlantation Natural <strong>for</strong>estNo. <strong>of</strong> species observed 2 + 10 naturally existing 19Stem density (number/ha) 645 245Diversity index 0.75 2.462Basal area (m /ha) 26.51 25.59Biomass (t/ha) 162.30 106.60DisturbanceCut stems in a <strong>for</strong>est or plantation are an indicator <strong>of</strong> the level <strong>of</strong>disturbance or extraction. Of the cut stems in the plantations <strong>of</strong> Shinduvadi,94% are <strong>of</strong> Acacia auriculi<strong>for</strong>mis. Other species that have been cut includeTerminalia paniculata and Xylia xylocarpa.Wild Fauna and BirdsThe village is close to a bird sanctuary in the Shettihalli <strong>for</strong>est range. TheMandagadde area, which was declared a sanctuary in 1974, is part <strong>of</strong> theadjacent Lingapura village. The sanctuary is in fact a small island in RiverTunga. The peak season is monsoon (June–October), when migratory birdsarrive and breed in the wetlands spread over 1.5 acres. Three major speciescongregate in the sanctuary <strong>for</strong> breeding, namely median egret, darter andlittle cormorant. The sanctuary also harbours such predators as the civet,the mongoose and monkeys. Major bird species in the sanctuary includenon-migratory birds such as little egret, smaller egret, little cormorant,darter and pond heron. Among them, egret is the major breeding birdduring the monsoon. White ibis is the only local migratory bird. Otherresident land species include brahmini kite, rose-ringed parakeet, barredjungle owlet, small blue kingfisher, <strong>Indian</strong> pitta, black drongo, commonmyna, house crow, red-whiskered bulbul, large pied wagtail, housesparrow, crow pheasant, Tickell's flowerpecker, black-headed bunting andgolden oriole.Shinduvadi, which is only 4 km from the sanctuary, reveals a marked impact<strong>of</strong> the birds in the sanctuary. The major birds sighted in the sanctuary areusually observed in the village. Nearly 21 species <strong>of</strong> birds other than the14
irds <strong>of</strong> the sanctuary were observed in the croplands and <strong>for</strong>ests <strong>of</strong>Shinduvadi. Common avifauna such as red-whiskered bulbul, red-ventedbulbul, myna and babblers are sighted very frequently. House sparrowpopulation has declined since two decades according to communityperception (Table 2).Other than birds, the ecosystem sustains diverse populations <strong>of</strong> insects(including moths and butterflies) and amphibians.Table 2: Birds sighted in ShinduvadiAshy priniaAsian koelBlack drongoBramhini kiteCrow pheasantCommon ioraCommon mynaGold-fronted chloropsisGrey titHouse crowHouse sparrow<strong>Indian</strong> peafowl<strong>Indian</strong> robin<strong>Indian</strong> treepieJungle babblerJungle mynaLesser golden-back woodpeckerLoten’s flowerpeckerPeafowlPied bushchatPurple-rumped sunbirdRed-vented bulbulRed-whiskered bulbulScarlet minivetSmall blue kingfisherSouthern hill mynaSpotted doveSpotted muniaWhite-breasted waterhen15
LivestockComposition and TrendsThe current livestock population <strong>of</strong> the village is 254, comprising cows(72%), bullocks (9%) and buffaloes (19%). There are no cross-bred cattle orsheep or goats in the village. The population <strong>of</strong> livestock has decreaseddrastically, by over 40%, during the past two decades, driven mainly byreduced agricultural activity, decreased population and conversion <strong>of</strong>dedicated grazing lands to plantations leading to reduced availability <strong>of</strong>fodder (Figure 13).400300Numbers200100BuffaloesBullockCow01987 1997 2002 <strong>2007</strong>Figure 13: Livestock population trendsGrazing Pattern and Dung ProductionGrazing is practised mainly in the <strong>for</strong>est (54%) and soppinabetta (20%). Thekey grazing location <strong>for</strong> livestock during the cropping season is the acaciaplantation. After the crop is harvested, livestock depends on the harvestedcroplands or on stall feeding. Paddy straw is the major source <strong>of</strong> fodder inthe village after the harvest. Annually about 3.5 tonnes <strong>of</strong> dry fodder isrequired per head <strong>of</strong> cattle. Although no fixed hours are allotted <strong>for</strong> grazing,cattle usually graze <strong>for</strong> about 8 hours a day.Each cow and buffalo produces on an average 23 and 20 kg <strong>of</strong> dung a dayrespectively whereas each bullock produces about 4 kg. There is very littlescope to establish a community-scale biogas plant in the village. However,where there are enough animals to meet the minimum dung requirement<strong>of</strong> a biogas plant, a few home-scale units can be established.16
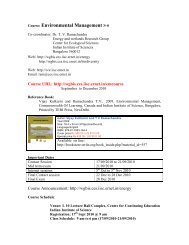
Soppinabetta—A declining traditionBetta or soppinabetta (soppina means leaves and betta means an area or hillock with vegetation) isthe local name <strong>for</strong> a protected <strong>for</strong>est, and the term is used in the <strong>Indian</strong> Forest Act. The betta <strong>for</strong>estswere assigned to farmers <strong>for</strong> the purpose <strong>of</strong> supplying organic matter in the <strong>for</strong>m <strong>of</strong> green and dryleaves to areca gardens. The British extended this special privilege to areca farmers during 1867 withsome regulations facilitating optimal and sustainable use <strong>of</strong> the <strong>for</strong>est resources. The farmers weregiven the privilege <strong>of</strong> collecting green leaves <strong>for</strong> the purpose <strong>of</strong> mulch, fuelwood, grass, NTFPs andsmall timber <strong>for</strong> their bonafide use. About 6–9 ha <strong>of</strong> betta lands were assigned to each hectare <strong>of</strong>areca garden. Any type <strong>of</strong> commercial-level extraction is banned in these <strong>for</strong>ests. Area under betta<strong>for</strong>ests has been declining over the decades and in Shinduvadi, these lands are being eitherprotected completely (no extraction allowed) or are being converted to plantations. Moreover,labour scarcity has led to a decline in the practice <strong>of</strong> using organic matter from soppinabetta. As aconsequence, green leaves are never used as manure in Shinduvadi.WNSEBanda kaanu*CroplandHeddari kaanu*Kaanu*Karada byana*Mekki kaanu*OthersSettlementSoppinabetta* Traditional <strong>for</strong>est categoriesExtent <strong>of</strong> different <strong>for</strong>est categories in 191017
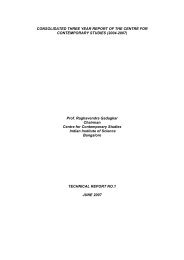
Soil and waterPercent organic carbon1.81.51.20.90.60.30.0Areca Paddy C<strong>of</strong>feeplantationForest0.75%, high.Soil organic carbon statusSoil QualitySoils <strong>of</strong> Shinduvadi are mainly a mix <strong>of</strong> black soils and red soils. In paddy andareca lands, organic carbon content was medium. Lower levels <strong>of</strong> organiccarbon in croplands can be attributed to intensive cultivation practices,whereas <strong>for</strong>ests recorded higher levels (1.5%) due to undisturbed soils. Theabandoned c<strong>of</strong>fee plantations also recorded high levels (1.4%).Soils under both areca and paddy recorded comparable bulk densities, pHvalues, and available potassium content. Bulk density ranged from 1.36 to1.37 g/cc. The soils are moderately acidic, with areca recording 5.9±0.4 andpaddy, 5.6±0.5. Soils are rich in available potassium: 271.81 and 276.31kg/ha in areca and paddy soils respectively (Table 3).Table 3: Cropland nutrient statusAreca PaddyPercent organic carbon 0.46 0.55Bulk density in g/cc 1.36 1.37pH 5.87 5.55Available potassium in kg/ha* 271.81 276.31Available sulphur in kg/ha 14.83 14.68* 120, high.Canal and streams41%Rains42%Groundwater8%Irrigation sourcesPond8%Irrigation SourcesAgriculture in Shinduvadi is mainly rainfed. Canals and streams <strong>for</strong>m themajor irrigation sources. Groundwater sources such as open wells andbore-wells meet 8% <strong>of</strong> the irrigation requirements. Pond water irrigatesanother 8% <strong>of</strong> the croplands. The community is, there<strong>for</strong>e, dependent onrains and alternative sources such as canals and streams <strong>for</strong> irrigation,which makes agriculture vulnerable to water stress. Paddy is basicallyrainfed in kharif, and rabi paddy is dependent on pond irrigation. Borewellsand open wells meet the water requirements <strong>of</strong> areca in summer.Net irrigated area has been decreasing over the past three decades owingto decrease in agricultural activities and water scarcity. Ponds, which usedto be a major source <strong>of</strong> irrigation (102 ha) until 1995 have silted up andcurrently irrigate only about 18 ha <strong>of</strong> croplands (80% reduction). The extent<strong>of</strong> land dependent on rain has also decreased substantially (by 60%) overthe same period and is currently 98 ha. Ponds and rainwater are usedequally as sources <strong>of</strong> irrigation during kharif but ponds serves as the solesource in rabi and summer. Although groundwater is plentiful, its use <strong>for</strong>18
irrigation is very limited and is currently restricted to kharif as asupplementary source. It is most likely that in future, people will have toswitch over to groundwater sources or desilt the ponds to sustain thereturns from agriculture.Due to paucity <strong>of</strong> irrigation water, people raise a single crop such as paddy ina cropping year, which is badly dependent on rainfall and alternativesources. This has lowered the dependency on irrigated annual crops andencouraged the shift to perennial crops and, in a few cases, to agriculturebeing abandoned.Area in ha1987 1995 <strong>2007</strong>300250200150100500PondRainsTrends in irrigation sourcesDrinking WaterSources and Consumption PatternGroundwater is the major source <strong>of</strong> water <strong>for</strong> drinking and <strong>for</strong> otherdomestic needs. A third <strong>of</strong> the households depend on open wells. There are6 open wells and 4 hand pumps in the village, which serve as sources <strong>of</strong>drinking water. Mini water supply taps, fed by an overhead tank, are used by46% households. All the sources are easily accessible to the householdswithin a range <strong>of</strong> 0.5 km. Communities spend on an average about 1.5 hoursto a maximum <strong>of</strong> 2.5 hours daily <strong>for</strong> collecting water.Taps46%Borewells33%Wells13%Average daily per capita water consumption <strong>for</strong> drinking, bathing andcooking is 2, 30 and 4 litres respectively. Per capita consumption <strong>of</strong> waterfrom ponds is maximum (41 litres), followed by open wells (27 litres) andtaps (24 litres); water from hand pumps is used the least (15 litres).Others8%Drinking water sourcesWater QualityChemical quality <strong>of</strong> water from major sources <strong>of</strong> drinking water in thevillage was studied. All parameters except nitrate were within thepermissible limits laid down by the Bureau <strong>of</strong> <strong>Indian</strong> Standards. The nitratecontent can be attributed to contamination with bird droppings or leaching<strong>of</strong> water from manure pits (Table 4).Table 4: Drinking water quality status#Desirable limits#1Permissible limits Tap Over head tank Open wellTurbidity as NTU 5.00 10.00
Shinduvadi ecosystem - an overviewShinduvadi agricultural ecosystem has undergone significant changes owing to changes in availability <strong>of</strong>water <strong>for</strong> irrigation, labour scarcity and deficient rainfall over the past 5–10 years. C<strong>of</strong>fee, a commercial cropcultivated in the past, has been abandoned as a result <strong>of</strong> deficient rainfall and labour scarcity. Dependenceon agriculture as a primary occupation has declined over the years. Population <strong>of</strong> Shinduvadi has decreasedand people are looking <strong>for</strong> alternative sources <strong>of</strong> income. Parallely, due to decrease in the population, thereis labour scarcity within the village and people depend on labour from neighbouring villages paying themhigher wages. There have been significant changes in land-use over the past three decades with fluctuationsin net area cultivated, which is largely driven by deficit rainfall and loss <strong>of</strong> grazing lands. Monocultureplantations <strong>of</strong> acacia have been raised on lands that were set aside <strong>for</strong> grazing in the past. The traditionalpractice <strong>of</strong> using green and dry leaves from soppinabetta <strong>for</strong> improving soil quality has been discontinued asit requires dedicated labour, which is scarce currently. Gliricidia species, which dominates the non-<strong>for</strong>esttree cover, is not being used efficiently as green leafy manure. Livestock population has declinedsignificantly, again as a result <strong>of</strong> decreased availability <strong>of</strong> labour, smaller population and, <strong>of</strong> course, loss <strong>of</strong>grazing lands. Soils are acidic and generally low in organic carbon, indicating intensive cultivation anddisturbance.Paddy is mainly dependent on two factors, adequate rainfall and availability <strong>of</strong> labour <strong>for</strong> transplanting.Often the high cost <strong>of</strong> labour makes paddy cultivation a difficult proposition <strong>for</strong> small farmers. Areca, thesecond major crop, is largely affected by koleroga, which usually occurs in high-rainfall years and results insignificant losses. Farmers are resorting to intercrops and new crops such as rubber.Although groundwater is not used to a large extent <strong>for</strong>irrigation at present, scarcity due to deficit rains and siltation<strong>of</strong> ponds, which once used to be the major source <strong>for</strong> rabipaddy, are most likely to make farmers turn to groundwateras a source <strong>of</strong> irrigation. All the four ponds in the village needto be desilted to support any agricultural extension.Communities have adopted fuel-efficient stoves. However,there is increasing pressure on <strong>for</strong>ests, given the reductionin availability <strong>of</strong> crop residues, which are popularly used asfuel, especially <strong>for</strong> processing <strong>of</strong> areca, which is fuelintensive.Environmental IssuesSiltation <strong>of</strong> pondsIncreased pressure on <strong>for</strong>estsPoor soil qualityEupatorium weed infestationwhich may affect grazing.Forests and plantations in Shinduvadi harbour significant biodiversity. Mandagadde bird sanctuary, close toShinduvadi, makes the village more attractive as the major birds in the sanctuary can be seen in the village aswell. There is no conflict between birds, or the fauna <strong>of</strong> the ecosystem in general.21