Dynamic Properties of Sandstone Rock Subjected to Cyclic Loading11measurement of the velocity of propagation of ultra-soundwaves through rocks and associated materials. For mostapplications the following types of body waves are ofparticular interest (McDowell, 1993).(i) Compressional or longitudinal waves (P-waves).These have a particle motion in the direction ofwave propagation and travel faster than all otherwaveforms.(ii) Shear or transverse waves (S-waves). Groundmotion is transverse to the direction of wavemotion, i.e., polarized in one plane. In practice,the S-wave motion is normally polarized intocomponents which are parallel and perpendicularto the surface of the ground, i.e. S H- and S V-waves.The velocity of seismic waves depends upon a largenumber of factors, the most important being the elasticmoduli. For homogeneous isotropic elastic media, P- andS-wave velocities are related to dynamic elastic moduliand bulk density, using the following formulae:22.ρ .(1 + μd). Vs...(1)...(2)Ed= , ...(3)where,V pand V sare P- and S-wave velocities (m/s),E dis Young’s dynamic modulus of elasticity (N/m 2 ),ρ is bulk density (kg/m 3 ), andμ dPoisson’s dynamic ratio.Although most soil and rock masses are nothomogeneous and isotropic, they are usually consideredto behave elastically where stress levels are low, andwavelength is significantly greater than the dimensionsof pore spaces, voids and fractures. Therefore, whenderiving dynamic elastic parameters from seismic velocityvalues, it is very important to consider the relationshipbetween wavelength and the size, spacing, infill, etc., offractures. Although these formulae suggest that velocitywill decrease with increasing density, the opposite isnormally the case, because an increase in density isusually related to an increase in compaction and orcementation, resulting in an even more significantincrease in elastic moduli (McDowell, 1993).The average elastic dynamic properties of the rock testedin the laboratory, using seismic velocity measurements,are provided in Table 5. Altogether 37 rock specimenswere tested, representing all kinds of samples fromborehole Darkov 265-01. The wide variation in values ofelastic dynamic properties is due to variations inmineralogical composition, porosity and intra-structureamong different rock specimens and even in differentsamples coming from the same borehole. From Table 6it can be seen that changes in values from dry to saturatedcondition differ greatly, the percentage being as muchas 20% in the case of P-wave velocity and 29% in thecase of dynamic elastic modulus. According to Martinand Stimpson (1994), P-wave velocity is sensitive tocrack density, and hence, is a good indicator of sampledisturbance. The higher the sonic velocity is, the stifferthe rock. The difference in the values of sonic wavevelocity for dry and saturated conditions shows thepresence of micro-fissuring in the tested rock specimens.From this, it can be further concluded that the rockspecimens tested showed disturbances in terms ofmineralogy, coal intrusion, joints, cracks, etc.Table 5 : Dynamic properties obtained by seismic velocity measurement (parentheses show standard deviation)Sample Dry rocks Saturated rocks(Specimentested) V pd(m/s) V sd(m/s) μ ddρ dd(GPa) V ps(m/s) V ss(m/s) m dsE ds(GPa)D1 (2) 3256 (109) 2268 (38) 0.03 (0.03) 27 (2) 3875 (135) 2222 (40) 0.17 (0.01) 33 (1)D2 (2) 3438 (34) 2368 (30) 0.05 (0.01) 30 (1) 4138(50) 2316 (59) 0.22 (0.01) 39 (1)D3 (4) 4056 (233) 2638 (111) 0.13 (0.03) 40 (3) 4384 (322) 2564 (161) 0.19 (0.01) 45 (5)D4 (4) 3638 (145) 2396 (87) 0.11 (0.04) 32 (3) 4235(73) 2450 (33) 0.20 (0.01) 41 (2)D5 (5) 3679 (173) 2465 (92) 0.10 (0.03) 33 (3) 4285 (173) 2473 (94) 0.20 (0.01) 42 (4)D6 (5) 3666 (53) 2422 (60) 0.11 (0.03) 33 (1) 4187 (113) 2430 (94) 0.20 (0.04) 40 (2)D7 (5) 4439 (180) 2864 (167) 0.14 (0.06) 47 (4) 4775 (207) 2752 (109) 0.20 (0.01) 52 (4)D8 (5) 3740 (654) 2673 (120) 0.15 (0.03) 41 (5) 4304 (609) 2666 (156) 0.21 (0.01) 49 (6)D9 (5) 3965 (269) 2588 (98) 0.13 (0.04) 38 (4) 4396 (263) 2527 (126) 0.20 (0.02) 44 (6)Volume 1 v No. 1 v January 2012
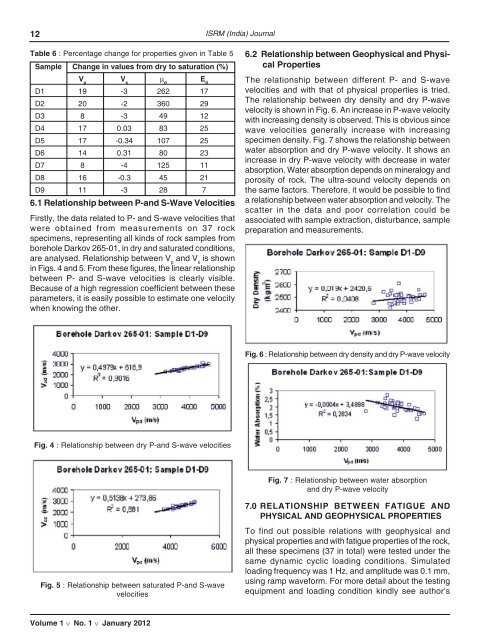
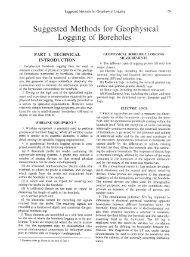
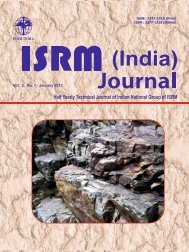
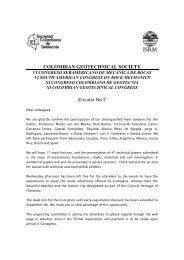
12 <strong>ISRM</strong> (India) JournalTable 6 : Percentage change for properties given in Table 5Sample Change in values from dry to saturation (%)V pV sμ dE dD1 19 -3 262 17D2 20 -2 360 29D3 8 -3 49 12D4 17 0.03 83 25D5 17 -0.34 107 25D6 14 0.31 80 23D7 8 -4 125 11D8 16 -0.3 45 21D9 11 -3 28 76.1 Relationship between P-and S-Wave VelocitiesFirstly, the data related to P- and S-wave velocities thatwere obtained from measurements on 37 rockspecimens, representing all kinds of rock samples fromborehole Darkov 265-01, in dry and saturated conditions,are analysed. Relationship between V pand V sis shownin Figs. 4 and 5. From these figures, the linear relationshipbetween P- and S-wave velocities is clearly visible.Because of a high regression coefficient between theseparameters, it is easily possible to estimate one velocitywhen knowing the other.6.2 Relationship between Geophysical and PhysicalPropertiesThe relationship between different P- and S-wavevelocities and with that of physical properties is tried.The relationship between dry density and dry P-wavevelocity is shown in Fig. 6. An increase in P-wave velocitywith increasing density is observed. This is obvious sincewave velocities generally increase with increasingspecimen density. Fig. 7 shows the relationship betweenwater absorption and dry P-wave velocity. It shows anincrease in dry P-wave velocity with decrease in waterabsorption. Water absorption depends on mineralogy andporosity of rock. The ultra-sound velocity depends onthe same factors. Therefore, it would be possible to finda relationship between water absorption and velocity. Thescatter in the data and poor correlation could beassociated with sample extraction, disturbance, samplepreparation and measurements.Fig. 6 : Relationship between dry density and dry P-wave velocityFig. 4 : Relationship between dry P-and S-wave velocitiesFig. 7 : Relationship between water absorptionand dry P-wave velocityFig. 5 : Relationship between saturated P-and S-wavevelocities7.0 RELATIONSHIP BETWEEN FATIGUE ANDPHYSICAL AND GEOPHYSICAL PROPERTIESTo find out possible relations with geophysical andphysical properties and with fatigue properties of the rock,all these specimens (37 in total) were tested under thesame dynamic cyclic loading conditions. Simulatedloading frequency was 1 Hz, and amplitude was 0.1 mm,using ramp waveform. For more detail about the testingequipment and loading condition kindly see author’sVolume 1 v No. 1 v January 2012