Download section (pdf) - Swiss Life - Online Report
Download section (pdf) - Swiss Life - Online Report
Download section (pdf) - Swiss Life - Online Report

Create successful ePaper yourself
Turn your PDF publications into a flip-book with our unique Google optimized e-Paper software.
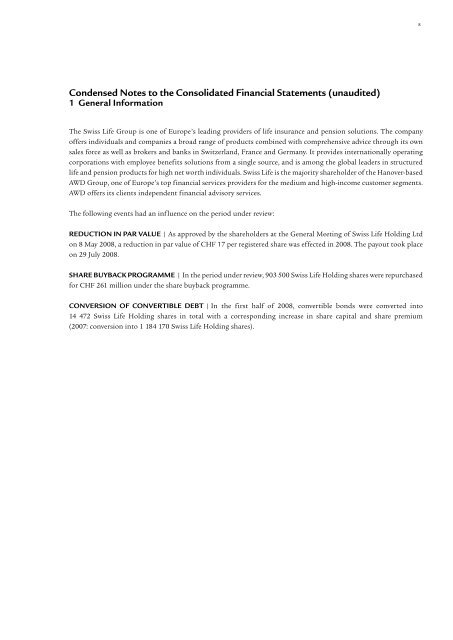
8Condensed Notes to the Consolidated Financial Statements (unaudited)1 General InformationThe <strong>Swiss</strong> <strong>Life</strong> Group is one of Europe’s leading providers of life insurance and pension solutions. The companyoffers individuals and companies a broad range of products combined with comprehensive advice through its ownsales force as well as brokers and banks in Switzerland, France and Germany. It provides internationally operatingcorporations with employee benefits solutions from a single source, and is among the global leaders in structuredlife and pension products for high net worth individuals. <strong>Swiss</strong> <strong>Life</strong> is the majority shareholder of the Hanover-basedAWD Group, one of Europe’s top financial services providers for the medium and high-income customer segments.AWD offers its clients independent financial advisory services.The following events had an influence on the period under review:REDUCTION IN PAR VALUE | As approved by the shareholders at the General Meeting of <strong>Swiss</strong> <strong>Life</strong> Holding Ltdon 8 May 2008, a reduction in par value of CHF 17 per registered share was effected in 2008. The payout took placeon 29 July 2008.SHARE BUYBACK PROGRAMME | In the period under review, 903 500 <strong>Swiss</strong> <strong>Life</strong> Holding shares were repurchasedfor CHF 261 million under the share buyback programme.CONVERSION OF CONVERTIBLE DEBT | In the first half of 2008, convertible bonds were converted into14 472 <strong>Swiss</strong> <strong>Life</strong> Holding shares in total with a corresponding increase in share capital and share premium(2007: conversion into 1 184 170 <strong>Swiss</strong> <strong>Life</strong> Holding shares).
9First-Half Financial <strong>Report</strong> 2008Condensed Financial StatementsCondensed Notes to the Consolidated Financial Statements (unaudited)2 Summary of Significant Accounting PoliciesThe half-year financial statements are prepared in accordance with IAS 34 Interim Financial <strong>Report</strong>ing. Theaccounting policies used in the preparation of the interim financial statements are consistent with those used inthe financial statements for the year ended 31 December 2007, except for the changes in accounting policies asdescribed below.These interim financial statements should be read in conjunction with the 2007 annual financial statements.CHANGES IN ACCOUNTING POLICIES | In July 2007, IFRIC 14 IAS 19 The Limit on a Defined Benefit Asset,Minimum Funding Requirements and their Interaction was issued. The Interpretation provides general guidanceon how to assess the limit in IAS 19 Employee Benefits on the amount of the surplus that can be recognised as anasset. It also explains how the pensions asset or liability may be affected when there is a statutory or contractualminimum funding requirement. The Interpretation has been adopted by the <strong>Swiss</strong> <strong>Life</strong> Group for annual periods asof 1 January 2008. It has no impact on the <strong>Swiss</strong> <strong>Life</strong> Group as no defined benefit asset has been recognised wherethe availability of refunds or reductions in future contributions are restricted by the Interpretation. No definedbenefit asset or liability are affected by a statutory or contractual minimum funding requirement.RELATED PARTY TRANSACTIONS | Transactions with subsidiaries have been eliminated on consolidation.No major transactions with other related parties have been entered into in the period under review.FUNCTIONAL AND PRESENTATION CURRENCY | Items included in the financial statements of the Group aremeasured using the currency of the primary economic environment in which the Group’s entities operate (the“functional currency”). The consolidated financial statements are presented in millions of <strong>Swiss</strong> francs (CHF),which is the Group’s presentation currency.FOREIGN CURRENCY EXCHANGE RATESAverage Average30.06.2008 31.12.2007 2008 HY 2007 HY1 British pound (GBP) 2.0265 2.2561 2.0745 2.41871 Croatian kuna (HRK) 0.2210 n. a. 0.2212 n. a.1 Czech koruna (CZK) 0.0673 n. a. 0.0639 n. a.1 Euro (EUR) 1.6054 1.6552 1.6060 1.6320100 Hungarian forint (HUF) 0.6793 n. a. 0.6350 n. a.100 Polish zloty (PLN) 47.7940 n. a. 46.0960 n. a.1 Romanian new leu (RON) 0.4376 n. a. 0.4395 n. a.1 Singapore dollar (SGD) 0.7477 0.7825 0.7569 n. a.1 Slovak koruna (SKK) 0.0529 n. a. 0.0500 n. a.1 US dollar (USD) 1.0156 1.1249 1.0506 1.2281
103 Segment InformationThe <strong>Swiss</strong> <strong>Life</strong> Group has adopted IFRS 8 Operating Segments in advance of its effective date, with effect from1 January 2007. Comparative information has been re-presented to conform with the requirements of IFRS 8Operating Segments.Operating segments are components of an entity about which separate financial information is available that isevaluated regularly by the management in deciding how to allocate resources and in assessing performance. Thepredecessor Standard IAS 14 Segment <strong>Report</strong>ing required identification of two sets of segments – one based onrelated products and services, and the other on geographical areas. IAS 14 regarded one set as primary segments andthe other as secondary segments. The adoption of IFRS 8 Operating Segments has resulted in a changed identificationof reportable segments.The accounting policies for the segments are the same as those described in the summary of significant accountingpolicies. Inter-segmental services and transfers of assets and liabilities are treated as if the transactions were withthird parties, i.e. at market prices applicable at the time of the transaction.Corporate costs were not allocated to the individual segments as they consist of general administrative expenses andhead office expenses that relate to the <strong>Swiss</strong> <strong>Life</strong> Group as a whole.The reportable segments have been identified based on the information about the components of the entity thatmanagement uses to make decisions about operating matters. The information that is provided to management isfocused on the category of product lines and services. The organisational and management structure within theinsurance business is based on geography. The reportable segments have therefore been identified as follows:– Insurance Switzerland– Insurance France– Insurance Germany– Insurance Other– Investment Management–AWD– Other– Insurance (Discontinued)– Banking (Discontinued)The insurance businesses primarily consist of life insurance operations. These operations offer a broad range of life,pension, annuity and investment-type policies to both groups and individuals, including accident, health anddisability coverage. The Group’s strategy focuses primarily on the life and pension business in a number of keyEuropean markets, such as Switzerland, France, Germany, Luxembourg and Liechtenstein. The insurance businessesalso include a number of companies which hold investments primarily pertaining to life insurance.Non-life operations consist of operations in France and Belgium and principally include property and casualty,liability and motor insurance.“Insurance Other” comprises the insurance operations in Liechtenstein and Luxembourg.
11First-Half Financial <strong>Report</strong> 2008Condensed Financial StatementsCondensed Notes to the Consolidated Financial Statements (unaudited)“Investment Management” refers to the management of assets for institutional clients and the Group’s insurancebusiness, as well as the provision of expert advice for such clients.“AWD” comprises the Hanover-based AWD Group which was acquired by the <strong>Swiss</strong> <strong>Life</strong> Group on 19 March 2008.The AWD Group specialises in financial advisory services for medium and high-income customer segments.“Other” refers principally to various finance and service companies.The insurance operations in the Netherlands and Belgium, which were disposed of on 29 April 2008, are presentedas a separate segment “Insurance (Discontinued)”.Banca del Gottardo, Lugano, was disposed of on 7 March 2008. For the purposes of segment reporting Banca delGottardo, Lugano, is presented as a separate segment “Banking (Discontinued)”.The statement of income and balance sheet for the segments are given on the pages below:
123 Segment Information (continued)Statement of income for the half-year ended 30 June 2008Insurance Insurance Insurance Insurance InvestmentIn CHF million Switzerland France Germany Other ManagementIncomePremiums earned on insurance contracts 5 635 2 025 855 40 –Premiums earned on investment contracts withdiscretionary participation 162 4 – – –Premiums ceded to reinsurers –7 –96 –37 –22 –Net earned premiums 5 790 1 933 818 18 –Policy fees earned on insurance contracts 5 21 – – –Policy fees earned on investment and unit-linkedcontracts 7 50 9 34 –Net earned policy fees 12 71 9 34 –Asset management and other commission income 24 18 14 0 131Investment income 1 576 373 434 14 3Net gains/losses on financial assets –2 173 –6 –91 0 0Net gains/losses on financial instruments at fair valuethrough profit or loss 1 185 –192 49 –1 –Net gains/losses on investment property 77 26 –4 0 –Other income 102 15 2 –2 1Total income 6 593 2 238 1 231 63 135of which inter-segment 64 –1 0 –4 85ExpensesBenefits and claims under insurance contracts –5 829 –1 584 –959 –22 –Benefits and claims under investment contractswith discretionary participation –160 –6 – – –Benefits and claims recovered from reinsurers 4 49 36 14 –Net insurance benefits and claims –5 985 –1 541 –923 –8 –Policyholder participation –74 75 –80 2 –Interest expense –76 –110 –9 –7 0Commission expense –103 –158 –51 –23 –20Employee benefits expense –159 –125 –52 –22 –46Depreciation and amortisation expense –5 –148 –62 –2 –1Impairment of property and equipment andintangible assets –2 – –2 – –Other expenses –69 –131 –33 –24 –20Total expenses –6 473 –2 138 –1 212 –84 –87of which inter-segment –88 –2 –17 –17 –13Segment result 120 100 19 –21 48of which inter-segment –24 –3 –17 –21 72Unallocated corporate costsProfit from operationsBorrowing costs –89 –5 –1 –5 –Share of results of associates 1 5 0 0 –Income tax expenseNet profit
13First-Half Financial <strong>Report</strong> 2008Condensed Financial StatementsCondensed Notes to the Consolidated Financial Statements (unaudited)Less:Insurance Banking discontinued ContinuingAWD Other (Discontinued) (Discontinued) Eliminations Total operations operations– – 782 – –11 9 326 –782 8 544– – – – – 166 – 166– – –7 – 11 –158 5 –153– – 775 – 0 9 334 –777 8 557– – 4 – – 30 –4 26– – 53 – – 153 –53 100– – 57 – – 183 –57 126253 5 15 35 –101 394 –44 3503 27 275 63 –31 2 737 –337 2 4000 4 9 –118 – –2 375 109 –2 2660 –1 27 28 – 1 095 –55 1 040– – 0 – – 99 0 997 –11 1 038 690 0 1 842 –1 730 112263 24 2 196 698 –132 13 309 –2 891 10 4182 –17 –2 5 –132– – –919 – 1 –9 312 919 –8 393– – – – – –166 – –166– – 2 – –3 102 –2 100– – –917 – –2 –9 376 917 –8 459– – 2 – –1 –76 –1 –770 0 –34 –49 10 –275 76 –199–122 –1 –24 –4 96 –410 25 –385–56 –2 –61 –30 –1 –554 91 –463–13 – –28 – – –259 28 –231–1 – 0 – – –5 0 –5–66 –5 –36 –20 7 –397 53 –344–258 –8 –1 098 –103 109 –11 352 1 189 –10 1630 40 –2 –10 1095 16 1 098 595 –23 1 957 –1 702 2552 23 –4 –5 –23–28 – –281 929 –1 702 227– –14 –2 –1 23 –94 1 –93– 2 1 – – 9 –1 8–207 217 101 637 –1 485 152
143 Segment Information (continued)Statement of income for the half-year ended 30 June 2007Insurance Insurance Insurance Insurance InvestmentIn CHF million Switzerland France Germany Other ManagementIncomePremiums earned on insurance contracts 5 797 1 662 940 24 –Premiums earned on investment contracts withdiscretionary participation 89 9 – – –Premiums ceded to reinsurers –5 –77 –38 –2 –Net earned premiums 5 881 1 594 902 22 –Policy fees earned on insurance contracts 6 28 – – –Policy fees earned on investment and unit-linkedcontracts 7 158 4 20 –Net earned policy fees 13 186 4 20 –Asset management and other commission income 31 20 18 – 126Investment income 1 514 698 407 15 1Net gains/losses on financial assets 484 88 173 1 –Net gains/losses on financial instruments at fair valuethrough profit or loss –322 241 46 1 –Net gains/losses on investment property 39 28 –1 0 –Other income –41 –10 13 –6 13Total income 7 599 2 845 1 562 53 140of which inter-segment 49 0 0 –2 84ExpensesBenefits and claims under insurance contracts –6 064 –1 153 –992 –10 –Benefits and claims under investment contractswith discretionary participation –96 –11 – – –Benefits and claims recovered from reinsurers 4 38 36 1 –Net insurance benefits and claims –6 156 –1 126 –956 –9 –Policyholder participation –616 –726 –341 –1 –Interest expense –66 –166 –9 –8 0Commission expense –106 –234 –46 –8 –22Employee benefits expense –173 –132 –51 –10 –41Depreciation and amortisation expense –64 –146 –58 –2 –1Impairment of property and equipment andintangible assets – – –1 – –Other expenses –74 –117 –43 –6 –29Total expenses –7 255 –2 647 –1 505 –44 –93of which inter-segment –65 –2 –12 –1 –26Segment result 344 198 57 9 47of which inter-segment –16 –2 –12 –3 58Unallocated corporate costsProfit from operationsBorrowing costs –72 –8 0 –3 –Share of results of associates 1 3 0 0 –Income tax expenseNet profit
15First-Half Financial <strong>Report</strong> 2008Condensed Financial StatementsCondensed Notes to the Consolidated Financial Statements (unaudited)Less:Insurance Banking discontinued ContinuingAWD Other (Discontinued) (Discontinued) Eliminations Total operations operations– – 1 077 – –9 9 491 –1 077 8 414– – – – – 98 – 98– – –11 – 9 –124 8 –116– – 1 066 – 0 9 465 –1 069 8 396– – 0 – – 34 0 34– – 75 – 0 264 –74 190– – 75 – 0 298 –74 224– 4 14 154 –107 260 –156 104– 32 438 195 –62 3 238 –632 2 606– – 67 101 – 914 –168 746– 3 11 56 0 36 –57 –21– – –2 – – 64 2 66– 9 0 –48 –13 –83 46 –37– 48 1 669 458 –182 14 192 –2 108 12 084– 32 –3 22 –182– – –1 305 – 1 –9 523 1 306 –8 217– – – – – –107 – –107– – 2 – –1 80 –2 78– – –1 303 – 0 –9 550 1 304 –8 246– – –28 – 0 –1 712 27 –1 685– 0 –48 –160 36 –421 173 –248– –2 –34 –19 90 –381 53 –328– 0 –78 –96 0 –581 174 –407– – –46 –5 – –322 51 –271– – – – – –1 – –1– –5 –45 –76 24 –371 115 –256– –7 –1 582 –356 150 –13 339 1 897 –11 442– –3 –3 –38 150– 41 87 102 –32 853 –211 642– 29 –6 –16 –32–32 – –32821 –211 610– –26 –2 –3 32 –82 1 –81– 4 – 2 – 10 –2 8–114 2 –112635 –210 425
163 Segment Information (continued)Balance sheet as at 30 June 2008Insurance Insurance InsuranceIn CHF million Switzerland France GermanyAssetsCash and cash equivalents 4 289 381 415Insurance receivables and other receivables 2 456 1 363 562Derivatives 818 41 211Assets held for sale 3 – 1Financial assets at fair value through profit or loss 2 355 7 355 792Financial assets available for sale 47 119 11 399 6 057Loans 7 823 246 11 570Financial assets held to maturity – 3 143 87Investment property 10 397 1 335 700Reinsurance assets 33 365 588Property and equipment 530 187 182Intangible assets including intangible insurance assets 1 361 553 1 638Other assets 612 19 –Segment assets 77 796 26 387 22 803Investments in associatesIncome tax assetsTotal assetsLiabilities and equityLiabilitiesInsurance payables and other payables 1 763 588 323Derivatives 155 28 66Liabilities associated with assets held for sale – – –Financial liabilities at fair value through profit or loss 1 169 435 320Investment contracts 1 085 11 395 –Deposits 1 797 648 970Insurance liabilities 62 903 11 239 19 119Policyholder participation liabilities 433 751 1 038Employee benefit liabilities 1 826 40 55Provisions 23 31 33Other liabilities 219 36 2Segment liabilities 71 373 25 191 21 926BorrowingsIncome tax liabilitiesEquityTotal liabilities and equity
17First-Half Financial <strong>Report</strong> 2008Condensed Financial StatementsCondensed Notes to the Consolidated Financial Statements (unaudited)Insurance Investment Insurance BankingOther Management AWD Other (Discontinued) (Discontinued) Eliminations Total1 971 49 161 1 226 – – 0 8 49268 215 212 136 – – –435 4 577145 – – – – – –21 1 194– – – – – – – 47 147 – 3 6 – – – 17 658662 31 – 4 – – – 65 2720 8 33 870 – – –1 514 19 036– 2 – – – – – 3 23226 – – – – – – 12 45814 – – – – – –9 9912 3 81 – – – – 985188 0 1 317 – – – – 5 0571 62 5 2 – – –113 58810 224 370 1 812 2 244 – – –2 092 139 544101191139 836116 60 284 77 7 – –428 2 790– – – 21 – – –21 249– – – – – – – –9 083 – – – – – – 11 007452 – – – – – – 12 9322 0 – – – – –11 3 406269 – – – – – –70 93 4608 – – – – – –2 2 2281 82 – – – – – 2 0041 6 0 1 – – – 950 1 145 53 12 – –46 4229 932 149 429 152 19 – –578 128 5933 2157427 286139 836
183 Segment Information (continued)Balance sheet as at 31 December 2007Insurance Insurance InsuranceIn CHF million Switzerland France GermanyAssetsCash and cash equivalents 2 378 142 273Insurance receivables and other receivables 2 107 1 340 746Derivatives 340 5 87Assets held for sale 4 – 1Financial assets at fair value through profit or loss 3 557 7 372 913Financial assets available for sale 49 754 11 450 6 387Loans 8 925 241 11 873Financial assets held to maturity – 3 529 93Investment property 10 171 1 334 720Reinsurance assets 31 367 584Property and equipment 564 194 101Intangible assets including intangible insurance assets 1 079 553 1 329Other assets 445 21 2Segment assets 79 355 26 548 23 109Investments in associatesIncome tax assetsTotal assetsLiabilities and equityLiabilitiesInsurance payables and other payables 2 585 516 341Derivatives 214 0 2Liabilities associated with assets held for sale – – –Financial liabilities at fair value through profit or loss 1 345 385 355Investment contracts 1 027 11 450 –Deposits 1 283 377 970Insurance liabilities 64 069 11 087 19 446Policyholder participation liabilities 815 1 120 1 442Employee benefit liabilities 1 815 38 53Provisions 32 38 38Other liabilities 52 22 2Segment liabilities 73 237 25 033 22 649BorrowingsIncome tax liabilitiesEquityTotal liabilities and equity
19First-Half Financial <strong>Report</strong> 2008Condensed Financial StatementsCondensed Notes to the Consolidated Financial Statements (unaudited)Insurance Investment Insurance BankingOther Management AWD Other (Discontinued) (Discontinued) Eliminations Total1 890 118 – 328 – – –574 4 55546 81 – 89 1 2 –260 4 15253 – – 2 – – –24 463– – – – 27 135 13 328 – 40 4687 559 – – 13 14 – –29 19 399670 31 – 296 – – – 68 5880 9 – 882 30 8 –1 316 20 652– 2 – – – – – 3 62427 – – – – – – 12 2521 – – – 4 – –12 9751 4 – – – – – 864190 0 – – – – – 3 1511 51 – 7 – 303 –407 42310 438 296 – 1 617 27 184 13 641 –2 622 179 56672119179 75769 43 – 30 15 2 –251 3 350– – – 21 – – –24 213– – – – 25 699 11 803 – 37 5029 357 – – – 14 – –29 11 427430 – – – – – – 12 9071 0 – – 3 604 –616 2 622255 – – – – – –365 94 49213 – – – – – –2 3 3881 73 – – – – – 1 9800 6 – 2 – – – 1160 0 – 44 0 0 –45 7510 126 122 – 97 25 731 12 409 –1 332 168 0723 6217307 334179 757
203 Segment Information (continued)Premiums and policy fees from external customersIn CHF million 2008 HY 2007 HY 2008 HY 2007 HYNet earned Net earned Policy fees Policy feespremiums premiums earned earned<strong>Life</strong>Individual life 2 634 2 317 174 291Group life 6 407 6 839 9 7Total life 9 041 9 156 183 298Non-lifeAccident and health 9 25 – –Property, casualty and other 284 284 – –Total non-life 293 309 – –Total 9 334 9 465 183 298
21First-Half Financial <strong>Report</strong> 2008Condensed Financial StatementsCondensed Notes to the Consolidated Financial Statements (unaudited)4 Contracts for the Account and Risk of the <strong>Swiss</strong> <strong>Life</strong> Group’s CustomersThe assets relating to certain life insurance and investment contracts are managed for the account and risk of the<strong>Swiss</strong> <strong>Life</strong> Group’s customers (separate account/unit-linked contracts, private placement life insurance). Theseassets are segregated and managed to meet specific investment objectives of the policyholders. These assets back theinsurance liabilities and the financial liabilities arising from these contracts. The fair values of the liabilities reflectthe fair values of the assets. Certain contracts with unit-linking features contain guaranteed minimum insurancebenefits. The liabilities relating to this part are included in the insurance liabilities.Assets for the account and risk of the <strong>Swiss</strong> <strong>Life</strong> Group’s customersIn CHF million 30.06.2008 31.12.2007Cash and cash equivalents 1 837 1 818Derivatives 149 60Financial assets at fair value through profit or lossDebt instruments 2 082 2 825Equity securities 1 408 1 794Investment fund units 6 902 7 028Other 1 547 2 049Total assets for the account and risk of the <strong>Swiss</strong> <strong>Life</strong> Group’s customers 13 925 15 574The financial result for the half-years ended 30 June for the account and risk of the <strong>Swiss</strong> <strong>Life</strong> Group and the<strong>Swiss</strong> <strong>Life</strong> Group’s customers was as follows:In CHF million 2008 HY 2007 HY 2008 HY 2007 HY 2008 HY 2007 HYFor the For theFor the For the account and account andaccount and account and risk of the risk of therisk of the risk of the <strong>Swiss</strong> <strong>Life</strong> <strong>Swiss</strong> <strong>Life</strong><strong>Swiss</strong> <strong>Life</strong> <strong>Swiss</strong> <strong>Life</strong> Group’s Group’sGroup Group customers customers Total TotalInvestment income 2 400 2 606 – – 2 400 2 606Net gains/losses on financial assets –2 266 746 – – –2 266 746Net gains/losses on financial instruments at fair value throughprofit or loss (FVPL) 974 –59 66 38 1 040 –21Net gains/losses on investment property 99 66 – – 99 66Share of results of associates 8 8 – – 8 8Financial result 1 215 3 367 66 38 1 281 3 405The financial result for the account and risk of the <strong>Swiss</strong> <strong>Life</strong> Group’scustomers consists ofnet gains/losses on financial assets at FVPL –1 119 912net gains/losses on financial liabilities at FVPL 1 185 –874
225 Premiums, Policy Fees and Deposits ReceivedWritten premiumsIn CHF million 2008 HY 2007 HYDirect 8 176 8 407Assumed 614 164Gross written premiums 8 790 8 571Ceded –152 –116Net written premiums 8 638 8 455Earned premiumsIn CHF million 2008 HY 2007 HYDirect 8 121 8 365Assumed 589 147Gross earned premiums 8 710 8 512Ceded –153 –116Net earned premiums 8 557 8 396Written policy feesIn CHF million 2008 HY 2007 HYDirect 128 225Assumed – –Gross written policy fees 128 225Ceded 0 –Net written policy fees 128 225Earned policy feesIn CHF million 2008 HY 2007 HYDirect 126 224Assumed – –Gross earned policy fees 126 224Ceded 0 –Net earned policy fees 126 224Under the accounting principles adopted, deposits received under insurance and investment contracts are notrecognised as income:In CHF million 2008 HY 2007 HYNet earned premiums 8 557 8 396Net earned policy fees 126 224Deposits received under insurance and investment contracts 1 970 3 469Net earned premiums, policy fees and deposits received 10 653 12 089Gross written premiums, policy fees and deposits received 10 888 12 265
23First-Half Financial <strong>Report</strong> 2008Condensed Financial StatementsCondensed Notes to the Consolidated Financial Statements (unaudited)6 Details of Certain Items in the Consolidated Statement of IncomeAsset management and other commission incomeIn CHF million 2008 HY 2007 HYFiduciary and portfolio management fees 48 52Brokerage commissions 253 2Fees earned on loans and deposits 1 0Other commissions and fees 48 50Total asset management and other commission income 350 104Investment incomeIn CHF million 2008 HY 2007 HYInterest income on financial assets held to maturity and available for sale 1 271 1 394Interest income on loans 414 442Other interest income 105 121Dividend income on financial assets available for sale 336 395Net income on investment property 274 254Total investment income 2 400 2 606Net gains/losses on financial assetsIn CHF million Notes 2008 HY 2007 HYSale offinancial assets held to maturity – –financial assets available for sale –300 133loans 15 0Net gains/losses from sales –285 133Impairment losses onfinancial assets held to maturity – –financial assets available for sale 9 –847 –3loans 10 3receivables –2 –1Impairment losses on financial assets –839 –1Foreign currency gains/losses –1 142 614Total net gains/losses on financial assets –2 266 746Net gains/losses on financial instruments at fair value through profit or lossIn CHF million 2008 HY 2007 HYNet gains/losses on derivatives and other financial instruments held for tradingInterest rate instruments 10 47Equity instruments 309 73Foreign currency and other instruments 1 015 –607Total net gains/losses on derivatives and other financial instruments held for trading 1 334 –487Net gains/losses on financial instruments designated as at fair value through profit or lossFinancial assets –1 495 1 391Financial liabilities 1 201 –925Total net gains/losses on financial instruments designated as at fair value through profit or loss –294 466Total net gains/losses on financial instruments at fair value through profit or loss 1 040 –21
246 Details of Certain Items in the Consolidated Statement of Income (continued)Other incomeIn CHF million 2008 HY 2007 HYRealised gains/losses on sales of subsidiaries and other assets 1 –3Other foreign currency gains/losses 80 –52Other 31 18Total other income 112 –37Net insurance benefits and claimsIn CHF million 2008 HY 2007 HYNet benefits and claims under insurance contracts<strong>Life</strong> benefits and claims 7 868 5 613Change in future life policyholder benefits 243 2 381Non-life claims 182 145Benefits and claims under investment contracts with discretionary participation<strong>Life</strong> benefits and claims 97 90Change in future life policyholder benefits 69 17Total net insurance benefits and claims 8 459 8 246Interest expenseIn CHF million 2008 HY 2007 HYInterest expense on deposits 24 20Interest expense on investment contracts 70 122Interest expense on deposits under insurance contracts 74 82Other interest expense 31 24Total interest expense 199 248Commission expenseIn CHF million 2008 HY 2007 HYInsurance agent and broker commissions 224 234Asset management and banking commissions 23 24Other commissions and fees 138 70Total commission expense 385 328Employee benefits expenseIn CHF million 2008 HY 2007 HYWages and salaries 303 264Social security 82 74Defined benefit plans 58 55Defined contribution plans 1 1Other employee benefits 33 40Total employee benefits expense 477 434
267 Income TaxesIncome tax expenseIn CHF million 2008 HY 2007 HYCurrent tax expenseCurrent tax of the current period 57 152Adjustments for current tax of prior periods –61 –3Total current tax expense –4 149Deferred tax expenseOrigination and reversal of temporary differences –6 –37Changes in tax rates – –Total deferred tax expense –6 –37Total income tax expense –10 112Due to an internal restructuring, the <strong>Swiss</strong> <strong>Life</strong> Group realised a tax benefit amounting to CHF 61 million.8 Financial Assets and Liabilities at Fair Value through Profit or LossIn CHF million Notes 30.06.2008 31.12.2007Designated as Designated asat fair value at fair valuethroughthroughprofit or loss profit or lossFinancial assets at fair value through profit or lossDebt securities 1 841 1 814Equity securities 435 874Investment fund units – debt 1 951 1 665Investment fund units – equity 1 206 1 051Investment fund units – mixed 37 30Private equity 16 –Hedge funds 229 267Assets for the account and risk of the <strong>Swiss</strong> <strong>Life</strong> Group’s customers 4 11 939 13 696Other 4 2Total financial assets at fair value through profit or loss 17 658 19 399Financial liabilities at fair value through profit or lossLiabilities for the account and risk of the <strong>Swiss</strong> <strong>Life</strong> Group’s customers 10 581 11 042Share of net assets of investment funds attributable to minority unitholders 426 385Total financial liabilities at fair value through profit or loss 11 007 11 427
27First-Half Financial <strong>Report</strong> 2008Condensed Financial StatementsCondensed Notes to the Consolidated Financial Statements (unaudited)9 Financial Assets Available for SaleIn CHF million 30.06.08 31.12.07 30.06.08 31.12.07 30.06.08 31.12.07Cost/ Cost/ Net Net Fair value Fair valueamortised amortised unrealised unrealised (carrying (carryingcost cost gains/losses gains/losses amount) amount)Debt securities 59 114 57 326 –4 370 –2 576 54 744 54 750Money market instruments and loans 61 21 – – 61 21Equity securities 3 709 6 123 –174 93 3 535 6 216Investment fund units – debt 136 157 –1 3 135 160Investment fund units – equity 1 581 1 418 –261 21 1 320 1 439Investment fund units – mixed 283 234 20 16 303 250Private equity 144 93 6 20 150 113Hedge funds 4 831 5 310 191 328 5 022 5 638Other 2 1 – 0 2 1Total financial assets available for sale 69 861 70 683 –4 589 –2 095 65 272 68 588Based on detailed assessments with regard to indications of impairment, impairment losses totalling CHF 847 millionwere recognised in the period under review (HY 2007: CHF 3 million). The impairment losses in the first halfof 2008 primarily related to equity securities and hedge funds (HY 2007: primarily equity securities).No held-to-maturity securities were transferred to the available-for-sale category and no available-for-sale securitieswere transferred to the held-to-maturity category in the period under review.
2810 LoansIn CHF million 30.06.08 31.12.07 30.06.08 31.12.07 30.06.08 31.12.07 30.06.08 31.12.07Allowance AllowanceforforGross Gross impairment impairment Carrying Carryingamount amount losses losses amount amount Fair value Fair valueMortgages 5 813 5 974 –36 –47 5 777 5 927 5 569 5 784Policy loans 605 671 – – 605 671 610 679Other originated loans 2 328 3 511 –7 –7 2 321 3 504 2 287 3 483Purchased loans 10 333 10 550 – – 10 333 10 550 10 012 10 462Repurchase agreements – 0 – – – 0 – 0Total loans 19 079 20 706 –43 –54 19 036 20 652 18 478 20 40811 Financial Assets Held to MaturityIn CHF million 30.06.08 31.12.07 30.06.08 31.12.07 30.06.08 31.12.07Cost/ Cost/amortised amortisedcost cost Net Net(carrying (carrying unrecognised unrecognisedamount) amount) gains/losses gains/losses Fair value Fair valueDebt securities 3 232 3 624 –127 –49 3 105 3 575Money market instruments – – – – – –Other – – – – – –Total financial assets held to maturity 3 232 3 624 –127 –49 3 105 3 575
29First-Half Financial <strong>Report</strong> 2008Condensed Financial StatementsCondensed Notes to the Consolidated Financial Statements (unaudited)12 Intangible Assets including Intangible Insurance AssetsIn CHF million 30.06.2008 31.12.2007Intangible insurance assets 2 814 2 644Other intangible assets 2 243 507Total intangible assets 5 057 3 151Intangible insurance assetsIn CHF million Notes 2008 HY 2007 YE 2008 HY 2007 YE 2008 HY 2007 YE 2008 HY 2007 YEPresent Presentvalue of value offuture futureprofits from profits fromacquired acquired Deferred Deferred Deferred Deferredinsurance insurance acquisition acquisition origination originationportfolios portfolios costs costs costs costs(PVP) (PVP) (DAC) (DAC) (DOC) (DOC) Total TotalBalance as at 1 January 24 17 2 612 2 526 8 246 2 644 2 789Additions – – 265 452 1 5 266 457Additions from business combinations – 8 – – – – – 8Amortisation 6 0 –1 –193 –388 –1 –2 –194 –391Impairment due to liability adequacy test – – –2 –1 – – –2 –1Effect of gains/losses recognised directly in equity 0 0 148 326 – – 148 326Changes from discontinued operations – – – 27 – –11 – 16Classification as assets held for sale andother disposals – – – –372 – –231 – –603Foreign currency translation differences –1 0 –47 42 0 1 –48 43Balance as at end of period 23 24 2 783 2 612 8 8 2 814 2 644PRESENT VALUE OF FUTURE PROFITS (PVP) | The present value of future profits relates to portfolios ofinsurance contracts and investment contracts with discretionary participation acquired in a business combinationor transfer of portfolios. These amounts, representing the present value of future profits amortised in proportionto gross profits over the effective life of the acquired insurance and investment contracts, primarily relate tocontracts acquired in Germany and France.On the acquisition of Meeschaert Assurances, Paris, in November 2007, present value of future profits amountingto CHF 8 million was recognised.DEFERRED ACQUISITION COSTS (DAC) | Certain acquisition costs relating to new and renewed insurancecontracts and investment contracts with discretionary participation features are deferred.DEFERRED ORIGINATION COSTS (DOC) | These costs are recoverable and are directly attributable to securinginvestment management contracts. They primarily relate to contracts in Luxembourg.Intangible insurance assets of CHF 600 million relating to the insurance operations in the Netherlands and Belgiumwere reclassified to assets held for sale in 2007.
3012 Intangible Assets including Intangible Insurance Assets (continued)Other intangible assetsIn CHF million Notes 2008 HY 2007 YE 2008 HY 2007 YE 2008 HY 2007 YE 2008 HY 2007 YECustomer Customerrelation- relation- Brands BrandsGoodwill Goodwill ships ships and other and other Total TotalCostBalance as at 1 January 599 1 430 60 18 134 175 793 1 623Additions – – – – 3 3 3 3Additions from business combinations 19 1 300 165 317 60 133 0 1 750 225Additions from internal development – – – – – 0 – 0Classification as assets held for sale andother disposals – –996 – –19 –1 –52 –1 –1 067Changes from discontinued operations – – – 0 – 3 – 3Foreign currency translation differences 0 – –1 1 –4 5 –5 6Balance as at end of period 1 899 599 376 60 265 134 2 540 793Accumulated amortisation and impairmentBalance as at 1 January –163 –738 –2 –11 –121 –156 –286 –905Amortisation recognised in income 6 – – –9 –4 –6 –7 –15 –11Impairment losses – – – – 0 – 0 –Classification as assets held for sale andother disposals – 575 – 16 1 48 1 639Changes from discontinued operations – – – –3 – –2 – –5Foreign currency translation differences – – –2 0 5 –4 3 –4Balance as at end of period –163 –163 –13 –2 –121 –121 –297 –286Total other intangible assets as at end of period 1 736 436 363 58 144 13 2 243 507GOODWILL | Goodwill represents the excess of the cost of an acquisition over the fair value of the Group’s shareof the identifiable assets, liabilities and contingent liabilities, if applicable, at the date of acquisition. Goodwill onacquisitions of subsidiaries is included in intangible assets. Goodwill on associates is included in the carryingamount of the investment.Goodwill totalling CHF 1300 million on the acquisition of AWD Holding AG, Hanover, was recognised in the periodunder review. The cost that led to the recognition of goodwill relates to the anticipated future business of AWD.Goodwill totalling CHF 149 million on the acquisition of CapitalLeben Versicherung AG, Schaan, was recognised in2007. The cost that led to the recognition of goodwill related to the anticipated future business of the Liechtensteinoperation. Goodwill on the acquisition of CapitalLeben Versicherung AG, Schaan, has been allocated to the segment“Insurance Other”.In 2007, goodwill amounting to CHF 16 million was recognised on the purchase of additional shares of Banca delGottardo Italia, Bergamo. The proportion of ownership interest increased by 19% to 90%.
31First-Half Financial <strong>Report</strong> 2008Condensed Financial StatementsCondensed Notes to the Consolidated Financial Statements (unaudited)12 Intangible Assets including Intangible Insurance Assets (continued)Goodwill relating to Lloyd Continental has been allocated to the segment “Insurance France”.The net carrying amount of goodwill totalling CHF 1736 million as at 30 June 2008 (YE 2007: CHF 436 million)relates to:In CHF million 30.06.08 31.12.07 30.06.08 31.12.07 30.06.08 31.12.07LloydLloydContinental Continental CapitalLeben CapitalLeben AWD AWDNet carrying amount of goodwill 287 287 149 149 1 300 –Impairment losses – – – – – –Goodwill amounting to CHF 421 million relating to Banca del Gottardo (including CHF 16 million relating to thepurchase of additional shares of Banca del Gottardo Italia, Bergamo) has been reclassified to assets held for sale in2007.CUSTOMER RELATIONSHIPS | The acquisition of AWD Holding AG, Hanover, led to the recognition of acustomer relationship asset of CHF 312 million. The acquisition of Placement Direct, France, led to a customerrelationship asset amounting to CHF 5 million.On the acquisition of CapitalLeben Versicherung AG, Schaan, a customer relationship asset of CHF 33 million wasrecognised in 2007. In August 2007, the <strong>Swiss</strong> <strong>Life</strong> Group acquired the banking activities of Fideuram Wargny,France, which led to the recognition of a customer relationship asset of CHF 12 million. In November 2007,Meeschaert Assurances, Paris, was acquired and a customer relationship asset amounting to CHF 15 million wasrecognised.BRANDS AND OTHER | Consist of brands, trademarks, computer software and other intangible assets.The acquisition of AWD Holding AG, Hanover, led to the recognition of the brand name of “AWD” of CHF 120 millionand computer software of CHF 13 million.
3213 Investment ContractsIn CHF million 30.06.2008 31.12.2007Investment contracts with discretionary participation with deposit accounting 11 393 11 414Investment contracts with discretionary participation with actuarial valuation 808 743Investment contracts without discretionary participation at amortised cost 427 440Investment contracts without discretionary participation at fair value through profit or loss 304 310Total investment contracts 12 932 12 907of which for the account and risk of the <strong>Swiss</strong> <strong>Life</strong> Group’s customers 3 318 3 567For contracts that do not have significant insurance risk but contain discretionary participation features, the<strong>Swiss</strong> <strong>Life</strong> Group primarily bases its accounting policies on the requirements of the Generally Accepted AccountingPrinciples in the United States (US GAAP).For investment-type contracts, savings premiums collected are reported as deposits (deposit accounting). Theseamounts primarily relate to contracts issued in France and Luxembourg.For traditional contracts in the life insurance business, future life policy benefit liabilities are determined by usingthe net-level-premium method on the basis of actuarial assumptions as to mortality, persistency, expenses andinvestment return, including a margin for adverse deviation. For participating contracts where the contributionprinciple applies to the allocation of the policyholder bonus, future life policy benefit liabilities are determined byusing the net-level-premium method on the basis of appropriate mortality and interest rate assumptions.These amounts primarily relate to contracts issued in Switzerland and France.Certain contracts that do not contain significant insurance risk and do not have discretionary participation featuresare carried at amortised cost.
33First-Half Financial <strong>Report</strong> 2008Condensed Financial StatementsCondensed Notes to the Consolidated Financial Statements (unaudited)14 BorrowingsIn CHF million Notes 30.06.2008 31.12.2007Money market instruments 28 37Hybrid debt 18 2 857 2 936Convertible debt 61 63Other debentures 183 494Bank loans 85 86Finance lease obligations 1 5Total borrowings 3 215 3 621HYBRID DEBT | On 12 April 2007, EUR 700 million in 5.849% guaranteed subordinated perpetual fixed to floatingrate notes were issued by <strong>Swiss</strong> <strong>Life</strong> Insurance and Pension Company.CONVERTIBLE DEBT | On 10 June 2004, <strong>Swiss</strong> <strong>Life</strong> Holding Ltd issued CHF 317 million in 0.625% convertiblebonds due in 2010. The bonds may be converted into registered shares of <strong>Swiss</strong> <strong>Life</strong> Holding Ltd at the option of theholder. Bondholders exercising their conversion right are entitled to receive the number of shares equal to the principalamount of CHF 1000 divided by the original conversion price of CHF 209.625 (subject to adjustments, witheffect from 29 July 2008 conversion price of CHF 200.20).<strong>Swiss</strong> <strong>Life</strong> Holding Ltd has the option to redeem all outstanding bonds at their principal amount (together withunpaid accrued interest) on or after 25 June 2007, provided that the closing price of the <strong>Swiss</strong> <strong>Life</strong> Holding sharewas at least 130% of the conversion price for 20 consecutive trading days. The early redemption at the option of<strong>Swiss</strong> <strong>Life</strong> Holding Ltd is subject to a period of 30 days’ notice to the bondholders.In the first half of 2008, convertible bonds were converted into 14 472 <strong>Swiss</strong> <strong>Life</strong> Holding shares (2007:1 184 170 <strong>Swiss</strong> <strong>Life</strong> Holding shares) with a corresponding increase in share capital totalling CHF 0.4 million(2007: CHF 49 million) and an increase in share premium totalling CHF 2.2 million (2007: CHF 173 million).OTHER DEBENTURES | On 30 June 2008, EUR 300 million in 4.375% bonds matured and were repaid.
3415 Insurance Liabilities and Reinsurance AssetsIn CHF million 30.06.08 31.12.07 30.06.08 31.12.07 30.06.08 31.12.07Reinsurance ReinsuranceGross Gross assets assets Net NetClaims under non-life insurance contracts 1 264 1 284 222 230 1 042 1 054Claims under life insurance contracts 6 680 7 155 130 119 6 550 7 036Unearned premiums 252 169 1 2 251 167Future life policyholder benefits 80 573 80 846 638 624 79 935 80 222Deposits under insurance contracts 4 691 5 038 – – 4 691 5 038Total insurance liabilities and reinsurance assets 93 460 94 492 991 975 92 469 93 517of which for the account and risk of the <strong>Swiss</strong> <strong>Life</strong> Group’s customersFuture life policyholder benefits 196 924 – – 196 924Deposits under insurance contracts 8 7 – – 8 7CLAIMS UNDER NON-LIFE INSURANCE CONTRACTS | Claims under non-life insurance contracts represent theliability needed to provide for the estimated ultimate cost of settling claims relating to insured events that haveoccurred on or before the financial reporting date. The estimated liability includes the amount that will be requiredfor future payments on both claims that have been reported to the insurer and claims relating to insured events thathave occurred but have not been reported to the insurer as at the date the liability is estimated. Loss developmenttables are generally used to make these estimates.CLAIMS UNDER LIFE INSURANCE CONTRACTS | Represents the liability for unpaid portions of claims incurred.It includes an estimate of the liability for claims incurred but not reported (IBNR). The measurement at reportingdate is a best estimate of ultimate future claim payments (such as disability annuities).UNEARNED PREMIUMS | Represents the portion of the premiums written relating to the unexpired terms ofcoverage.FUTURE LIFE POLICYHOLDER BENEFITS | For participating contracts where the contribution principle appliesto the allocation of the policyholder bonus, future life policy benefit liabilities are determined by using the net-levelpremiummethod on the basis of appropriate mortality and interest rate assumptions.The valuation of other long-duration contracts is also based on the net-level-premium method with actuarialassumptions as to mortality, persistency, expenses and investment returns, including provisions for adversedeviation.INSURANCE LIABILITIES FOR WHICH DEPOSIT ACCOUNTING IS USED | For investment-type contracts withsignificant insurance risk, savings premiums collected are reported as deposits (deposit accounting).
35First-Half Financial <strong>Report</strong> 2008Condensed Financial StatementsCondensed Notes to the Consolidated Financial Statements (unaudited)16 Employee BenefitsAmounts recognised in the consolidated balance sheetIn CHF million 30.06.2008 31.12.2007Present value of wholly and partly funded obligations –2 218 –2 242Fair value of plan assets 375 371Present value of unfunded obligations –85 –78Unrecognised actuarial gains (–)/losses (+) 99 138Net defined benefit asset (+)/liability (–) –1 829 –1 811The net defined benefit asset/liability consists ofgross defined benefit liabilities –1 992 –1 969gross defined benefit assets 163 158Employee benefit liabilities consist ofgross defined benefit liabilities –1 992 –1 969other employee benefit liabilities –12 –11Total employee benefit liabilities –2 004 –1 980
3617 EquityNumber of sharesNumber of shares 2008 HY 2007 YEShares issuedBalance as at 1 January 34 960 439 33 776 269Conversion of convertible debt 14 472 1 184 170Balance as at end of period 34 974 911 34 960 439Treasury sharesBalance as at 1 January 2 153 802 335 517Purchases of treasury shares 983 536 4 233 778Sales of treasury shares –575 434 –2 415 493Disposals of subsidiaries –41 246 –Balance as at end of period 2 520 658 2 153 802In the period under review, convertible bonds were converted into 14 472 SLH shares (2007: 1 184 170 SLH shares)with a corresponding increase in share capital totalling CHF 0.4 million (2007: CHF 49 million) and an increase inshare premium totalling CHF 2.2 million (2007: CHF 173 million).903 500 SLH shares were repurchased for CHF 261 million under the share buyback programme in the period underreview.18 Core CapitalIn CHF million Notes 30.06.2008 31.12.2007Equity 7 286 7 334Hybrid capital instruments 14 2 857 2 936Deferred Group-related funds 363 1 324Total core capital 10 506 11 594The Group’s capital performs several important functions, such as funding future growth and providing a protectivecushion for shareholders and policyholders, as well as hedging future risks. The defined Group core capitalincludes equity, certain liabilities with equity characteristics (hybrid capital instruments) and deferred Grouprelatedfunds (theoretical policyholder participation in surplus under consideration of additional DAC amortisationand deferred taxes).
37First-Half Financial <strong>Report</strong> 2008Condensed Financial StatementsCondensed Notes to the Consolidated Financial Statements (unaudited)19 Acquisitions and Disposals of SubsidiariesAssets and liabilities from acquisitionsIn CHF million Notes 2008 HY 2008 HY 2007 HY 2007 HYCarrying amountCarrying amountin accordancein accordancewith IFRS beforewith IFRS beforeFair value combination Fair value combinationCash and cash equivalents 287 287 49 49Insurance receivables and other receivables 191 191 60 60Financial assets at fair value through profit or loss – – 4 324 4 324Other financial assets 36 36 – –Property and equipment 81 81 0 0Customer relationships and other intangible assets 445 13 33 0Other assets 16 16 – –Insurance payables and other payables –343 –343 – –Financial liabilities at fair value through profit or loss – – –4 332 –4 332Insurance liabilities – – –23 –23Provisions 0 0 –1 –1Deferred income tax liabilities –123 –3 –5 0Other liabilities –166 –166 –34 –34Net identifiable assets acquired 424 112 71 43Cash used for acquisitions 1 516 220Direct costs relating to the acquisitions 12 0Non-cash consideration 182 –Total purchase consideration 1 710 220Net identifiable assets acquired –424 –71Minority interest 14 –Goodwill 12 1 300 149Consideration paid in cash –1 528 –220Cash and cash equivalents acquired 287 49Net cash outflow from acquisitions –1 241 1 –1711 of which paid in 2007: CHF 264 millionOn 19 March 2008, 96.7% of the AWD Holding shares (including 10.46% shares under option) were acquired by the<strong>Swiss</strong> <strong>Life</strong> Group. The AWD Group specialises in independent financial advisory services and is one of Europe’s topfinancial services providers for the medium and high-income customer segments. The acquisition cost amounted toCHF 1710 million.On 27 March 2007, the <strong>Swiss</strong> <strong>Life</strong> Group acquired CapitalLeben Versicherung AG, Schaan, a company headquarteredin Liechtenstein, which specialises in structured life insurance solutions. Regulatory approval was obtained on thesame date.
3819 Acquisitions and Disposals of Subsidiaries (continued)Assets and liabilities from disposalsIn CHF million2008 HYInsuranceBanking(Discontinued) (Discontinued) TotalCash and cash equivalents 1 050 3 332 4 382Derivatives (assets) 78 547 625Financial assets at fair value through profit or loss 3 957 2 551 6 508Financial assets available for sale 19 721 683 20 404Loans and receivables 1 359 5 949 7 308Financial assets held to maturity 111 41 152Investment property 210 – 210Investments in associates 0 9 9Reinsurance assets 47 – 47Property and equipment 101 138 239Intangible assets including intangible insurance assets 577 424 1 001Other assets 46 331 377Insurance payables and other payables –1 261 –119 –1 380Derivatives (liabilities) –2 –720 –722Financial liabilities at fair value through profit or loss –245 –438 –683Investment contracts and other financial liabilities –2 613 –11 217 –13 830Insurance liabilities –20 789 – –20 789Policyholder participation liabilities –427 – –427Employee benefit liabilities –304 –307 –611Provisions –6 –34 –40Other liabilities –345 –55 –400Net assets disposed of 1 265 1 115 2 380Cash received from disposals 2 446 1 773 4 219Direct costs relating to the disposals –58 –49 –107Total disposal consideration 2 388 1 724 4 112Transfer to financial assets at fair value through profit or loss 16 – 16Net assets disposed of –1 265 –1 115 –2 380Foreign currency translation differences 12 –5 7Gains/losses recognised directly in equity –131 –8 –139Treasury shares – –12 –12Minority interest 14 7 21Gain (+)/loss (–) on disposals 1 034 591 1 625On 29 April 2008, the <strong>Swiss</strong> <strong>Life</strong> Group sold the Dutch and Belgian businesses. The disposal considerationamounted to CHF 2388 million. The gain realised on the sale was CHF 1034 million. For the purposes of segmentreporting the Dutch and Belgian businesses have been presented as a separate segment “Insurance (Discontinued)”.On 7 March 2008, Banca del Gottardo was disposed of for a total consideration of CHF 1724 million. The gainrealised on the sale amounted to CHF 591 million. Banca del Gottardo has been presented as a separate segment“Banking (Discontinued)”.
39First-Half Financial <strong>Report</strong> 2008Condensed Financial StatementsCondensed Notes to the Consolidated Financial Statements (unaudited)19 Acquisitions and Disposals of Subsidiaries (continued)Results from discontinued operationsIn CHF million 2008 HY 2007 HY 2008 HY 2007 HY 2008 HY 2007 HYInsurance Insurance Banking Banking(Discontinued) (Discontinued) (Discontinued) (Discontinued) Total TotalIncome 1 164 1 672 103 438 1 267 2 110Expenses –1 095 –1 577 –95 –321 –1 190 –1 898Gain/loss on remeasurement to fair value less costs to sell – – – – – –Gain/loss on disposal of operations 1 034 – 591 – 1 625 –Profit before income tax 1 103 95 599 117 1 702 212Income tax expense on profit from ordinary activitiesfrom discontinued operations –62 20 –3 –22 –65 –2Income tax expense on the gain/loss on remeasurementto fair value less costs to sell/disposal of operations –150 – –2 – –152 –Net profit from discontinued operations 891 115 594 95 1 485 210
4020 Assets under ManagementIn CHF million 30.06.2008 31.12.2007On-balance-sheet assetsCash and cash equivalents 8 492 4 555Derivatives 1 194 463Financial assets at fair value through profit or loss 17 658 19 399Debt securities available for sale 54 744 54 750Money market instruments and loans available for sale 61 21Equity securities available for sale 3 535 6 216Investment funds available for sale 1 758 1 849Private equity available for sale 150 113Hedge funds available for sale 5 022 5 638Other financial assets available for sale 2 1Loans 19 036 20 652Financial assets held to maturity 3 232 3 624Investment property 12 458 12 252Investments in associates 101 72Total on-balance-sheet assets 127 443 129 605Fair value adjustments of assets reported at amortised costFinancial assets held to maturity –127 –49Loans –558 –244Third-party off-balance-sheet assets 10 611 9 634Total assets under control 137 369 138 946Minus externally managed on-balance-sheet assetsAssets under unit-linked/private placement life insurance business –9 418 –9 991Externally managed alternative investments –5 469 –6 107Externally managed other assets –867 –1 681Total assets under management 121 615 121 167Assets under control are taken to comprise:– assets stated as investments in the balance sheet and cash and cash equivalents– assets included in the balance sheet for the account and risk of the <strong>Swiss</strong> <strong>Life</strong> Group’s customers(separate account/unit-linked investments, private placement life insurance)– assets managed for third parties by the GroupFor the purposes of determining assets under management, assets managed by third parties and alternative investmentsmanaged by third parties have been deducted from assets under control.
41First-Half Financial <strong>Report</strong> 2008Condensed Financial StatementsCondensed Notes to the Consolidated Financial Statements (unaudited)21 Events after the Balance Sheet DateOn 25 July 2008, the <strong>Swiss</strong> <strong>Life</strong> Group entered into a contractual agreement for a syndicated credit facility totallingEUR 500 million with an international banking consortium.On 14 August 2008, the <strong>Swiss</strong> <strong>Life</strong> Group announced the exercise of the option to purchase additional AWD shares(10.46% owned by Carsten Maschmeyer). These shares were accounted for as an anticipated acquisition of the underlyingminority interest.On 14 August 2008, the <strong>Swiss</strong> <strong>Life</strong> Group announced the acquisition of a significant stake in MLP.22 Significant Changes in the Scope of ConsolidationMethod ofAuthorisedConsolidation consoli- share capitalSegment 1 period Group share Direct share dation Currency in 1000AcquisitionAWD Holding AG, Hannover AWD from 19.03.2008 96.7% 96.7% full EUR 38 639DisposalsBanca del Gottardo, Lugano Bank. Dis. until 07.03.2008 – – full<strong>Swiss</strong> <strong>Life</strong> Belgium SA, Bruxelles Ins. Dis. until 29.04.2008 – – fullZwitserleven, Amstelveen(branch <strong>Swiss</strong> <strong>Life</strong>/Rentenanstalt) Ins. Dis. until 29.04.2008 – – full1 Segment (Bank. Dis. = Banking (Discontinued), Ins. Dis. = Insurance (Discontinued))