Executive Report - The Pittsburgh Downtown Partnership
Executive Report - The Pittsburgh Downtown Partnership
Executive Report - The Pittsburgh Downtown Partnership

Create successful ePaper yourself
Turn your PDF publications into a flip-book with our unique Google optimized e-Paper software.
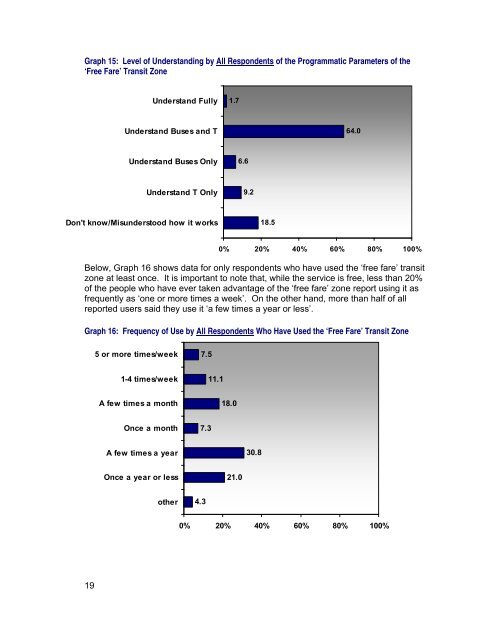
Graph 15: Level of Understanding by All Respondents of the Programmatic Parameters of the‘Free Fare’ Transit ZoneUnderstand Fully1.7Understand Buses and T64.0Understand Buses Only6.6n=1,0Understand T Only9.2Don't know/Misunderstood how it works18.50% 20% 40% 60% 80% 100%Below, Graph 16 shows data for only respondents who have used the ‘free fare’ transitzone at least once. It is important to note that, while the service is free, less than 20%of the people who have ever taken advantage of the ‘free fare’ zone report using it asfrequently as ‘one or more times a week’. On the other hand, more than half of allreported users said they use it ‘a few times a year or less’.Graph 16: Frequency of Use by All Respondents Who Have Used the ‘Free Fare’ Transit Zone5 or more times/week7.51-4 times/week11.1A few times a month18.0Once a month7.3A few times a year30.8Once a year or less21.0other4.30% 20% 40% 60% 80% 100%19