Lab 1: The metric system â measurement of length and weight
Lab 1: The metric system â measurement of length and weight
Lab 1: The metric system â measurement of length and weight
You also want an ePaper? Increase the reach of your titles
YUMPU automatically turns print PDFs into web optimized ePapers that Google loves.
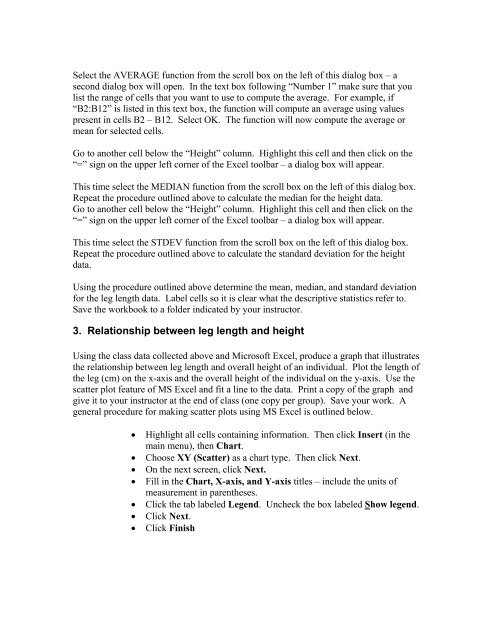
Select the AVERAGE function from the scroll box on the left <strong>of</strong> this dialog box – asecond dialog box will open. In the text box following “Number 1” make sure that youlist the range <strong>of</strong> cells that you want to use to compute the average. For example, if“B2:B12” is listed in this text box, the function will compute an average using valuespresent in cells B2 – B12. Select OK. <strong>The</strong> function will now compute the average ormean for selected cells.Go to another cell below the “Height” column. Highlight this cell <strong>and</strong> then click on the“=” sign on the upper left corner <strong>of</strong> the Excel toolbar – a dialog box will appear.This time select the MEDIAN function from the scroll box on the left <strong>of</strong> this dialog box.Repeat the procedure outlined above to calculate the median for the height data.Go to another cell below the “Height” column. Highlight this cell <strong>and</strong> then click on the“=” sign on the upper left corner <strong>of</strong> the Excel toolbar – a dialog box will appear.This time select the STDEV function from the scroll box on the left <strong>of</strong> this dialog box.Repeat the procedure outlined above to calculate the st<strong>and</strong>ard deviation for the heightdata.Using the procedure outlined above determine the mean, median, <strong>and</strong> st<strong>and</strong>ard deviationfor the leg <strong>length</strong> data. <strong>Lab</strong>el cells so it is clear what the descriptive statistics refer to.Save the workbook to a folder indicated by your instructor.3. Relationship between leg <strong>length</strong> <strong>and</strong> heightUsing the class data collected above <strong>and</strong> Micros<strong>of</strong>t Excel, produce a graph that illustratesthe relationship between leg <strong>length</strong> <strong>and</strong> overall height <strong>of</strong> an individual. Plot the <strong>length</strong> <strong>of</strong>the leg (cm) on the x-axis <strong>and</strong> the overall height <strong>of</strong> the individual on the y-axis. Use thescatter plot feature <strong>of</strong> MS Excel <strong>and</strong> fit a line to the data. Print a copy <strong>of</strong> the graph <strong>and</strong>give it to your instructor at the end <strong>of</strong> class (one copy per group). Save your work. Ageneral procedure for making scatter plots using MS Excel is outlined below.• Highlight all cells containing information. <strong>The</strong>n click Insert (in themain menu), then Chart.• Choose XY (Scatter) as a chart type. <strong>The</strong>n click Next.• On the next screen, click Next.• Fill in the Chart, X-axis, <strong>and</strong> Y-axis titles – include the units <strong>of</strong><strong>measurement</strong> in parentheses.• Click the tab labeled Legend. Uncheck the box labeled Show legend.• Click Next.• Click Finish


